 Jennifer B. Permuth
 Shraddha Vyas2
 Jiannong Li
- 1Department of Gastrointestinal Oncology, H. Lee Moffitt Cancer Center & Research Institute, Tampa, FL, United States
- 2Department of Cancer Epidemiology, H. Lee Moffitt Cancer Center & Research Institute, Tampa, FL, United States
- 3Department of Biostatistics and Bioinformatics, H. Lee Moffitt Cancer Center & Research Institute, Tampa, FL, United States
- 4Department of Diagnostic Imaging and Interventional Radiology, H. Lee Moffitt Cancer Center & Research Institute, Tampa, FL, United States
Background: Significant racial disparities in pancreatic cancer incidence and mortality rates exist, with the highest rates in African Americans compared to Non-Hispanic Whites and Hispanic/Latinx populations. Computer-derived quantitative imaging or “radiomic” features may serve as non-invasive surrogates for underlying biological factors and heterogeneity that characterize pancreatic tumors from African Americans, yet studies are lacking in this area. The objective of this pilot study was to determine if the radiomic tumor profile extracted from pretreatment computed tomography (CT) images differs between African Americans, Non-Hispanic Whites, and Hispanic/Latinx with pancreatic cancer.
Methods: We evaluated a retrospective cohort of 71 pancreatic cancer cases (23 African American, 33 Non-Hispanic White, and 15 Hispanic/Latinx) who underwent pretreatment CT imaging at Moffitt Cancer Center and Research Institute. Whole lesion semi-automated segmentation was performed on each slice of the lesion on all pretreatment venous phase CT exams using Healthmyne Software (Healthmyne, Madison, WI, USA) to generate a volume of interest. To reduce feature dimensionality, 135 highly relevant non-texture and texture features were extracted from each segmented lesion and analyzed for each volume of interest.
Results: Thirty features were identified and significantly associated with race/ethnicity based on Kruskal-Wallis test. Ten of the radiomic features were highly associated with race/ethnicity independent of tumor grade, including sphericity, volumetric mean Hounsfield units (HU), minimum HU, coefficient of variation HU, four gray level texture features, and two wavelet texture features. A radiomic signature summarized by the first principal component partially differentiated African American from non-African American tumors (area underneath the curve = 0.80). Poorer survival among African Americans compared to Non-African Americans was observed for tumors with lower volumetric mean CT [HR: 3.90 (95% CI:1.19–12.78), p=0.024], lower GLCM Avg Column Mean [HR:4.75 (95% CI: 1.44,15.37), p=0.010], and higher GLCM Cluster Tendency [HR:3.36 (95% CI: 1.06–10.68), p=0.040], and associations persisted in volumetric mean CT and GLCM Avg Column after adjustment for key clinicopathologic factors.
Conclusions: This pilot study identified several textural radiomics features associated with poor overall survival among African Americans with PDAC, independent of other prognostic factors such as grade. Our findings suggest that CT radiomic features may serve as surrogates for underlying biological factors and add value in predicting clinical outcomes when integrated with other parameters in ongoing and future studies of cancer health disparities.
Introduction
Pancreatic cancer is the deadliest malignancy in the United States, with a 5-year relative survival rate of only 10% (1). Due to the lack of effective strategies for prevention, early detection, and treatment, pancreatic cancer is projected to become the second leading cancer killer by 2030 (2). Coinciding with the rise in pancreatic cancer diagnoses and deaths is a notable health disparity, with African Americans/Blacks having significantly higher pancreatic cancer incidence and mortality rates than Non-Hispanic Whites and Hispanic/Latinx (2–12). Biological reasons for these disparities are underexplored and often rely on biomarkers from tissue biopsies, which may not be representative of the entire tumor and its microenvironment. Easily accessible minimally invasive methods that can reflect tumor heterogeneity and correlate with clinical outcomes are urgently needed to advance personalized care for the racially and ethnically diverse population of patients diagnosed with pancreatic cancer each year.
Computed tomography (CT) images are routinely obtained as part of the diagnostic work-up for pancreatic cancer and can be repurposed to support quantitative imaging analyses (13). Radiomics refers to high-throughput extraction and analysis of quantitative features from standard-of-care medical images, many of which are “invisible to the human eye,” to generate mineable data (14). Whereas standard “semantic” radiologic features are typically subjectively and qualitatively measured, computer algorithm-generated radiomic features such as tumor signal intensity, texture, shape, and volume have many advantages (15–21): they represent quantitative, objective measures; reflect tumor heterogeneity and subregional habitats; and are reproducible, stable, and strongly linked to clinical outcomes and underlying molecular data. Radiomic evaluations of pancreas CT scans have been conducted by our team (22–24) and others (15, 25–38), but to date none of these studies have focused on evaluating radiomic features present in pancreatic tumors from AA compared to other ethnic populations. Furthermore, we are unaware of published investigations that specifically compare racial and ethnic differences in radiomic features of different types of non-pancreas tumors. The objective of this study was to compare pretreatment CT radiomic features from a racially and ethnically diverse cohort of cases with pancreatic ductal adenocarcinoma (PDAC), the main histologic subtype of exocrine pancreatic cancers. The implications of this body of work could be far-reaching if radiomic features suggestive of a poor prognosis are identified in the pretreatment setting, in turn influencing clinical decision-making so that more aggressive treatments could be administered earlier to reduce disparities in historically underserved groups.
Methods
Study Population
This retrospective cohort was derived from a radiological records database search of individuals with available pretreatment multiphase CT scans and a corresponding histologic diagnosis of PDAC. Cases were diagnosed and treated for PDAC at Moffitt Cancer Center and Research Institute (Tampa, Florida) between 1/2008 and 8/2018. Subjects were excluded if postcontrast venous phase CT imaging was not available or if pathology reports were not available. Race and ethnicity and other covariates were based on self-report. The final analytic dataset included CT images from 71 unique patients (Table 1). Ethics approval and written consent to participate were reviewed and approved by Advarra IRB (MCC# 19431; IRB #:Pro00024543).
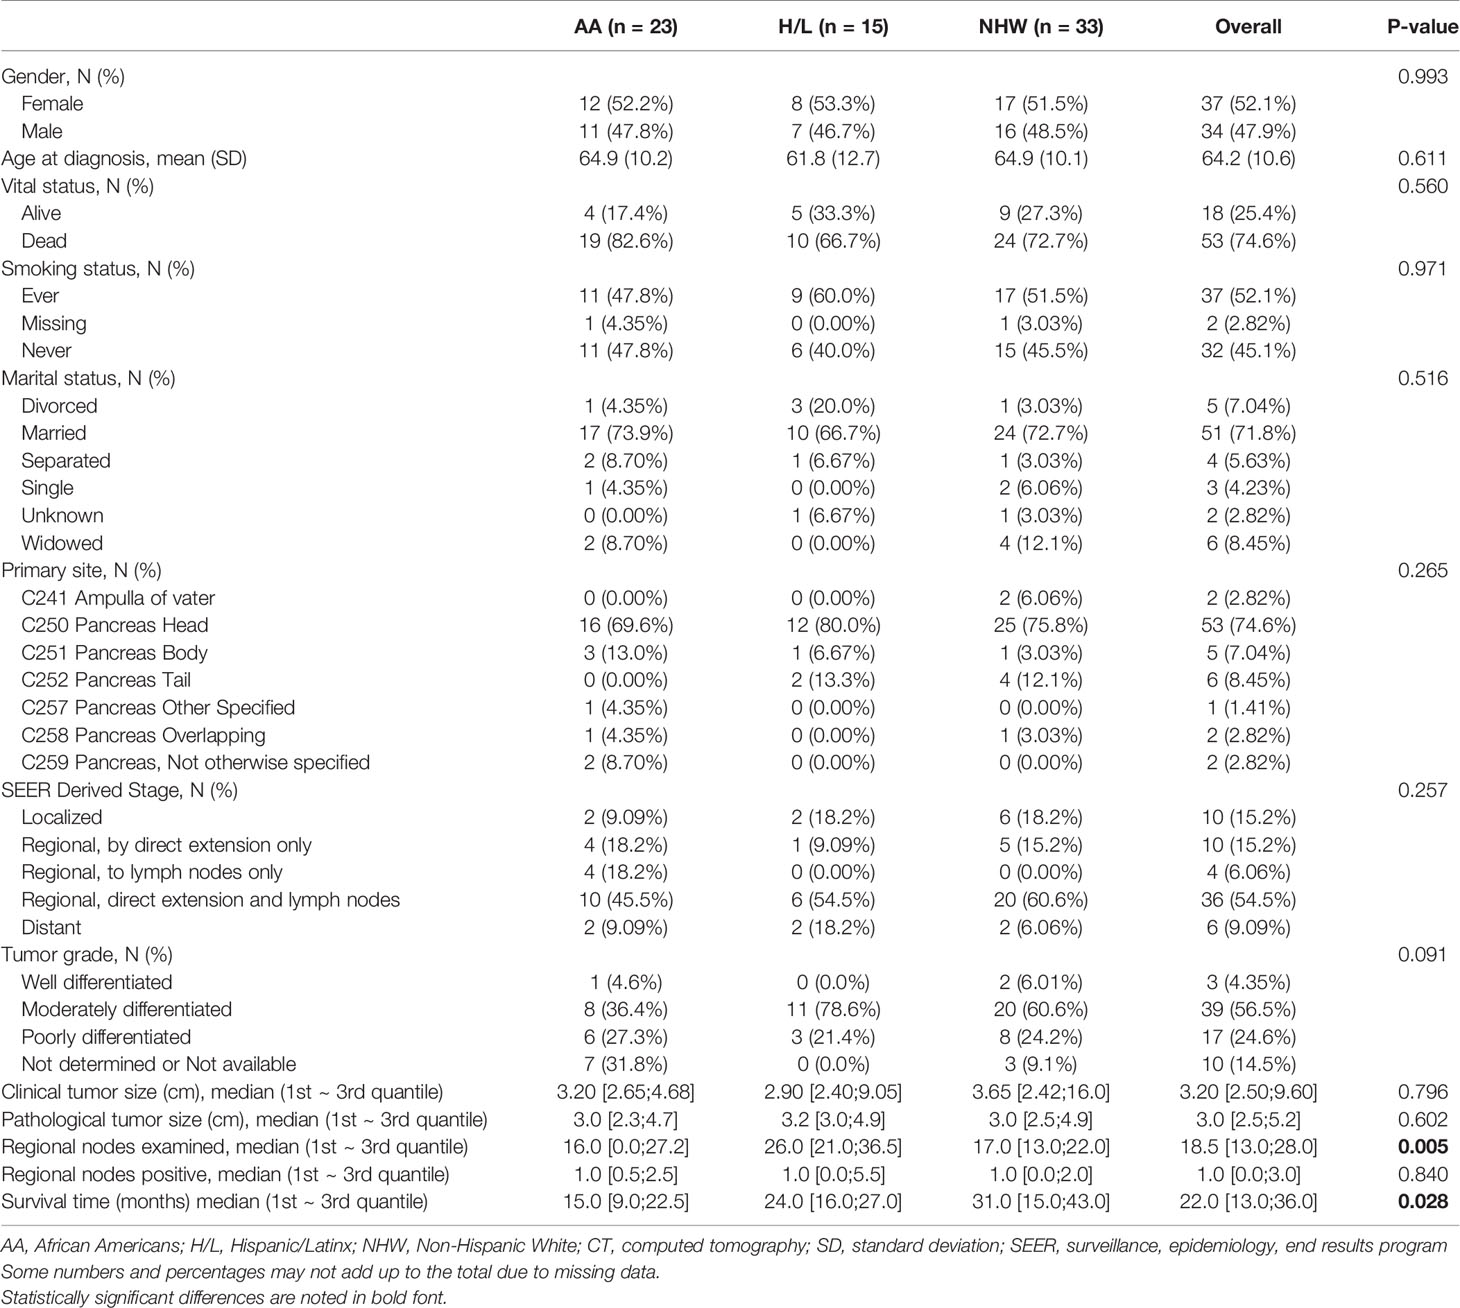
Table 1 Select demographic and clinical characteristics of the pancreatic ductal adenocarcinoma CT radiomic study cohort (N=71).
CT Scanner Types, Acquisitions, and Procedures
CT exams were performed on different scanners as represented in Table 2, with most scans being performed on a Siemens Sensation 16 (n=31, 43.6%) (Siemens Healthcare, Erlangen, Germany). The post contrast venous phase series was used in this study due to the homogenous availability of this series within our cohort and the superior ability to visualize and segment tumors. The venous phase was generally acquired following weight-based Iopamidol 76% (Bracco Diagnostics Inc., Monroe Township, NJ, USA) dosing to achieve venous phase approximately 60 s post injection. Contrast dosing generally ranged from 75 ml for patients below 55 kg, to 150 ml for patients above 110 kg with gradient increases every 5 kg. Field of view (FOV) ranged from 299 to 500 mm × 299–500 mm based on patient size. The matrix was 512 × 512 for each exam. Slice thickness was 3.0 ± 0.3 mm. Mean venous phase voxel volumes were 1.61, 1.71, and 1.65 mm3, for AA, H/L, and NHW, respectively (Table 2). At our institution, arterial phase bolus triggering is achieved via placement of the contrast tracking region of interest (ROI) over the abdominal aortic lumen at the level of the celiac trunk, with image acquisition triggered at a measured Hounsfield Unit density of 120, and venous phase ensues after a 30 s delay to achieve a 60 s venous phase.
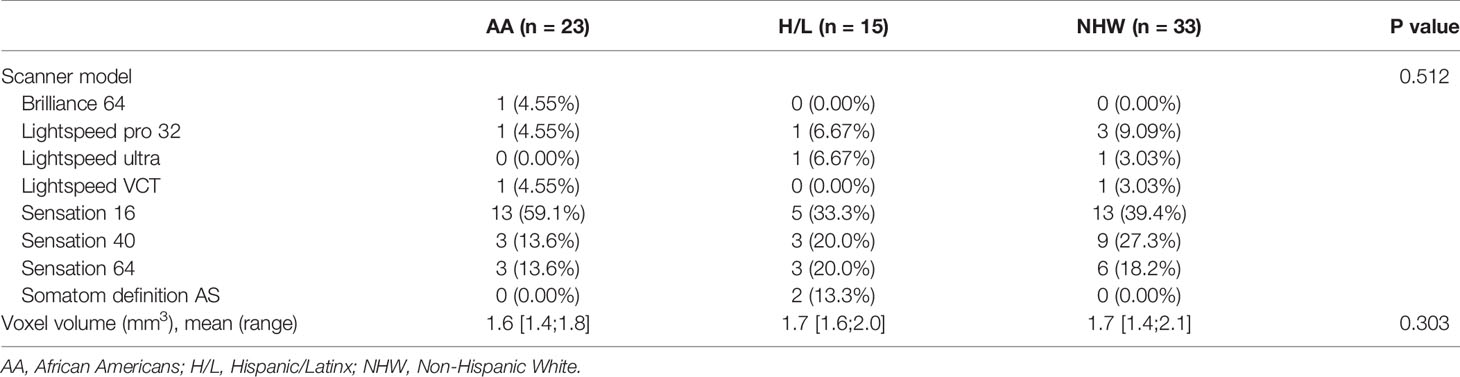
Table 2 Scanner type and voxel volumes measured for the study cohort.
CT Segmentation and Radiomic Feature Extraction/Reduction
Archived non-contrast and contrast-enhanced CT images were acquired from Moffitt’s GE Centricity Picture Archiving and Communication System (PACS). Our experienced board-certified abdominal oncologic radiologists (JC and DJ) were blinded to patient characteristics and outcomes. For each case, the standardized imaging reporting template for PDAC staging (39) was completed to collect information on “semantic” qualitative-based radiologic features related to morphology, arterial and venous enhancement, and evaluation of extra-pancreatic structures. Whole lesion semi-automated segmentation was performed on each slice of the lesion on all pretreatment (within 3 months prior to treatment) venous phase CT exams using Healthmyne Software (Healthmyne, Madison, WI, USA). The venous phase was chosen in part because this phase was most consistent across all exams. To reduce feature dimensionality, 135 highly relevant non-texture (which measure tumor size, shape, and location) and texture features (which measure properties such as smoothness, coarseness, and regularity) were extracted from each segmented lesion and analyzed for the venous contrast phase. Additionally, CT specifications including scanner type, slice thickness, pixel size were recorded given the known variability that can occur with different scanners and settings (40, 41).
Statistical Analysis
Data analysis was performed to evaluate racial/ethnic differences in (a) study population characteristics, (b) CT procedures and standard NCCN imaging criteria, and (c) radiomic features. The Kruskal-Wallis test was used for continuous variables, and Chi-squared test or Fisher’s exact test was used for categorical variables to compare the difference among racial/ethnic groups. Significant race/ethnicity-associated radiomic features were determined using a false discovery rate (42) at a threshold of 20%. Spearman correlation analysis was applied to evaluate the correlation between radiomic features. High correlated features were filtered out based on the absolute correlation coefficient above 0.9. Statistically significant radiomic features were summarized by principal component analyses (PCA) to derive a race/ethnicity-associated radiomic signature score as we described previously (43). Receiver operating characteristic (ROC) curve analysis was used to evaluate the prediction efficacy for race/ethnicity using the derived radiomic signature score. Cox proportional hazard regression was performed to evaluate the association between overall survival and each radiomic feature, including interaction terms between median-dichotomized radiomic features and race/ethnicity group (AA versus non-AA). Hazards ratios (HR) and 95% confidence intervals (CI) were estimated. Overall survival (OS) was calculated from the date of diagnosis to the date of death or last follow-up using the Kaplan–Meier method. Survival time was censored if patients were lost to follow up or after 4 years. Cox regression analysis was used to identify radiomic features independently prognostic for OS after adjustment for the following clinicopathological variables: age at diagnosis, gender, tumor size, tumor grade, and stage of disease. Statistical tests were two-sided and significant at alpha = 0.05. All statistical analyses were performed using the R 3.6.0 software (https://www.R-project.org).
Results
Study Population Characteristics
This retrospective cohort included 71 individuals diagnosed and treated for PDAC at Moffitt Cancer Center and Research Institute (Tampa, Florida) frequency-matched on age-group (+/− 5 years) and gender. Select characteristics of the study population are shown in Table 1. There were 23 AA, 15 H/L, and 33 NHW represented, with a slightly higher percentage of females (52%, n=37). The average age at diagnosis was 64.2 years (standard deviation=10.6), and most patients had regional or distant disease. H/L cases had significantly higher numbers of regional nodes examined than AA and NHW (p=0.005), though node positivity was similar between groups (p=0.84). Finally, AA had a significantly shorter average survival time (15 months) compared to Non-AA populations (p=0.028) (Figure 1).
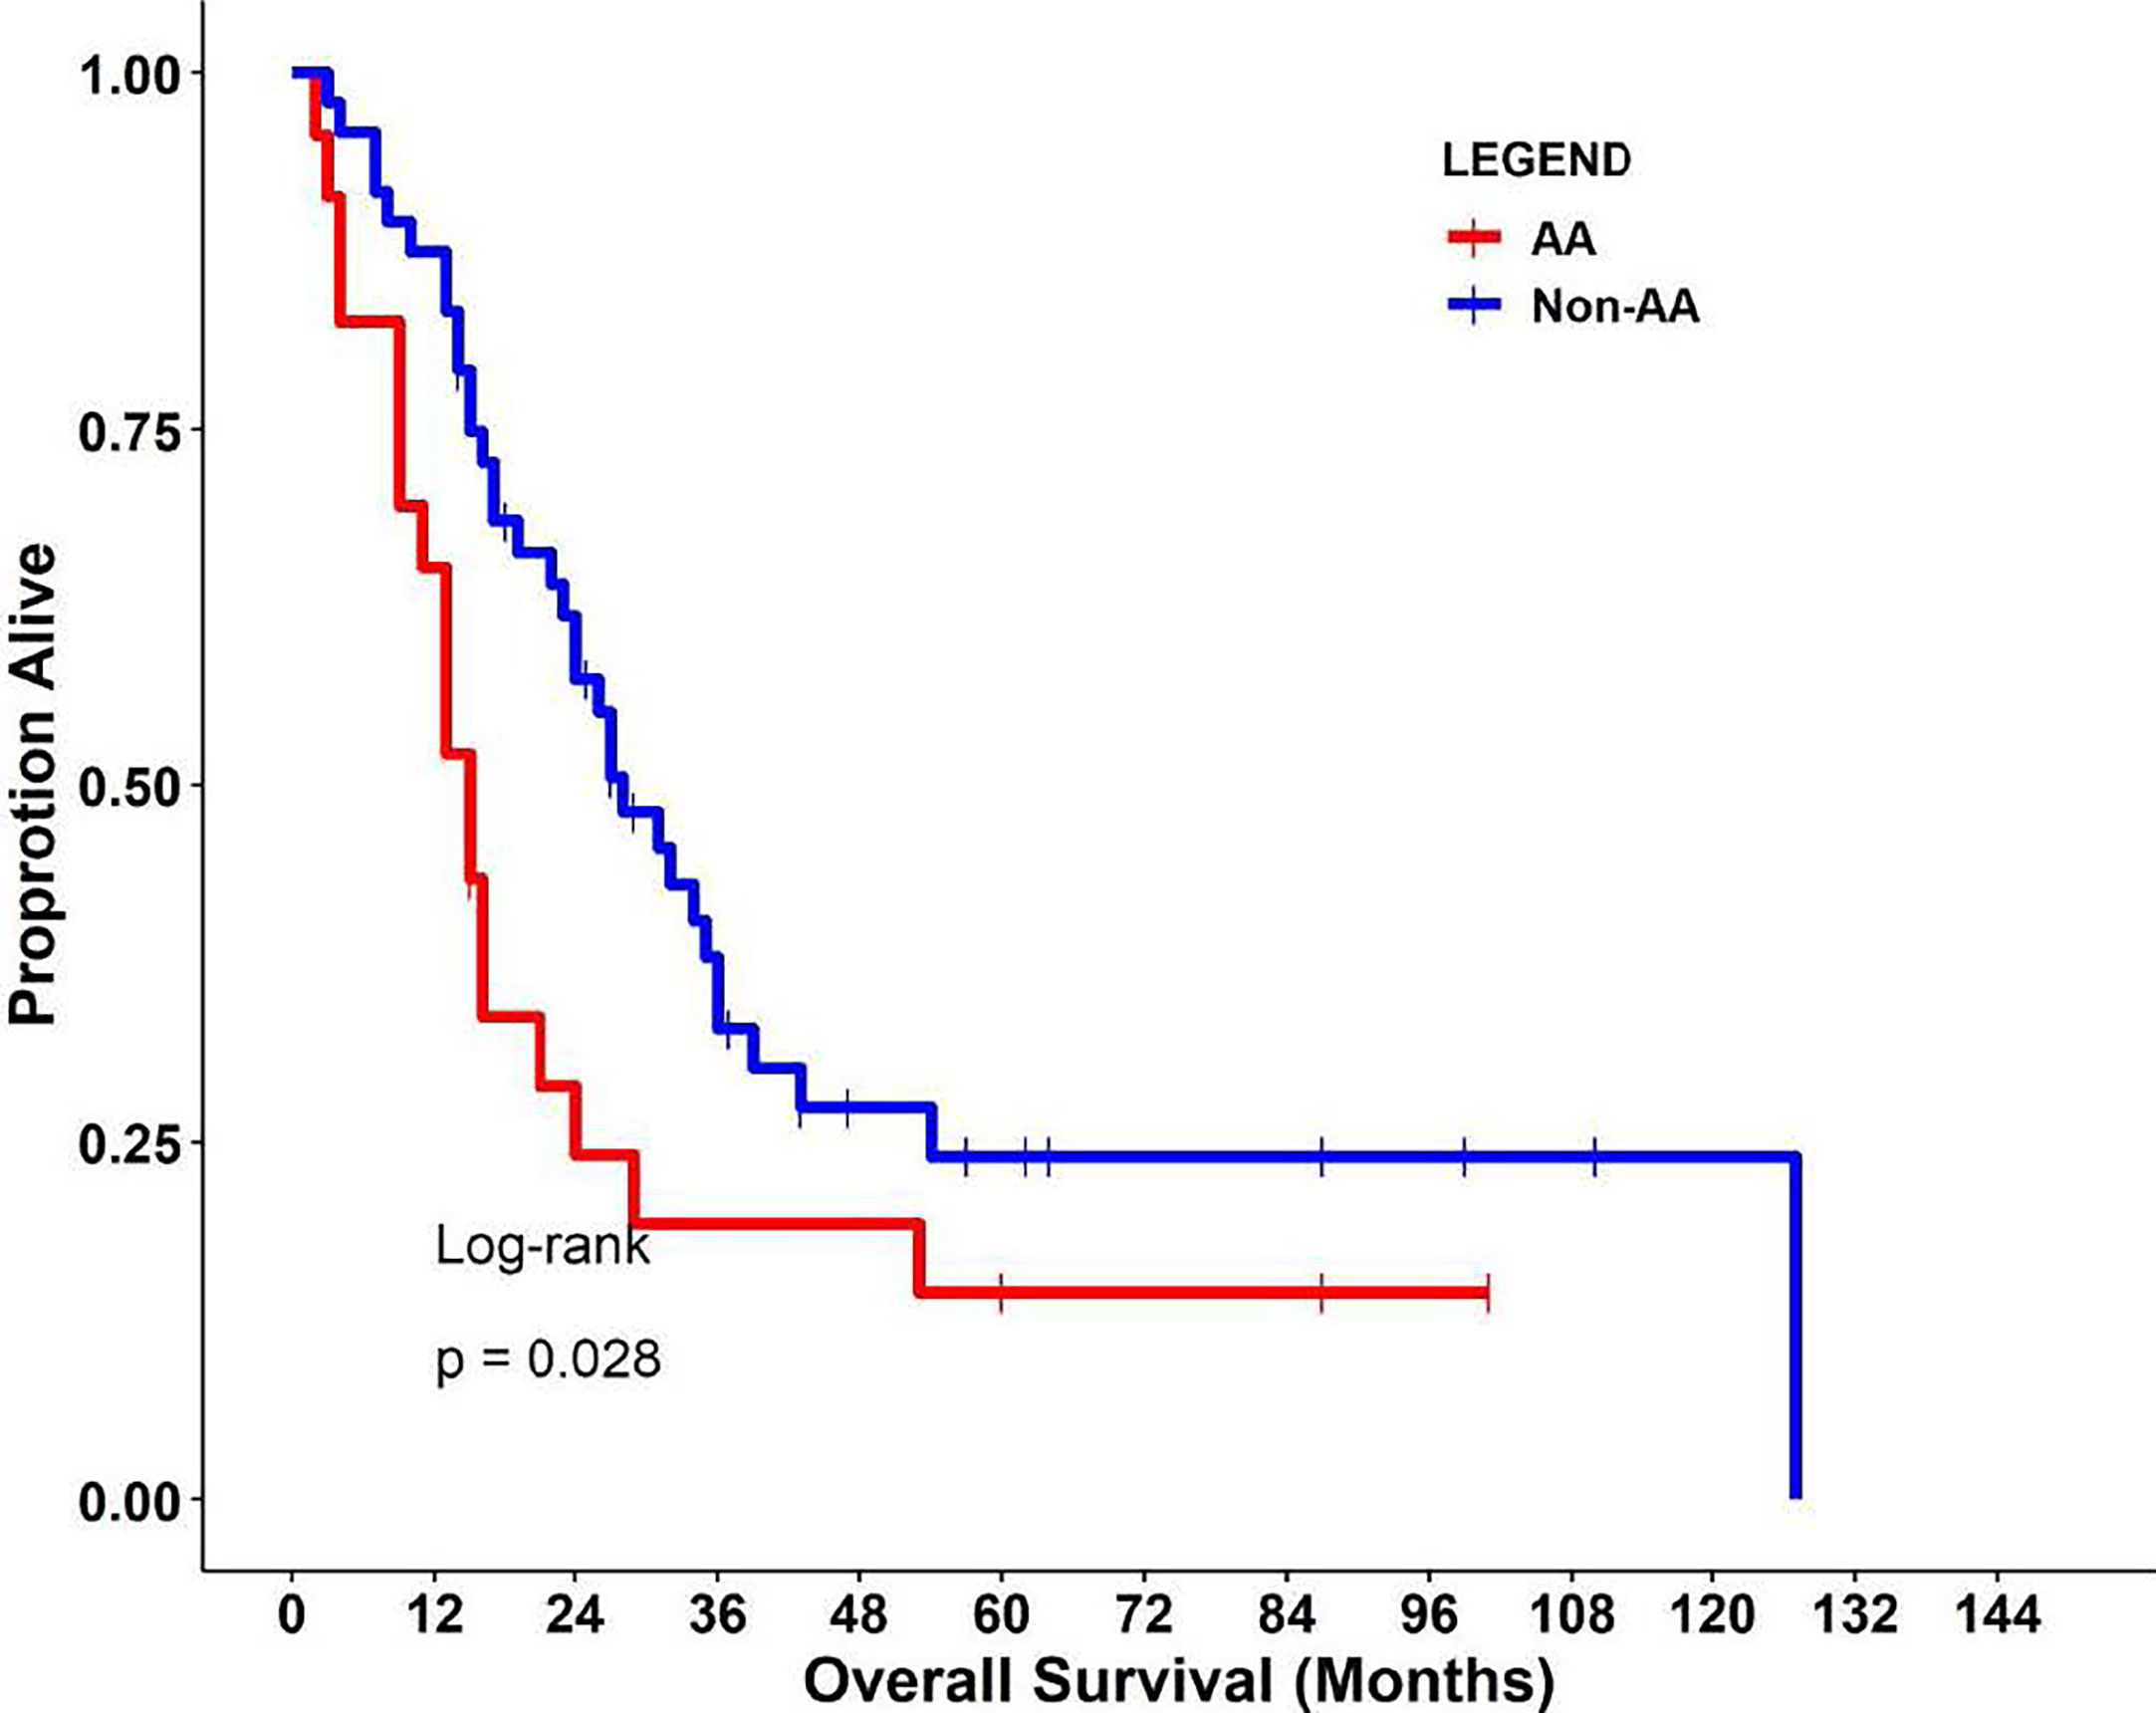
Figure 1 Kaplan-Meier curves (log-rank test) of overall survival in the study cohort.
CT Procedures and Standard NCCN Imaging Criteria
No significant differences were observed between racial/ethnic groups in the scanner types used (p=0.512) or in the venous phase voxel volumes (p=0.303) (Table 2). Evaluation of standard imaging reporting criteria revealed three parameters that appeared to differ significantly between the three racial/ethnic groups. CT images from the AA group were found to have greater tumor involvement of the superior mesenteric vessels, as measured by degree of superior mesenteric artery (SMA) solid soft tissue contact (p=0.002), extension to the first SMA branch (p=0.036), and superior mesenteric vein (SMV) vessel narrowing and/or contour irregularity (0.033), when compared to NHW (Table 3).
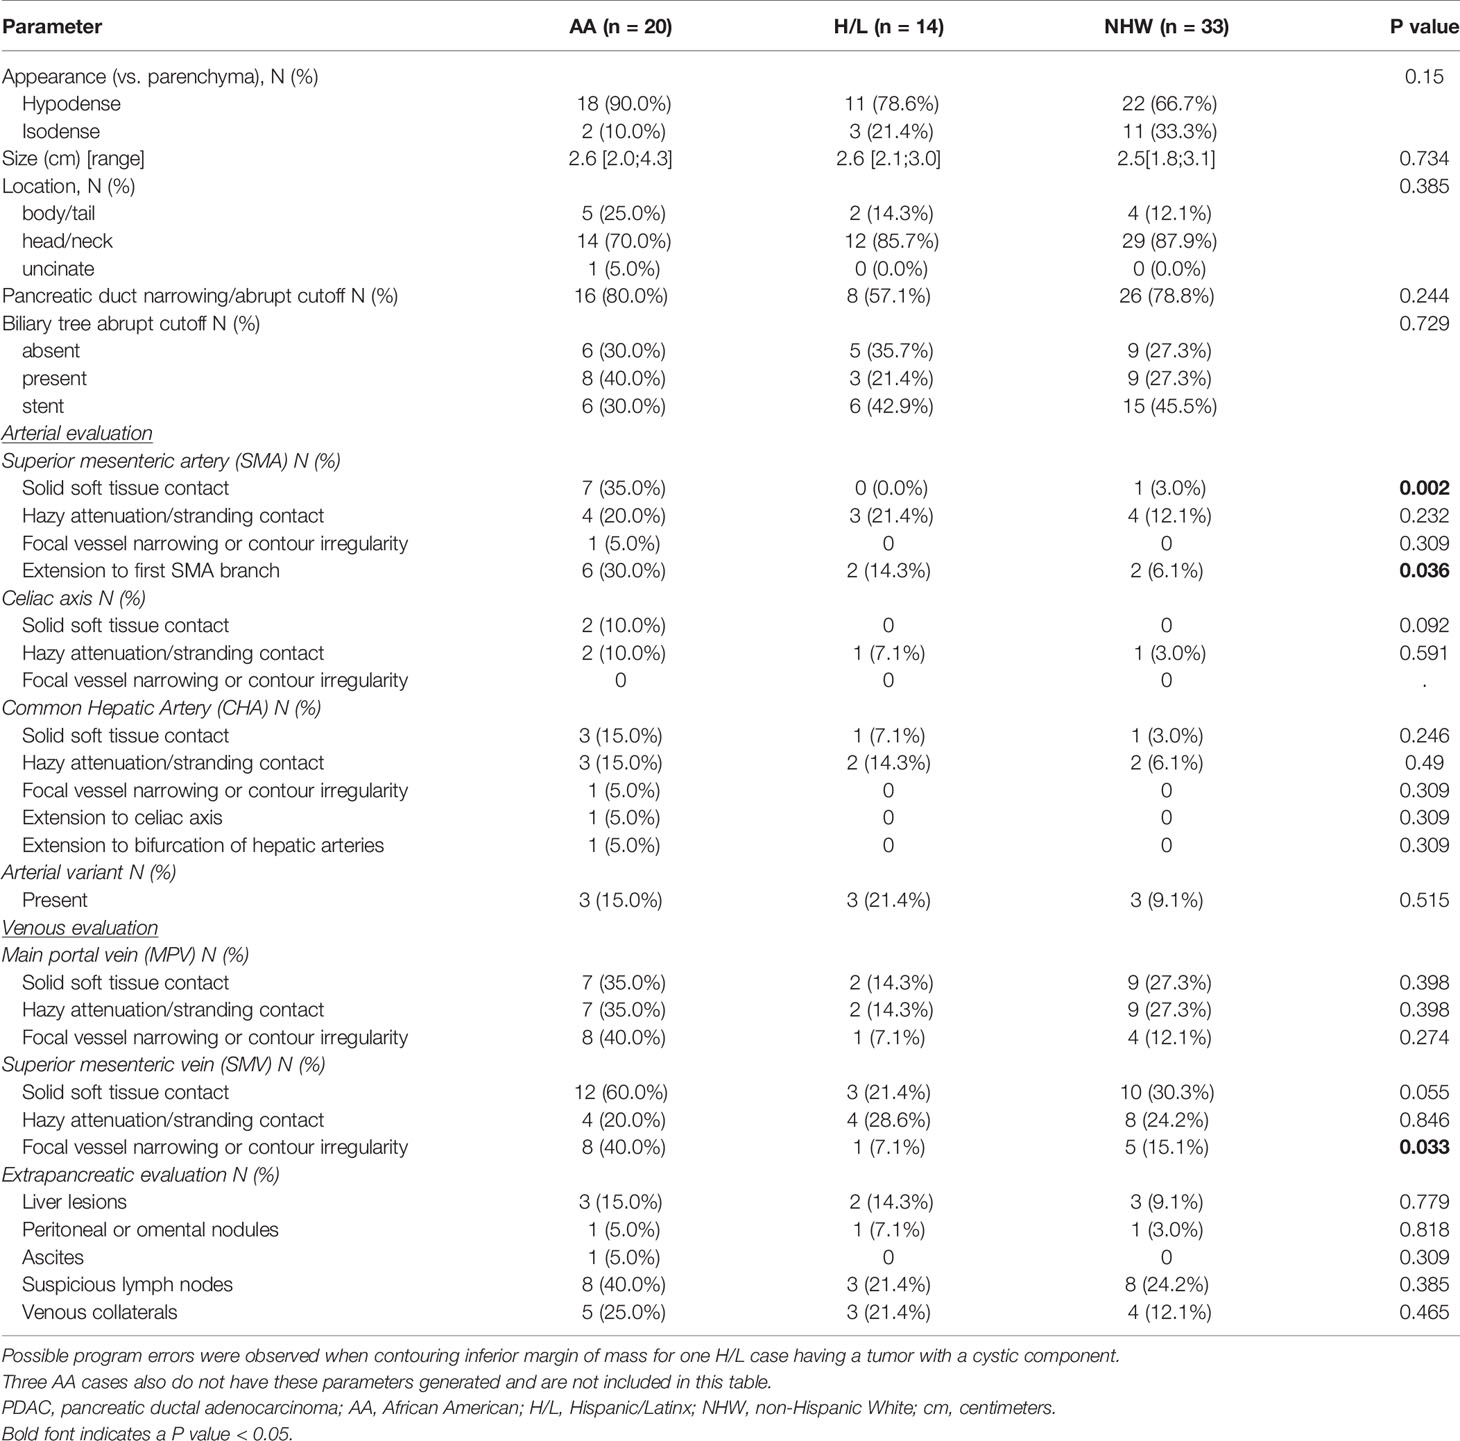
Table 3 PDAC radiologic reporting template parameters for the study cohort.
Radiomic Features
A total of 135 textural and non-textural radiomic features were evaluated for their association with race/ethnicity. Kruskal-Wallis test results indicated that 30 features were significantly associated with race/ethnicity (adjusted p<0.02; Table 4). Furthermore, 10 radiomic features were highly associated with race independent of tumor grade and included sphericity, volumetric mean Hounsfield units (HU), minimum HU, coefficient of variation HU, four gray level texture features, and two wavelet texture features (Supplementary Table 1). A multivariable model using principal component analysis to represent the radiomic signature yielded an area underneath the curve (AUC)=0.80 in differentiating AA versus non-AA (Figure 2).
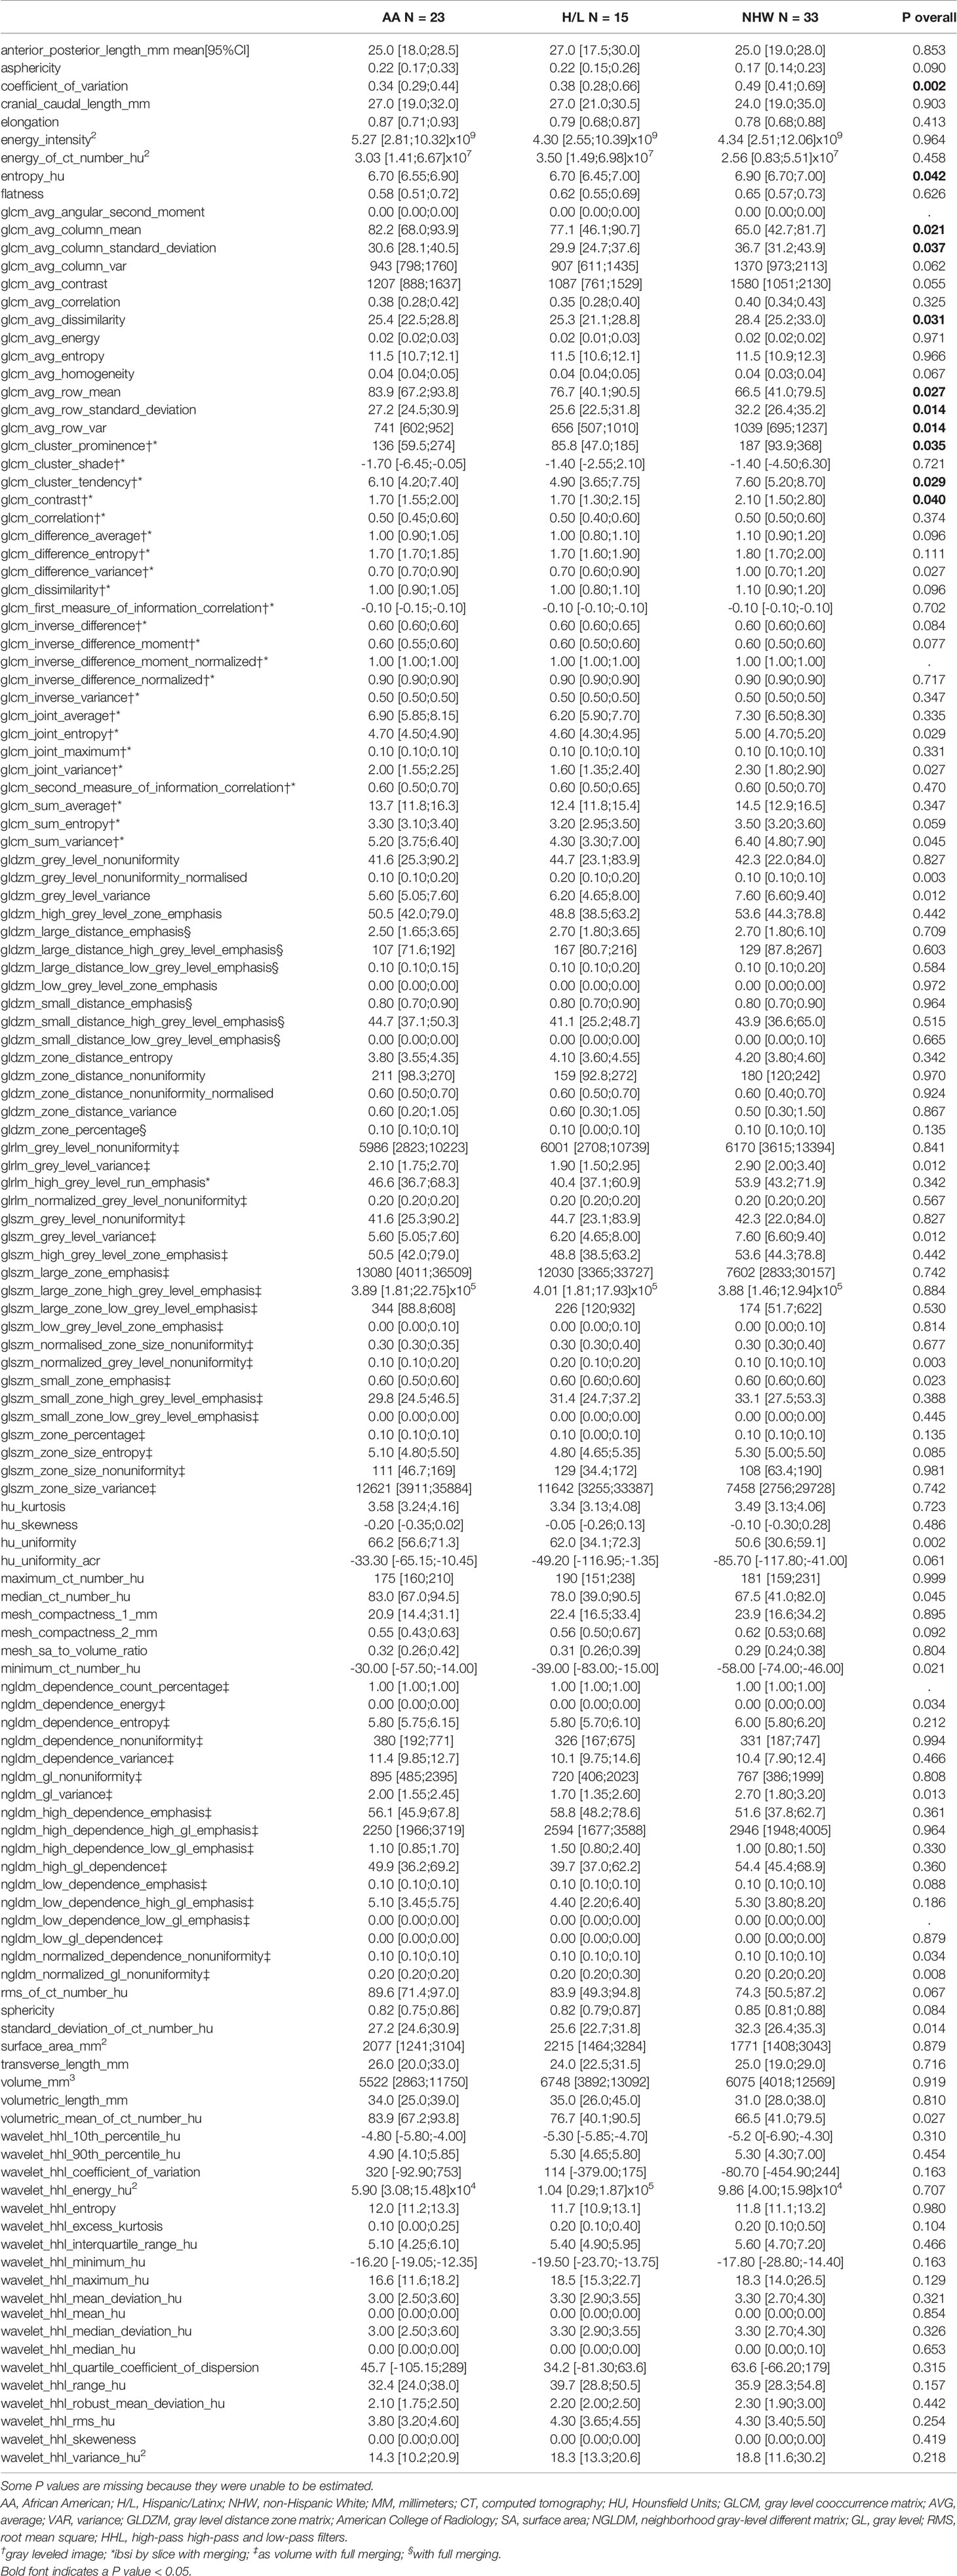
Table 4 Radiomic features evaluated in this study and their univariate association with race/ethnicity.
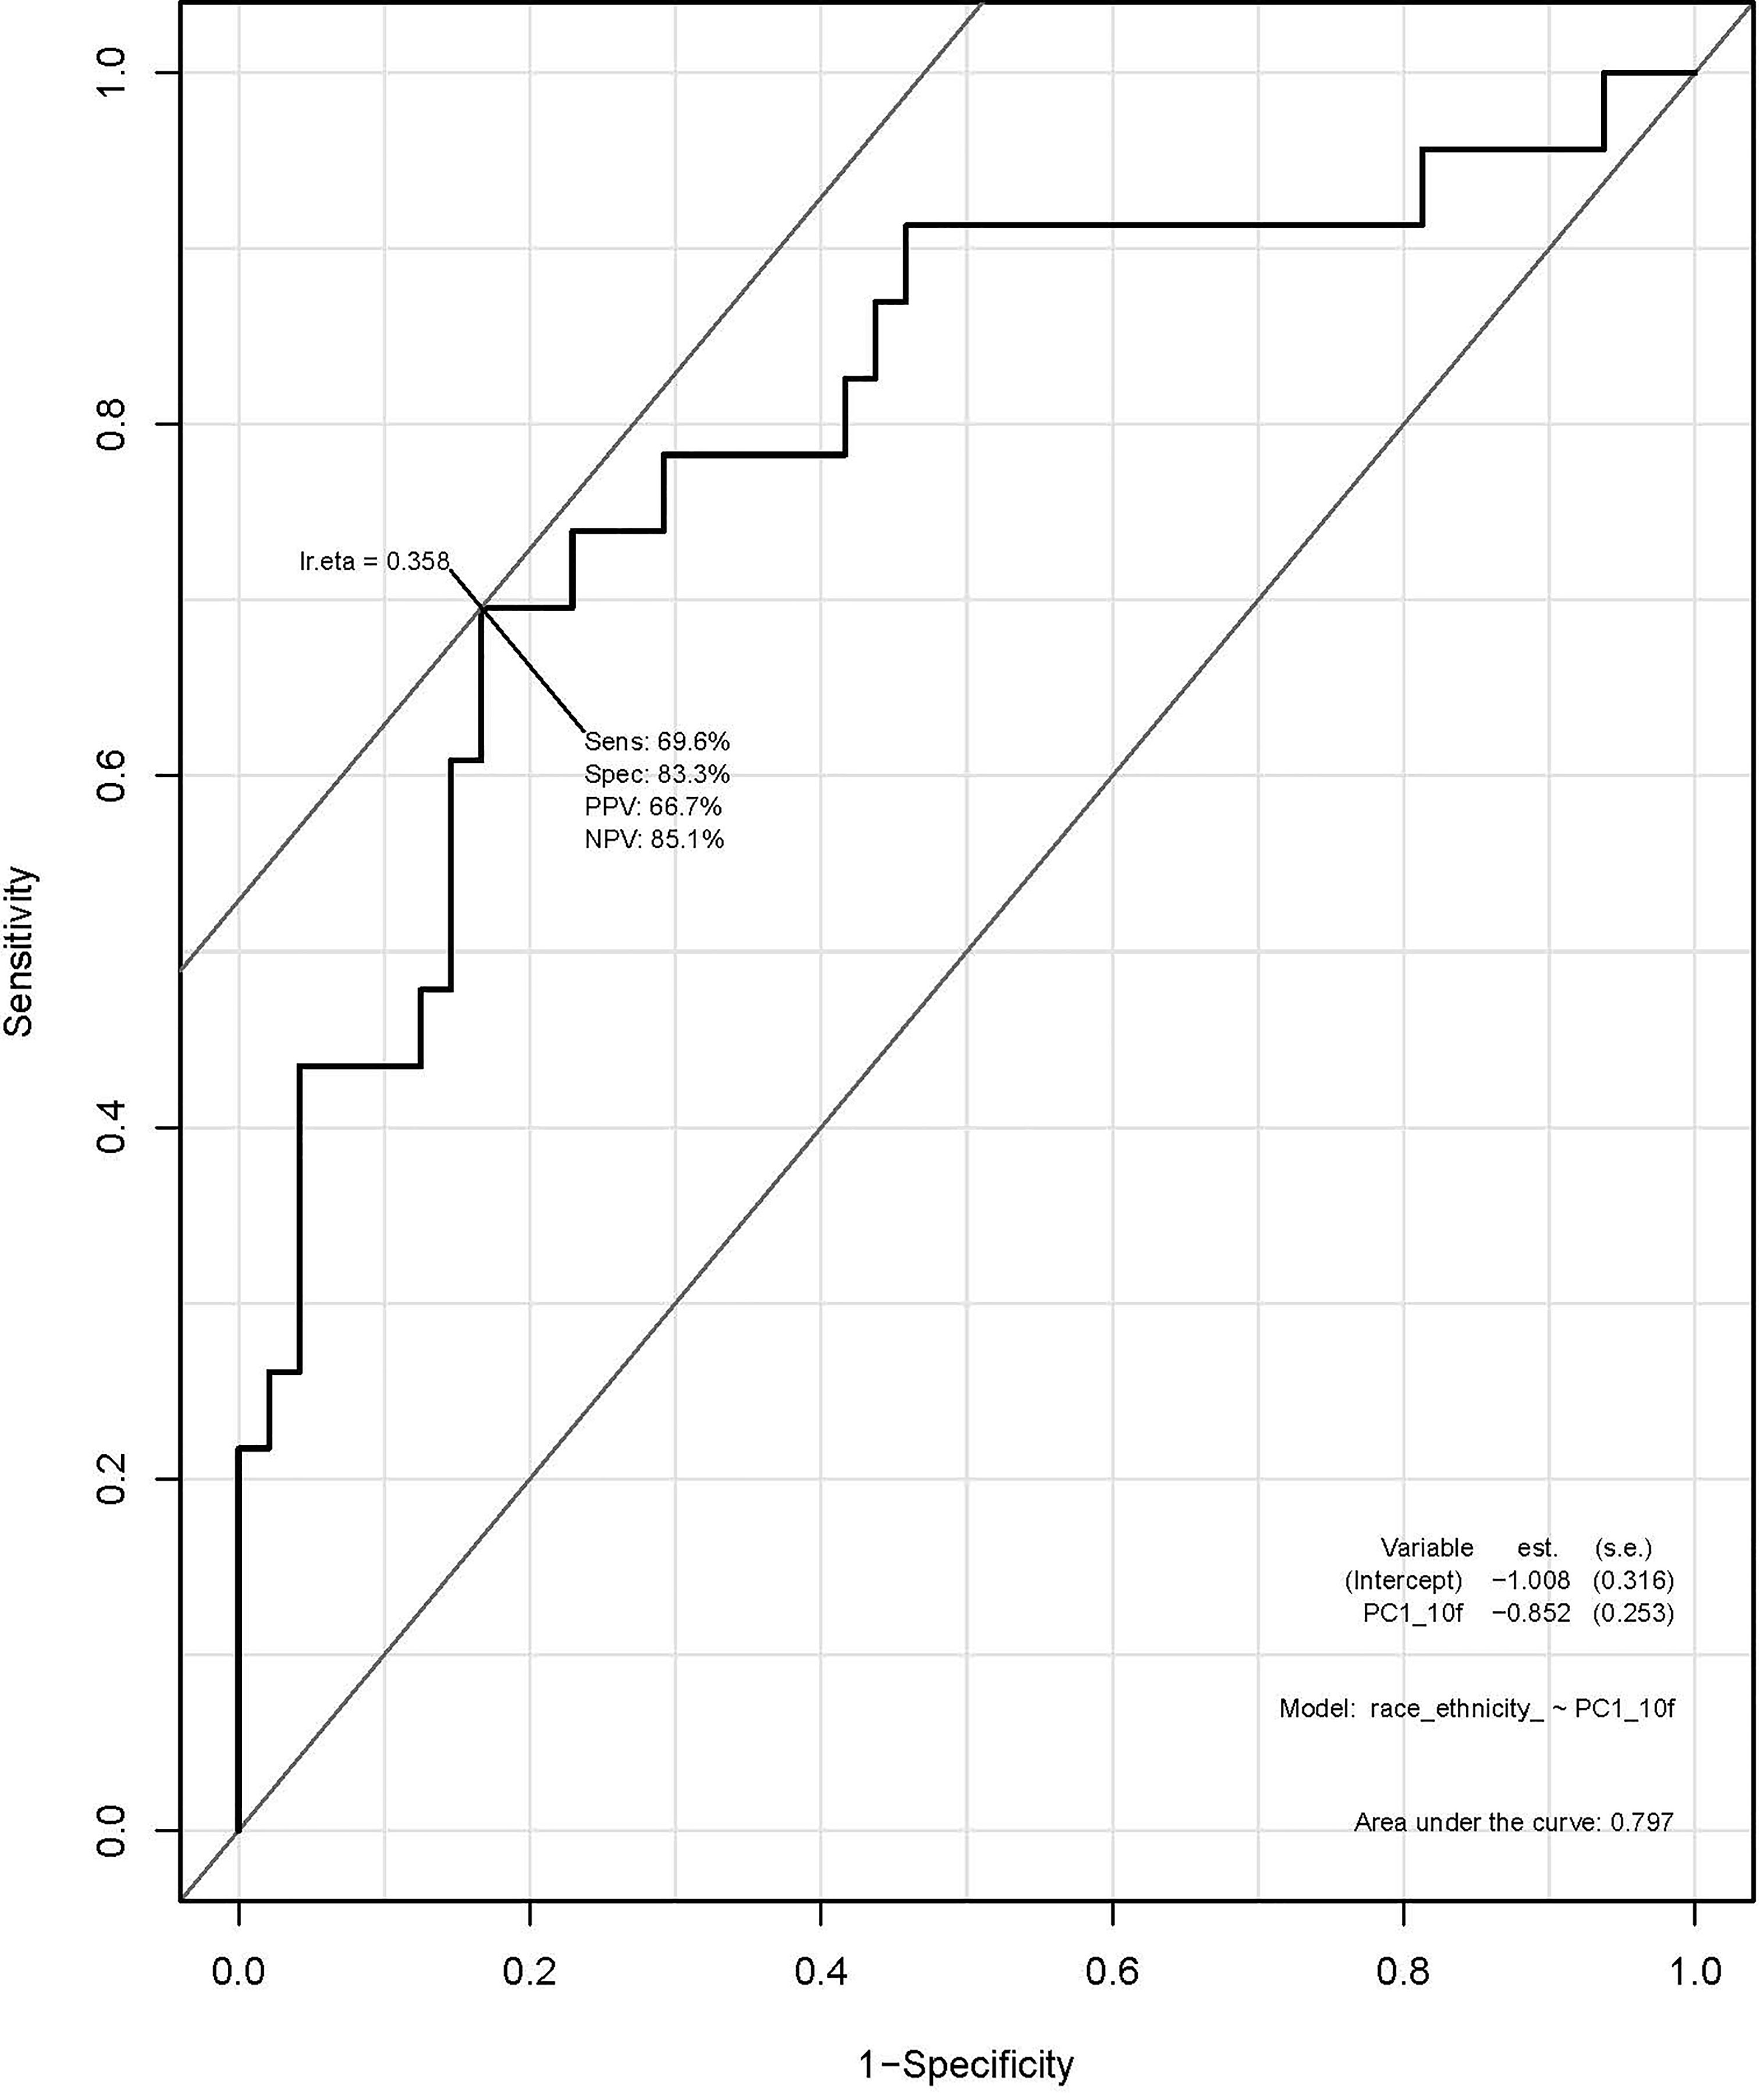
Figure 2 Receiver operating characteristic (ROC) curve using principal component analysis to identify radiomic features predictive of race/ethnicity.
Survival analysis identified the following non-correlated radiomic features with a significantly different survival difference between AA and non-AA (interaction effect between radiomic features and race with p<0.05): Volumetric Mean CT (HU) (HR: 3.90 (95% CI:1.19–12.78), p=0.024), GLCM Avg Column Mean (HR:4.75 (95% CI: 1.44,15.37), p=0.010), and GLCM Cluster Tendency (HR:3.36 (95% CI: 1.06–10.68), p=0.040) (Supplementary Table 2). Specifically, for Volumetric Mean CT and GLCM Avg Column Mean in tumors, low value of these radiomic features was associated with poorer survival among AA (Figures 3A, B). In contrast, survival curves overlapped between low and high groups of the radiomic features among non-AA. As a result, survival differences due to the radiomic features became differential between racial/ethnic groups (p=0.01–0.02). The GLCM Cluster Tendency (Figure 3C) had an opposite trend with high values associated with poorer survival among AA, but slightly improved survival among non-AA, leading to a significant differential survival difference between AA and non-AA (p=0.04). Furthermore, multivariate survival analysis indicated that Volumetric Mean CT (HU) and GLCM Avg Column Mean remain significantly associated with OS between AA and non-AA after adjustment for clinical-pathological features including age at diagnosis, gender, tumor size, tumor grade, and SEER-derived stage. Lower values of these radiomic features were associated with worse survival among AA (Supplementary Table 3).
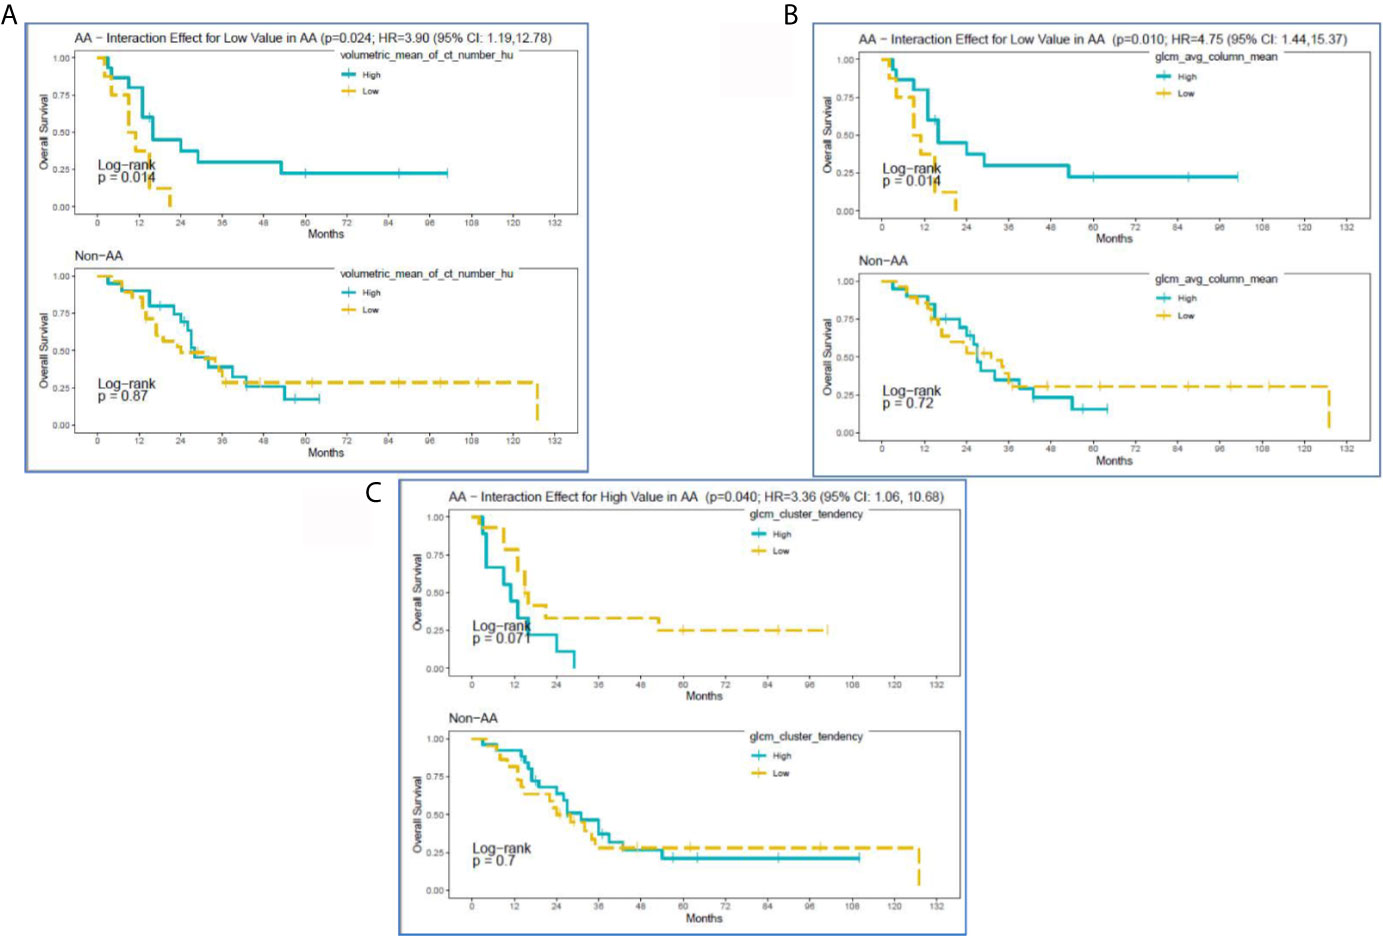
Figure 3 Kaplan-Meier curves for significant interactions between radiomic features and overall survival among self-reported African American (AA) and Non-AA (Hispanic/Latinx, H/L; and Non-Hispanic White, NHW) groups according to (A) Volumetric Mean CT (HU), (B) GLCM Avg Column Mean, and (C) GLCM Cluster Tendency.
Figure 4 reveals pretreatment CT images for three PDAC patients matched on tumor grade, gender, and age-group; lower radiomic values were observed among tumors from AA in volumetric mean CT HU and two GLCM texture features, compared to non-AA. These observations suggest that although the pancreatic tumors may appear similar on CT images, they reflect significantly different radiomic values associated with race/ethnicity and are predictive of overall survival.
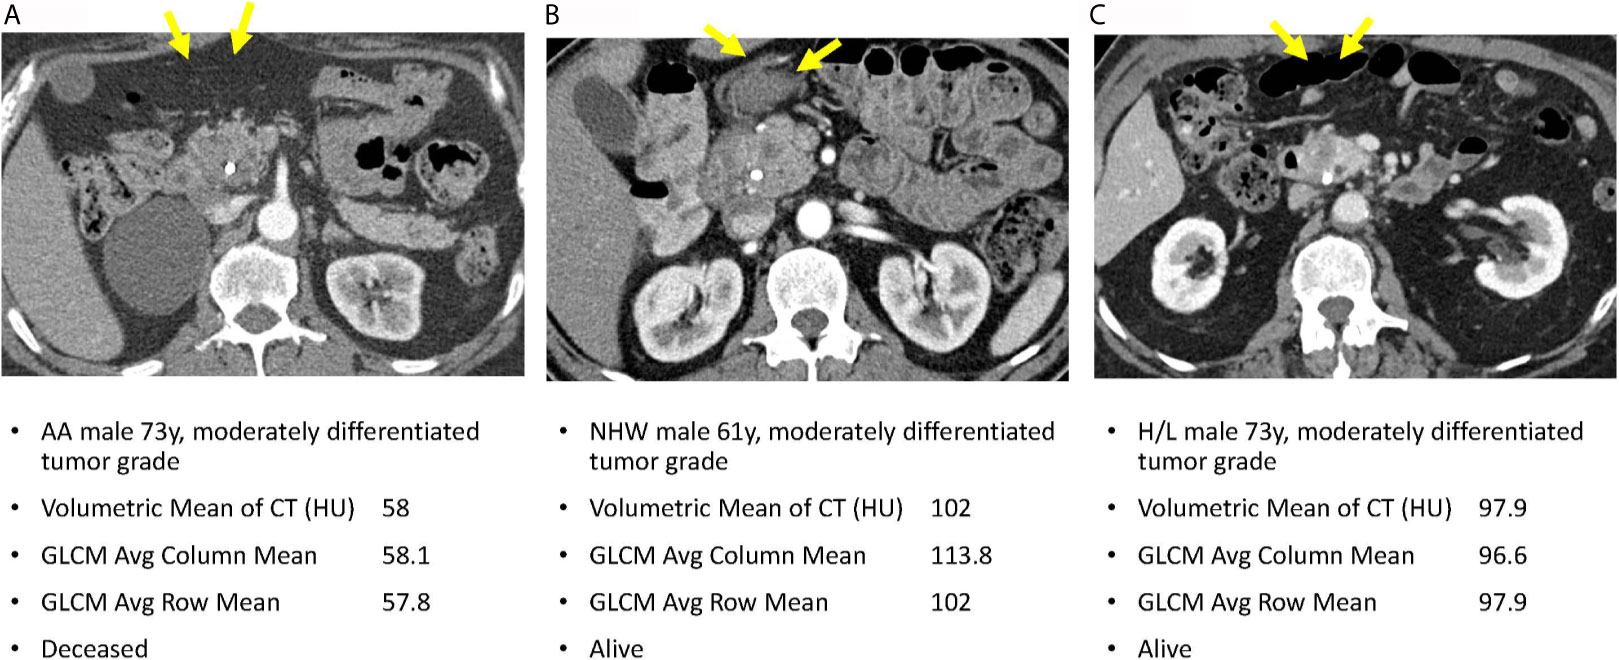
Figure 4 Axial venous phase CT images are presented in PDAC patients matched for tumor grade, gender, and age-group. Image (A) from an AA patient and shows a poorly defined hypoenhancing tumor marked by the yellow arrows. Image (B) in a NHW shows a similar radiologic appearance of the tumor but with significantly different radiomic tumor values. Image (C) in a Hispanic patient also had radiomic values different from the AA case. Note that a common bile duct stent is present in each of these patients.
Discussion
We conducted the first investigation we are aware of to apply a radiomic approach to routine pretreatment CT scans from patients with PDAC to specifically explore associations with race/ethnicity and overall survival. Our analysis showed AA patients with low volumetric mean HU tumors had worse survival than similar tumors in non-AA. In PDAC, tumors with HU lower than surrounding pancreatic parenchyma have been correlated with worse outcomes (44). In our study, the low volumetric mean HU may be revealing a similar relationship to survival as the previously reported relative delta score, except that our measure is based in absolute HU as opposed to the delta score, which reflects relative differences in HU. Our analysis also demonstrated worse survival in AA patients having high coefficient of variation HU compared to similar tumors in non-AA, independent of key prognostic factors. The coefficient of variation HU is a reflection of tumor heterogeneity as it presents on CT based on voxel HU values, and it represents the standard deviation of the HU values within segmented tumors divided by the mean HU. Therefore, tumors with a wider range of different-appearing voxels within a tumor will have a larger coefficient of variation HU. In line with these findings, previous studies have shown that more heterogenous tumors are associated with high-grade dysplasia, resistance to anticancer therapies, and poorer prognoses (1, 45–48).
In this study, radiomics allowed us to preoperatively and non-invasively quantify the differences in appearance of pancreatic tumors across different racially and ethnically defined cohorts, even where the differences were not easy to visualize or describe qualitatively. We discovered multiple radiomic features that predict poor survival specifically in AA patients independent of other demographic and clinical factors. It is possible that these radiomic differences reflect inherent biological tumor differences specific to each ethnic group. Having potential poor prognostic biomarkers available in the pretreatment setting could influence clinical decisions and support earlier and more aggressive treatments that could reduce disparities for these underserved groups. Additionally, future studies correlating race/ethnicity-based radiomic features with tumor tissue-based biomarkers are needed to determine the capacity at which radiomics can be used in clinical decision-making workflows at the time of multidisciplinary tumor board.
We realize that the single-institutional retrospective design is prone to biases, but there is wealth in this exploratory investigation. Future prospective multicenter studies involving racially diverse cohorts of PDAC cases will be needed to continue to move PDAC disparities research forward. We plan to optimize and validate the most promising radiomic features and biomarkers in an independent cohort of AA PC cases using our multi-institutional Florida Pancreas Collaborative infrastructure (49). Furthermore, we plan to conduct a radiogenomic approach that integrates CT radiomic data with molecular biomarker data from pancreatic tumor tissue in order to uncover biological mechanisms to explain the disproportionate PDAC burden in AA.
Data Availability Statement
The original contributions presented in the study are included in the article/Supplementary Material. Further inquiries can be directed to the corresponding author.
Ethics Statement
The studies involving human participants were reviewed and approved by Advarra IRB (MCC# 19431; IRB #: Pro00024543). The patients/participants provided their written informed consent to participate in this study.
Author Contributions
JP, DJ, and JC contributed to conception and design of the study. SV organized the database. JL and DT-C performed the statistical analysis. JP wrote the first draft of the manuscript, and JL, D-TC, DJ, and JC wrote sections of the manuscript. All authors contributed to the article and approved the submitted version.
Funding
This research was funded in part through the George Edgecomb Society awarded to JP, JC, DJ, and D-TC. The research was also supported by the Quantitative Imaging Core and the Biostatistics and Bioinformatics Shared Resource at the H. Lee Moffitt Cancer Center & Research Institute, an NCI designated Comprehensive Cancer Center (P30-CA076292).
Conflict of Interest
The authors declare that the research was conducted in the absence of any commercial or financial relationships that could be construed as a potential conflict of interest.
Supplementary Material
The Supplementary Material for this article can be found online at: https://www.frontiersin.org/articles/10.3389/fonc.2021.712950/full#supplementary-material
References
1. Burrell RA, McGranahan N, Bartek J, Swanton C. The Causes and Consequences of Genetic Heterogeneity in Cancer Evolution. Nature (2013) 501(7467):338–45. doi: 10.1038/nature12625
2. Rahib L, Smith BD, Aizenberg R, Rosenzweig AB, Fleshman JM, Matrisian LM. Projecting Cancer Incidence and Deaths to 2030: The Unexpected Burden of Thyroid, Liver, and Pancreas Cancers in the United States. Cancer Res (2014) 74(11):2913–21. doi: 10.1158/0008-5472.Can-14-0155
3. Howlader N, Noone Am, Krapcho M, Miller D, Bishop K, Altekruse Sf, et al. Seer Cancer Statistics Review, 1975-2013. Bethesda, Md: National Cancer Institute. Based on November 2015 Seer Data Submission, Posted to the Seer Web Site, April (2016).
4. Abraham A, Al-Refaie WB, Parsons HM, Dudeja V, Vickers SM, Habermann EB. Disparities in Pancreas Cancer Care. Ann Surg Oncol (2013) 20(6):2078–87. doi: 10.1245/s10434-012-2843-z
5. Chang KJ, Parasher G, Christie C, Largent J, Anton-Culver H. Risk of Pancreatic Adenocarcinoma: Disparity Between African Americans and Other Race/Ethnic Groups. Cancer (2005) 103(2):349–57. doi: 10.1002/cncr.20771
6. Riall TS, Townsend CM Jr., Kuo YF, Freeman JL, Goodwin JS. Dissecting Racial Disparities in the Treatment of Patients With Locoregional Pancreatic Cancer: A 2-Step Process. Cancer (2010) 116(4):930–9. doi: 10.1002/cncr.24836
7. Singal V, Singal AK, Kuo YF. Racial Disparities in Treatment for Pancreatic Cancer and Impact on Survival: A Population-Based Analysis. J Cancer Res Clin Oncol (2012) 138(4):715–22. doi: 10.1007/s00432-012-1156-8
8. Wray CJ, Castro-Echeverry E, Silberfein EJ, Ko TC, Kao LS. A Multi-Institutional Study of Pancreatic Cancer in Harris County, Texas: Race Predicts Treatment and Survival. Ann Surg Oncol (2012) 19(9):2776–81. doi: 10.1245/s10434-012-2361-z
9. Murphy MM, Simons JP, Hill JS, McDade TP, Chau Ng S, Whalen GF, et al. Pancreatic Resection: A Key Component to Reducing Racial Disparities in Pancreatic Adenocarcinoma. Cancer (2009) 115(17):3979–90. doi: 10.1002/cncr.24433
10. Zell JA, Rhee JM, Ziogas A, Lipkin SM, Anton-Culver H. Race, Socioeconomic Status, Treatment, and Survival Time Among Pancreatic Cancer Cases in California. Cancer Epidemiol Biomarkers Prev (2007) 16(3):546–52. doi: 10.1158/1055-9965.epi-06-0893
11. Murphy MM, Simons JP, Ng SC, McDade TP, Smith JK, Shah SA, et al. Racial Differences in Cancer Specialist Consultation, Treatment, and Outcomes for Locoregional Pancreatic Adenocarcinoma. Ann Surg Oncol (2009) 16(11):2968–77. doi: 10.1245/s10434-009-0656-5
12. DeSantis CE, Siegel RL, Sauer AG, Miller KD, Fedewa SA, Alcaraz KI, et al. Cancer Statistics for African Americans, 2016: Progress and Opportunities in Reducing Racial Disparities. CA Cancer J Clin (2016) 66(4):290–308. doi: 10.3322/caac.21340
13. Kaissis G, Braren R. Pancreatic Cancer Detection and Characterization-State of the Art Cross-Sectional Imaging and Imaging Data Analysis. Transl Gastroenterol Hepatol (2019) 4:35. doi: 10.21037/tgh.2019.05.04
14. Kumar V, Gu Y, Basu S, Berglund A, Eschrich SA, Schabath MB, et al. Radiomics: The Process and the Challenges. Magn Reson Imaging (2012) 30(9):1234–48. doi: 10.1016/j.mri.2012.06.010
15. Coroller TP, Grossmann P, Hou Y, Rios Velazquez E, Leijenaar RT, Hermann G, et al. Ct-Based Radiomic Signature Predicts Distant Metastasis in Lung Adenocarcinoma. Radiother Oncol (2015) 114(3):345–50. doi: 10.1016/j.radonc.2015.02.015
16. Grove O, Berglund AE, Schabath MB, Aerts HJ, Dekker A, Wang H, et al. Quantitative Computed Tomographic Descriptors Associate Tumor Shape Complexity and Intratumor Heterogeneity With Prognosis in Lung Adenocarcinoma. PloS One (2015) 10(3):e0118261. doi: 10.1371/journal.pone.0118261
17. Leijenaar RT, Carvalho S, Velazquez ER, van Elmpt WJ, Parmar C, Hoekstra OS, et al. Stability of Fdg-Pet Radiomics Features: An Integrated Analysis of Test-Retest and Inter-Observer Variability. Acta Oncol (2013) 52(7):1391–7. doi: 10.3109/0284186x.2013.812798
18. Balagurunathan Y, Kumar V, Gu Y, Kim J, Wang H, Liu Y, et al. Test-Retest Reproducibility Analysis of Lung Ct Image Features. J Digit Imaging (2014) 27(6):805–23. doi: 10.1007/s10278-014-9716-x
19. Balagurunathan Y, Gu Y, Wang H, Kumar V, Grove O, Hawkins S, et al. Reproducibility and Prognosis of Quantitative Features Extracted From Ct Images. Transl Oncol (2014) 7(1):72–87. doi: 10.1593/tlo.13844
20. Gatenby RA, Grove O, Gillies RJ. Quantitative Imaging in Cancer Evolution and Ecology. Radiology (2013) 269(1):8–15. doi: 10.1148/radiol.13122697
21. Zhou M, Hall L, Goldgof D, Russo R, Balagurunathan Y, Gillies R, et al. Radiologically Defined Ecological Dynamics and Clinical Outcomes in Glioblastoma Multiforme: Preliminary Results. Transl Oncol (2014) 7(1):5–13. doi: 10.1593/tlo.13730
22. Permuth JB, Choi J, Balarunathan Y, Kim J, Chen DT, Chen L, et al. Combining Radiomic Features With a Mirna Classifier May Improve Prediction of Malignant Pathology for Pancreatic Intraductal Papillary Mucinous Neoplasms. Oncotarget (2016) 7(52):85785–97. doi: 10.18632/oncotarget.11768
23. Permuth JB, Choi JW, Chen DT, Jiang K, DeNicola G, Li JN, et al. A Pilot Study of Radiologic Measures of Abdominal Adiposity: Weighty Contributors to Early Pancreatic Carcinogenesis Worth Evaluating? Cancer Biol Med (2017) 14(1):66–73. doi: 10.20892/j.issn.2095-3941.2017.0006
24. Polk SL, Choi JW, McGettigan MJ, Rose T, Ahmed A, Kim J, et al. Multiphase Computed Tomography Radiomics of Pancreatic Intraductal Papillary Mucinous Neoplasms to Predict Malignancy. World J Gastroenterol (2020) 26(24):3458–71. doi: 10.3748/wjg.v26.i24.3458
25. Smith AD, Gray MR, Del Campo SM, Shlapak D, Ganeshan B, Zhang X, et al. Predicting Overall Survival in Patients With Metastatic Melanoma on Antiangiogenic Therapy and Recist Stable Disease on Initial Posttherapy Images Using Ct Texture Analysis. AJR Am J Roentgenol (2015) 205(3):W283–93. doi: 10.2214/ajr.15.14315
26. Skogen K, Ganeshan B, Good C, Critchley G, Miles K. Measurements of Heterogeneity in Gliomas on Computed Tomography Relationship to Tumour Grade. J Neurooncol (2013) 111(2):213–9. doi: 10.1007/s11060-012-1010-5
27. Ganeshan B, Skogen K, Pressney I, Coutroubis D, Miles K. Tumour Heterogeneity in Oesophageal Cancer Assessed by Ct Texture Analysis: Preliminary Evidence of an Association With Tumour Metabolism, Stage, and Survival. Clin Radiol (2012) 67(2):157–64. doi: 10.1016/j.crad.2011.08.012
28. Ganeshan B, Panayiotou E, Burnand K, Dizdarevic S, Miles K. Tumour Heterogeneity in Non-Small Cell Lung Carcinoma Assessed by Ct Texture Analysis: A Potential Marker of Survival. Eur Radiol (2012) 22(4):796–802. doi: 10.1007/s00330-011-2319-8
29. Ganeshan B, Goh V, Mandeville HC, Ng QS, Hoskin PJ, Miles KA. Non-Small Cell Lung Cancer: Histopathologic Correlates for Texture Parameters at Ct. Radiology (2013) 266(1):326–36. doi: 10.1148/radiol.12112428
30. Andersen MB, Harders SW, Ganeshan B, Thygesen J, Torp Madsen HH, Rasmussen F. Ct Texture Analysis Can Help Differentiate Between Malignant and Benign Lymph Nodes in the Mediastinum in Patients Suspected for Lung Cancer. Acta Radiol (2015) 57(6):669–76. doi: 10.1177/0284185115598808
31. Hanania AN, Bantis LE, Feng Z, Wang H, Tamm EP, Katz MH, et al. Quantitative Imaging to Evaluate Malignant Potential of Ipmns. Oncotarget (2016) 7(52):85776–84. doi: 10.18632/oncotarget.11769
32. Attiyeh MA, Chakraborty J, McIntyre CA, Kappagantula R, Chou Y, Askan G, et al. Ct Radiomics Associations With Genotype and Stromal Content in Pancreatic Ductal Adenocarcinoma. Abdom Radiol (NY) (2019) 44(9):3148–57. doi: 10.1007/s00261-019-02112-1
33. Carmicheal J, Patel A, Dalal V, Atri P, Dhaliwal AS, Wittel UA, et al. Elevating Pancreatic Cystic Lesion Stratification: Current and Future Pancreatic Cancer Biomarker(s). Biochim Biophys Acta Rev Cancer (2020) 1873(1):188318. doi: 10.1016/j.bbcan.2019.188318
34. Chakraborty J, Midya A, Gazit L, Attiyeh M, Langdon-Embry L, Allen PJ, et al. Ct Radiomics to Predict High-Risk Intraductal Papillary Mucinous Neoplasms of the Pancreas. Med Phys (2018) 45(11):5019–29. doi: 10.1002/mp.13159
35. Chu LC, Park S, Kawamoto S, Fouladi DF, Shayesteh S, Zinreich ES, et al. Utility of Ct Radiomics Features in Differentiation of Pancreatic Ductal Adenocarcinoma From Normal Pancreatic Tissue. AJR Am J Roentgenol (2019) 213(2):349–57. doi: 10.2214/ajr.18.20901
36. Harrington KA, Williams TL, Lawrence SA, Chakraborty J, Al Efishat MA, Attiyeh MA, et al. Multimodal Radiomics and Cyst Fluid Inflammatory Markers Model to Predict Preoperative Risk in Intraductal Papillary Mucinous Neoplasms. J Med Imaging (Bellingham) (2020) 7(3):31507. doi: 10.1117/1.Jmi.7.3.031507
37. Nasief H, Zheng C, Schott D, Hall W, Tsai S, Erickson B, et al. A Machine Learning Based Delta-Radiomics Process for Early Prediction of Treatment Response of Pancreatic Cancer. NPJ Precis Oncol (2019) 3:25. doi: 10.1038/s41698-019-0096-z
38. Shen X, Yang F, Yang P, Yang M, Xu L, Zhuo J, et al. A Contrast-Enhanced Computed Tomography Based Radiomics Approach for Preoperative Differentiation of Pancreatic Cystic Neoplasm Subtypes: A Feasibility Study. Front Oncol (2020) 10:248. doi: 10.3389/fonc.2020.00248
39. Al-Hawary MM, Francis IR, Chari ST, Fishman EK, Hough DM, Lu DS, et al. Pancreatic Ductal Adenocarcinoma Radiology Reporting Template: Consensus Statement of the Society of Abdominal Radiology and the American Pancreatic Association. Gastroenterology (2014) 146(1):291–304 e1. doi: 10.1053/j.gastro.2013.11.004
40. Mackin D, Fave X, Zhang L, Yang J, Jones AK, Ng CS, et al. Harmonizing the Pixel Size in Retrospective Computed Tomography Radiomics Studies. PloS One (2017) 12(9):e0178524. doi: 10.1371/journal.pone.0178524
41. Shafiq-Ul-Hassan M, Zhang GG, Latifi K, Ullah G, Hunt DC, Balagurunathan Y, et al. Intrinsic Dependencies of Ct Radiomic Features on Voxel Size and Number of Gray Levels. Med Phys (2017) 44(3):1050–62. doi: 10.1002/mp.12123
42. Benjamini Y, Hochberg Y. Controlling the False Discovery Rate: A Practical and Powerful Approach to Multiple Testing. J R Stat Soc Ser B-Methodological (1995) 57(1):289–300. doi: 10.1111/j.2517-6161.1995.tb02031.x
43. Permuth-Wey J, Chen DT, Fulp WJ, Yoder SJ, Zhang Y, Georgeades C, et al. Plasma Micrornas as Novel Biomarkers for Patients With Intraductal Papillary Mucinous Neoplasms of the Pancreas. Cancer Prev Res (Phila) (2015) 8(9):826–34. doi: 10.1158/1940-6207.capr-15-0094
44. Zaid M, Widmann L, Dai A, Sun K, Zhang J, Zhao J, et al. Predictive Modeling for Voxel-Based Quantification of Imaging-Based Subtypes of Pancreatic Ductal Adenocarcinoma (Pdac): A Multi-Institutional Study. Cancers (Basel) (2020) 12(12):596931. doi: 10.3390/cancers12123656
45. Brouwer A, De Laere B, Peeters D, Peeters M, Salgado R, Dirix L, et al. Evaluation and Consequences of Heterogeneity in the Circulating Tumor Cell Compartment. Oncotarget (2016) 7(30):48625–43. doi: 10.18632/oncotarget.8015
46. Caswell DR, Swanton C. The Role of Tumour Heterogeneity and Clonal Cooperativity in Metastasis, Immune Evasion and Clinical Outcome. BMC Med (2017) 15(1):133. doi: 10.1186/s12916-017-0900-y
47. Dagogo-Jack I, Shaw AT. Tumour Heterogeneity and Resistance to Cancer Therapies. Nat Rev Clin Oncol (2018) 15(2):81–94. doi: 10.1038/nrclinonc.2017.166
48. Marusyk A, Almendro V, Polyak K. Intra-Tumour Heterogeneity: A Looking Glass for Cancer? Nat Rev Cancer (2012) 12(5):323–34. doi: 10.1038/nrc3261
49. Permuth JB, Dezsi KB, Vyas S, Ali KN, Basinski TL, Utuama OA, et al. The Florida Pancreas Collaborative Next-Generation Biobank: Infrastructure to Reduce Disparities and Improve Survival for a Diverse Cohort of Patients With Pancreatic Cancer. Cancers (Basel) (2021) 13(4):1–24. doi: 10.3390/cancers13040809
Keywords: radiomics, cancer disparities, pancreatic cancer, quantitative imaging, blacks
Citation: Permuth JB, Vyas S, Li J, Chen D-T, Jeong D and Choi JW (2021) Comparison of Radiomic Features in a Diverse Cohort of Patients With Pancreatic Ductal Adenocarcinomas. Front. Oncol. 11:712950. doi: 10.3389/fonc.2021.712950
Received: 21 May 2021; Accepted: 05 July 2021;
Published: 22 July 2021.
Edited by:
Farnam Mohebi, University of California, Berkeley, United StatesReviewed by:
Abdelbaset Mohamed Elasbali, Al Jouf University, Saudi ArabiaLuca Falzone, Istituto Nazionale Tumori Fondazione G. Pascale (IRCCS), Italy
Copyright © 2021 Permuth, Vyas, Li, Chen, Jeong and Choi. This is an open-access article distributed under the terms of the Creative Commons Attribution License (CC BY). The use, distribution or reproduction in other forums is permitted, provided the original author(s) and the copyright owner(s) are credited and that the original publication in this journal is cited, in accordance with accepted academic practice. No use, distribution or reproduction is permitted which does not comply with these terms.
*Correspondence: Jennifer B. Permuth, amVubnkucGVybXV0aEBtb2ZmaXR0Lm9yZw==
†These authors have contributed equally to this work and share senior authorship