 Mengya Li1
 Yu Liu1Yajun Liu2Lu Yang1
 Yan Xu1Weiqiong Wang1
 Zhongxing Jiang1
 Yanfang Liu1Shujuan Wang1*
 Chong Wang1*
- 1Department of Hematology, The First Affiliated Hospital of Zhengzhou University, Zhengzhou, China
- 2Department of Orthopaedics, Rhode Island Hospital, Warren Alpert Medical School, Brown University, Providence, RI, United States
Background: The prognosis of acute myeloid leukemia (AML) with a normal karyotype is highly heterogonous, and the current risk stratification is still insufficient to differentiate patients from high-risk to standard-risk. Changes in some genetic profiles may contribute to the poor prognosis of AML. Although the prognostic value of G protein subunit alpha 15 (GNA15) in AML has been reported based on the GEO (Gene Expression Omnibus) database, the prognostic significance of GNA15 has not been verified in clinical samples. The biological functions of GNA15 in AML development remain open to investigation. This study explored the clinical significance, biological effects and molecular mechanism of GNA15 in AML.
Methods: Reverse transcription-quantitative polymerase chain reaction (RT-qPCR) was used to detect the mRNA expression level of GNA15 in blasts of bone marrow specimens from 154 newly diagnosed adult AML patients and 26 healthy volunteers. AML cell lines, Kasumi-1 and SKNO-1, were used for lentiviral transfection. Cell Counting Kit-8 (CCK8) and colony formation assays were used to determine cell proliferation. Cell cycle and apoptosis were analyzed by flow cytometry. The relevant signaling pathways were evaluated by Western blot. The Log-Rank test and Kaplan-Meier were used to evaluate survival rate, and the Cox regression model was used to analyze multivariate analysis. Xenograft tumor mouse model was used for in vivo experiments.
Results: The expression of GNA15 in adult AML was significantly higher than that in healthy individuals. Subjects with high GNA15 expression showed lower overall survival and relapse-free survival in adult AML with normal karyotype. High GNA15 expression was independently correlated with a worse prognosis in multivariate analysis. Knockdown of GNA15 inhibited cell proliferation and cell cycle progression, and induced cell apoptosis in AML cells. GNA15-knockdown induced down-regulation of p-P38 MAPK and its downstream p-MAPKAPK2 and p-CREB. Rescue assays confirmed that P38 MAPK signaling pathway was involved in the inhibition of proliferation mediated by GNA15 knockdown.
Conclusions: In summary, GNA15 was highly expressed in adult AML, and high GNA15 expression was independently correlated with a worse prognosis in adult AML with normal karyotype. Knockdown of GNA15 inhibited the proliferation of AML regulated by the P38 MAPK signaling pathway. Therefore, GNA15 may serve as a potential prognostic marker and a therapeutic target for AML in the future.
Introduction
Acute myeloid leukemia (AML) is a group of heterogeneous clonal hematopoietic progenitor cell neoplasm and the adverse-risk subjects experience poor prognosis (1, 2). Advances in the therapy of AML, such as risk stratification, concurrent chemotherapy, novel drugs and hematopoietic stem cell transplantation, have improved the treatment outcomes of patients (3). Cytogenetic analysis has proved to be crucial for the risk stratification of AML patients (4). However, nearly half of AML patients have a normal karyotype (NK) (4). Identification of the changes in genetic profiles such as mutations of NPM1, FLT3-ITD and CEBPA has further improved the risk stratification of NK-AML. However, most NK-AML still belongs to the intermediate prognostic subgroup in which the most appropriate treatment remains to be defined (4). It is urgent to identify novel prognostic biomarkers and update the risk stratification for NK-AML.
Our group screened and verified 7 new biomarkers of B cell acute lymphoblastic leukemia (B-ALL) based on the ImmuSort database and clinical specimens. G protein subunit alpha 15 (GNA15) is one of the prominent candidates (5). In the process of verification, we found that the expression level of GNA15 in AML was significantly higher than that in B-ALL and normal controls, suggesting that GNA15 may play an important biological role in AML.
The GNA15 gene is located on chromosome 19p13.3, spans approximately 27.7 kb, and encodes a 44 KDa GNA15 protein (6). GNA15 is a member of the GNA gene family (including GNAq, GNA11 and GNA14) (7). The protein encoded by the GNA15 gene is the alpha subunit of the G protein, which participates in the regulation of cell proliferation and apoptosis (8). The GNA15 protein, or Gα15, belongs to the Gαq subfamily and is highly expressed in some cell types, such as hematopoietic stem cells and epithelial cells during specific stages of differentiation. It is up-regulated in CD34+ hematopoietic stem cells and decreases with cell maturation (9, 10). G protein-coupled receptors (GPCRs) are the largest cell surface molecule family involved in signal transmission. It accounts for more than 2% of genes encoded in the human genome (11). Abnormal activation of GPCRs is related to tumor occurrence and metastasis (12). By coupling to GPCRs, GNA15 promotes cell proliferation and inhibits cell apoptosis by regulating downstream signaling pathways (10). GNA15 is known to play as an oncogene in several tumors, such as gastroenteropancreatic neuroendocrine neoplasia (GEP-NEN) (8), liver cancer (13, 14), pancreatic ductal adenocarcinoma (15) and ovarian cancer (16). These biological functions are mediated by ERK, NFκB and Akt signaling pathways in GEP-NEN (8, 13–16). Nevertheless, the clinical value and biological function of GNA15 in AML remain unknown.
Therefore, in this study, we examined the expression and prognostic value of GNA15 in AML and its effects on cellular proliferation, cell cycle and apoptosis. The underlying mechanism of GNA15 regulation was also explored.
Materials and Methods
Database Analyses
We collected the expression data of 263 hematopoietic stem cell (HSC) samples and 113 leukemia stem cell (LSC) in the ImmuCo database (http://immuco.bjmu.edu.cn), 74 peripheral blood mononuclear cell (PBMC) samples, 542 AML samples in the ONCOMINE database (https://www.oncomine.org) and 173 AML samples in the Gene Expression Profiling Interactive Analysis (GEPIA2) database (http://gepia2.cancer-pku.cn), and compared the expression level of GNA15. One publicly available cytogenetically normal AML data sets (GSE12417 of GEO database) were used to perform survival analysis.
Subjects
Bone marrow samples from 154 newly diagnosed AML patients (patients with acute promyelocytic leukemia were excluded) and 26 healthy controls were obtained following informed consent at the First Affiliated Hospital of Zhengzhou University between February 2017 and April 2019. Details of treatment regimens were reported (17). Subjects were followed up until death, loss to follow-up or April 2021. Complete remission, relapse, risk stratification, overall survival (OS) and relapse-free survival (RFS) were defined as described (17). The study was approved by the Ethics Committee of the First Affiliated Hospital of Zhengzhou University and informed consent was obtained according to the Declaration of Helsinki.
Next-Generation Sequencing
The mutational hotspots of genes were assessed by next-generation sequencing. The detection was performed utilizing a Rightongene AML/MDS/MPN Sequencing Panel (Rightongene, Shanghai, China) on an Illumina MiSeq System (Illumina, San Diego, CA) high-throughput sequencing platform. The original data after sequencing was analyzed by bioinformatics using NCBI, CCDS, dbSNP (v138), COSMIC, human genome database (HG19) and other databases to determine the pathogenic mutation site. The average depth of the sequencing was 4837.978Kb, detection sensitivity was ~ 5%.
Cell Lines and Reagents
The human AML cell lines (Kasumi-1, SKNO-1, and HL-60), were purchased from American Type Culture Collection (Manassas, VA, USA). The human ALL cell lines (Sup-B15, BV173, NALM-6, and BALL-1) were obtained from Guangzhou Jennio Biotech Co. Ltd (Guangzhou, China). The human AML cell line HEL, chronic myeloid leukemia cell line K562, the human lymphoma cell line Ramos and the human myeloma cell line KM-3 were kind gifts from Professor K. Y. Liu of Peking University People’s Hospital. These cell lines were maintained in RPMI 1640 medium containing 10% fetal bovine serum (FBS), 1% streptomycin and penicillin (all from Gibco, Billings, MT, USA) at 37 °C with 5% CO2. Cell viability was observed daily with a microscope (Olympus, Ckx53sf, Tokyo, Japan), cell lines (except SKNO-1 cell line) were passaged every 2–3 days and SKNO-1 cells were passaged every 3-4 days. Asiatic Acid (Selleck Chemicals, Houston, TX, USA), was used as a P38 MAPK activator.
Lentiviral Transduction
Kasumi-1 and SKNO-1 (FLT3-wildtype) cells were infected with human GNA15 shRNA lentiviral particles (Genechem, Shanghai, China) or empty control lentiviral particles (Genechem) at a 100 multiplicity of infection (MOI). Media containing lentiviral particles were replaced with a complete medium 12 hours post-infection. Stably transfected Kasumi-1 and SKNO-1 cells were selected with 2 μg/ml and 5 μg/ml puromycin dihydrochloride (Genechem, Shanghai, China) respectively at 72 h post-infection. After 3 weeks of antibiotic selection, stable GNA15-knockdown cells and control cells were obtained. GNA15 expression levels were confirmed by real-time quantitative PCR (RT-qPCR) and Western blot analyses.
RNA Extraction and RT-qPCR
Bone marrow was collected by Ethylene Diamine Tetraacetic Acid (EDTA) anticoagulant tube and mononuclear cells were isolated from bone marrow by density gradient centrifugation. TRIzol® (Invitrogen, Carlsbad, CA, USA) was used to extract total RNA following the manufacturer’s instructions. The cDNA templates were synthesized with a High Capacity cDNA Reverse Transcription Kit (Applied Biosystems, Foster City, CA, USA) (18). Gene transcript levels were determined by the Taqman method as previously reported (19). Serial dilutions of plasmids expressing GNA15 and ABL1 (Genechem) were amplified to construct standard quantification curves. Copy numbers of GNA15 and ABL1 were calculated from standard curves using Ct values. Samples were assayed in duplicates to evaluate data reproducibility. The primers and probe sequences of GNA15 and ABL1 are shown in Supplementary Table 1.
Western Blot Analyses
RIPA lysis buffer (Solarbio, Beijing, China) with Protein phosphatase inhibitor (Biomed, Beijing, China) and phenylmethylsulfonyl fluoride (PMSF, Biomed) was used to extract total protein lysate. Lysates were run on 10% SDS-PAGE gels, and protein bands were transferred to 0.45μm polyvinylidene difluoride (PVDF) membrane (Millipore, Billerica, MA, USA), then blocked with 5% skim milk at room temperature for 1 hour. The membrane was incubated with primary antibodies (GNA15, Novus Biologicals, Centennial, USA, 1:1000; GAPDH, Solarbio, 1:1000; p-P38 MAPK, P38 MAPK, p-CREB, CREB, p-MAPKAPK2Thr222, MAPKAPK2Thr222, p53, cleaved-PARP, cleaved-Caspase3, p27 Kip1, Cyclin D1, CDK4, p-p44/42 MAPK, p-AMPKα, p-Akt, p-Smad3, LC3A/B, Cell Signaling Technology [CST], MA, USA, 1:1000) overnight at 4°C and probed with secondary antibodies (goat anti-rabbit IgG, goat anti-mouse IgG, Solarbio, 1:1000) at room temperature for 1 hour. The immunoreactive bands were defined using Super ECL Prime (US EVERBRIGHT, Suzhou, China).
Cell Proliferation and Colony-Forming Assay
The stably transfected cells were seeded in 96-well plates at a density of 1×10⁵ cells/ml. Then 10 μl of Cell Counting Kit-8 (CCK8, Dojin Laboratories, Kumamoto, Japan) was added into each well after 0, 24, 48, 72 hours. Cell proliferation was detected by a full-wavelength microplate reader at 450 nm 3 hours later. To analyze the colony formation, cells were seeded into 35 mm dishes (6×10³ cells/well) in methylcellulose-based MethoCult medium (STEMCELLTM TECHNOLOGIES, Vancouver, British Columbia, Canada). The colonies with ≥50 cells were counted with an inverted microscope after 10 days of growing in a humid incubator. The experiments were performed three times to show the repeatability of the data.
Cell cycle and Apoptosis Analyses
Cells were seeded into 6-well plates (1×10⁵ cells/ml) and starved by adding serum-free medium for 24 hours to research synchronization, and a complete medium was then added for an additional 48 hours. The Cell Cycle and Apoptosis Kit (US EVERBRIGHT, Suzhou, China) was used for cell cycle analyses and the Annexin V-APC/PI Apoptosis Kit (US EVERBRIGHT) was used as the apoptosis assay. The cell cycle and apoptosis were determined by flow cytometry according to the manufacturer’s instructions.
Xenograft Tumor Mouse Model
Male 6-week-old BALB/c nude mice (Beijing HFK Bioscience Co., Ltd.; Beijing, China) were prepared for generating xenograft models. All mice were divided into two groups (CTRL and KD, 5 mice/group) with intraperitoneal injections of cyclophosphamide (100mg/kg/d × 2d). After two days, the cells (1.5 × 10⁷ cells suspended in 100 μl PBS) with lentiviral particles were syringed in the right flank. We measured the diameters (the longest and shortest diameters) and calculated the volume (L×I2×0.5; L: the longest diameter, I: the shortest diameter) of tumor every other day for 12 days, after that all mice were euthanized and tumor tissues obtained for the following assay. All studies were approved by the Ethics Committee of the First Affiliated Hospital of Zhengzhou University.
Statistical Analyses
Differences across groups were compared using the Pearson Chi-square test or Fisher exact analysis for categorical data and Mann-Whitney U-test or Student’s t-test for continuous variables. The Kaplan-Meier method and Log-Rank test were used for survival analysis. A Cox proportional hazard regression model was used to determine associations between GNA15 transcript levels and OS and RFS. Variables with P < 0.1 in the single variable analysis were included in the model. A two-sided P < 0.05 was considered significant. Analyses were performed by SPSS software version 26.0 (Chicago, IL, USA) and Graphpad Prism™ 8.01 (San Diego, California, USA).
Results
The GNA15 Gene Is Highly Expressed in Subjects With AML
Firstly, we surveyed the expression level of GNA15 in AML based on the database. As shown in Figure 1, the gene expression level of GNA15 was higher in leukemic stem cells than in hematopoietic stem cells based on the ImmuCo database (P<0.0001, Figure 1A). GNA15 expression in AML patients from the Oncomine database was also compared, and similarly, GNA15 showed significantly higher expression in AML patients than normal peripheral blood mononuclear samples (PBMC, P=3.62×10-37, Figure 1B). Furthermore, by using the public GEPIA2 database, we also observed elevated GNA15 expression levels in AML (Figure 1C). Thus, we surveyed the transcript levels of GNA15 in the bone marrow of newly diagnosed subjects with AML and normal healthy volunteers. The expression of GNA15 in AML was significantly higher than healthy volunteers and ALL in our cohort (median 810.00%, range [67.87%-6630.48%] vs 209.15% range [0-1073.74%], P<0.0001; 810.00%, range [67.87%-6630.48%] vs 520.55% range [13.64%-5205.27%], P=0.0003; Figure 1D). AML with FLT3-ITD mutation had higher GNA15 transcript levels than those without FLT3-ITD mutation (889.85% [171.59%-3351.42%] vs 625.16% [67.87%-1656.21%], P=0.0002, Figure 1E). AML with AML1-ETO fusion gene had lower transcript levels than those without AML1-ETO fusion gene (456.58% [86.78%-1306.69%] vs 941.28% [67.87%-6630.48%], P=0.0037; Figure 1F). The transcript levels of GNA15 showed no difference in AML with different French-America-British (FAB) classification or cytogenetic risk stratifications (Supplementary Figure 1).
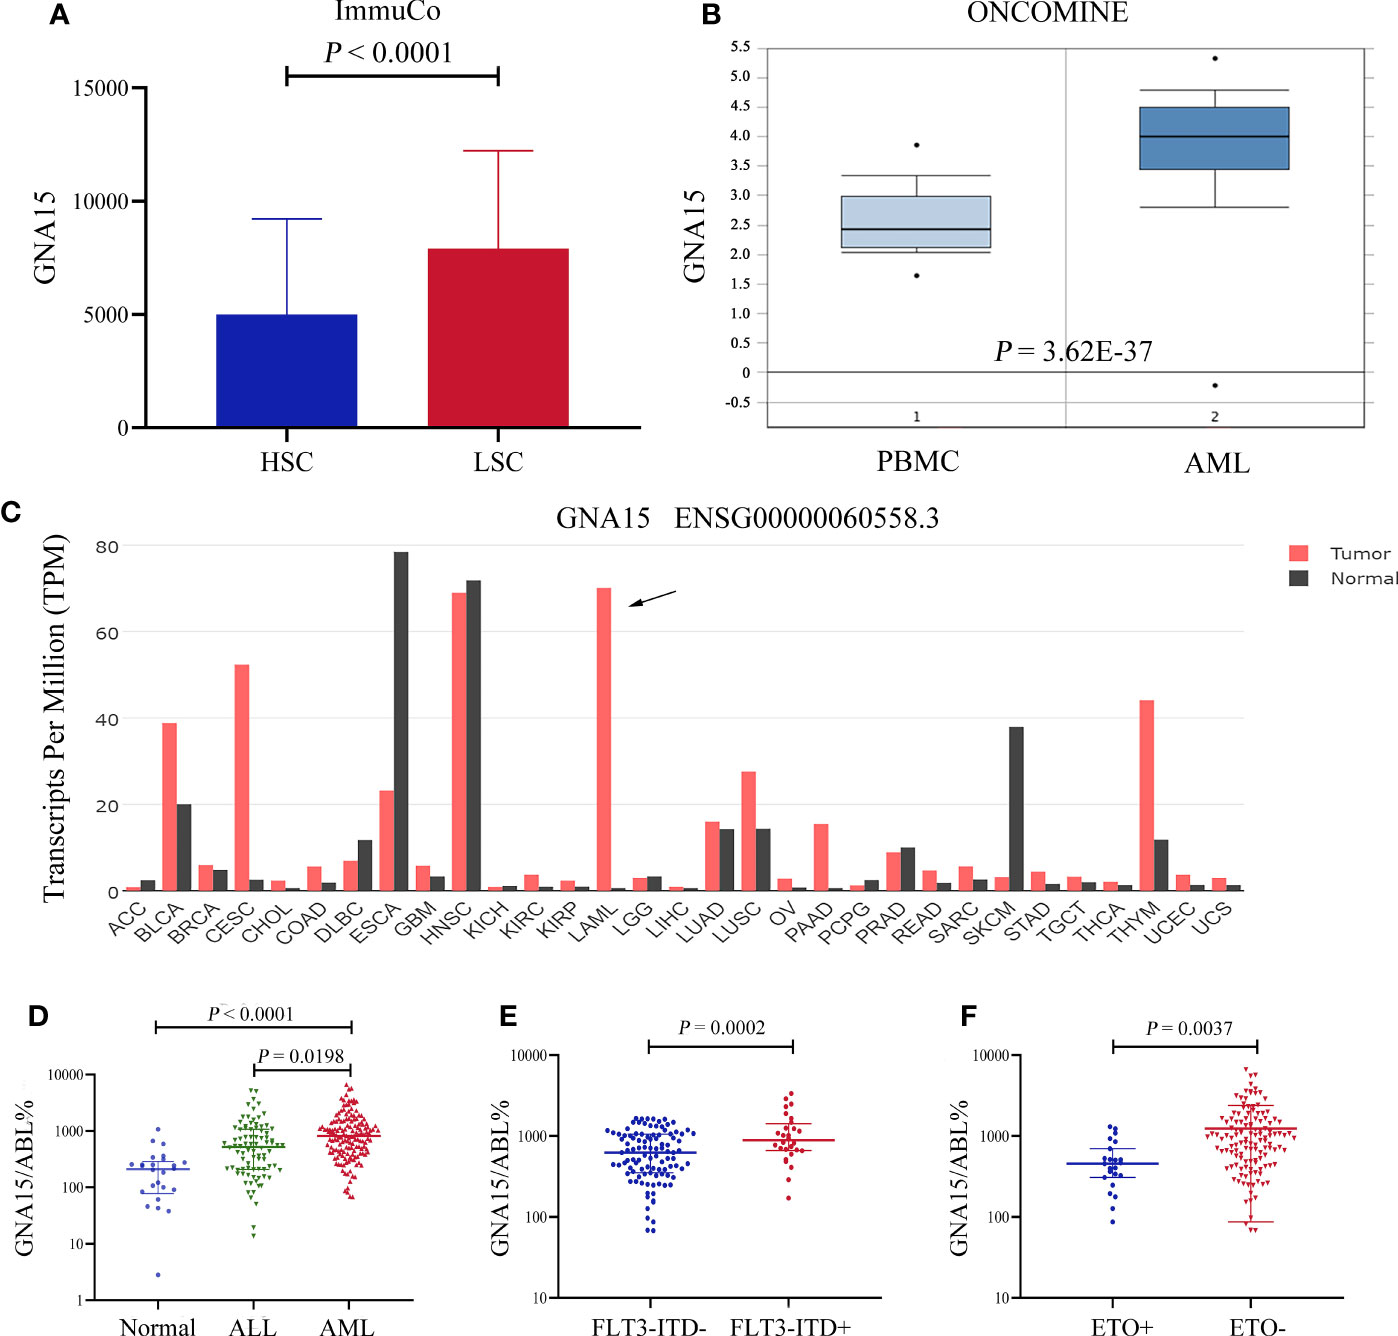
Figure 1 The GNA15 gene was highly expressed in subjects with acute myeloid leukemia (AML). (A) In the ImmuCo database, the gene expression level of GNA15 was higher in leukemic stem cells (LSC, n=113) than in hematopoietic stem cells (HSC, n=263). (B) In the ONCOMINE database, GNA15 showed significantly higher expression in AML patients (n=542) than in normal peripheral blood mononuclear samples (PBMC, n=74). (C) The expression of GNA15 in various cancers and normal tissues was significantly different and GNA15 was overexpressed in AML in the GEPIA2 database. The height of the bar represents the median expression of GNA15 of a certain tumor or normal tissue. (D) GNA15 transcript levels in normal volunteers, acute lymphoblastic leukemia (ALL) and AML. (E) GNA15 transcript levels in AML with or without FLT3-ITD mutation. (F) GNA15 transcript levels in AML with or without AML1-ETO fusion gene. Error bars indicate median with interquartile range (D–F).
GNA15 Transcript Levels Are Independently Associated With OS and RFS in AML With Normal Karyotype
Subjects in the GSE12417 database (AML with normal karyotype) were divided into the high expression group and the low expression group according to the median expression value of GNA15. Subjects with high expression of GNA15 showed a relatively worse 3-year OS than the subjects with low expression of GNA15 (20.3% [10.1%-30.5%] vs 43.1% [31.5%-54.7%], P=0.0009, Figure 2A) in the GSE12417 database. In our AML cohort, AML patients were classified into the high expression group and the low expression group according to the median value of GNA15 (810.00%). The median follow-up of these 154 patients was 410 days (range 14–1057 days). In the whole cohort, the 2-year OS between low expression group and high expression group showed no significant difference (40.4%, 95% confidence interval (CI) [28.8%-52.0%] vs 38.2% [26.2%-50.2%], P=0.564, Figure 2B). Then we analyzed the prognostic value of GNA15 in the subgroup with normal karyotype (NK, n=50). In the NK-AML subgroup, subjects in the high expression group were older,had higher expression of Wilms tumor gene 1 (WT1) at diagnosis and higher minimal residual disease (MRD) levels after a course of induction chemotherapy (Table 1). However, there was no significant correlation between the level of GNA15 expression and other clinical characteristics, including risk groups, gender, platelets, hemoglobin level, gene mutations and transplant (Table 1). In the NK-AML subgroup, subjects with high GNA15 expression showed a worse 2-year OS and RFS than subjects with low GNA15 expression (OS: 15.1% [0%-30.8%] vs 49.7% [28.1%-71.3%], P=0.0046; RFS: 24.1% [0%-49.8%] vs 49.4% [26.7%-72.1%], P=0.0409; Figures 2C, D). Moreover, in the NK-AML without FLT3-ITD mutations, subjects with high GNA15 expression showed a worse 2-year OS (13.7% [0%-50.7%] vs 44.5% [18.2%-70.8%], P=0.0115; Figure 2E) and a similar 2-year RFS (32.3% [0%-65.0%] vs 40.6% [13.6%-67.6%], P=0.1715; Figure 2F). In multivariate analysis, high GNA15 expression was independently associated with a worse OS and RFS (Table 2). Female was independently associated with a better OS and RFS (Table 2). Other factors, such as age, risk group, WT1 expression, FLT3-ITD mutation and other gene mutations did not show any significant correlation with OS or RFS.
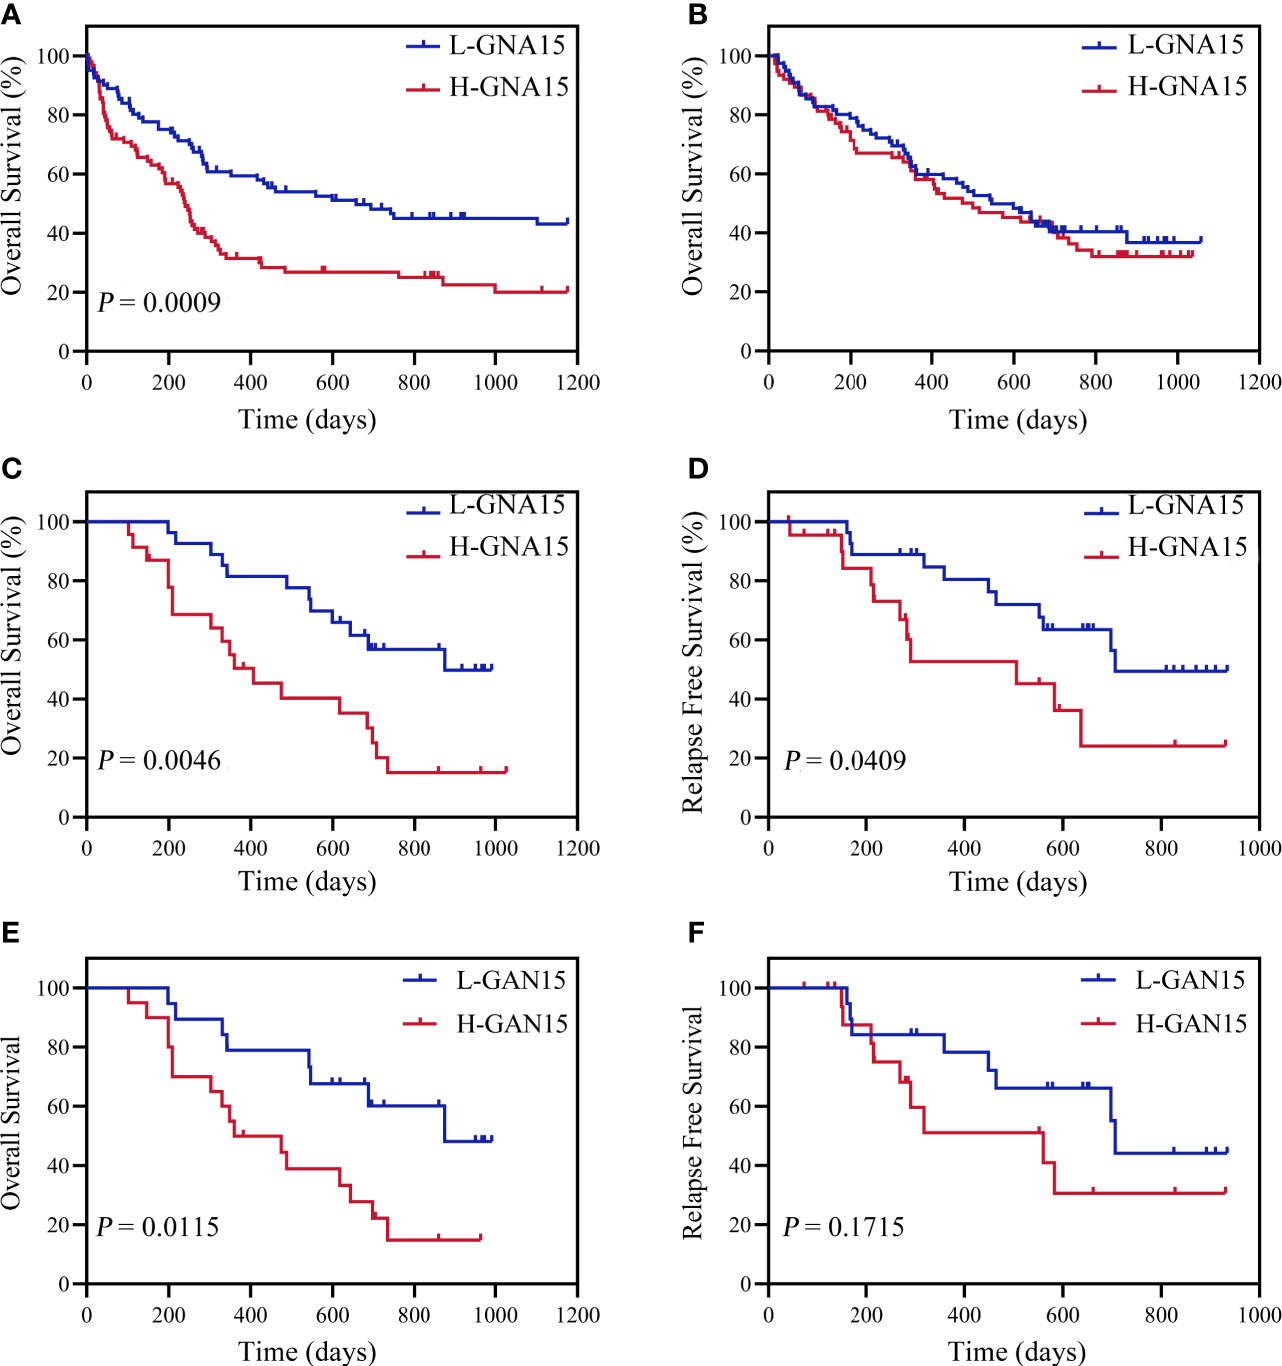
Figure 2 Overall survival (OS) and relapse free survival (RFS) of adult subjects with AML according to GNA15. (A) OS of 163 AML subjects with normal karyotype in GSE12417. (B) OS of 154 AML subjects in our cohort. (C, D) OS (C) and RFS (D) of 50 AML subjects with normal karyotype in our cohort. (E, F) OS (E) and RFS (F) of 39 FLT3-ITD-negative subjects in NK-AML cohort according to GNA15. H-GNA15, high GNA15 expression; L-GNA15, low GNA15 expression.
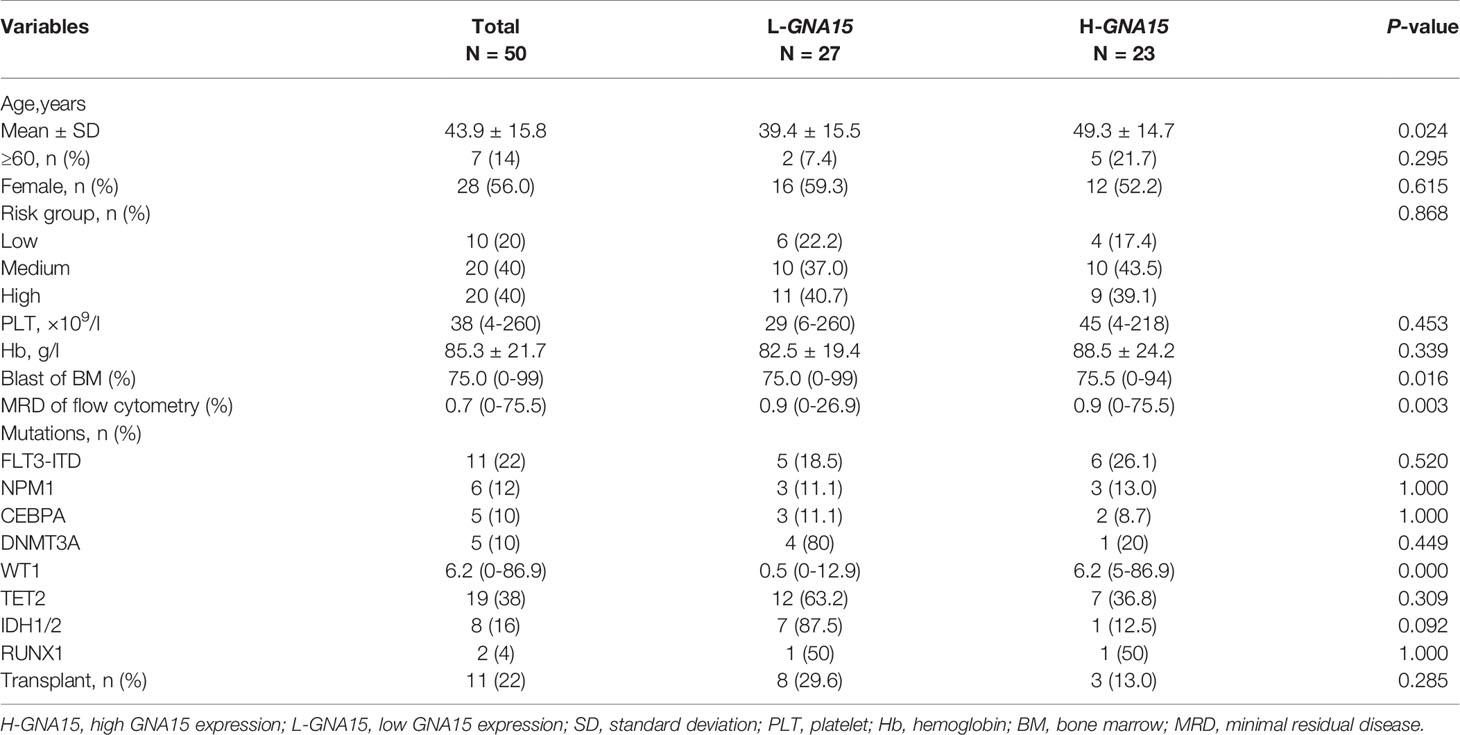
Table 1 Relationship between Transcription Level of GNA15 and Clinical Characteristics in Normal Karyotype AML.
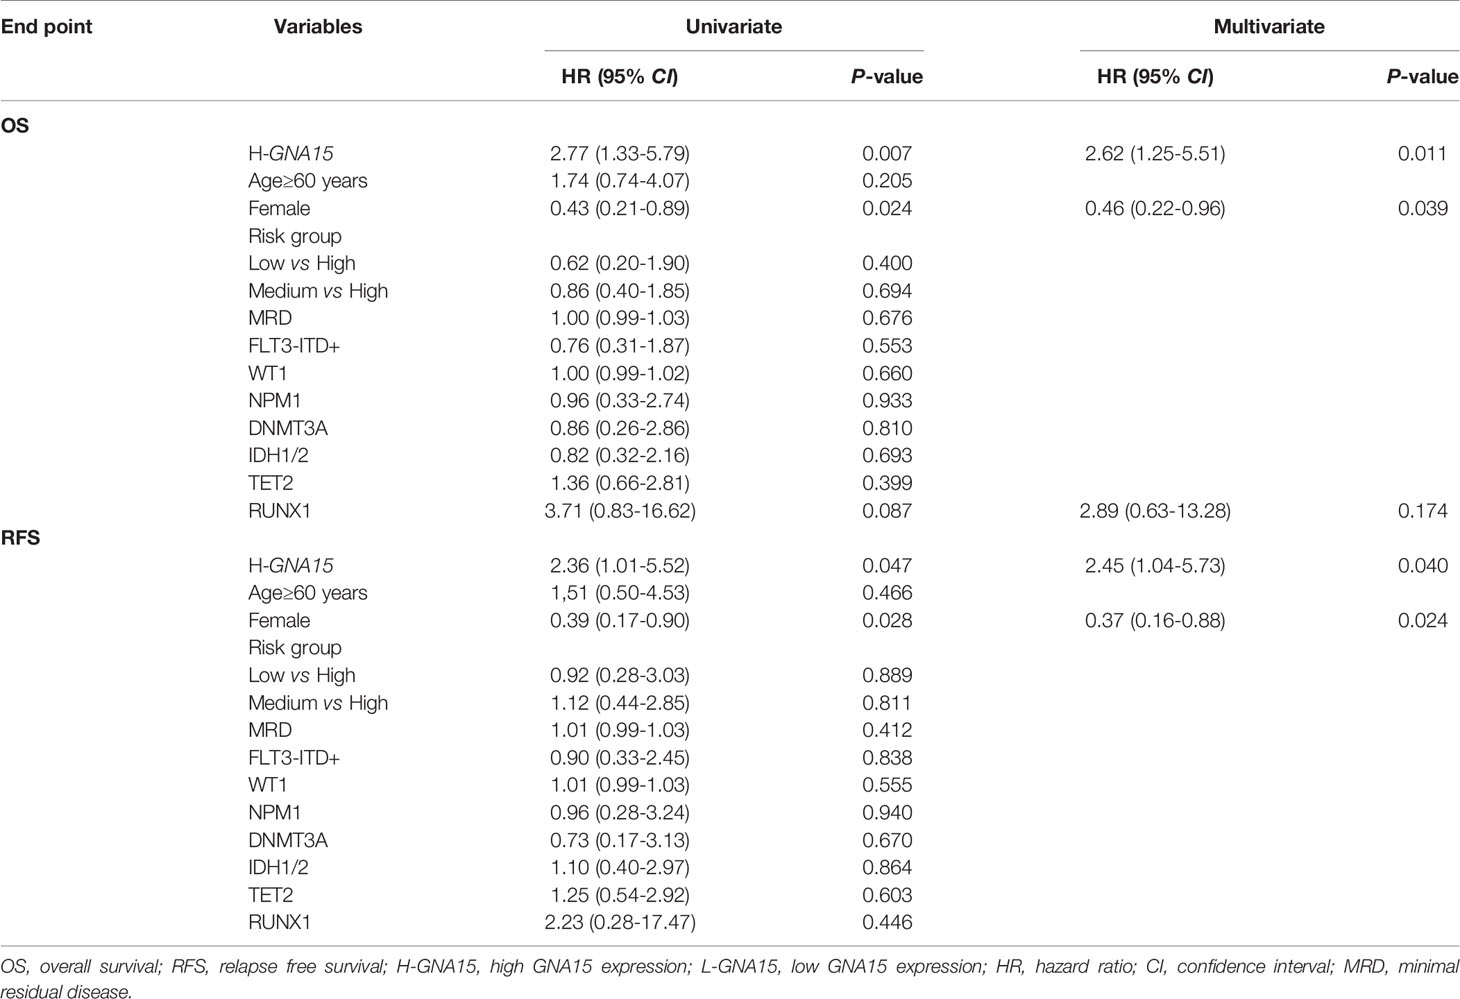
Table 2 Univariate and Multivariate Analysis of OS and RFS in AML with Normal Karyotype.
Down-Regulation of GNA15 Inhibits Cell Proliferation and Colony Formation in AML Cells
We quantified the transcriptional level and protein level of GNA15 in cell lines of hematological malignancies. RT-qPCR and Western blot analysis revealed that GNA15 is highly expressed in nearly all acute leukemia cell lines tested while lowly expressed in lymphoma and myeloma cell lines and normal controls (Supplementary Table 2 and Supplementary Figure 2). Cell lines with stable GNA15 knockdown and control cell lines using lentiviral small hairpin RNAs were constructed in Kasumi-1 and SKNO-1, and the knockdown efficiency was assessed by RT-qPCR (Figures 3A, B) and Western blot (Figures 3C, F). CCK8 analysis revealed a significant reduction in cell viability in both Kasumi-1 and SKNO-1 following GNA15 knockdown (Figures 3D, E). Moreover, the knockdown of GNA15 dramatically inhibited the cell colony formation ability in Kasumi-1 (Figures 3G–I). SKNO-1 control and knockdown cells failed to complete the colony formation test.
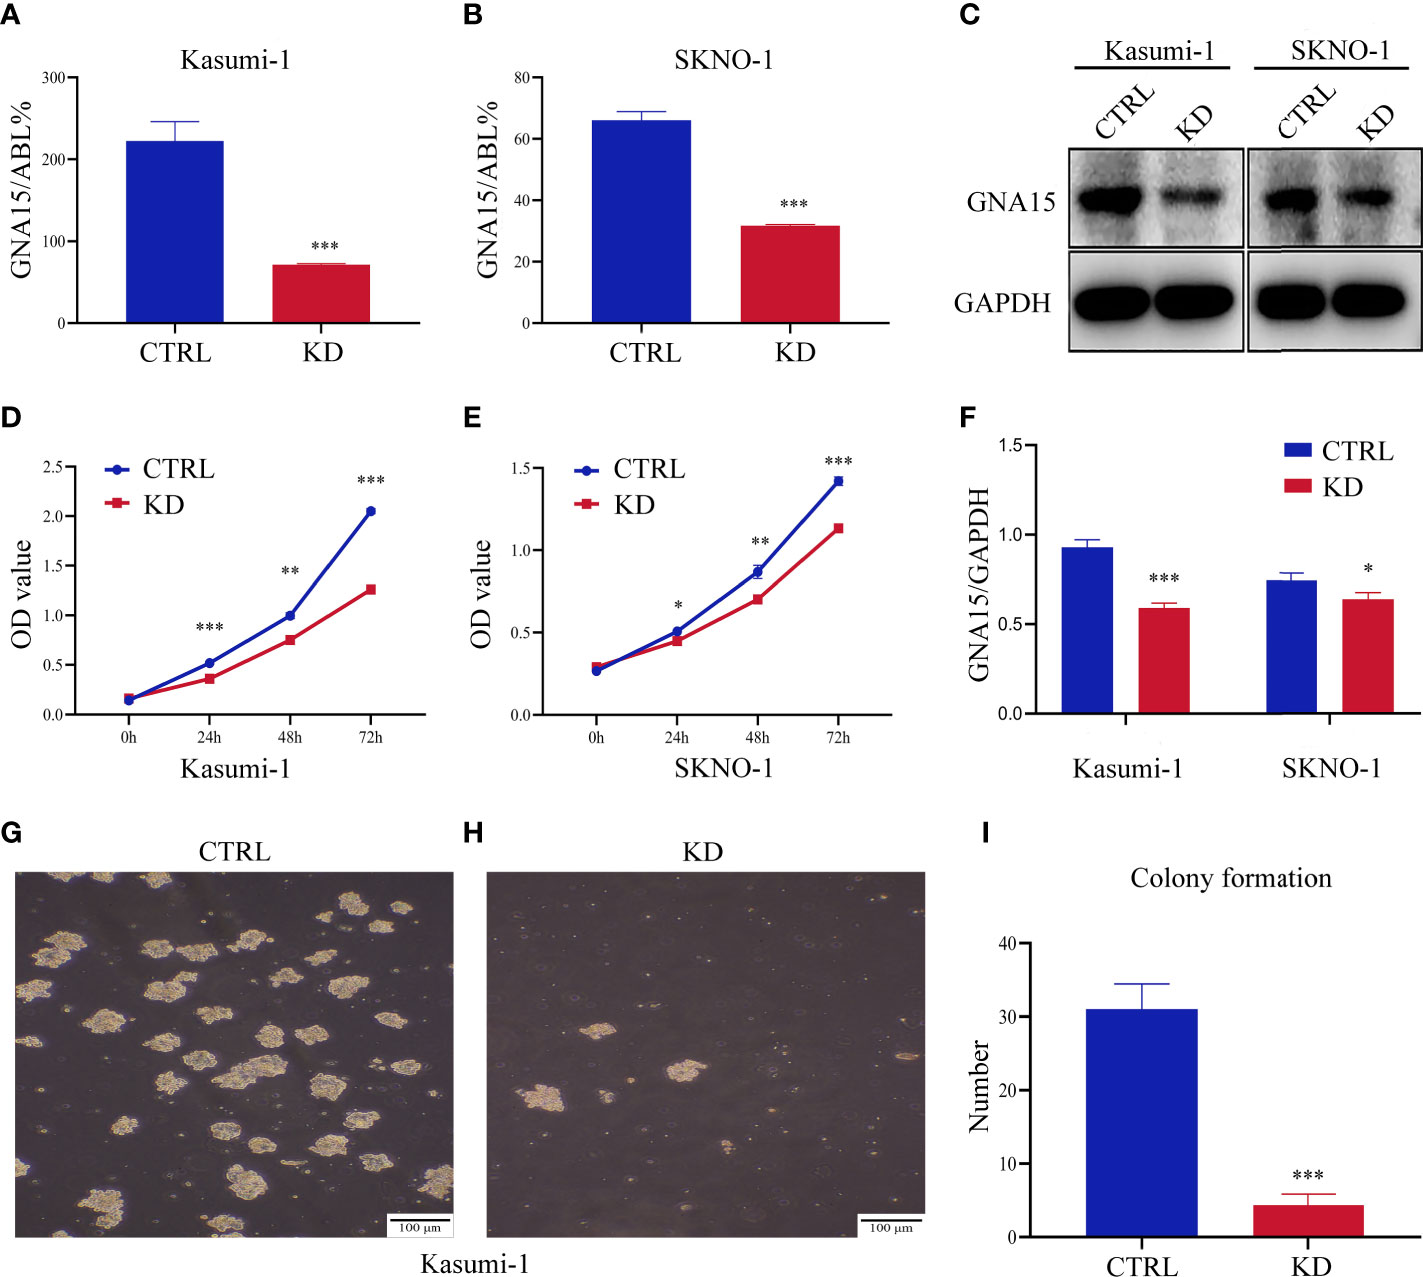
Figure 3 Down-regulation of GNA15 inhibited cell proliferation and colony formation in AML cells. The efficiency of GNA15 knockdown in the Kasumi-1 and SKNO-1 cell lines was verified by (A, B) real-time quantitative polymerase chain reaction and (C, F) Western blot, respectively. (D, E) Cell proliferation was detected by the CCK-8 assay in Kasumi-1 and SKNO-1. (G–I) The colony formation of GNA15-CTRL and GNA15-KD in Kasumi-1. CTRL, control; KD, knockdown; *P < 0.05 compared with CTRL cells; **P < 0.01 compared with CTRL cells; ***P < 0.001 compared with CTRL cells; Error bars indicate the standard deviation.
Knockdown of GNA15 Promotes Cell Cycle Arrest and Induces Apoptosis of AML Cells
Flow cytometry analysis showed that knockdown of GNA15 significantly increased the apoptosis rate in both Kasumi-1 and SKNO-1 cells (Figures 4A, B). In addition, compared to the control group, knockdown of GNA15 significantly increased cell counts in the G0/G1 phase in both Kasumi-1 and SKNO-1 and decreased cell counts in the G2/M phase in Kasumi-1(Figures 4C–E). To further explore the effect of GNA15 knockdown on cell apoptosis and cell cycle, Western blot was used to evaluate proteins related to cell cycle and apoptosis. Knockdown of GNA15 resulted in an increase in cleaved-PARP, cleaved-Caspase3, p53 and p27 and a significant decrease in Cyclin D1 but no change in CDK4 (Figure 4F).
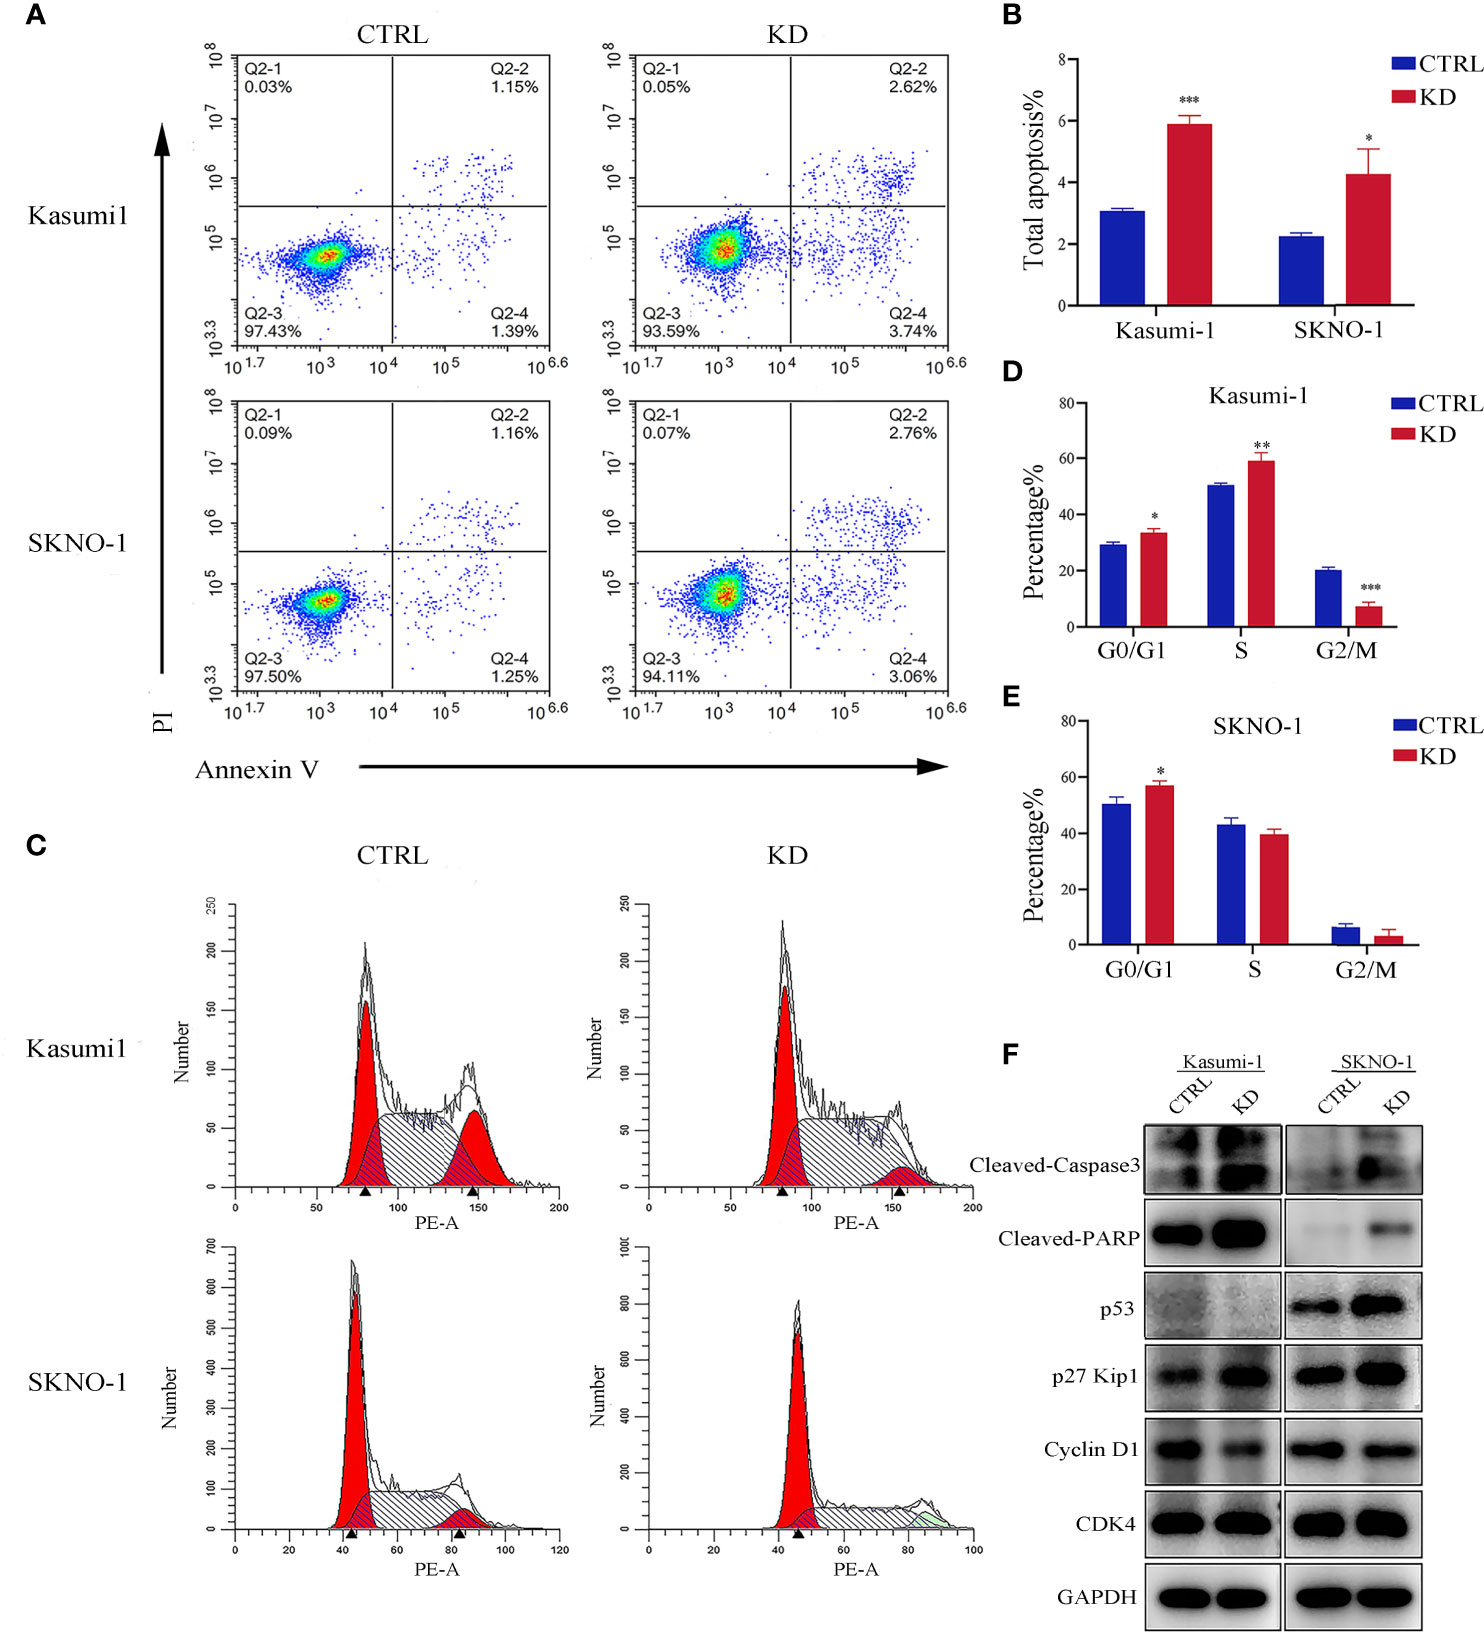
Figure 4 Apoptosis and cell cycle analysis in AML cell lines. (A, B) The flow cytometry was utilized to analyze apoptosis in GNA15 knockdown cells compared with control. (C–E) Cell cycle was determined with propidium iodide (PI) staining in CTRL and KD cells. (F) Alterations in apoptosis and cell cycle-related protein assay in GNA15-KD cells compared to those of their vector controls. CTRL, control; KD, knockdown; *P < 0.05 compared with CTRL cells; **P < 0.01 compared with CTRL cells; ***P < 0.001 compared with CTRL cells.
P38 MAPK Pathway Is Critical for GNA15-mediated Changes
To understand the mechanism behind the reduction in cell proliferation of GNA15 knockdown, we examined the expression levels of phosphorylated proteins related to proliferation, metabolism, and autophagy. As shown in Figure 5, phosphorylation of P38 MAPK, MAPKAPK2Thr222 and CREB were notably decreased in GNA15-KD cells whereas phosphorylation of AMPK, Akt, Smad3, ERK and LC3 A/B were not significantly different (Figures 5A, B). To confirm the role of the P38 MAPK pathway in GNA15-mediated effects, we used Asiatic Acid, a P38 MAPK activator in GNA15-KD cells of Kasumi-1. As shown in Figure 5C, the addition of the P38 MAPK activator (2.5μM, 5μM, 10μM for 48 hours) could visibly increase the protein level of p-P38MAPK and the downstream p-MAPKAPK2Thr222. Phosphorylation of P38 MAPK after adding Asiatic Acid reversed the inhibitory effect of GNA15 knockdown on the proliferation of AML cells (Figures 5D–G).
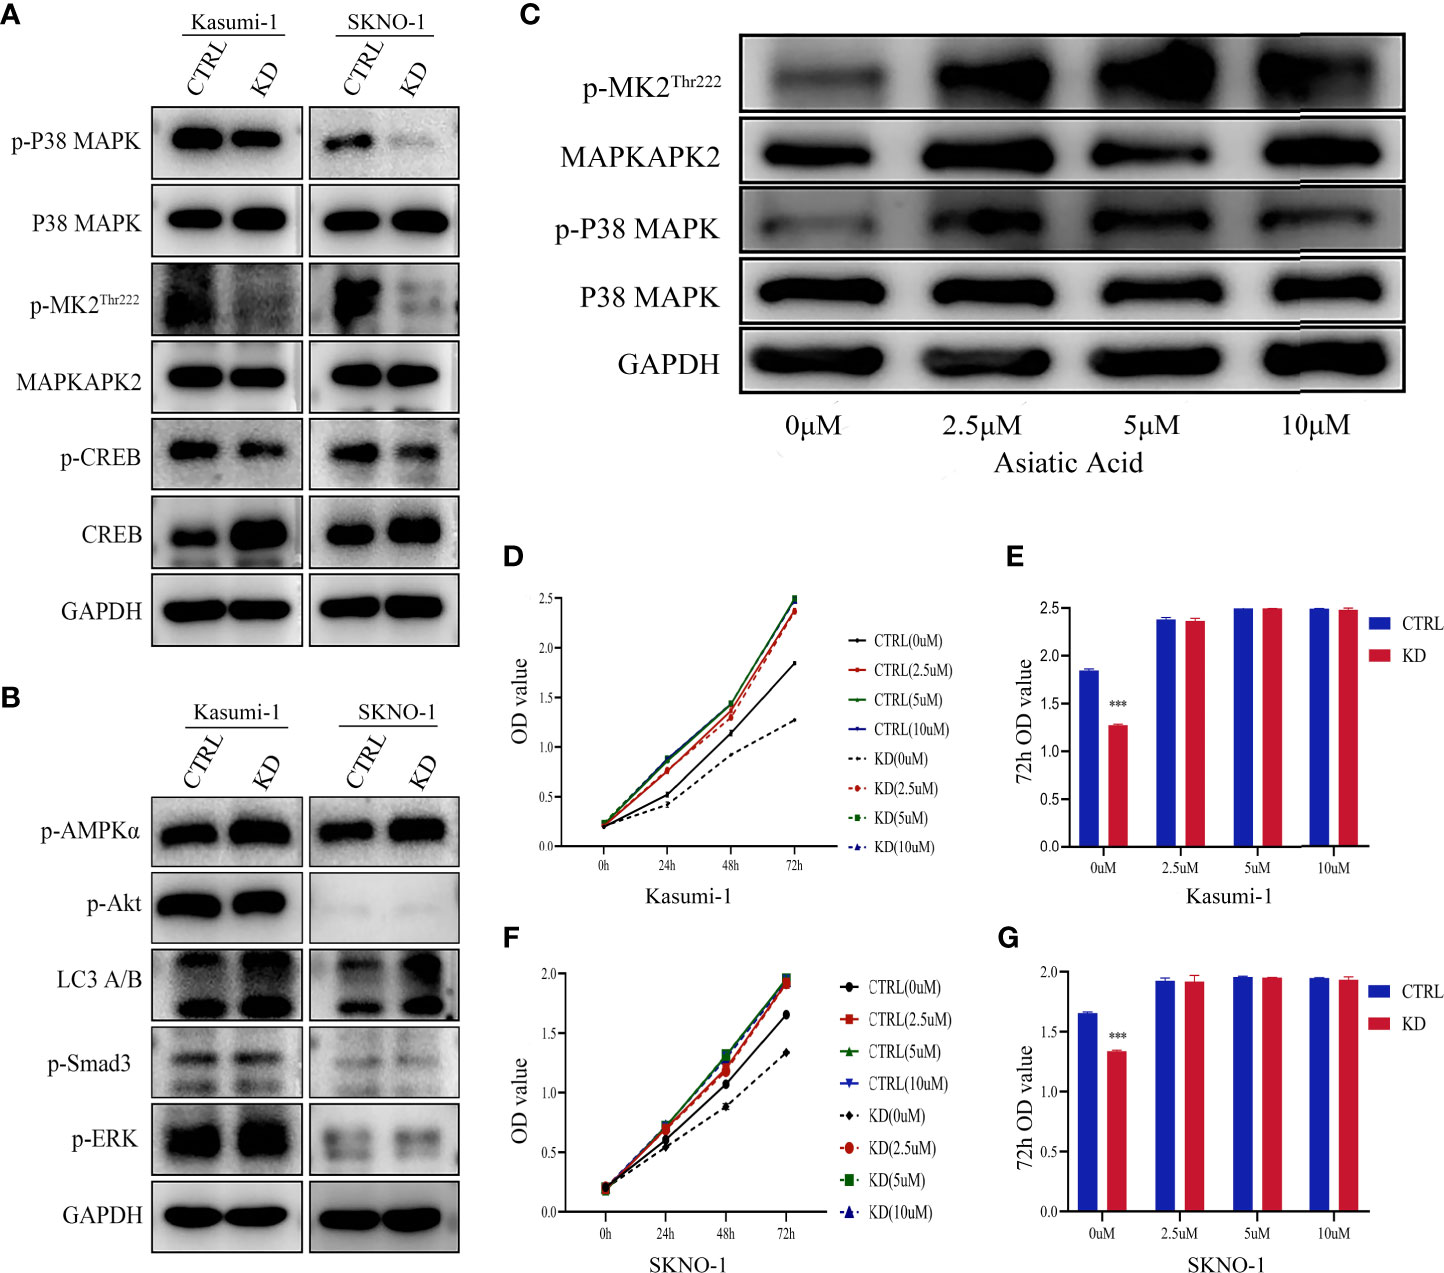
Figure 5 P38 MAPK pathway is critical for GNA15-mediated alterations. (A) Western blot analysis of P38 MAPK pathway in GNA15-KD cells and controls. (B) Western blot analysis of other proliferation- and metabolism-related proteins in GNA15-KD cells and controls. (C) The upregulation of P38 MAPK signaling pathway by Asiatic Acid (P38 MAPK activator) in GNA15-KD cells of Kasumi-1. (D, F) Asiatic Acid (2.5μM, 5μM, 10μM) reversed the inhibitory effect of GNA15 knockdown on the proliferation of Kasumi-1 (D) and SKNO-1 (F). (E, G) Asiatic Acid (2.5μM, 5μM, 10μM) reversed the inhibitory effect of GNA15 knockdown on the proliferation of Kasumi-1 (E) and SKNO-1 (G) at 72h. CTRL, control; KD, knockdown; p-MK2Thr222: p-MAPKAPK2Thr222; ***P < 0.001 compared with CTRL cells; Error bars indicate the standard deviation.
Knockdown of GNA15 Inhibits the Growth of Tumor Tissues In Vivo
Xenograft tumor model was used to verify the results of functional experiments and changes in signaling pathways in vitro. Our study showed that in Kasumi-1 cells, GNA15 knockdown significantly inhibited the growth of tumors compared to controls (Figures 6A, C). The inhibitory effect was also verified in SKNO-1 cells (Figures 6B, D). Western blot was performed to investigate the mechanism of change, GNA15, p-P38 MAPK, p-MAPKAPK2Thr222 were significantly decreased (Figure 6E). These changes in the signaling pathway were the same as the results in vitro.
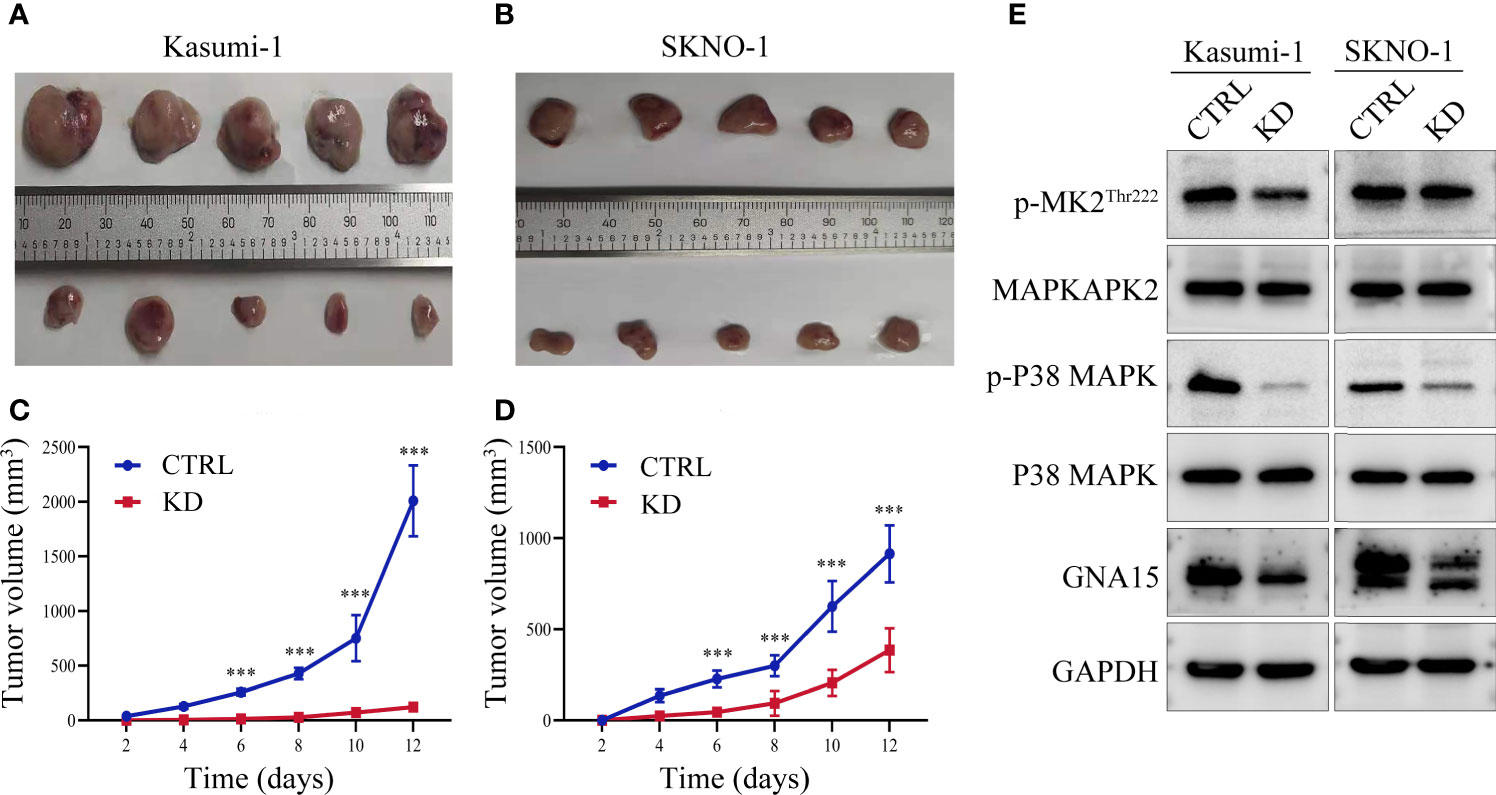
Figure 6 GNA15 knockdown reduces the proliferation ability of AML cells in nude mice by inhibiting the P38 MAPK signaling pathway. (A–D) GNA15-KD inhibits tumor growth in Kasumi-1 and SKNO-1 cells. (E) The expression of P38 MAPK signaling pathway proteins in tumor tissues by Western blot. CTRL, control; KD, knockdown; ***P < 0.001 compared with CTRL cells. Error bars indicate the standard deviation.
Discussion
In this study, we evaluated the role of GNA15 in predicting the prognosis of adult AML patients and investigated its molecular mechanism. Based on the bioinformatics analyses and our data, we found that the expression level of GNA15 in AML was significantly higher than that of normal controls. The high expression of GNA15 was independently associated with worse survival in AML with normal karyotype. GNA15 knockdown inhibited cell proliferation and colony formation, induced cell apoptosis, and promoted cell cycle arrest in AML cell lines, and decreased cell proliferation through inhibiting the P38 MAPK pathway.
There are few studies on GNA15, and its effect on cancer was reported even less frequently. A study based on bioinformatics analysis suggested that GNA15 may be related to ovarian cancer, but it has not been clinically and experimentally verified (16). The high expression of GNA15 was associated with poor survival in small intestinal neuroendocrine neoplasia (8). de Jonge et al. reported that GNA15 may be a specific marker of AML leukemia stem cells based on gene expression profile analysis of bone marrow CD34(+) and CD34(-) cells of AML patients and normal bone marrow CD34(+) cells (9). Their study suggested that GNA15 can be used as a new marker for prognostic evaluation of AML with normal karyotype. However, the prognostic study of this study was based solely on the GEO database. Thus the prognostic significance of GNA15 has not been verified in clinical samples, and the function and mechanism of GNA15 in AML have not yet been studied.
In our study, we found that the expression of GNA15 in acute leukemia was significantly higher than that in controls, and the expression of GNA15 in AML was significantly higher than that in ALL. In addition, we found that the expression of GNA15 in AML patients with FLT3-ITD (FMS-like tyrosine kinase-3 internal tandem duplications) was significantly higher than those without FLT3-ITD. Patients with FLT3-ITD account for 20% to 30% of AML (20), and often have a poor prognosis (21–23). Therefore, patients with high GNA15 expression are more likely to have FLT3-ITD mutation, which may be one of the reasons for the adverse outcomes. There was no significant difference in the survival analysis of GNA15 expression in the entire cohort, which may be caused by the complicated prognostic analysis of AML. For example, the application of hematopoietic stem cell transplantation, targeted drugs and immunotherapy could greatly improve the prognosis of high-risk patients (24, 25). Therefore, we further performed the prognostic analysis in adult AML with normal karyotype and found that high GNA15 expression was independently associated with poor OS and RFS in this subgroup, which was consistent with the survival analysis results of the GEO database. It is worth noting that FLT3-ITD mutations, which constitute well-established negative prognostic factor, did not show significant correlation with OS and RFS. In our NK-AML cohort, there are 11 cases with FLT3-ITD, 4 of them had NPM1 co-mutation and 2 of them received an allo-transplant. That may partially explain why FLT3-ITD mutations did not show significant correlation with OS and RFS. In order to solve the possible confounding factor of FLT3-ITD mutations, we performed a subgroup analysis of NK-AML without FLT3-ITD mutations and found that subjects with high GNA15 expression also showed a worse OS in NK-AML without FLT3-ITD mutations. These results indicate that GNA15 may be used as a potential marker for predicting survival and recurrence of AML patients, especially for patients with normal karyotype.
GNA15 participates in a variety of biological processes through interactions with a diverse set of cellular targets (26). Zanini et al. showed that down-regulation of GNA15 significantly inhibited cell proliferation in small intestinal neuroendocrine neoplasia, and the expression levels of cell cycle-dependent kinase inhibitors p16 and p21 were significantly reduced (8). In this study, we also found that the down-regulation of GNA15 significantly inhibited proliferation and colony formation of AML cell lines, an increased proportion of apoptotic cells, and inhibited cell cycle progression. These results indicate that GNA15 plays an oncogene role in AML and is likely to become the potential therapeutic target of AML.
To further explore the mechanism of the biological function, we studied the changes in important signaling pathways related to proliferation, metabolism and autophagy in AML cell lines. Mitogen-activated protein kinase (MAPK) is one of the main signaling pathways mediating the growth and survival of tumor cells and plays important roles in regulating cell proliferation, cell cycle, apoptosis, migration and invasion (27–29). Our results revealed that the phosphorylated P38 MAPK was significantly reduced in the GNA15-KD cells, while the phosphorylated ERK, AMPKα, Smad3, Akt and LC3 A/B showed no change. The results indicated that the P38 MAPK pathway was involved in inhibiting the proliferation of AML mediated by GNA15 knockdown. MAPK-activated protein kinase (MAPKAPK2) is a target of P38 MAPK and acts directly after phosphorylation of P38 MAPK, under stress conditions (30, 31). cAMP-response element binding protein (CREB) is a bZIP transcription factor that can be activated by phosphorylated kinases such as MAPKAPK2, and then it activates the target gene through cAMP response elements to further mediate many physiological signaling transmission and regulate various cellular responses (32–34). Our research found that GNA15 knockdown inhibited the expression of p-P38 MAPK and its downstream p- MAPKAPK2 and p-CREB, confirming that GNA15 knockdown inhibits the activation of the p38 MAPK pathway. Moreover, a MAPK activator, Asiatic Acid, increased the protein level of p-P38MAPK and the downstream p- MAPKAPK2Thr222, which in turn ameliorated the suppressed proliferation caused by GNA15 knockdown. The xenograft tumor mouse model also showed that GAN15 affects the growth of tumor tissues in vivo by regulating the P38 MAPK pathway. These results suggest that GNA15 could modulate the growth and survival of AML cells by regulating the P38 MAPK pathway.
There are several limitations to our study. Firstly, our study was retrospective, and the inherent biases should not be neglected. The second limitation is the small sample size, especially in the subgroup analysis. Also, there is the potential for an interaction between GNA15 transcript levels and gene mutation including FLT3-ITD. Due to these limitations, our present conclusions need to be further validated in prospectively randomized studies with large samples.
Conclusions
In summary, our research indicated that GNA15 was highly expressed in adult AML, and the high expression of GNA15 was independently correlated with worse OS and RFS in adult AML with normal karyotype. In addition, GNA15 knockdown inhibited cell proliferation, promoted cell cycle arrest, and induced apoptosis of AML cells. Moreover, GNA15 modulated the growth of AML cells by regulating the P38 MAPK signaling pathway. Although the detailed mechanisms still require further investigation, our current research suggests GNA15 may serve as a potential prognostic marker and a therapeutic target for AML in the future.
Data Availability Statement
Publicly available datasets were analyzed in this study. This data can be found here: http://immuco.bjmu.edu.cn https://www.oncomine.org.
Ethics Statement
The studies involving human participants were reviewed and approved by the Ethics Committee of the First Affiliated Hospital of Zhengzhou University. Written informed consent for participation was not required for this study in accordance with the national legislation and the institutional requirements. The animal study was reviewed and approved by the Ethics Committee of the Zhengzhou University Animal Center.
Author Contributions
Conceptualization and design: CW, SW, and YFL. Data acquisition: ML, YL, LY, YX, and WW. Methodology: SW and LY. Data analysis and interpretation: ML, CW, and SW; Writing (original draft): ML. Writing (review and editing): SW, CW, and YJL. Project administration: CW, SW, and ZJ.
Funding
This work was supported by the National Natural Science Foundation of China [grant number 81800137 and U1804191] and Henan Medical Science and Technique Foundation (grant number 2018020068).
Conflict of Interest
The authors declare that the research was conducted in the absence of any commercial or financial relationships that could be construed as a potential conflict of interest.
Publisher’s Note
All claims expressed in this article are solely those of the authors and do not necessarily represent those of their affiliated organizations, or those of the publisher, the editors and the reviewers. Any product that may be evaluated in this article, or claim that may be made by its manufacturer, is not guaranteed or endorsed by the publisher.
Acknowledgments
We thank all the treating physicians for allowing us to enroll their patients and the patients for allowing us to analyze their data.
Supplementary Material
The Supplementary Material for this article can be found online at: https://www.frontiersin.org/articles/10.3389/fonc.2021.724435/full#supplementary-material
Abbreviations
AML, acute myeloid leukemia; BM, bone marrow; CCK8, Cell Counting Kit-8; CREB, cAMP-response element binding protein; DEG, differentially expressed gene; DAVID, The Database for Annotation, Visualization and Integrated Discovery; FLT3-ITD, FMS-like tyrosine kinase-3 internal tandem duplications; GNA15, guanine nucleotide binding protein subunit alpha-15; GEO, Gene Expression Omnibus; GO, gene ontology; HSC, hematopoietic stem cell; IST, in silico transcriptomics database; KEGG, Kyoto Encyclopedia of Genes and Genomes; LSC, leukemia stem cell; MAPK, mitogen-activated protein kinase; MAPKAPK2, MAPK-activated protein kinase 2; OS, overall survival; PBMC, peripheral blood mononuclear cell; RFS, relapse-free survival; RT-qPCR, reverse transcription-quantitative polymerase chain reaction.
References
1. Chen Y, Cortes J, Estrov Z, Faderl S, Qiao W, Abruzzo L, et al. Persistence of Cytogenetic Abnormalities at Complete Remission After Induction in Patients With Acute Myeloid Leukemia: Prognostic Significance and the Potential Role of Allogeneic Stem-Cell Transplantation. J Clin Oncol Off J Am Soc Clin Oncol (2011) 29:2507–13. doi: 10.1200/JCO.2010.34.2873
2. Vandewalle V, Essaghir A, Bollaert E, Lenglez S, Graux C, Schoemans H, et al. miR-15a-5p and miR-21-5p Contribute to Chemoresistance in Cytogenetically Normal Acute Myeloid Leukaemia by Targeting PDCD4, ARL2 and BTG2. J Cell Mol Med (2021) 25:575–85. doi: 10.1111/jcmm.16110
3. Fehniger TA, Uy GL, Trinkaus K, Nelson AD, Demland J, Abboud CN, et al. A Phase 2 Study of High-Dose Lenalidomide as Initial Therapy for Older Patients With Acute Myeloid Leukemia. Blood (2011) 117:1828–33. doi: 10.1182/blood-2010-07-297143
4. Salmoiraghi S, Cavagna R, Zanghì P, Pavoni C, Michelato A, Buklijas K, et al. High Throughput Molecular Characterization of Normal Karyotype Acute Myeloid Leukemia in the Context of the Prospective Trial 02/06 of the Northern Italy Leukemia Group (NILG). Cancers (Basel) (2020) 12:2242. doi: 10.3390/cancers12082242
5. Wang SJ, Wang PZ, Gale RP, Qin YZ, Liu YR, Lai YY, et al. Cysteine and Glycine-Rich Protein 2 (CSRP2) Transcript Levels Correlate With Leukemia Relapse and Leukemia-Free Survival in Adults With B-Cell Acute Lymphoblastic Leukemia and Normal Cytogenetics. Oncotarget (2017) 8:35984–6000. doi: 10.18632/oncotarget.16416
6. Amatruda TT 3rd, Steele DA, Slepak VZ, Simon MI. G Alpha 16, a G Protein Alpha Subunit Specifically Expressed in Hematopoietic Cells. Proc Natl Acad Sci U S A (1991) 88:5587–91. doi: 10.1073/pnas.88.13.5587
7. Chen H, Yao W, Jin D, Xia T, Chen X, Lei T, et al. Cloning, Expression Pattern, Chromosomal Localization, and Evolution Analysis of Porcine Gnaq, Gna11, and Gna14. Biochem Genet (2008) 46:398–405. doi: 10.1007/s10528-008-9158-6
8. Zanini S, Giovinazzo F, Alaimo D, Lawrence B, Pfragner R, Bassi C, et al. GNA15 Expression in Small Intestinal Neuroendocrine Neoplasia: Functional and Signalling Pathway Analyses. Cell Signal (2015) 27:899–907. doi: 10.1016/j.cellsig.2015.02.001
9. de Jonge HJ, Woolthuis CM, Vos AZ, Mulder A, van den Berg E, Kluin PM, et al. Gene Expression Profiling in the Leukemic Stem Cell-Enriched CD34+ Fraction Identifies Target Genes That Predict Prognosis in Normal Karyotype AML. Leukemia (2011) 25:1825–33. doi: 10.1038/leu.2011.172
10. Giannone F, Malpeli G, Lisi V, Grasso S, Shukla P, Ramarli D, et al. The Puzzling Uniqueness of the Heterotrimeric G15 Protein and its Potential Beyond Hematopoiesis. J Mol Endocrinol (2010) 44:259–69. doi: 10.1677/JME-09-0134
11. Dorsam RT, Gutkind JS. G-Protein-Coupled Receptors and Cancer. Nat Rev Cancer (2007) 7:79–94. doi: 10.1038/nrc2069
12. Wu J, Xie N, Zhao X, Nice EC, Huang C. Dissection of Aberrant GPCR Signaling in Tumorigenesis–a Systems Biology Approach. Cancer Genomics Proteomics (2012) 9:37–50.
13. Nguyen L, Masouminia M, Mendoza A, Samadzadeh S, Tillman B, Morgan T, et al. Alcoholic Hepatitis Versus non-Alcoholic Steatohepatitis: Levels of Expression of Some Proteins Involved in Tumorigenesis. Exp Mol Pathol (2018) 104:45–9. doi: 10.1016/j.yexmp.2017.12.007
14. Wu J, Qu J, Cao H, Jing C, Wang Z, Xu H, et al. Monoclonal Antibody AC10364 Inhibits Cell Proliferation in 5-Fluorouracil Resistant Hepatocellular Carcinoma via Apoptotic Pathways. Onco Targets Ther (2019) 12:5053–67. doi: 10.2147/ott.S206517
15. Gu Y, Feng Q, Liu H, Zhou Q, Hu A, Yamaguchi T, et al. Bioinformatic Evidences and Analysis of Putative Biomarkers in Pancreatic Ductal Adenocarcinoma. Heliyon (2019) 5:e02378. doi: 10.1016/j.heliyon.2019.e02378
16. Lu X, Lu J, Liao B, Li X, Qian X, Li K. Driver Pattern Identification Over the Gene Co-Expression of Drug Response in Ovarian Cancer by Integrating High Throughput Genomics Data. Sci Rep (2017) 7:16188. doi: 10.1038/s41598-017-16286-5
17. Wang S, Zhang Y, Liu Y, Zheng R, Wu Z, Fan Y, et al. Inhibition of CSRP2 Promotes Leukemia Cell Proliferation and Correlates With Relapse in Adults With Acute Myeloid Leukemia. Onco Targets Ther (2020) 13:12549–60. doi: 10.2147/ott.S281802
18. Ruan GR, Qin YZ, Chen SS, Li JL, Ma X, Chang Y, et al. Abnormal Expression of the Programmed Cell Death 5 Gene in Acute and Chronic Myeloid Leukemia. Leuk Res (2006) 30:1159–65. doi: 10.1016/j.leukres.2005.12.028
19. Wang S, Wang C, Wang W, Hao Q, Liu Y. High RASD1 Transcript Levels at Diagnosis Predicted Poor Survival in Adult B-Cell Acute Lymphoblastic Leukemia Patients. Leuk Res (2019) 80:26–32. doi: 10.1016/j.leukres.2019.03.005
20. Hospital MA, Jacquel A, Mazed F, Saland E, Larrue C, Mondesir J, et al. RSK2 is a New Pim2 Target With Pro-Survival Functions in FLT3-ITD-Positive Acute Myeloid Leukemia. Leukemia (2018) 32:597–605. doi: 10.1038/leu.2017.284
21. Döhner H, Estey E, Grimwade D, Amadori S, Appelbaum FR, Büchner T, et al. Diagnosis and Management of AML in Adults: 2017 ELN Recommendations From an International Expert Panel. Blood (2017) 129:424–47. doi: 10.1182/blood-2016-08-733196
22. Papaemmanuil E, Gerstung M, Bullinger L, Gaidzik VI, Paschka P, Roberts ND, et al. Genomic Classification and Prognosis in Acute Myeloid Leukemia. N Engl J Med (2016) 374:2209–21. doi: 10.1056/NEJMoa1516192
23. Tallman MS, Wang ES, Altman JK, Appelbaum FR, Bhatt VR, Bixby D, et al. Acute Myeloid Leukemia, Version 3.2019, NCCN Clinical Practice Guidelines in Oncology. J Natl Compr Canc Netw (2019) 17:721–49. doi: 10.6004/jnccn.2019.0028
24. Daher-Reyes G, Kim T, Novitzky-Basso I, Kim KH, Smith A, Stockley T, et al. Prognostic Impact of the Adverse Molecular-Genetic Profile on Long-Term Outcomes Following Allogeneic Hematopoietic Stem Cell Transplantation in Acute Myeloid Leukemia. Bone Marrow Transplant (2021) 56:1908–18. doi: 10.1038/s41409-021-01255-4
25. Stanchina M, Soong D, Zheng-Lin B, Watts JM, Taylor J. Advances in Acute Myeloid Leukemia: Recently Approved Therapies and Drugs in Development. Cancers (Basel) (2020) 12:3225. doi: 10.3390/cancers12113225
26. Yeung WW, Wong YH. Galpha16 Interacts With Class IA Phosphatidylinositol 3-Kinases and Inhibits Akt Signaling. Cell Signal (2010) 22:1379–87. doi: 10.1016/j.cellsig.2010.05.008
27. Liu K, Hu H, Jiang H, Zhang H, Gong S, Wei D, et al. RUNX1 Promotes MAPK Signaling to Increase Tumor Progression and Metastasis via OPN in Head and Neck Cancer. Carcinogenesis (2021) 42:414–22. doi: 10.1093/carcin/bgaa116
28. Asl ER, Amini M, Najafi S, Mansoori B, Mokhtarzadeh A, Mohammadi A, et al. Interplay Between MAPK/ERK Signaling Pathway and MicroRNAs: A Crucial Mechanism Regulating Cancer Cell Metabolism and Tumor Progression. Life Sci (2021) 278:119499. doi: 10.1016/j.lfs.2021.119499
29. Zhou XR, Li X, Liao LP, Han J, Huang J, Li JC, et al. P300/CBP Inhibition Sensitizes Mantle Cell Lymphoma to PI3Kδ Inhibitor Idelalisib. Acta Pharmacol Sin (2021) 0:1–13. doi: 10.1038/s41401-021-00643-2
30. Rouse J, Cohen P, Trigon S, Morange M, Alonso-Llamazares A, Zamanillo D, et al. A Novel Kinase Cascade Triggered by Stress and Heat Shock That Stimulates MAPKAP Kinase-2 and Phosphorylation of the Small Heat Shock Proteins. Cell (1994) 78:1027–37. doi: 10.1016/0092-8674(94)90277-1
31. Ben-Levy R, Leighton IA, Doza YN, Attwood P, Morrice N, Marshall CJ, et al. Identification of Novel Phosphorylation Sites Required for Activation of MAPKAP Kinase-2. EMBO J (1995) 14:5920–30. doi: 10.1002/j.1460-2075.1995.tb00280.x
32. Lonze BE, Riccio A, Cohen S, Ginty DD. Apoptosis, Axonal Growth Defects, and Degeneration of Peripheral Neurons in Mice Lacking CREB. Neuron (2002) 34:371–85. doi: 10.1016/s0896-6273(02)00686-4
33. Lee MM, Badache A, DeVries GH. Phosphorylation of CREB in Axon-Induced Schwann Cell Proliferation. J Neurosci Res (1999) 55:702–12. doi: 10.1002/(sici)1097-4547(19990315)55:6<702::Aid-jnr5>3.0.Co;2-n
Keywords: acute myeloid leukemia, GNA15, cell proliferation, P38 MAPK, prognosis
Citation: Li M, Liu Y, Liu Y, Yang L, Xu Y, Wang W, Jiang Z, Liu Y, Wang S and Wang C (2021) Downregulation of GNA15 Inhibits Cell Proliferation via P38 MAPK Pathway and Correlates with Prognosis of Adult Acute Myeloid Leukemia With Normal Karyotype. Front. Oncol. 11:724435. doi: 10.3389/fonc.2021.724435
Received: 13 June 2021; Accepted: 17 August 2021;
Published: 06 September 2021.
Edited by:
Mina Luqing Xu, Yale University, United StatesReviewed by:
Tomasz Stoklosa, Medical University of Warsaw, PolandDaniele Sorcini, University of Perugia, Italy
Copyright © 2021 Li, Liu, Liu, Yang, Xu, Wang, Jiang, Liu, Wang and Wang. This is an open-access article distributed under the terms of the Creative Commons Attribution License (CC BY). The use, distribution or reproduction in other forums is permitted, provided the original author(s) and the copyright owner(s) are credited and that the original publication in this journal is cited, in accordance with accepted academic practice. No use, distribution or reproduction is permitted which does not comply with these terms.
*Correspondence: Chong Wang, ZmNjd2FuZ2NAenp1LmVkdS5jbg==; Shujuan Wang, ZmNjd2FuZ3NqMUB6enUuZWR1LmNu