Abstract
Purpose:
Although MYBL2 had been validated to participate in multiple cancers including leukemia, the role of MYBL2 polymorphisms in acute lymphoblastic leukemia (ALL) was still not clear. In this study, we aimed to evaluate the association between MYBL2 single nucleotide polymorphisms (SNPs) and ALL risk in children.
Methods:
A total of 687 pediatric ALL cases and 971 cancer-free controls from two hospitals in South China were recruited. A case-control study by genotyping three SNPs in the MYBL2 gene (rs285162 C>T, rs285207 A>C, and rs2070235 A>G) was conducted. The associations were assessed by odds ratios (ORs) with corresponding 95% confidence intervals (CIs). Subgroup and stratification analyses were conducted to explore the association of rs285207 with ALL risk in terms of age, sex, immunophenotype, risk level, and other clinical characteristics. The false-positive report probability (FPRP) analysis was performed to verify each significant finding. Functional analysis in silico was used to evaluate the probability that rs285207 might influence the regulation of MYBL2.
Results:
Our study demonstrated that rs285207 was related to a decreased ALL risk (adjusted OR = 0.78; 95% CI = 0.63-0.97, P = 0.022) in the dominant model. The associations of rs285207 with ALL risk appeared stronger in patients with pre B ALL (adjusted OR=0.56; 95% CI=0.38-0.84, P=0.004), with normal diploid (adjusted OR=0.73; 95% CI=0.57-0.95, P=0.017), with low risk (adjusted OR=0.68; 95% CI=0.49-0.94, P=0.021), with lower WBC (adjusted OR=0.62; 95% CI=0.43-0.87, P=0.007) or lower platelet level (adjusted OR=0.76; 95% CI=0.59-0.96, P=0.023). With FPRP analysis, the significant association between the rs285207 polymorphism and decreased ALL risk was still noteworthy (FPRP=0.128). Functional analysis showed that IKZF1 bound to DNA motif overlapping rs285207 and had a higher preference for the risk allele A. As for rs285162 C>T and rs2070235 A>G, no significant was found between them and ALL risk.
Conclusion:
In this study, we revealed that rs285207 polymorphism decreased the ALL risk in children, and rs285207 might alter the binding to IKZF1, which indicated that the MYBL2 gene polymorphism might be a potential biomarker of childhood ALL.
Introduction
Acute lymphoblastic leukemia (ALL) is a malignant proliferation of poorly differentiated lymphocytes, the most common type of pediatric leukemia and also the most frequently diagnosed malignancy in children (1, 2). ALL is still one of the most important causes of childhood morbidity and mortality, despite medicine development and elevated cure rates in the last decades (3). The etiology of ALL is still not well clear, although mechanisms involved in it have been extensively investigated. In addition to environmental factors, gene etiology remains the predominant pathogenesis of childhood ALL (3, 4). Single-nucleotide polymorphisms (SNPs) in cancer-associated key genes (CDKN2A, GATA3, FOXO3, etc.) had been reported to influence ALL risk in children (5–7). However, many of the variations in genes influencing ALL remain to be found.
MYBL2 (MYB proto-oncogene like 2), also known as B-MYB, belongs to the MYB family of transcription factor which was first identified as a vertebrate homolog of the v-myb oncogene causing leukemia in chickens (8, 9). The MYB transcription factor family included MYBL1 (A-MYB), MYBL2 (B-MYB), and MYB (c-MYB) (10, 11). However, unlike the other two members which are usually expressed in certain tissues, MYBL2 is ubiquitously expressed in proliferating cells (12, 13). MYBL2 has also been demonstrated to act as an oncogene in numerous studies (14, 15). MYBL2 promotes the malignant development of cancer via regulating various cellular processes including apoptosis, proliferation, differentiation, invasion, metastasis, and replication stress (12, 16–20). The aberrant expression or dysfunction of MYBL2 has been validated in a variety of cancers including adult leukemia, breast cancer, prostate cancer, ovarian cancer, liver cancer, and lung cancer (19–25). However, the association of MYBL2 gene polymorphisms with childhood ALL risk and outcomes has not been reported. In the current study, we explored the association of MYBL2 SNPs with ALL risk among a case-control series of Chinese children.
Materials and Methods
Study Subject
In total, 687 ALL patients and 971 healthy controls were included in the current study. All the individuals were enrolled from Guangzhou Women and Children’s Medical Center and Nanfang Hospital. Briefly, ALL patients < 18 years old confirmed with a clinical and histological diagnosis were recruited. All patients were newly diagnosed, and a detailed medical history was recorded for each case. Thus, 687 children with ALL were recruited from January 2016 to June 2019. During the same period, 971 cancer-free healthy volunteers were also collected as controls, which were matched to the cases on age, sex, and residential region. The controls were randomly selected from children undergoing a routine physical examination. All included subjects were ethnic Han Chinese. In addition, those with other malignant disorders, a history of chemotherapy or radiotherapy were excluded. The written informed consent was obtained from each subject before participation. This study obtained permission from the institutional review boards of both hospitals.
SNP Selection and Genotyping
The SNP selection was performed using data from SNPinfo and NCBI dbSNP databases, and the selection strategy was based on four criteria as described previously (26, 27): (1) the minor allele frequency (MAF) reported in HapMap was >5% for Chinese subjects; (2) located in or near the MYBL2 gene (i.e., < 2kb upstream or downstream of MYBL2); (3) affecting transcription factor binding sites (TFBS) activity, splicing activity or protein-coding; (4) not in high linkage disequilibrium (LD, R2 < 0.8). Based on the above criteria, three SNPs (rs285162 C>T, rs285207 A>C, and rs2070235 A>G) in MYBL2 gene were retrieved for further analyses.
Peripheral blood samples were collected from each participant at diagnosis and then used for DNA extraction using the TIANamp DNAKit (TianGen, Beijing, China) according to the manufacturer’s instruction. rs285162, rs285207 and rs2070235 were selected for genotyping. In the genotyping assays, the Taqman ProAmp master mix and pre-designed SNP genotyping assay mix containing polymerase chain reaction (PCR) probes and primers (ABI, Massachusetts, USA) were used. The quantitative real-time PCR method was performed to genotype these three SNPs using QuantStudio™ 6 Flex System (ABI, Massachusetts, USA). In each of the 384-well plates, five positive and five negative controls were included to ensure the accuracy of genotyping. About 10% of samples were selected randomly for direct sequencing to ensure quality control (28, 29), and the results were 100% concordant.
Functional Analysis In Silico
The probability that rs285207 A>C might influence the regulation of MYBL2 was evaluated by using the Roadmap Epigenome Browser (30, 31), TFBIND software (32), and the ENCODE Project (33). Briefly, promoter and enhancer were predicted via histone modification and DNase hypersensitivity (DHS) of GM12878 (lymphocyte cell line) in Roadmap Epigenomics data. TFBIND was used to assess whether rs285207 altered any transcription factor binding sites (TFBS), and then ENCODE ChIP-seq experiments of IKZF1 in GM12878 (Experiment Series: ENCSR816OIY) was used to assess the binding signals and motifs overlapping rs285207.
Statistical Analyses
For each SNP in controls, Hardy-Weinberg equilibrium (HWE) was assessed via the goodness-of-fit χ2 test. Genotype distribution of each SNP and demographic variables between the case and control group was analyzed using a 2-sided χ2 test. To evaluate the strength of the relation between MYBL2 polymorphisms and ALL susceptibility, odds ratios (ORs) and 95% confidence interval (95% CIs) were calculated using logistic regression analyses, adjusting for age and sex. The false-positive report probability (FPRP) was also computed for each significant finding as previously described (34). A prior probability of 0.1 was adopted to detect an OR of 0.67 for protective effects, and an FPRP value reaching the threshold of <0.2 was considered noteworthy. All statistical analyses were conducted with SAS software (version 9.4; SAS Institute, Cary, North Carolina). In this study, all P values were 2-sided, and a P value of <0.05 was considered as statistical significance.
Results
Subject Characteristics
In the present study, a total of 687 cases and 971 controls were included, and the detailed characteristics are summarized in Table 1. Briefly, no significant differences were observed in age (P =0.494) or sex (P =0.107) distribution between cases and controls. According to immunophenotype-based classification (35–37), 596 (86.75%) cases were diagnosed with B cell ALL (B ALL), including 227 (33.04%) pro B ALL, 200 (29.11%) common B ALL, 166 (24.16%) pre B ALL, and 3 (0.44%) mature B ALL; 61 (8.88%) diagnosed with T cell ALL (T ALL); 30 (4.37%) with no available data (NA). Besides, information about gene infusion, risk level, karyotype, relapse, and the levels of minimum residual disease (MRD) at multiple time points post-therapy were also included in Table 1.
Table 1
| Variables | ALL Cases (n=687) | Controls (n=971) | P a | ||
|---|---|---|---|---|---|
| No. | % | No. | % | ||
| Age range, years | 0.67-17 | 0.92-15 | 0.494 | ||
| Mean ± SD | 5.04 ± 3.02 | 5.44 ± 2.78 | |||
| <10 | 609 | 88.65 | 871 | 89.70 | |
| ≥10 | 78 | 11.35 | 100 | 10.30 | |
| Sex | 0.107 | ||||
| Female | 278 | 40.47 | 355 | 36.56 | |
| Male | 409 | 59.53 | 616 | 63.44 | |
| Immunophenotype | |||||
| B ALL | 596 | 86.75 | |||
| Pro B | 227 | 33.04 | |||
| Common B | 200 | 29.11 | |||
| Pre B | 166 | 24.16 | |||
| Mature B | 3 | 0.44 | |||
| T ALL | 61 | 8.88 | |||
| NA | 30 | 4.37 | |||
| Gene fusion type | |||||
| BCR-ABL | 18 | 2.62 | |||
| ETV6-RUNX1 | 125 | 18.20 | |||
| E2A-PBX1 | 21 | 3.06 | |||
| SIL-TAL | 7 | 1.02 | |||
| MLL | 11 | 1.60 | |||
| Other fusions | 14 | 2.04 | |||
| Normal with no fusion | 483 | 70.31 | |||
| NA | 8 | 1.16 | |||
| Risk level | |||||
| Low | 240 | 34.93 | |||
| Medium | 319 | 46.43 | |||
| High | 62 | 9.02 | |||
| NA | 66 | 9.61 | |||
| Karyotype | |||||
| Hypo-diploid | 19 | 2.77 | |||
| Normal diploid | 441 | 64.19 | |||
| Abnormal diploid | 39 | 5.68 | |||
| Low hyper-diploid | 18 | 2.62 | |||
| High hyper-diploid | 56 | 8.15 | |||
| NA | 114 | 16.59 | |||
| MRD in marrow(%, 19d) | |||||
| <0.01 | 7 | 1.02 | |||
| ≥0.01 | 384 | 55.90 | |||
| NA | 296 | 43.08 | |||
| MRD in marrow(%, 35d) | |||||
| <0.01 | 237 | 34.50 | |||
| ≥0.01 | 205 | 29.84 | |||
| NA | 245 | 35.66 | |||
| MRD in marrow(%, 12w) | |||||
| <0.01 | 290 | 42.21 | |||
| ≥0.01 | 33 | 4.81 | |||
| NA | 364 | 52.98 | |||
| Relapse | |||||
| − | 465 | 67.69 | |||
| + | 19 | 2.77 | |||
| NA | 203 | 29.54 | |||
Frequency distribution of selected characteristics in ALL cases and cancer-free controls.
SD, standard deviation; NA, not available; MRD, minimum residual disease;
Two-sided χ2 test for distributions between ALL cases and cancer-free controls.
Associations Between MYBL2 Gene Polymorphisms and ALL Susceptibility
According to the SNP selection strategy, three SNPs (rs285162 C>T, rs285207 A>C, and rs2070235 A>G) that overlapped with transcription factor binding site (TFBS), splicing regulating site (SRS), or non-synonymous SNP (nsSNP) were selected (Table 2). The genotype frequencies of MYBL2 gene SNPs in all 687 cases and 971 controls and their association with ALL risk were described in Table 3. All these three SNPs were in HWE (PHWE>0.05) among the controls. Of the three SNPs, significant differences were observed for rs285207 A>C (crude P = 0.017) between ALL cases and controls in a dominant model. After adjustment with age and sex, rs285207 C allele was significantly related to a decreased ALL risk in the dominant model (AC/CC vs AA: adjusted OR = 0.78; 95% CI = 0.63-0.97, P = 0.022). The rest two genotypes (rs285162 C>T and rs2070235 A>G), however, were not significantly associated with ALL risk.
Table 2
| rs number | Chr | Allele | TFBS | SRS | nsSNP | Genomic position (GRCh37) | Allele | Asian | CHB |
|---|---|---|---|---|---|---|---|---|---|
| rs285162 | 20 | C/T | – | Y | – | 42328639 | C | 0.881 | 0.887 |
| rs285207 | 20 | A/C | Y | – | – | 42295379 | A | 0.742 | 0.774 |
| rs2070235 | 20 | A/G | – | – | Y | 42328639 | A | 0.853 | 0.892 |
SNPs captured by the three selected MYBL2 polymorphisms as predicted by SNPinfo software (http://snpinfo.niehs.nih.gov/).
SNP, single nucleotide polymorphism; TFBS, transcription factor binding sites; SRS, splicing regulating site; CHB, Han Chinese in Beijing, China.
Table 3
| Genotype | Cases (N=687) | Controls (N=971) | P a | Crude OR (95% CI) | P | Adjusted OR (95% CI) b | P b |
|---|---|---|---|---|---|---|---|
| rs285162 (HWE=0.7301) | |||||||
| CC | 553 (82.41) | 796 (83.35) | 1.00 | 1.00 | |||
| CT | 111 (16.54) | 152 (15.92) | 1.05 (0.80-1.37) | 0.715 | 1.06 (0.81-1.38) | 0.697 | |
| TT | 7(1.04) | 7 (0.73) | 1.44 (0.50-4.12) | 0.498 | 1.48 (0.51-4.26) | 0.467 | |
| Additive | 0.541 | 1.08 (0.85-1.37) | 0.541 | 1.08 (0.85-1.38) | 0.514 | ||
| Dominant | 118 (83.35) | 159 (16.65) | 0.621 | 1.07 (0.82-1.39) | 0.620 | 1.07 (0.83-1.40) | 0.597 |
| Recessive | 664 (98.96) | 948 (99.27) | 0.505 | 1.43 (0.50-4.09) | 0.507 | 1.47 (0.51-4.22) | 0.477 |
| rs285207 (HWE=0.0797) | |||||||
| AA | 502 (73.18) | 656 (67.70) | 1.00 | 1.00 | |||
| AC | 165 (24.05) | 292 (30.13) | 0.74 (0.59-0.92) | 0.008 | 0.75 (0.60-0.94) | 0.011 | |
| CC | 19 (2.77) | 21 (2.17) | 1.18 (0.63-2.22) | 0.603 | 1.18 (0.62-2.22) | 0.616 | |
| Additive | 0.059 | 0.83 (0.69-1.01) | 0.059 | 0.84 (0.69-1.02) | 0.072 | ||
| Dominant | 184 (26.82) | 313 (32.30) | 0.017 | 0.77 (0.62-0.95) | 0.017 | 0.78 (0.63-0.97) | 0.022 |
| Recessive | 667 (97.23) | 948 (97.83) | 0.432 | 1.29 (0.69-2.41) | 0.433 | 1.27 (0.68-2.39) | 0.452 |
| rs2070235 (HWE=0.0527) | |||||||
| AA | 577 (84.73) | 798 (82.18) | 1.00 | 1.00 | |||
| AG | 99 (14.54) | 170 (17.51) | 0.81 (0.62-1.06) | 0.116 | 0.81 (0.62-1.07) | 0.133 | |
| GG | 5 (0.73) | 3 (0.31) | 2.31 (0.55-9.68) | 0.254 | 2.33 (0.55-9.81) | 0.250 | |
| Additive | 0.278 | 0.87 (0.67-1.12) | 0.278 | 0.87 (0.68-1.13) | 0.309 | ||
| Dominant | 104 (15.27) | 173 (17.82) | 0.173 | 0.83 (0.64-1.08) | 0.173 | 0.84 (0.64-1.10) | 0.196 |
| Recessive | 676 (99.27) | 968 (99.69) | 0.220 | 2.39 (0.57-10.0) | 0.235 | 2.41 (0.57-10.1) | 0.232 |
Logistic regression analysis of associations between MYBL2 polymorphisms and ALL susceptibility.
χ2 test for genotype distributions between ALL cases and cancer-free controls.
Adjusted for age and sex.
The bold values were statistically significant results.
Subgroup and Stratification Analyses
To further explore the association between the MYBL2 gene rs285207 A>C polymorphism and ALL susceptibility, subgroup and stratification analyses were performed in terms of age, sex, karyotype, immunophenotype, gene infusion, risk level, and other clinical information. All the results were shown in Table 4. Compared with the rs285207 AA genotype, the AC/CC genotype decreased ALL risk in females (adjusted OR=0.68; 95% CI=0.47-0.97, P=0.033), and children < 10 years old (adjusted OR=0.78; 95% CI=0.62-0.98, P=0.030). For the immunophenotype, the rs285207 AC/CC genotype decreased ALL risk in patients with B ALL (adjusted OR=0.78; 95% CI=0.62-0.98, P=0.035), particularly in patients with pre B ALL (adjusted OR=0.56; 95% CI=0.38-0.84, P=0.004). The rs285207 AC/CC genotype also decreased ALL risk in children with normal diploid (adjusted OR=0.73; 95% CI=0.57-0.95, P=0.017), with low risk (adjusted OR=0.68; 95% CI=0.49-0.94, P=0.021), with lower WBC (adjusted OR=0.62; 95% CI=0.43-0.87, P=0.007) or lower platelet level (adjusted OR=0.76; 95% CI=0.59-0.96, P=0.023). Furthermore, the rs285207 AC/CC genotype reduced ALL risk in patients without relapse (adjusted OR=0.78; 95% CI=0.61-0.99, P=0.046). The level of MRD is a key prognosis factor for ALL patients, and the negative MRD (<0.01%) usually indicates a good prognosis. In this study, MRD was also analyzed according to different therapy strategies (Table S1). In patients treated with China Children’s Cancer Group (CCCG)-ALL-2015 protocol, no association was observed between MRD level and rs285207 polymorphism. In the group of South China Children Leukemia Group (SCCLG)-ALL-2016 protocol, the rs285207 AC/CC genotype seemed to increase the rates of patients with negative MRD (<0.01%) (adjusted OR= 3.10, 2.67 and 999 at day 19, day 35 and week 12, respectively), although no significant result was found due to the limited sample size.
Table 4
| Variables | rs285207 (cases/controls) | Adjusted ORa | P a | ||
|---|---|---|---|---|---|
| AA | AC/CC | (95% CI) | |||
| Age, years | |||||
| <10 | 444/588 | 164/281 | 0.78 (0.62-0.98) | 0.030 | |
| ≥10 | 58/68 | 20/32 | 0.73 (0.37-1.41) | 0.341 | |
| Sex | |||||
| Females | 212/243 | 66/112 | 0.68 (0.47-0.97) | 0.033 | |
| Males | 290/413 | 118/201 | 0.84 (0.64-1.10) | 0.210 | |
| Immunophenotyping | |||||
| B ALL | 435/656 | 160/313 | 0.78 (0.62-0.98) | 0.035 | |
| Pro B | 166/656 | 61/313 | 0.79 (0.57-1.09) | 0.156 | |
| Common B | 135/656 | 64/313 | 1.01 (0.73-1.40) | 0.949 | |
| Pre B | 131/656 | 35/313 | 0.56 (0.38-0.84) | 0.004 | |
| Mature B | 3/656 | 0/313 | 0.001(0.001-999) | 0.950 | |
| T ALL | 45/656 | 16/313 | 0.73 (0.40-1.31) | 0.289 | |
| Gene fusion type | |||||
| BCR-ABL | 11/656 | 7/313 | 1.25 (0.48-3.31) | 0.648 | |
| ETV6-RUNX1 | 101/656 | 24/313 | 0.51 (0.32-0.81) | 0.004 | |
| E2A-PBX1 | 15/656 | 6/313 | 0.85 (0.33-2.22) | 0.741 | |
| SIL-TAL | 6/656 | 1/313 | 0.34 (0.04-2.83) | 0.318 | |
| MLL | 8/656 | 3/313 | 0.80 (0.21-3.03) | 0.738 | |
| Others | 10/656 | 4/313 | 0.84 (0.26-2.71) | 0.776 | |
| Normal | 347/656 | 135/313 | 0.83 (0.65-1.05) | 0.125 | |
| Risk level | |||||
| Low | 183/656 | 57/313 | 0.68 (0.49-0.94) | 0.021 | |
| Medium | 225/656 | 93/313 | 0.87 (0.66-1.15) | 0.339 | |
| High | 47/656 | 15/313 | 0.67 (0.37-1.22) | 0.191 | |
| Karyotype | |||||
| Normal diploid | 327/656 | 113/313 | 0.73 (0.57-0.95) | 0.017 | |
| Abnormal diploid | 27/656 | 12/313 | 0.93 (0.46-1.86) | 0.837 | |
| Hypo-diploid | 11/656 | 8/313 | 1.47 (0.58-3.70) | 0.415 | |
| Low hyperdiploid | 12/656 | 6/313 | 1.05 (0.39-2.82) | 0.928 | |
| High hyperdiploid | 38/656 | 18/313 | 1.03 (0.57-1.84) | 0.930 | |
| WBC | |||||
| Lower | 166/656 | 48/313 | 0.62 (0.43-0.87) | 0.007 | |
| Higher | 181/656 | 75/313 | 0.87 (0.65-1.18) | 0.382 | |
| Normal | 102/656 | 45/313 | 0.95 (0.65-1.38) | 0.774 | |
| Hemoglobin | |||||
| Lower | 384/656 | 149/313 | 0.82 (0.65-1.04) | 0.105 | |
| Higher | 2/656 | 0/313 | 0.001 (0.00-999) | 0.946 | |
| Normal | 60/656 | 17/313 | 0.59 (0.34-1.04) | 0.066 | |
| Platelet | |||||
| Lower | 366/656 | 131/313 | 0.76 (0.59-0.96) | 0.023 | |
| Higher | 5/656 | 6/313 | 2.54 (0.77-8.40) | 0.126 | |
| Normal | 79/656 | 30/313 | 0.80 (0.52-1.25) | 0.327 | |
| Relapse | |||||
| − | 340/656 | 125/313 | 0.78 (0.61-0.99) | 0.046 | |
| + | 13/656 | 6/313 | 0.96 (0.36-2.55) | 0.937 | |
Subgroup and stratification analysis of MYBL2 polymorphisms with ALL susceptibility.
Adjusted for age and sex.
Normal, values within reference range; Lower, values less than the lower limit of reference range; Higher, values higher than the upper limit of the reference range; The reference range of WBC (109/L): 5-12; The reference range of Platelet (109/L): 140-440.
The bold values were statistically significant results.
The FPRP values for these remarkable results at different levels of prior probability and statistical power were shown in Table 5. In the FPRP analysis, all the statistically significant findings were noteworthy at the prior probability level of 0.25 (FPRP<0.200). At the prior probability of 0.1, the association between the rs285207 AC/CC genotype and decreased ALL risk was still noteworthy (FPRP=0.128, statistical power=0.903), especially in patients with pre B ALL (FPRP=0.191, statistical power=0.469), normal diploid (FPRP=0.190, statistical power=0.738), lower WBC (FPRP=0.135, statistical power=0.327) or lower platelet level (FPRP=0.183, statistical power=0.855), which further strengthen the significant results above.
Table 5
| Genotype | Crude OR (95% CI) | P a | Statistical powerb | Prior probability | ||||
|---|---|---|---|---|---|---|---|---|
| 0.25 | 0.1 | 0.01 | 0.001 | 0.0001 | ||||
| rs285207 A > C | ||||||||
| AC/CC vs. AA | 0.77 (0.62-0.95) | 0.015 | 0.903 | 0.047 | 0.128 | 0.618 | 0.942 | 0.994 |
| Age <10 years | 0.78 (0.62-0.98) | 0.033 | 0.904 | 0.098 | 0.247 | 0.783 | 0.973 | 0.997 |
| Female | 0.68 (0.47-0.97) | 0.033 | 0.533 | 0.158 | 0.360 | 0.861 | 0.984 | 0.998 |
| Pre B ALL | 0.56 (0.38-0.84) | 0.005 | 0.469 | 0.073 | 0.191 | 0.722 | 0.963 | 0.996 |
| TEL-AML fusion | 0.51 (0.32-0.81) | 0.004 | 0.124 | 0.095 | 0.240 | 0.776 | 0.972 | 0.997 |
| Normal diploid | 0.73 (0.57-0.95) | 0.019 | 0.738 | 0.072 | 0.190 | 0.720 | 0.963 | 0.999 |
| Low risk | 0.68 (0.49-0.94) | 0.019 | 0.536 | 0.099 | 0.247 | 0.783 | 0.973 | 0.996 |
| Lower WBC | 0.62 (0.43-0.87) | 0.006 | 0.327 | 0.050 | 0.135 | 0.632 | 0.946 | 0.994 |
| Lower platelet | 0.76 (0.59-0.96) | 0.021 | 0.855 | 0.070 | 0.183 | 0.712 | 0.961 | 0.996 |
| No relapse | 0.78 (0.61-0.99) | 0.041 | 0.894 | 0.121 | 0.293 | 0.820 | 0.979 | 0.998 |
False-positive report probability analysis for the significant findings.
Chi-square test was used to calculate the genotype frequency distributions.
Statistical power was calculated using the number of observations in the subgroup and the OR and P values in this table.
The bold values were statistically significant results.
Functional Analysis
To explore the potential mechanisms by which rs285207 influences the ALL risk, we evaluated the probability of rs285207 polymorphism altering transcription regulation of MYBL2. The Roadmap Epigenomics data showed that rs285207 overlapped DHS marks and histone modifications related to both promoter and enhancer in multiple tissue types (Figure 1A). This observation was further supported by H3K4me1, H3K4me3, H3K9ac, H3K27ac and DHS ChIP data in GM12878 cells (Figure 1B). TFBIND analysis revealed that rs285207 altered the binding affinity of this site to transcription factors including IKZF1, THAP4 and FOXA2. For the rs285207 risk allele A, all of IKZF1, THAP4 and FOXA2 have high TFbind scores (0.85, 0.77 and 0.86, respectively), while none of these three bindings was found for the non-risk allele C. In ENCODE ChIP-seq analysis, however, only IKZF1 was found to bind to DNA motif overlapping rs285207 (Figure 2A). IKZF1 has a higher preference for the risk allele A and leave no chance for allele C (Figure 2B). The results showed that rs285207 A>C might influence the transcription of MYBL2 via disrupting IKZF1 binding site.
Figure 1
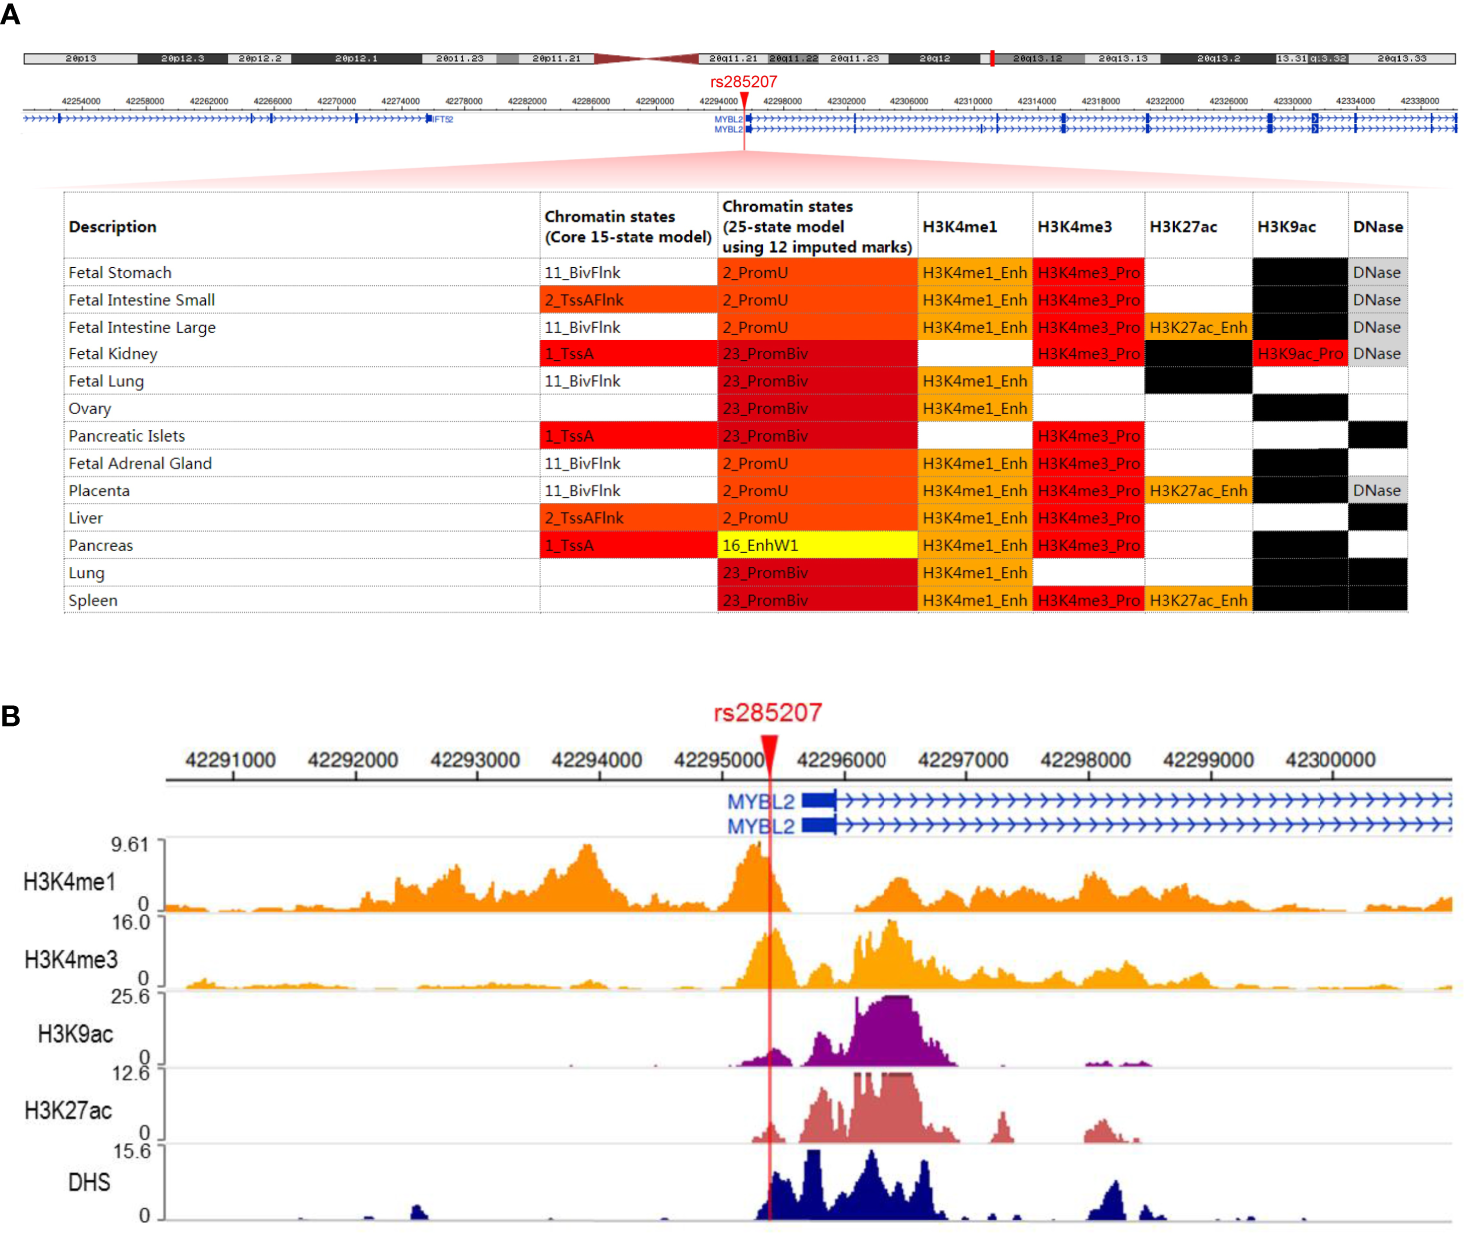
rs285207 overlapped both promoter and enhancer of MYBL2 gene (A) Schematic of rs285207 region with histone and DHS mark annotations in different tissue types in the Roadmap epigenomics data. (B) H3K4me1, H3K4me3, H3K9ac, H3K27ac and DHS ChIP-seq signals at the rs285207 locus in GM12878 cells.
Figure 2
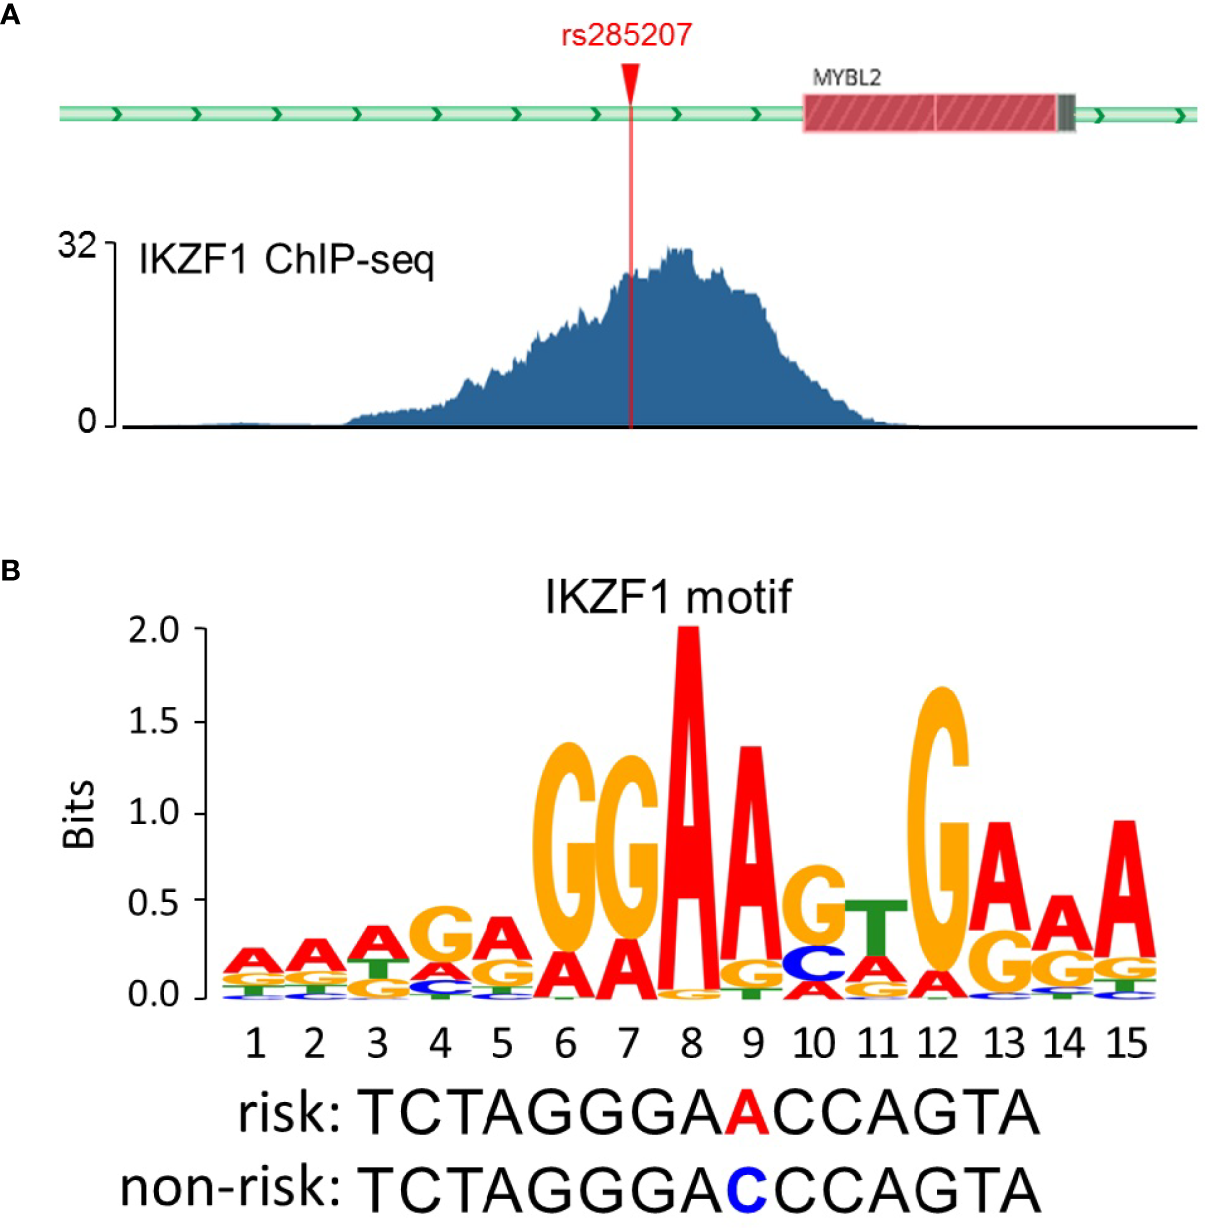
rs285207 modulated the binding to IKZF1. (A) IKZF1 ChIP-seq signals at the rs285207 locus in GM12878 cells. (B) Predicted preferential binding of IKZF1 to the risk allele A of rs285207.
Discussion
In this case-control study with 687 ALL cases and 971 healthy controls from a Chinese population, we investigated the potential association between MYBL2 gene polymorphisms and ALL risk in children. Among these three SNPs of MYBL2 in this study, we found that rs285207 A>C was significantly associated with a decreased ALL risk in the dominant model. To our knowledge, the present study is the first to explore the association between MYBL2 polymorphisms and ALL risk.
MYBL2 is a member of the MYB transcription factor family which including MYBL1, MYBL2, and MYB (10, 11). Products encoded by the MYB family have similar protein structures: a DNA-binding domain, a transactivation domain, and a regulatory domain (9, 38). All members of the MYB family exert their action through regulating transcription of target genes by binding to the same DNA consensus sequence (NAACNG) (8, 39, 40). However, only MYBL2 is ubiquitously expressed in proliferating cells (12, 13). The expression of MYBL2 gene is controlled by other transcription factors or noncoding RNA (41–45), and the MYBL2 protein is activated via phosphorylation (14, 21). After activated, MYBL2 regulates downstream diverse genes or proteins involved in multiple cellular processes, such as BCL2 and MYC in cell survival (46–48), cyclins and FGF4 in cell cycle (49–51), SOX2 and OCT4 in cell differentiation (52, 53), SNAIL and YAP1 in cell invasion and metastasis (19, 54). Overexpression or amplification of MYBL2 had been widely reported in previous studies on cancer. For instance, MYBL2 was overexpressed in castration-resistant prostate cancer and promoted cell growth and metastatic by promoting YAP1 transcriptional activity (19). Liang et al. reported that MYBL2 expression was increased in gallbladder cancer and could serve as a potential prognostic biomarker (55). In addition, the MYBL2 polymorphisms were reported to be associated with cancer (39, 56, 57). For example, Thorner et al. demonstrated that rs2070235 polymorphism was related to the increased risk of basal-like breast cancer (39). To date, there is no study detecting the polymorphisms of MYBL2 gene in ALL.
In the present study, we performed genotyping of three potential functional SNP sites (rs285162, rs285207, and rs2070235). We found that the rs285207 polymorphism was associated with the reduced ALL risk, for the first time. Besides, in the subgroup analysis, the significant association between rs285207 and ALL patients with lower platelet level was achieved with a high statistical power (>0.8), which further strengthened the significant results above. Rs285207 is located in the 374bp upstream of MYBL2 gene, which overlaps with the MYBL2 promoter and enhancer. In our analyses of transcription factor binding, rs285207 A>C was also found to disrupt the binding to IKZF1 which showed preferential binding of the risk allele A. IKZF1, also called IKAROS, belongs to the transcription factor family of zinc-finger proteins (58). IKZF1 played a key role in lymphopoiesis and also was a predisposition gene of leukemia (59–61). Therefore, rs285207 might influence the transcription of MYBL2 via altering the affinity of its binding to IKZF1. The effects of rs285207 polymorphism on ALL risk might be achieved by controlling the expression of MYBL2 gene, which needs to be validated in future studies. The rest two SNPs, rs285162 and rs2070235, are both located in the code region of MYBL2. Rs285162, with the potential to regulate splicing, was reported to influence the deviation between allele frequencies (62). Rs2070235, which results in a missense variant (Ser > Gly) of MYBL2 protein, was reported to be associated with an increased risk of breast cancer (39), but not with the incidence of acute myeloid leukemia (63). Besides, rs2070235 was found to be related to the reduced cancer risk in an investigation integrating several cancers (neuroblastoma, colon carcinoma, and chronic myelogenous leukemia) (64). In the current study, neither rs285162 nor rs2070235 was found to be associated with childhood ALL susceptibility. Along with previous reports, this study suggests that the MYBL2 gene polymorphism is complex, depending on cancer types. In addition, the variety of ethnicity and sample composition should be taken into consideration.
Although the present study is the first to explore the relationship between MYBL2 polymorphisms and ALL risk in children, several limitations should be acknowledged. First, only three SNPs of MYBL2 were investigated in this study and more potentially functional SNPs need to be done in future studies. Second, although the sample size in this study was a relatively large one, studies with larger sizes should be conducted in the future. Third, the subjects were all retrieved from south China, which might cause selection bias, and therefore multicenter studies with more populations are needed to further confirm the role of MYBL2 polymorphisms in ALL. Finally, this study just explored the genetic factor, but environmental factors including dietary intake were not available. The functions of MYBL2 SNPs in the progression of ALL also need to be further investigated.
Conclusion
In conclusion, the case-control study explored the association of MYBL2 polymorphisms (rs285162, rs285207, and rs2070235) with childhood ALL risk and firstly demonstrated that the rs285207 A>C in MYBL2 gene decreased the risk of childhood ALL and might influence the transcription of MYBL2 via altering IKZF1 binding, which suggested that MYBL2 polymorphism might serve as a biomarker for ALL susceptibility. Certainly, larger multicenter-based studies and functional experiments are encouraged to further elucidate the role of MYBL2 polymorphism and the potential mechanisms in ALL.
Funding
This study was supported by grants from National Natural Science Foundation of China (81870115, 32001043), Guangdong Basic and Applied Basic Research Foundation (2020A1515110886), and Guangzhou Municipal Science and Technology Project (202102020344).
Publisher’s Note
All claims expressed in this article are solely those of the authors and do not necessarily represent those of their affiliated organizations, or those of the publisher, the editors and the reviewers. Any product that may be evaluated in this article, or claim that may be made by its manufacturer, is not guaranteed or endorsed by the publisher.
Statements
Data availability statement
The original contributions presented in the study are included in the article/Supplementary Material, further inquiries can be directed to the corresponding author/s.
Ethics statement
The study was reviewed and approved by the institutional review boards of Guangzhou Women and Children’s Medical Center and Nanfang Hospital. Written informed consent to participate in this study was provided by the participants’ legal guardian/next of kin.
Author contributions
HG and XY designed the study. HG, NL, YS, and XY wrote the manuscript. NL, CW, HD, and LX treated the patients, collected the data, and commented on the manuscript. CW, HD, and LX performed the genotyping assay. YS and XY performed statistical analysis and function analysis. All authors contributed to the article and approved the submitted version.
Acknowledgments
We are grateful to the individuals who participated in this study.
Conflict of interest
The authors declare that the research was conducted in the absence of any commercial or financial relationships that could be construed as a potential conflict of interest.
Supplementary material
The Supplementary Material for this article can be found online at: https://www.frontiersin.org/articles/10.3389/fonc.2021.734588/full#supplementary-material
References
1
Ward E DeSantis C Robbins A Kohler B Jemal A . Childhood and Adolescent Cancer Statistics, 2014. CA: A Cancer J Clin (2014) 64(2):83–103. doi: 10.3322/caac.21219
2
Hunger SP Mullighan CG . Acute Lymphoblastic Leukemia in Children. New Engl J Med (2015) 373(16):1541–52. doi: 10.1056/NEJMra1400972
3
Iacobucci I Mullighan CG . Genetic Basis of Acute Lymphoblastic Leukemia. J Clin Oncol (2017) 35(9):975–83. doi: 10.1200/JCO.2016.70.7836
4
Spector LG Pankratz N Marcotte EL . Genetic and Nongenetic Risk Factors for Childhood Cancer. Pediatr Clin N Am (2015) 62(1):11–25. doi: 10.1016/j.pcl.2014.09.013
5
Sherborne AL Hosking FJ Prasad RB Kumar R Koehler R Vijayakrishnan J et al . Variation in CDKN2A at 9p21.3 Influences Childhood Acute Lymphoblastic Leukemia Risk. Nat Genet (2010) 42(6):492–4. doi: 10.1038/ng.585
6
Zhang H Liu AP Devidas M Lee SH Cao X Pei D et al . Association Ofgata3 Polymorphisms With Minimal Residual Disease and Relapse Risk in Childhood Acute Lymphoblastic Leukemia. JNCI: J Natl Cancer Institute (2021) 113(4):408–17. doi: 10.1093/jnci/djaa138
7
Yang X Wu X Fang N Liu X Liu X Yang L et al . FOXO3 Gene Polymorphisms Influence the Risk of Acute Lymphoblastic Leukemia in Chinese Children. J Cell Biochem (2020) 121(2):2019–26. doi: 10.1002/jcb.29436
8
Sala A . B-MYB, a Transcription Factor Implicated in Regulating Cell Cycle, Apoptosis and Cancer. Eur J Cancer (2005) 41(16):2479–84. doi: 10.1016/j.ejca.2005.08.004
9
Oh I Reddy EP . The Myb Gene Family in Cell Growth, Differentiation and Apoptosis. Oncogene (1999) 18(19):3017–33. doi: 10.1038/sj.onc.1202839
10
Bayley R Ward C Garcia P . MYBL2 Amplification in Breast Cancer: Molecular Mechanisms and Therapeutic Potential. Biochim Biophys Acta (BBA) - Rev Cancer (2020) 1874(2):188407. doi: 10.1016/j.bbcan.2020.188407
11
Baker SJ Ma’Ayan A Lieu YK John P Reddy MVR Chen EY et al . B-Myb Is an Essential Regulator of Hematopoietic Stem Cell and Myeloid Progenitor Cell Development. Proc Natl Acad Sci (2014) 111(8):3122–7. doi: 10.1073/pnas.1315464111
12
Frau M Ladu S Calvisi DF Simile MM Bonelli P Daino L et al . Mybl2 Expression Is Under Genetic Control and Contributes to Determine a Hepatocellular Carcinoma Susceptible Phenotype. J Hepatol (2011) 55(1):111–9. doi: 10.1016/j.jhep.2010.10.031
13
Yamauchi T Ishidao T Nomura T Shinagawa T Tanaka Y Yonemura S et al . A B-Myb Complex Containing Clathrin and Filamin Is Required for Mitotic Spindle Function. EMBO J (2008) 27(13):1852–62. doi: 10.1038/emboj.2008.118
14
Werwein E Cibis H Hess D Klempnauer K . Activation of the Oncogenic Transcription Factor B-Myb via Multisite Phosphorylation and Prolylcis/Transisomerization. Nucleic Acids Res (2019) 47(1):103–21. doi: 10.1093/nar/gky935
15
Zauli G Voltan R di Iasio MG Bosco R Melloni E Sana ME et al . miR-34a Induces the Downregulation of BothE2F1 and B-Myb Oncogenes in Leukemic Cells. Clin Cancer Res (2011) 17(9):2712–24. doi: 10.1158/1078-0432.CCR-10-3244
16
Musa J Aynaud M Mirabeau O Delattre O Grünewald TG . MYBL2 (B-Myb): A Central Regulator of Cell Proliferation, Cell Survival and Differentiation Involved in Tumorigenesis. Cell Death Dis (2017) 8(6):e2895. doi: 10.1038/cddis.2017.244
17
Morris BB Wages NA Grant PA Stukenberg PT Gentzler RD Hall RD et al . MYBL2-Driven Transcriptional Programs Link Replication Stress and Error-Prone DNA Repair With Genomic Instability in Lung Adenocarcinoma. Front Oncol (2021) 10:585551. doi: 10.3389/fonc.2020.585551
18
Blakemore D Vilaplana Lopera N Almaghrabi R Gonzalez E Moya M Ward C et al . MYBL2 and ATM Suppress Replication Stress in Pluripotent Stem Cells. EMBO Rep (2021) 22(5):e51120. doi: 10.15252/embr.202051120
19
Li Q Wang M Hu Y Zhao E Li J Ren L et al . MYBL2 Disrupts the Hippo-YAP Pathway and Confers Castration Resistance and Metastatic Potential in Prostate Cancer. Theranostics (2021) 11(12):5794–812. doi: 10.7150/thno.56604
20
Zhang X LV Q Huang Y Zhang L Zhou H . Akt/FoxM1 Signaling Pathway-Mediated Upregulation of MYBL2 Promotes Progression of Human Glioma. J Exp Clin Canc Res (2017) 36(1):105. doi: 10.1186/s13046-017-0573-6
21
Morita K He S Nowak RP Wang J Zimmerman MW Fu C et al . Allosteric Activators of Protein Phosphatase 2a Display Broad Antitumor Activity Mediated by Dephosphorylation of MYBL2. Cell (2020) 181(3):702–15. doi: 10.1016/j.cell.2020.03.051
22
Chen J Chen X . MYBL2 Is Targeted by miR-143-3p and Regulates Breast Cancer Cell Proliferation and Apoptosis. Oncol Res Featuring Preclinical Clin Cancer Ther (2018) 26(6):913–22. doi: 10.3727/096504017X15135941182107
23
Wei T Weiler SME Tóth M Sticht C Lutz T Thomann S et al . YAP-Dependent Induction of UHMK1 Supports Nuclear Enrichment of the Oncogene MYBL2 and Proliferation in Liver Cancer Cells. Oncogene (2019) 38(27):5541–50. doi: 10.1038/s41388-019-0801-y
24
Ahmed F . Integrated Network Analysis Reveals FOXM1 and MYBL2 as Key Regulators of Cell Proliferation in Non-Small Cell Lung Cancer. Front Oncol (2019) 9:1011. doi: 10.3389/fonc.2019.01011
25
Qi G Zhang C Ma H Li Y Peng J Chen J et al . CDCA8, Targeted by MYBL2, Promotes Malignant Progression and Olaparib Insensitivity in Ovarian Cancer. Am J Cancer Res (2021) 11(2):389–415.
26
He J Qiu L Wang M Hua R Zhang R Yu H et al . Polymorphisms in the XPG Gene and Risk of Gastric Cancer in Chinese Populations. Hum Genet (2012) 131(7):1235–44. doi: 10.1007/s00439-012-1152-8
27
He J Zhang R Zou Y Zhu J Yang T Wang F et al . Evaluation of GWAS-Identified SNPs at 6p22 With Neuroblastoma Susceptibility in a Chinese Population. Tumor Biol (2016) 37(2):1635–9. doi: 10.1007/s13277-015-3936-7
28
Lou J Gong J Ke J Tian J Zhang Y Li J et al . A Functional Polymorphism Located at Transcription Factor Binding Sites, Rs6695837 Near LAMC1 Gene, Confers Risk of Colorectal Cancer in Chinese Populations. Carcinogenesis (2017) 38(2):w204. doi: 10.1093/carcin/bgw204
29
Yang X He J Chang Y Luo A Luo A Zhang J et al . HOTAIR Gene Polymorphisms Contribute to Increased Neuroblastoma Susceptibility in Chinese Children. Cancer-Am Cancer Soc (2018) 124(12):2599–606. doi: 10.1002/cncr.31353
30
Kundaje A Meuleman W Ernst J Bilenky M Yen A Heravi-Moussavi A et al . Integrative Analysis of 111 Reference Human Epigenomes. Nature (2015) 518(7539):317–30. doi: 10.1038/nature14248
31
Zhou X Li D Zhang B Lowdon RF Rockweiler NB Sears RL et al . Epigenomic Annotation of Genetic Variants Using the Roadmap Epigenome Browser. Nat Biotechnol (2015) 33(4):345–6. doi: 10.1038/nbt.3158
32
Tsunoda T Takagi T . Estimating Transcription Factor Bindability on DNA. Bioinformatics (1999) 15(7):622–30. doi: 10.1093/bioinformatics/15.7.622
33
ENCODE Project Consortium . An Integrated Encyclopedia of DNA Elements in the Human Genome. Nature (2012) 489(7414):57–74. doi: 10.1038/nature11247
34
Wacholder S Chanock S Garcia-Closas M El GL Rothman N . Assessing the Probability That a Positive Report Is False: An Approach for Molecular Epidemiology Studies. J Natl Cancer Inst (2004) 96(6):434–42. doi: 10.1093/jnci/djh075
35
Bene MC Castoldi G Knapp W Ludwig WD Matutes E Orfao A et al . Proposals for the Immunological Classification of Acute Leukemias. European Group for the Immunological Characterization of Leukemias (EGIL). Leukemia (1995) 9(10):1783.
36
Chiaretti S Zini G Bassan R . Diagnosis and Subclassification of Acute Lymphoblastic Leukemia. Mediterr J Hematol Infect Dis (2014) 6(1):e2014073. doi: 10.4084/MJHID.2014.073
37
Yu J Dong J Jia Y Jiang N Zeng T Xu H et al . Individualized Leukemia Cell-Population Profiles in Common B-Cell Acute Lymphoblastic Leukemia Patients. Chin J Cancer (2013) 32(4):213–23. doi: 10.5732/cjc.012.10041
38
Schubert S Horstmann S Bartusel T Klempnauer K . The Cooperation of B-Myb With the Coactivator P300 Is Orchestrated by Cyclins A and D1. Oncogene (2004) 23(7):1392–404. doi: 10.1038/sj.onc.1207255
39
Thorner AR Hoadley KA Parker JS Winkel S Millikan RC Perou CM . In Vitro and In Vivo Analysis of B-Myb in Basal-Like Breast Cancer. Oncogene (2009) 28(5):742–51. doi: 10.1038/onc.2008.430
40
Rosinski JA Atchley WR . Molecular Evolution of the Myb Family of Transcription Factors: Evidence for Polyphyletic Origin. J Mol Evol (1998) 46(1):74–83. doi: 10.1007/pl00006285
41
Shi H Bevier M Johansson R Enquist-Olsson K Henriksson R Hemminki K et al . Prognostic Impact of Polymorphisms in the MYBL2 Interacting Genes in Breast Cancer. Breast Cancer Res Tr (2012) 131(3):1039–47. doi: 10.1007/s10549-011-1826-2
42
Zhu X Lu X . MiR‐423‐5p Inhibition Alleviates Cardiomyocyte Apoptosis and Mitochondrial Dysfunction Caused by Hypoxia/Reoxygenation Through Activation of the Wnt/β‐Catenin Signaling Pathway via Targeting MYBL2. J Cell Physiol (2019) 234(12):22034–43. doi: 10.1002/jcp.28766
43
Vera O Bok I Jasani N Nakamura K Xu X Mecozzi N et al . A MAPK/miR-29 Axis Suppresses Melanoma by Targeting MAFG and MYBL2. Cancers (2021) 13(6):1408. doi: 10.3390/cancers13061408
44
Wu X Gong Z Ma L Wang Q . lncRNA RPSAP52 Induced the Development of Tongue Squamous Cell Carcinomas via Mir‐423‐5p/MYBL2. J Cell Mol Med (2021) 25(10):4744–52. doi: 10.1111/jcmm.16442
45
Liu N . Cell Cycle-Regulated Repression of B-Myb Transcription: Cooperation of an E2F Site With a Contiguous Corepressor Element. Nucleic Acids Res (1996) 24(15):2905–10. doi: 10.1093/nar/24.15.2905
46
Grassilli E Salomoni P Perrotti D Franceschi C Calabretta B . Resistance to Apoptosis in CTLL-2 Cells Overexpressing B-Myb Is Associated With B-Myb-Dependent Bcl-2 Induction. Cancer Res (1999) 59(10):2451–6.
47
Nakagoshi H Kanei-Ishii C Sawazaki T Mizuguchi G Ishii S . Transcriptional Activation of the C-Myc Gene by the C-Myb and B-Myb Gene Products. Oncogene (1992) 7(6):1233–40.
48
Papetti M Augenlicht LH . MYBL2, a Link Between Proliferation and Differentiation in Maturing Colon Epithelial Cells. J Cell Physiol (2011) 226(3):785–91. doi: 10.1002/jcp.22399
49
Bartusel T Schubert S Klempnauer K . Regulation of the Cyclin D1 and Cyclin A1 Promoters by B-Myb Is Mediated by Sp1 Binding Sites. Gene (2005) 351:171–80. doi: 10.1016/j.gene.2005.03.035
50
Zhu W Giangrande PH Nevins JR . E2Fs Link the Control of G1/S and G2/M Transcription. EMBO J (2004) 23(23):4615–26. doi: 10.1038/sj.emboj.7600459
51
Johnson LR Johnson TK Desler M Luster TA Nowling T Lewis RE et al . Effects of B-Myb on Gene Transcription. J Biol Chem (2002) 277(6):4088–97. doi: 10.1074/jbc.M105112200
52
Zhan M Riordon DR Yan B Tarasova YS Bruweleit S Tarasov KV et al . The B-MYB Transcriptional Network Guides Cell Cycle Progression and Fate Decisions to Sustain Self-Renewal and the Identity of Pluripotent Stem Cells. PloS One (2012) 7(8):e42350. doi: 10.1371/journal.pone.0042350
53
Tarasov KV Tarasova YS Tam WL Riordon DR Elliott ST Kania G et al . B-MYB Is Essential for Normal Cell Cycle Progression and Chromosomal Stability of Embryonic Stem Cells. PloS One (2008) 3(6):e2478. doi: 10.1371/journal.pone.0002478
54
Tao D Pan Y Jiang G Lu H Zheng S Lin H et al . B-Myb Regulates Snail Expression to Promote Epithelial-to-Mesenchymal Transition and Invasion of Breast Cancer Cell. Med Oncol (2015) 32(1):412. doi: 10.1007/s12032-014-0412-y
55
Liang H Cao Y Ma Q Shu Y Wang Z Zhang F et al . MYBL2 Is a Potential Prognostic Marker That Promotes Cell Proliferation in Gallbladder Cancer. Cell Physiol Biochem (2017) 41(5):2117–31. doi: 10.1159/000475454
56
Shi H Bevier M Johansson R Grzybowska E Chen B Eyfjörd JE et al . Single Nucleotide Polymorphisms in the 20q13 Amplicon Genes in Relation to Breast Cancer Risk and Clinical Outcome. Breast Cancer Res Tr (2011) 130(3):905–16. doi: 10.1007/s10549-011-1600-5
57
de Smith AJ Walsh KM Francis SS Zhang C Hansen HM Smirnov I et al . BMI1 Enhancer Polymorphism Underlies Chromosome 10p12.31 Association With Childhood Acute Lymphoblastic Leukemia. Int J Cancer (2018) 143(11):2647–58. doi: 10.1002/ijc.31622
58
Lu G Middleton RE Sun H Naniong M Ott CJ Mitsiades CS et al . The Myeloma Drug Lenalidomide Promotes the Cereblon-Dependent Destruction of Ikaros Proteins. Science (2014) 343(6168):305–9. doi: 10.1126/science.1244917
59
Kamihara J Shimamura A . It’s ALL in the Family: IKZF1 and Hereditary Leukemia. Cancer Cell (2018) 33(5):798–800. doi: 10.1016/j.ccell.2018.04.008
60
Churchman ML Qian M Te Kronnie G Zhang R Yang W Zhang H et al . Germline Genetic IKZF1 Variation and Predisposition to Childhood Acute Lymphoblastic Leukemia. Cancer Cell (2018) 33(5):937–48. doi: 10.1016/j.ccell.2018.03.021
61
Sezaki N Ishimaru F Takata M Tabayashi T Nakase K Kozuka T et al . Over-Expression of the Dominant-Negative Isoform of Ikaros Confers Resistance to Dexamethasone-Induced and Anti-IgM-Induced Apoptosis. Brit J Haematol (2003) 121(1):165–9. doi: 10.1046/j.1365-2141.2003.04263.x
62
Ge B . Survey of Allelic Expression Using EST Mining. Genome Res (2005) 15(11):1584–91. doi: 10.1101/gr.4023805
63
Dolz S García P Llop M Fuster Ó Luna I Ibáñez M et al . Study of the S427G Polymorphism and of MYBL2 Variants in Patients With Acute Myeloid Leukemia. Leukemia Lymphoma (2015) 57(2):429–35. doi: 10.3109/10428194.2015.1049167
64
Schwab R Bussolari R Corvetta D Chayka O Santilli G Kwok JM et al . Isolation and Functional Assessment of Common, Polymorphic Variants of the B-MYB Proto-Oncogene Associated With a Reduced Cancer Risk. Oncogene (2008) 27(20):2929–33. doi: 10.1038/sj.onc.1210947
Summary
Keywords
acute lymphoblastic leukemia (ALL), MYBL2 , single nucleotide polymorphisms (SNPs), susceptibility, children, IKZF1
Citation
Guo H, Li N, Sun Y, Wu C, Deng H, Xu L and Yang X (2021) MYBL2 Gene Polymorphism Is Associated With Acute Lymphoblastic Leukemia Susceptibility in Children. Front. Oncol. 11:734588. doi: 10.3389/fonc.2021.734588
Received
01 July 2021
Accepted
17 August 2021
Published
08 September 2021
Volume
11 - 2021
Edited by
Tzu Pin Lu, National Taiwan University, Taiwan
Reviewed by
Ahmad Darwish, Mansoura University, Egypt; Kevin Y. Urayama, St. Luke’s International University, Japan
Updates
Copyright
© 2021 Guo, Li, Sun, Wu, Deng, Xu and Yang.
This is an open-access article distributed under the terms of the Creative Commons Attribution License (CC BY). The use, distribution or reproduction in other forums is permitted, provided the original author(s) and the copyright owner(s) are credited and that the original publication in this journal is cited, in accordance with accepted academic practice. No use, distribution or reproduction is permitted which does not comply with these terms.
*Correspondence: Haixia Guo, 13710625647@163.com; Ling Xu, luoxul64@126.com; Xu Yang, wwwyangxu@163.com
This article was submitted to Cancer Genetics, a section of the journal Frontiers in Oncology
Disclaimer
All claims expressed in this article are solely those of the authors and do not necessarily represent those of their affiliated organizations, or those of the publisher, the editors and the reviewers. Any product that may be evaluated in this article or claim that may be made by its manufacturer is not guaranteed or endorsed by the publisher.