 Cong Zhang1
 Fan Chao
 Zhonghua Xu
 Guoxiong Xu
 Gang Chen
- 1Department of Urology, Jinshan Hospital, Fudan University, Shanghai, China
- 2Department of Urology, Qilu Hospital, Shandong University, Jinan, China
- 3Research Center for Clinical Medicine, Jinshan Hospital, Fudan University, Shanghai, China
Background: This study aimed to explore the diagnostic value of alpha-l-fucosidase (AFU) in prostate cancer (PCa) patients with “gray-zone PSA” and to investigate the correlation between AFU expression and clinicopathological characteristics of PCa patients.
Methods: The level of AFU and other necessary clinicopathological variables of patients were retrieved from electronic medical records. The transcriptome profiling and clinical information of PCa patients were obtained from The Cancer Genome Atlas (TCGA) database. The protein level of AFU in tissue was assessed by immunohistochemistry (IHC). All the data were processed by appropriate analysis methods. The p-value of <0.05 was considered statistically significant.
Results: AFU showed ideal diagnostic value for PCa with prostate-specific antigen (PSA) levels ranging from 4 to 10 ng/ml, and its optimal cutoffs were 19.5 U/L. Beyond this, low AFU expression was associated with high pathological grade, T stage and N stage, more postoperative residual tumors, and poor primary therapy outcome, as well as shorter progression-free interval. The Kyoto Encyclopedia of Genes and Genomes (KEGG) analysis illustrated that FUCA1/FUCA2 exerted tumor-suppressive function by regulating the glycosylation.
Conclusions: AFU (<19.5 U/L) could effectively distinguish the PCa from the patients with “gray-zone PSA”, and low expression of AFU was an independent unfavorable predictor for the clinicopathological characteristics of PCa patients.
Introduction
Prostate cancer (PCa) is an epithelial malignancy with a high incidence that occurs in the male genitourinary system (1). In recent years, the morbidity and mortality of PCa have increased dramatically worldwide. Based on the last data, the morbidity of PCa ranks no. 1, and the mortality ranks no. 2 among male malignant tumors in 112 countries (2). In 2020, there were 1.4 million new PCa cases and 370,000 deaths globally (2). The treatment options of PCa vary based on cancer grade and stage. For example, surgery is the standard treatment for early PCa, and it can lead to a favorable prognosis. Therefore, early and accurate diagnosis is crucial for the treatment of PCa patients. Although the prostate-specific antigen (PSA) screening has made great contributions to the early diagnosis of PCa, some limitations are readily apparent. It is well established that the “diagnostic gray zone” existed in PSA screening due to the poor specificity (3). A prostate biopsy can provide an accurate diagnosis, but it is a time-consuming and expensive method that requires an experienced urologist and causes great suffering for patients. Therefore, the identification of effective and practical biomarkers for early and accurate diagnosis of PCa (especially men with a PSA of 4–10 ng/ml) is urgent and important.
AFU containing two isoforms, AFU1 and AFU2, is an enzyme that is capable of clearing the terminal α-l-fucose residues from glycoproteins (4, 5). AFU1 and AFU2 are encoded by FUCA1 gene and FUCA2 gene, respectively. Interestingly, high α-l-fucose expression has been reported to be correlated with many cancers, such as breast, thyroid, and colorectal cancers (6–10). Therefore, it is reasonable to speculate that AFU with the function of hydrolyzing α-l-fucose may imply tumor-suppressive function. Previous studies have confirmed that AFU is indeed lowly expressed in a variety of cancers, including colon cancer, colorectal cancer, and breast cancer (11–13). Other than that, low expression of AFU usually predicts a worse prognosis in cancer patients (12–14).
However, the possible correlations between AFU and PCa have not yet been explored. Consequently, the current study is conducted to investigate the relationship between AFU expression and PCa. We hope that the current research can identify a promising early diagnostic and effective prognostic biomarker for PCa.
Materials and Methods
Patients
Patients’ clinicopathological information was collected and analyzed through retrospective chart reviews of electronic medical records of Qilu Hospital of Shandong University between 2013 and 2020. Following inclusion and exclusion criteria, a total of 106 PCa patients with PSA levels between 4 and 10 ng/ml met the requirements. Those patients all accepted prostate biopsy and were confirmed as PCa by biopsy pathological results. Meanwhile, 113 benign prostatic hyperplasia (BPH) patients whose PSA levels ranged from 4 to 10 ng/ml were included as a control in this retrospective study. Beyond that, in order to further investigate the relationship between AFU expression and clinicopathological features of PCa patients, 196 eligible PCa patients who were treated with radical prostatectomy at Qilu Hospital were integrated into the current study.
The inclusion criteria were the following:
1) Necessary information was available, such as important test records, clinicopathological variables, and other necessary data.
2) The postoperation pathological outcomes indicated benign prostatic hyperplasia or prostatic adenocarcinoma.
The exclusion criteria were the following:
1) Coexisting other malignant diseases or history of tumor or cancer
2) Suffering from immune system disease or hematologic disorders
3) Taking procoagulant or anticoagulant or other medicine interfering with lab test within the past 2 weeks
Data Collection
Essential demographic information, important laboratory results, and clinicopathological data were retrieved from electronic patient records. The pathological grade was evaluated using the Gleason system. It was divided into two groups: high-pathological grade group (Gleason scores ≥8) and low-pathological grade group (Gleason scores <8) as described by a previous study (15). The stage was judged by the 2002 TNM classification (16).
Alpha-l-Fucosidase Measurement
After 12-h fasting, 5 ml of venous blood was drawn from each patient before he received any clinical treatment in the early morning. Blood was stored in the blood-sampling tubes containing procoagulant. Subsequently, samples were centrifuged at 2,000 rpm for 10 min, and the serum was separated to determine the activity of AFU by The Roche Cobas 8000 automatic analyzer (Roche, Switzerland) according to the standard operating procedure.
Extraction and Analysis of The Cancer Genome Atlas Datasets
The transcriptome profiling and clinical information of PCa patients were obtained from The Cancer Genome Atlas (TCGA) database (https://www.cancer.gov/tcga). The expression of FUCA1/FUCA2 and important clinicopathological variables of PCa patients, such as pathological grade, stage, and survival data, were extracted and analyzed.
Immunohistochemistry Analysis Based on The Human Protein Atlas
The protein expression of AFU in PCa tissue was evaluated under the support of the online website The Human Protein Atlas (https://www.proteinatlas.org/).
Statistical Analysis
The expression of AFU in each group was shown as mean and SD. The correlations between AFU levels and variables were assessed by Student’s t-test if the data followed a normal distribution, and if not, using the Mann–Whitney test. The data were obtained from TCGA by employing chi-square test, Fisher’s exact test, or Wilcoxon rank-sum test. Kaplan–Meier and Cox regression methods were used to evaluate the survival data from TCGA. The hazard ratio (HR) and 95% CI were calculated by logistic regression or Cox regression model. A two-sided p-value was set in the current study, and a p-value of <0.05 was regarded as statistically significant. Statistical analysis was performed by the Statistical Package for Social Sciences version 20.0 (SPSS Inc., Chicago, IL, USA), GraphPad Prism 8 software (GraphPad Software Inc., San Diego, CA, USA), and R (version 3.6.3; R Foundation, Vienna, Austria).
Results
Baseline Clinicopathological Characteristics
A total of 219 patients with PSA between 4 and 10 ng/ml were enrolled in the present study. Based on the pathological results after a needle biopsy, 113 patients were diagnosed with BPH, and 106 patients were confirmed to have PCa. Surprisingly, the mean level of PSA in the BPH was higher than that in the PCa, although no statistical differences were presented (7.84 ± 2.55 vs. 7.48 ± 2.58 ng/ml, p = 0.675). It was meaningful that we found that the free/total (F/T) PSA and AFU levels in the BPH patients were higher than in the PCa patients (F/T PSA: 0.22 ± 0.24 vs. 0.18 ± 0.19, p = 0.008; AFU: 20.16 ± 6.17 U/L vs. 18.21 ± 6.66 U/L, p = 0.049) (Table 1 and Figures 1A, B), but there was no line correlation between them (Figure 1E). Then, the receiver operating characteristic (ROC) analysis indicated that AFU had a better value for PCa diagnosis than F/T PSA especially in specificity (the area under the ROC curve (AUC): 0.630 vs. 0.612) (Figures 1C, D), and the AFU optimal cutoffs for PCa was 19.5 U/L. Logistic regression analysis was employed to further validate the AFU cutoffs’ diagnostic value for PCa, and the results indicated that AFU cutoffs showed ideal diagnostic performance for PCa (≥19.5 vs. <19.5 U/L: HR = 0.513, p = 0.044) (Figure 1F).
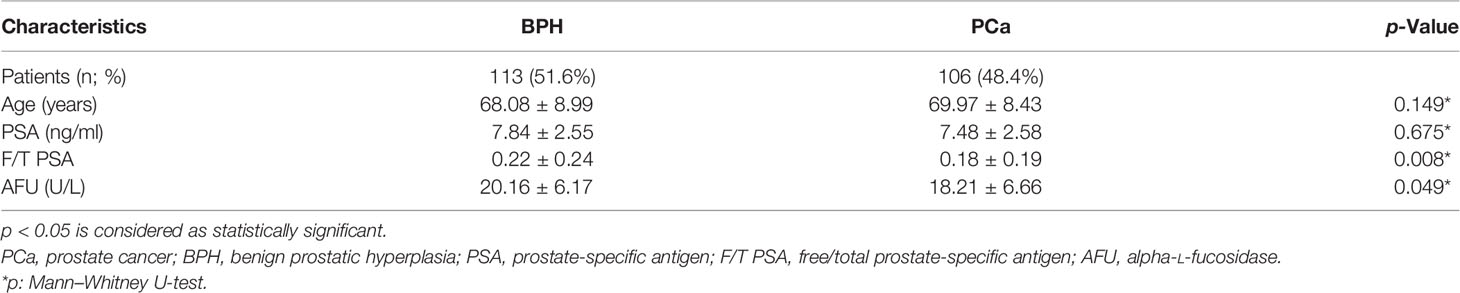
Table 1 Clinical characteristics of PCa and BPH patients.
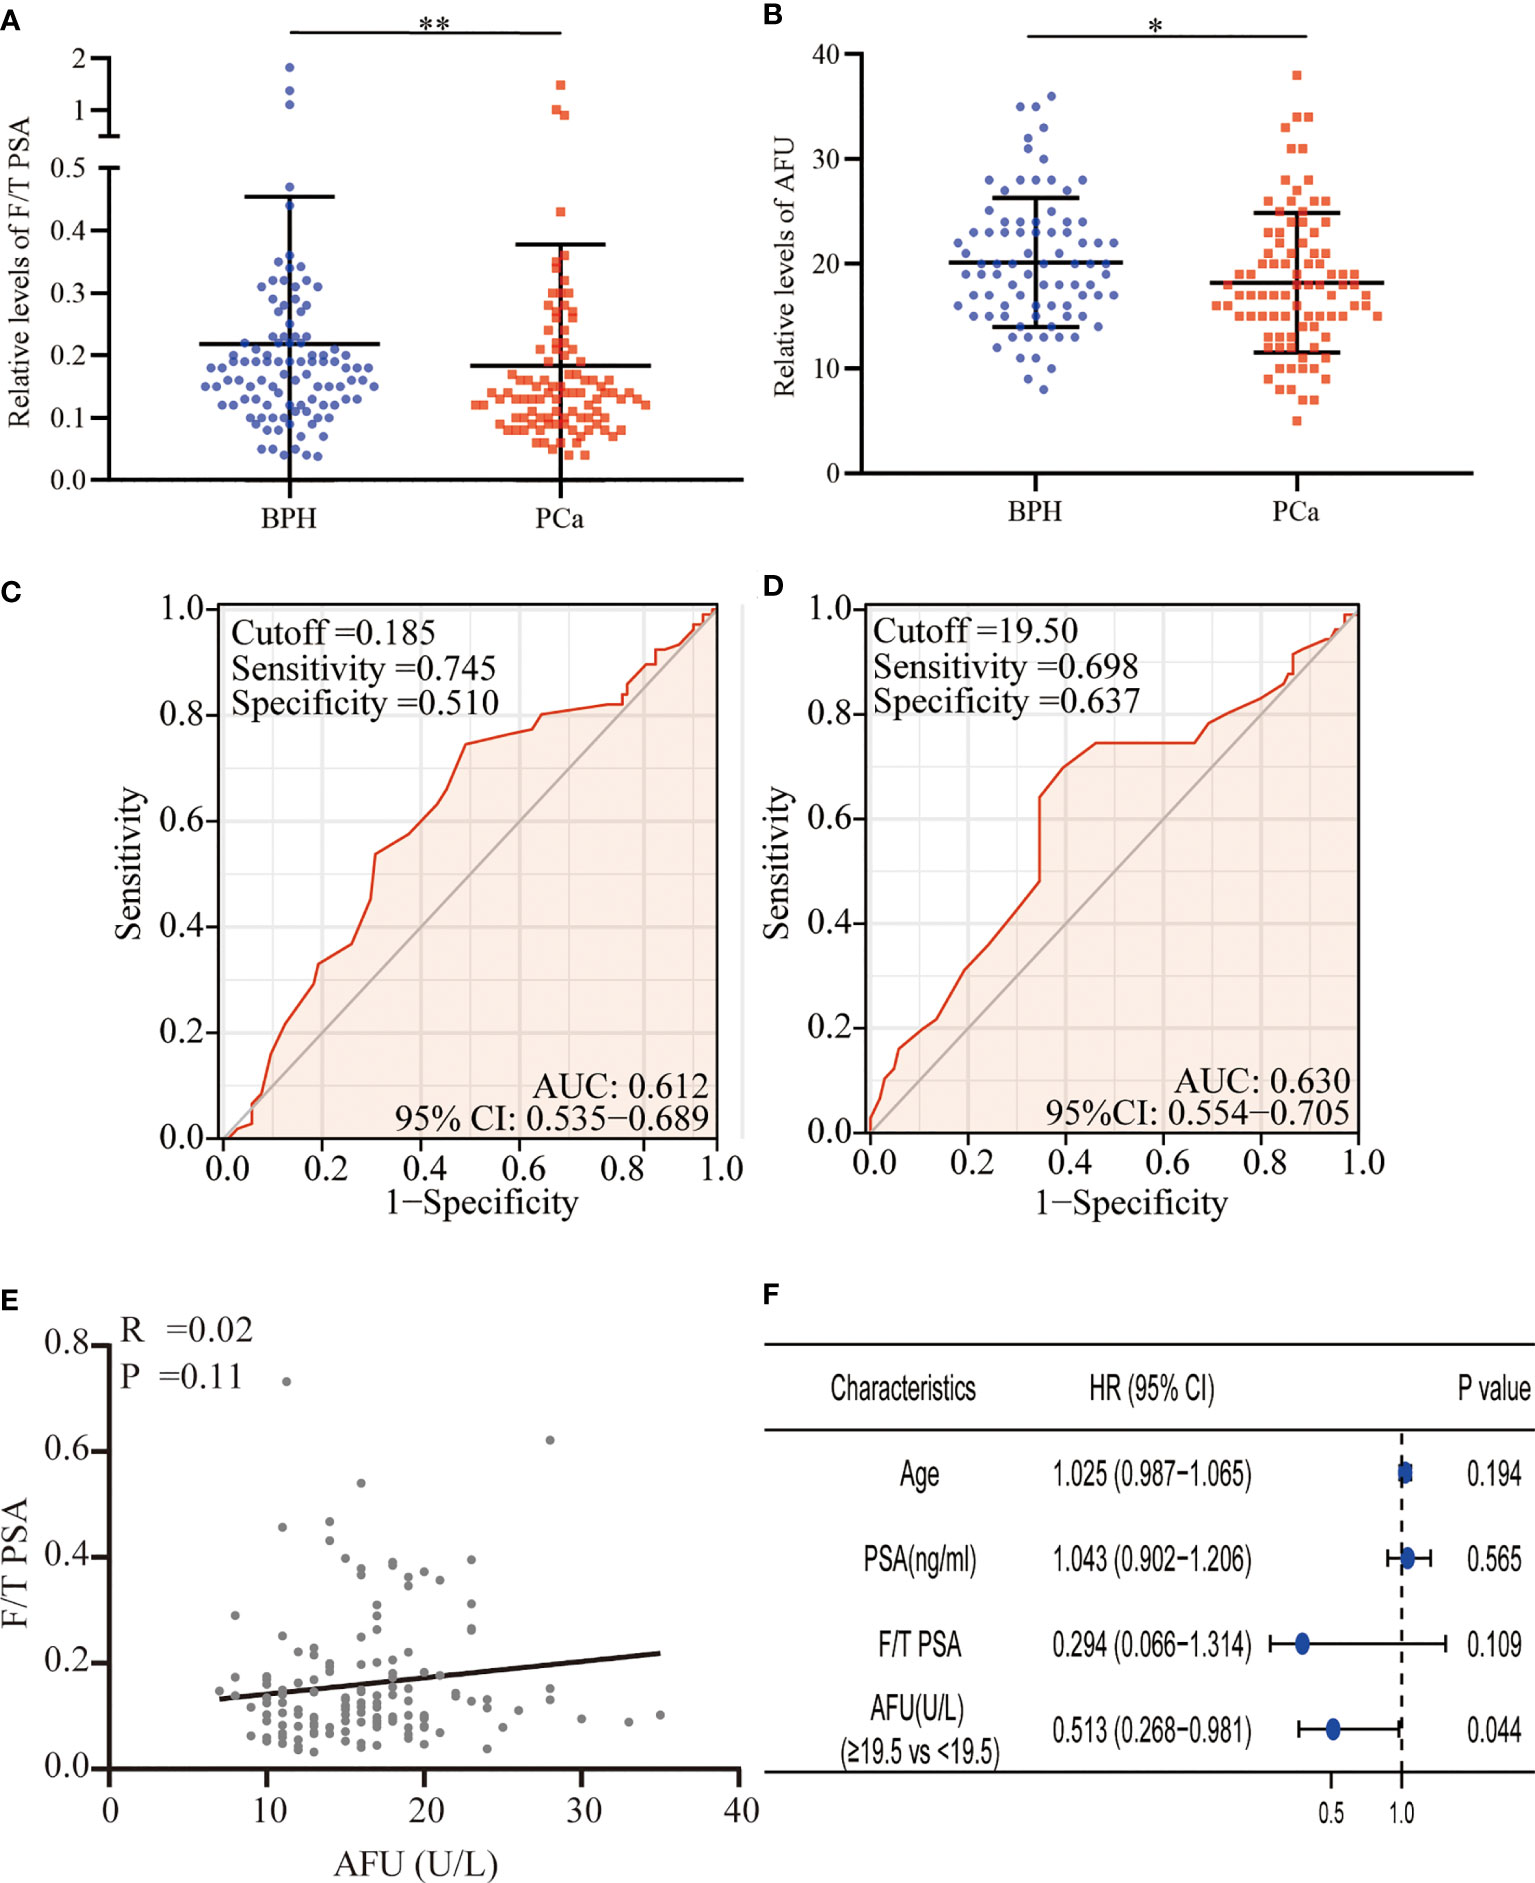
Figure 1 F/T PSA and AFU level in BPH and PCa. (A) F/T PSA level. (B) AFU level. (C) The diagnostic value of F/T PSA for PCa. (D) The diagnostic value of AFU for PCa. (E) The line correlation between F/T PSA and AFU. (F) Logistic analysis of AFU expression for the PCa diagnosis; *p < 0.05, **p < 0.01. F/T PSA, free/total prostate-specific antigen; AFU, alpha-L-fucosidase; BPH, benign prostatic hyperplasia; PCa, prostate cancer.
Associations Between Alpha-l-Fucosidase Expression and Clinicopathological Variables of 196 Prostate Cancer Patients
A total of 196 PCa patients who underwent radical prostatectomy, with the PSA average of 30.30 ng/ml (ranking 0.04 to 343 ng/ml), were analyzed in the present study. The results indicated that AFU expression was inversely correlated with PSA. The PCa patients with higher PSA levels (PSA ≥ 4 ng/ml) indicated lower AFU expression (15.89 ± 5.01 U/L) and vice versa (p = 0.043) (Table 2 and Figure 2A). Importantly, non-localized PCa (pT3 and pT4) showed lower AFU expression than localized PCa (pT1 and pT2) (p = 0.05) (Table 2 and Figure 2B). Likewise, the advanced PCa with lymph node metastasis had a lower AFU level than that without lymphatic metastasis (p = 0.017) (Table 2 and Figure 2C). Although differences were not statistically significant, we found that the high pathological grade group had lower AFU levels than the low pathological grade group (Table 2). The results of the ROC analyses indicated good predictive power of AFU for PCa pathological T stage and N stage especially for N stage (Table 2 and Figures 2D, E). However, no linear relationship was observed among AFU levels and age, lactate dehydrogenase (LDH), serum sialic acid (SA), alkaline phosphatase (AKP), and PSA (Figures 2F–J).

Table 2 Correlations between preoperative AFU levels and clinicopathological parameters of PCa patients.
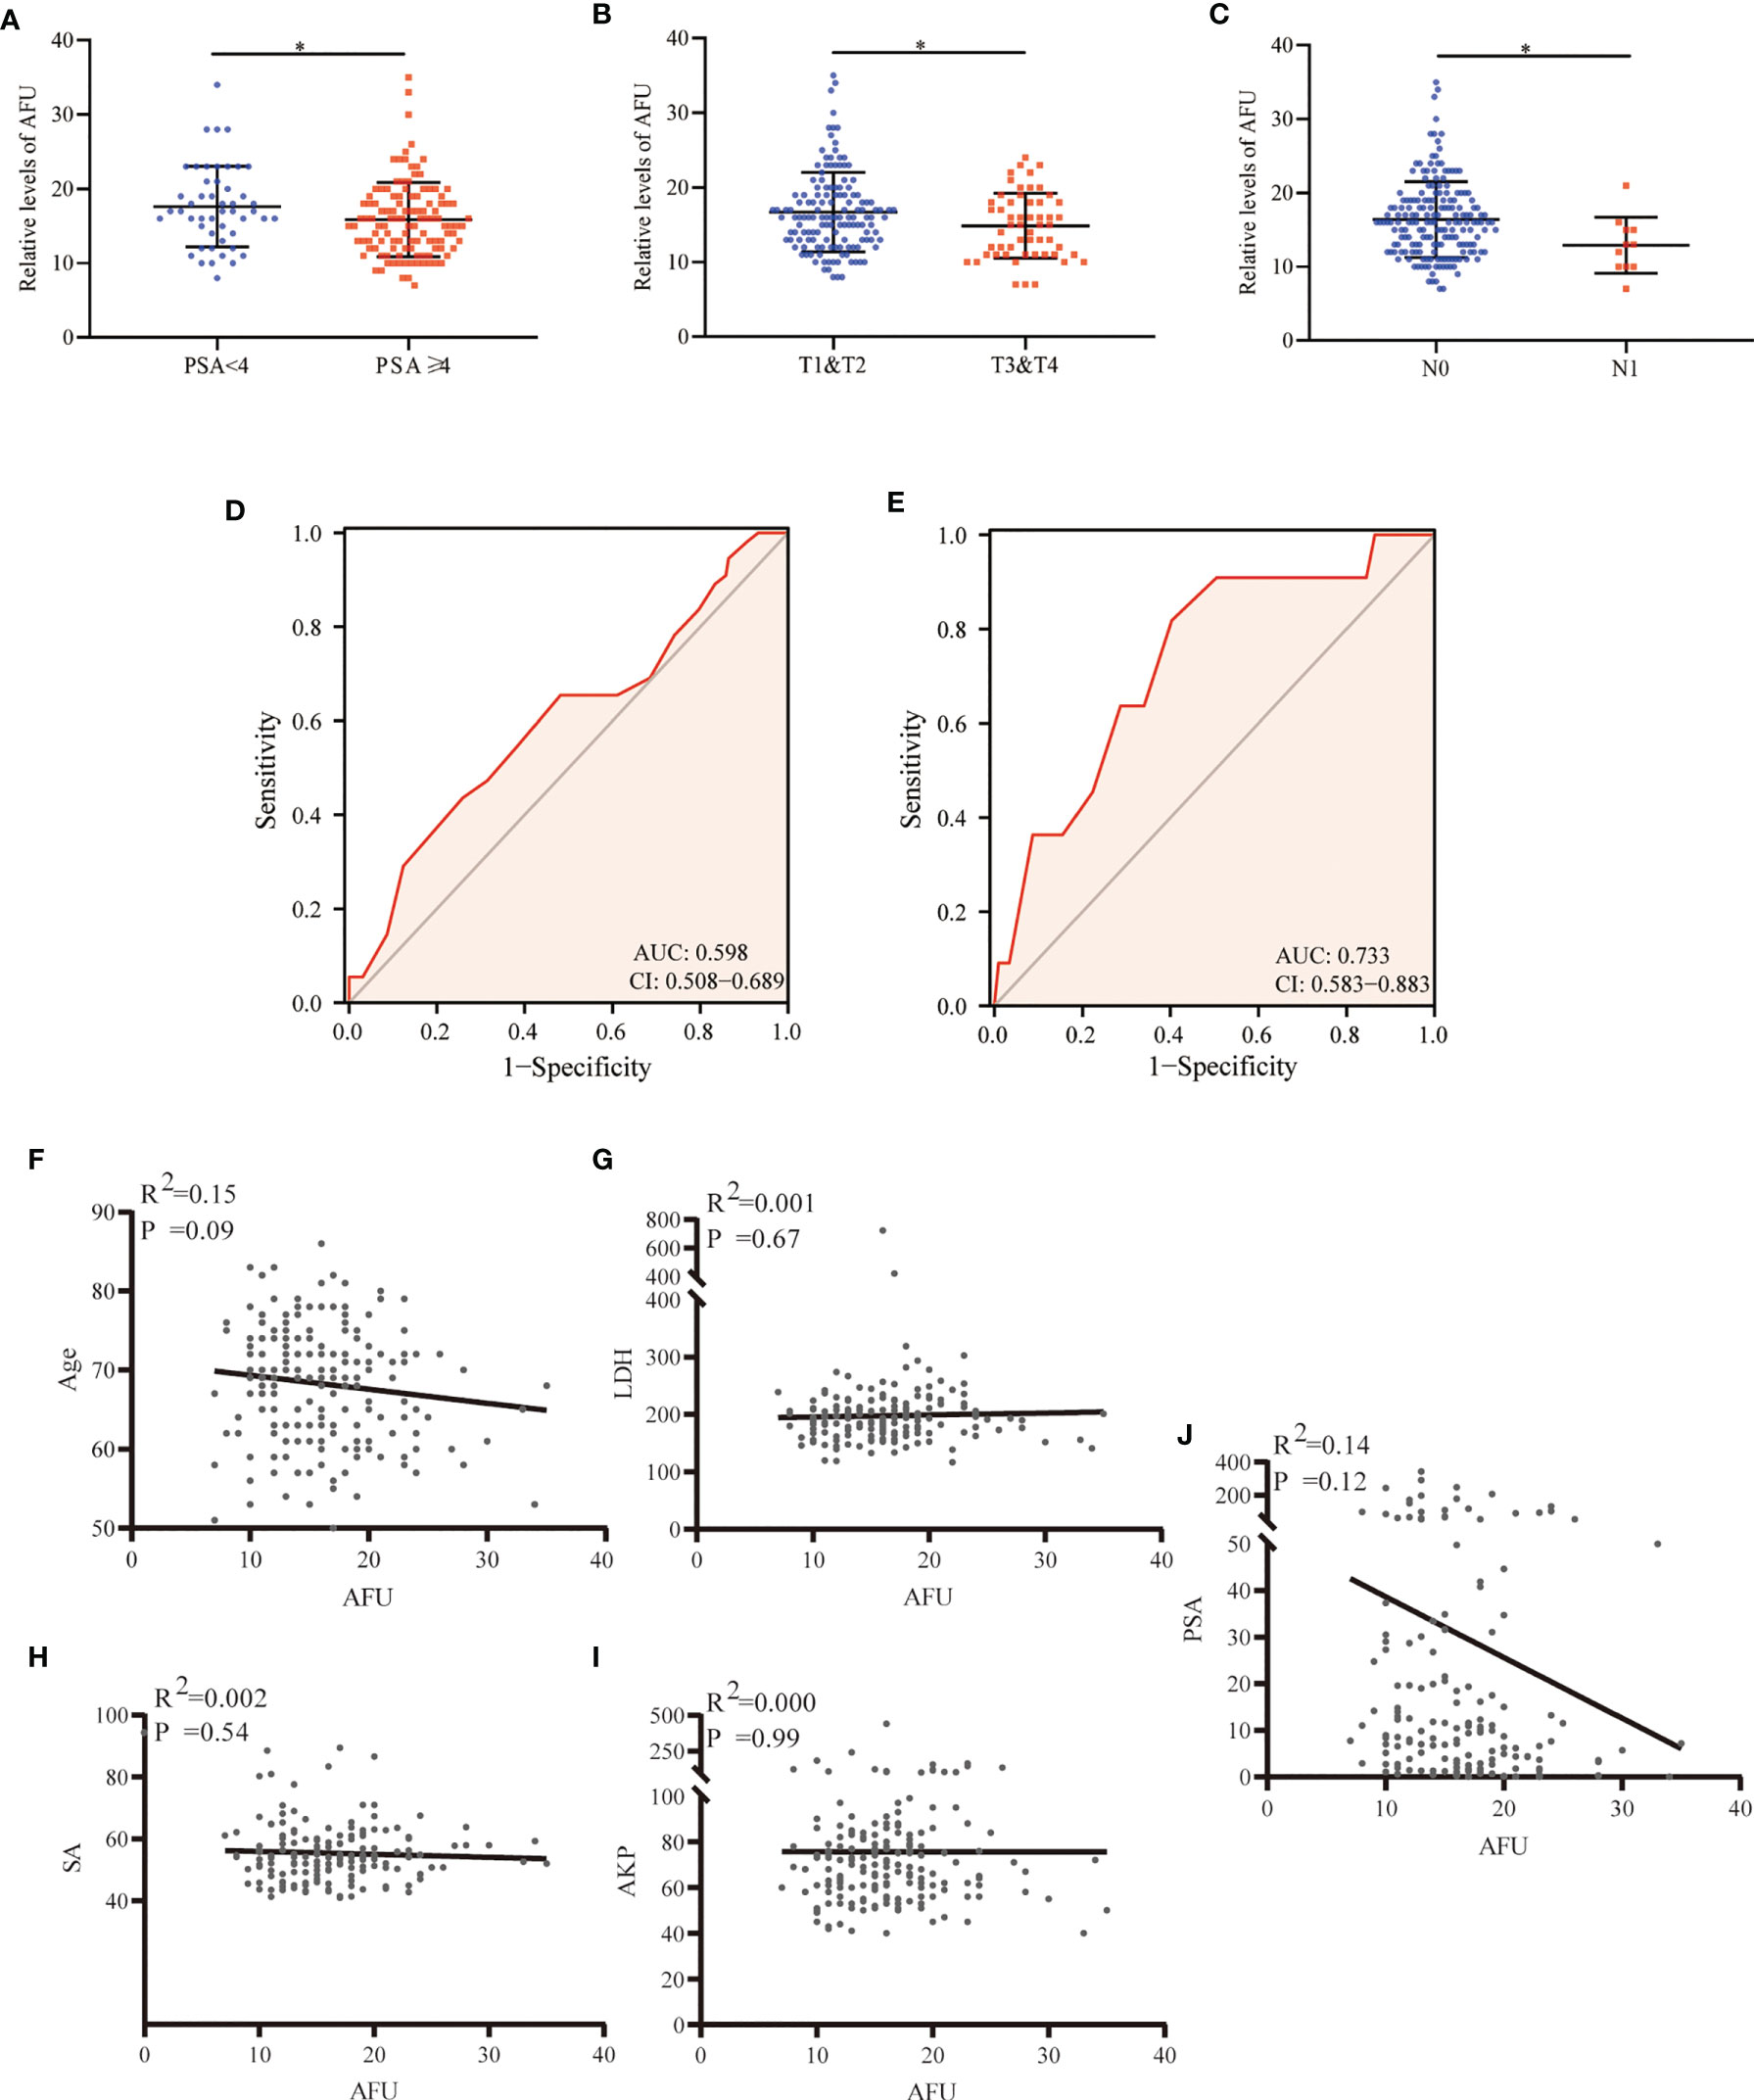
Figure 2 AFU expression in PCa subgroups. (A) PSA. (B) T stage. (C) N stage. (D) The diagnostic value of AFU for advanced T stage. (E) The diagnostic value of AFU for lymph node metastasis. Line correlations among AFU and PCa patient’s variables: (F) age; (G) LDH; (H) SA; (I) AKP; and (J) PSA. *p < 0.05. AFU, alpha-L-fucosidase; PCa, prostate cancer; PSA, prostate-specific antigen; LDH, lactate dehydrogenase; SA, serum sialic acid; AKP, alkaline phosphatase.
FUCA1 and FUCA2 Expression in Prostate Cancer Based on The Cancer Genome Atlas Database
The expression of FUCA1/FUCA2 and clinicopathological data of 499 PCa patients were extracted from TCGA database and presented in Tables 3, 4, respectively. FUCA1 expression was lower in the older group (p = 0.0006) compared with the younger group (Table 3 and Figure 3A), but FUCA2 expression had no notable difference between the two groups (p = 0.896) (Table 4). Notably, lower FUCA1/FUCA2 expression predicted both higher pathological grade group and stage, more residual tumors, and worse therapeutic effect (Figures 3A, 4A). In parallel, the ROC analysis confirmed that low FUCA1 and FUCA2 indeed promoted PCa progression, metastasis, and drug resistance (Figures 3B, 4B). All the above results were further validated by logistic regression analysis (Figures 3C, 4C).

Table 3 Correlations between FUCA1 expression and clinicopathological parameters of PCa patients.
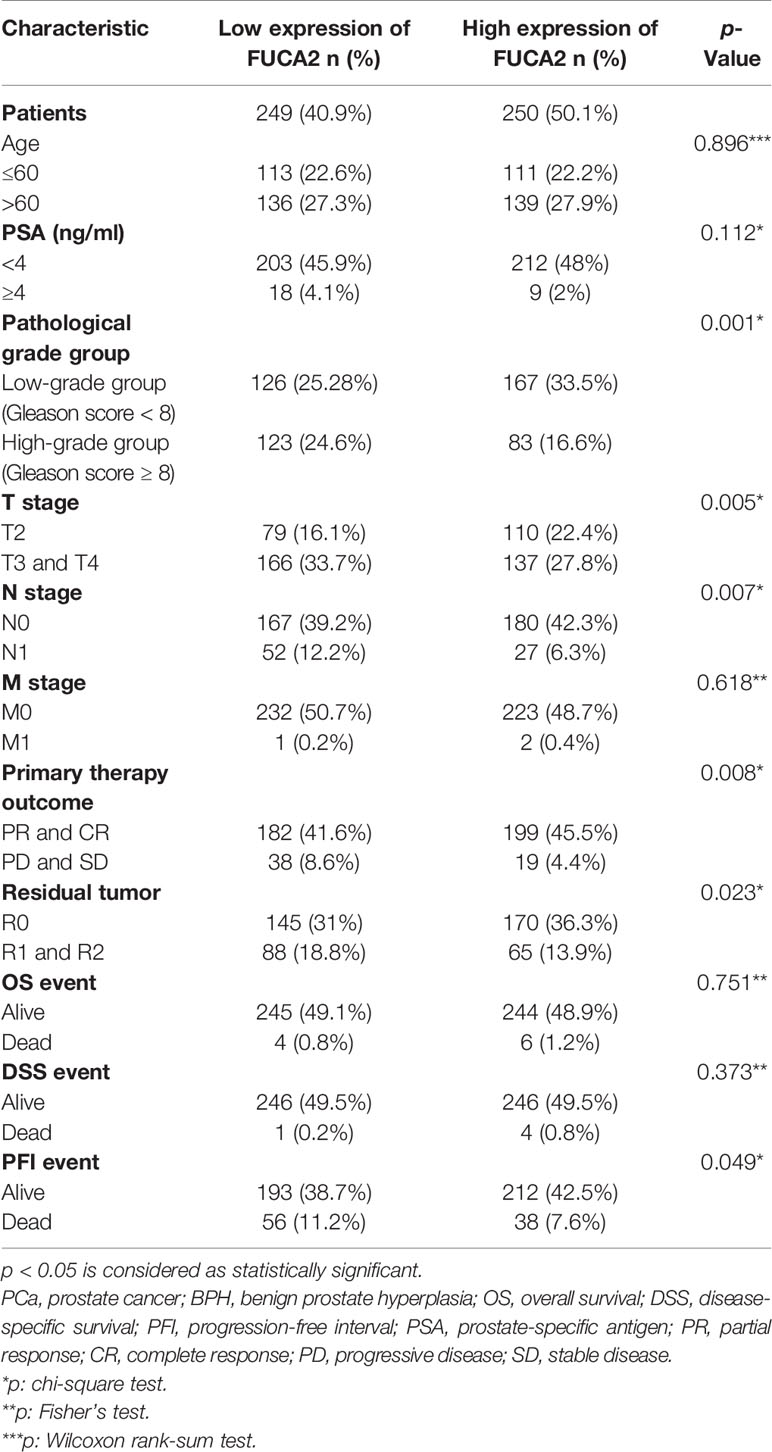
Table 4 Correlations between FUCA2 expression and clinicopathological parameters of PCa patients.
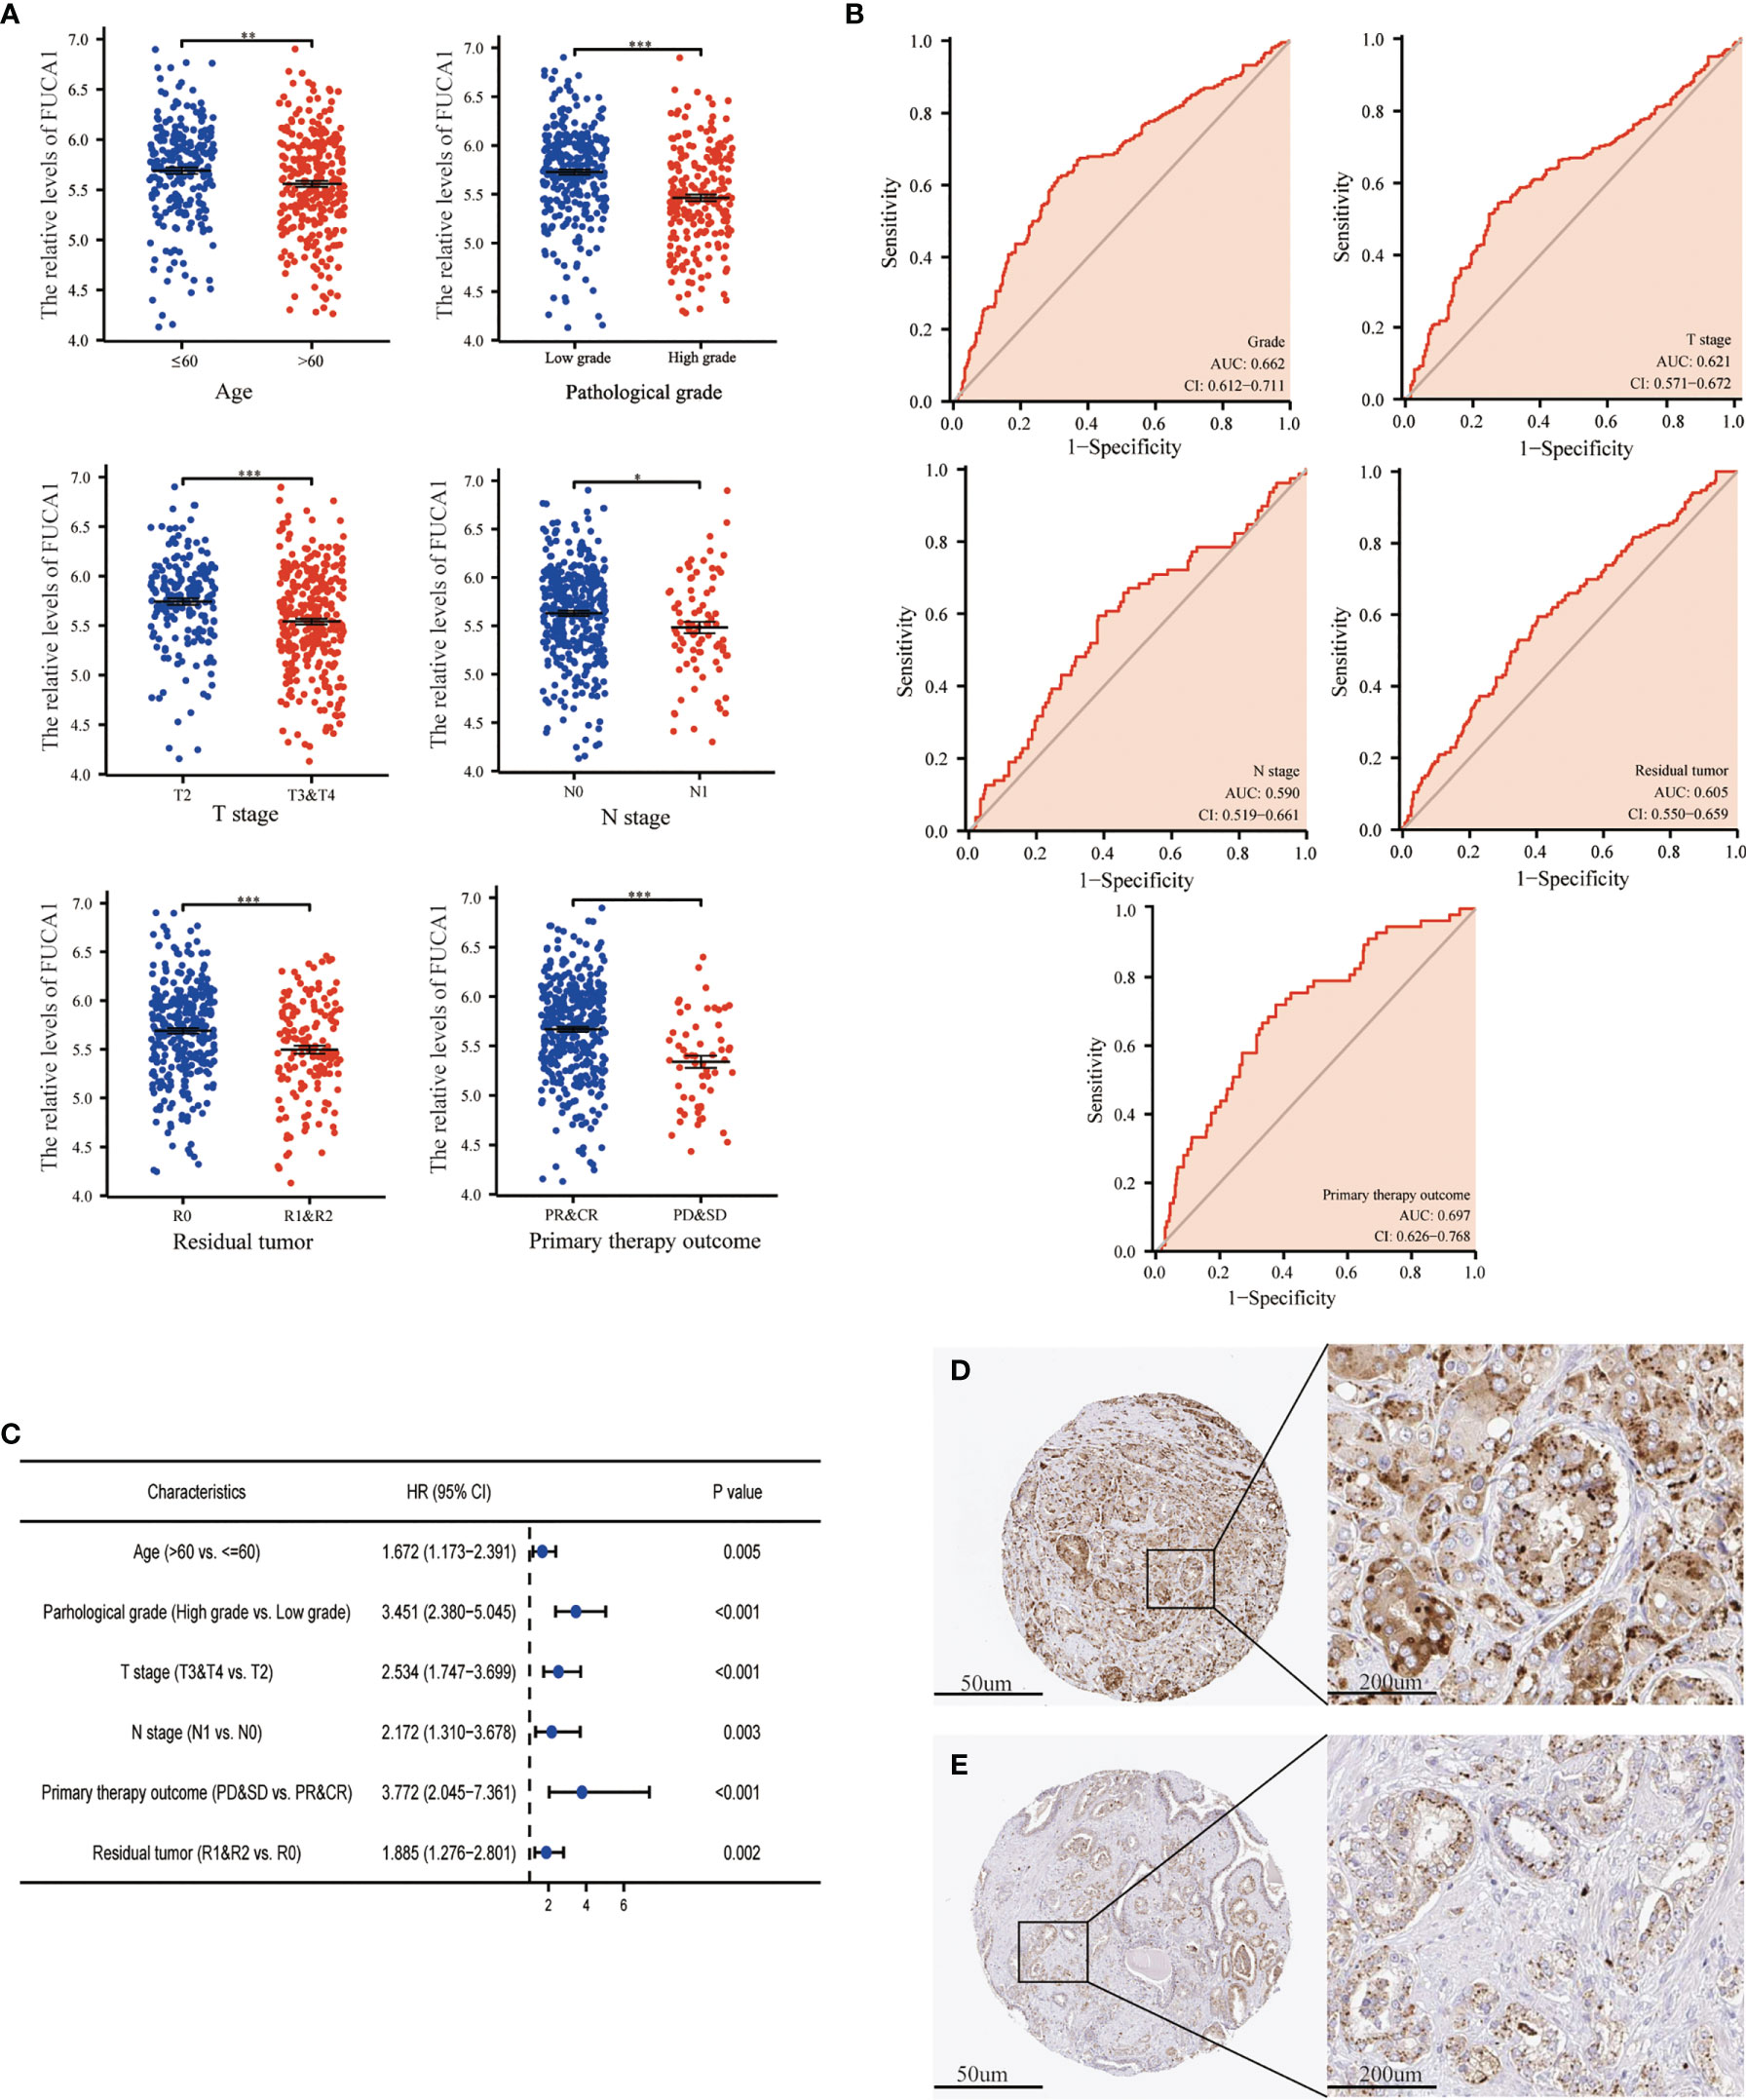
Figure 3 The expression of FUCA1 in PCa subgroups. (A) FUCA1 mRNA expression in different PCa subgroups. (B) The diagnostic value of FUCA1 for different PCa clinicopathological parameters. (C) Logical regression analysis of clinicopathological variables’ effects on low FUCA1 expression. IHC analysis of FUCA1 in low- (D) and high-grade (E) PCa tissue. CR, complete response; PR, partial response; SD, stable disease; PD, progressive disease. *p < 0.05, **p < 0.01, ***p < 0.01. PCa, prostate cancer; IHC, immunohistochemistry.
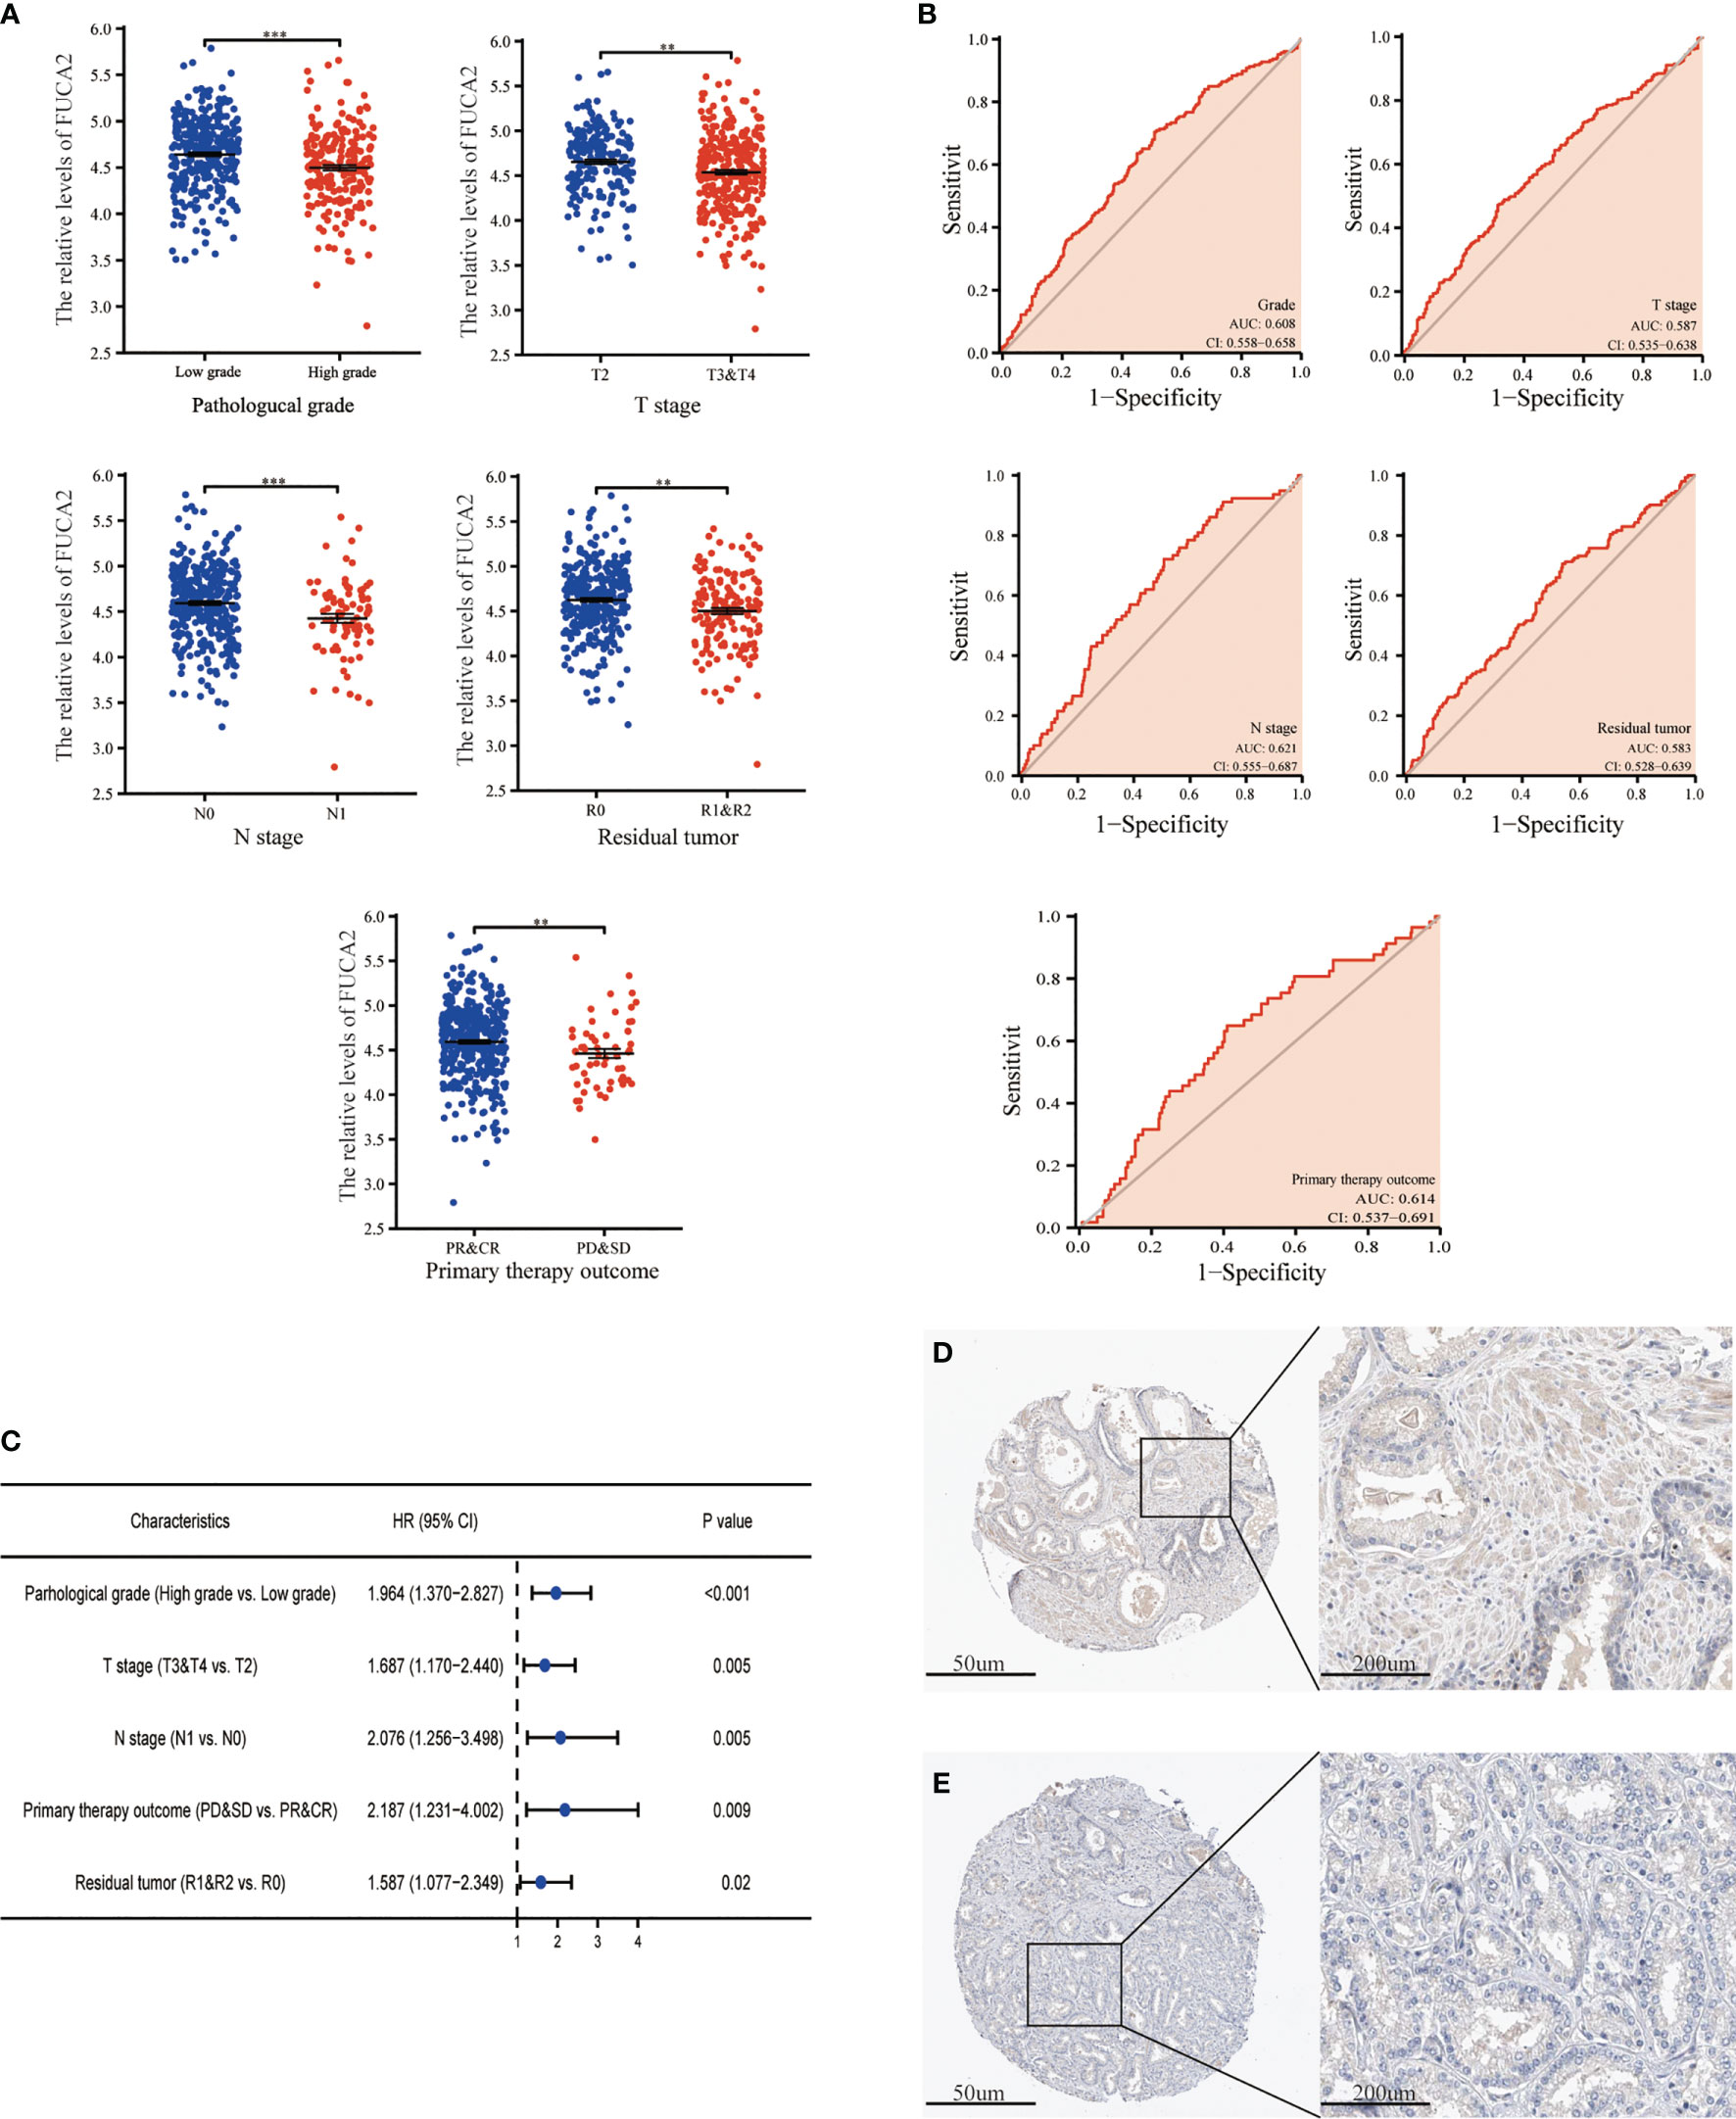
Figure 4 The expression of FUCA2 in PCa subgroups. (A) FUCA2 mRNA expression in different PCa subgroups. (B) The diagnostic value of FUCA2 for different PCa clinicopathological parameters. (C) Logical regression analysis of clinicopathological variables’ effects on low FUCA2 expression. IHC analysis of FUCA2 in low- (D) and high-grade (E) PCa tissue. CR, complete response; PR, partial response; SD, stable disease; PD, progressive disease. **p < 0.01, ***p < 0.01. PCa, prostate cancer; IHC, immunohistochemistry.
Immunohistochemistry Staining of Alpha-l-Fucosidase
AFU protein levels in PCa tissue were further measured by immunohistochemistry (IHC) staining based on the online website, The Human Protein Atlas (https://www.proteinatlas.org/). As may be immediately apparent, the expression of AFU1 and AFU2 were much lower in high-grade PCa tissue compared with low-grade tissue (Figures 3D, E and 4D, E).
Low Expression of FUCA1/FUCA2 Predicted Worse Prognosis of Prostate Cancer Patients
Log-rank analysis indicated that the lower level of FUCA1/FUCA2 indicated shorter progression-free interval (PFI) of PCa patients (Figures 5A, B). Cox regression model illustrated that low FUCA1 expression was a reliable indicator for PCa patients’ poor prognosis (Figures 5C, E), but the prognostic performance of FUCA2 was susceptible to other factors (Figures 5D, F).

Figure 5 Survival analysis of PCa patients with different FUCA1/FUCA2 expression based on TCGA databases. The Kaplan–Meier curve analysis based on FUCA1 (A) and FUCA2 (B) expression effect for PFI. Univariate Cox regression analysis of FUCA1 (C) and FUCA2 (D) expression effect for PFI. Multivariate Cox regression analysis of FUCA1 (E) and FUCA2 (F) expression effect for PFI. PCa, prostate cancer; TCGA, The Cancer Genome Atlas; PFI, progress-free interval.
Kyoto Encyclopedia of Genes and Genomes Analysis Indicated FUCA1/FUCA2 Exerted Biological Function Through Regulating Glycosylation
In order to probe the underlying mechanism through which FUCA1/FUCA2 exerted its functional role, the Kyoto Encyclopedia of Genes and Genomes (KEGG) analysis was applied. The analysis results indicated that FUCA1 and FUCA2 both played an essential role in the regulation of glycosylation, especially in the protein glycosylation (Figures 6A, B).
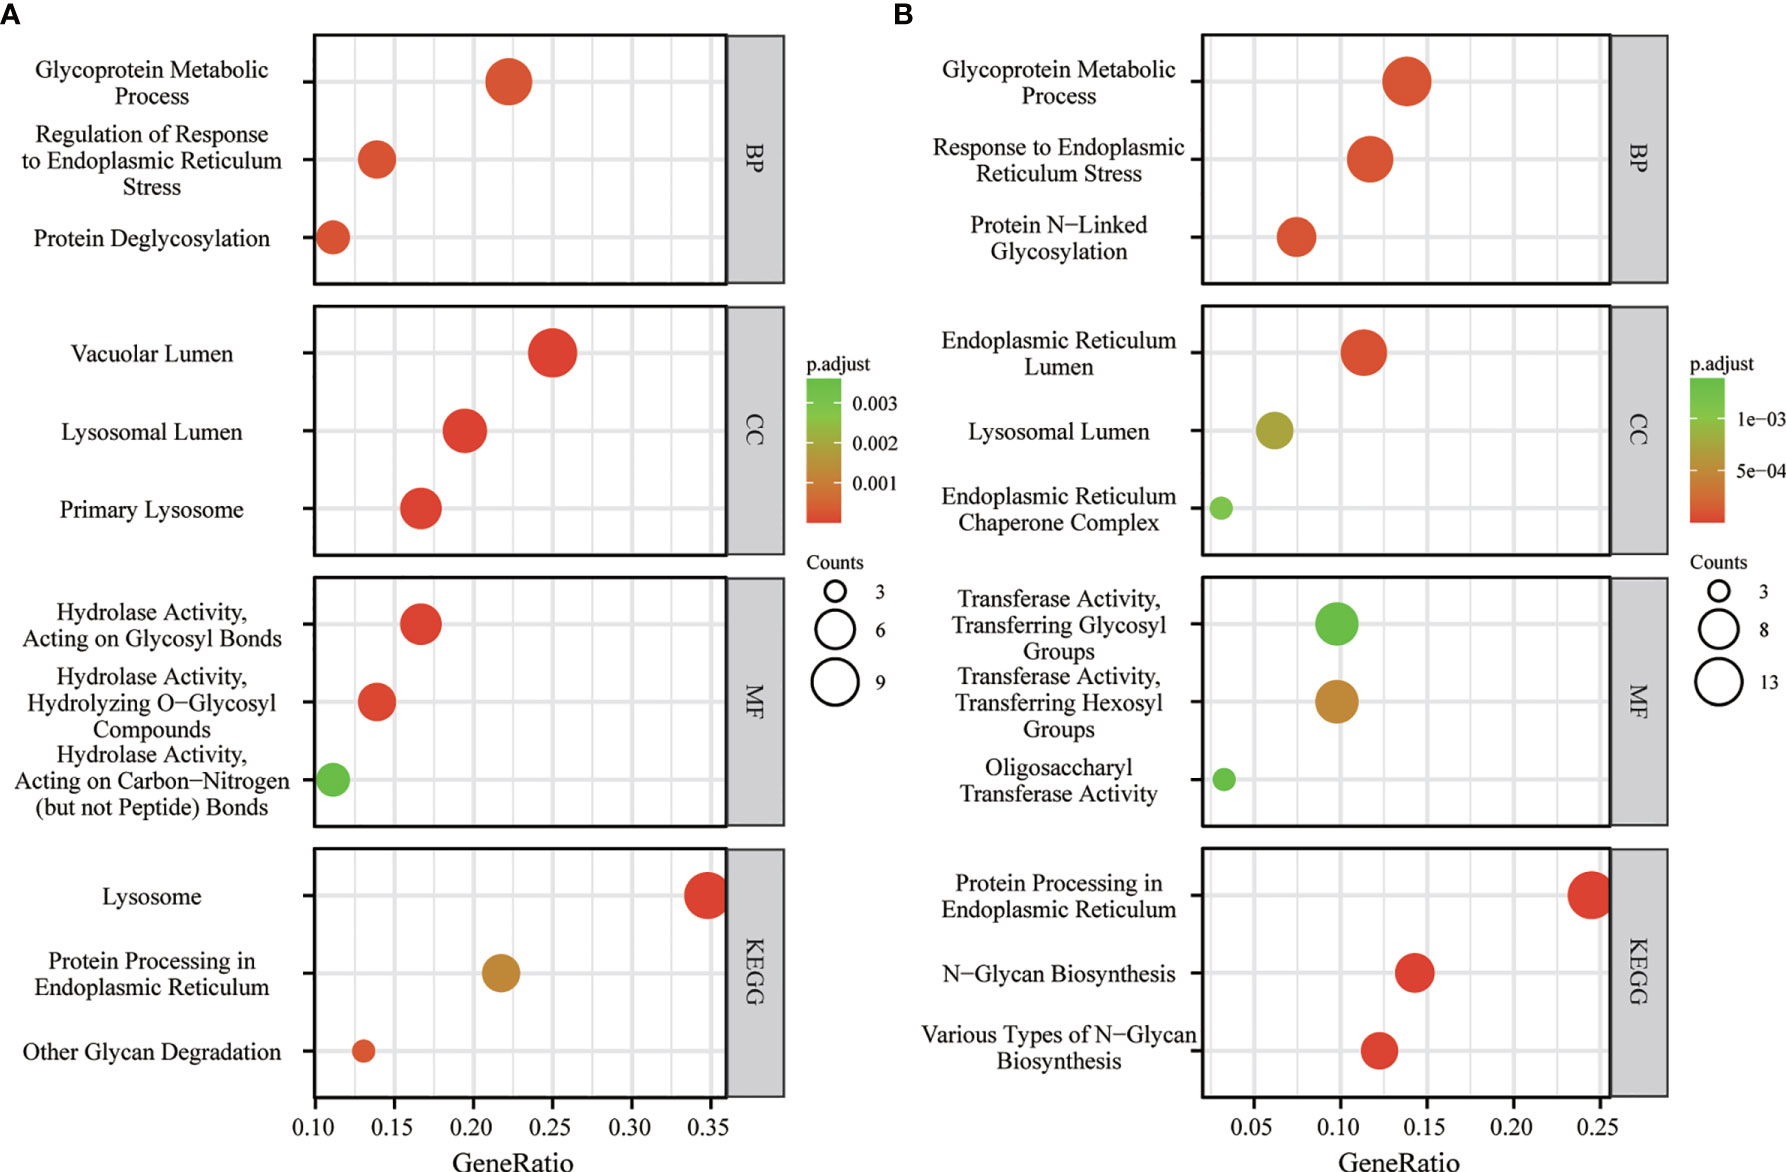
Figure 6 The KEGG analysis of FUCA1 (A) and FUCA2 (B). KEGG, The Kyoto Encyclopedia of Genes and Genomes.
Discussion
The present study indicates, for the first time, that AFU can effectively distinguish PCa from patients with PSA levels ranging from 4 to 10 ng/ml. We find that compared with the BPH patients, the PCa patients have lower serum AFU expression and smaller values of F/T PSA, both with gray-zone PSA level. We are aware that PSA is secreted by prostate epithelial cells, and its level will be elevated in PCa and BPH (17). Therefore, it is difficult to distinguish early PCa from BPH solely dependent on the PSA expression. In line with a previous study (18), our results indicated that no meaningful difference in PSA levels was observed between BPH and PCa patients with “gray-zone PSA”. To validate and further test the diagnostic reliability of F/T PSA and AFU, the logistic regression analysis was applied. However, the results illustrated that only AFU but not F/T PSA still exhibited a robust and independent diagnostic value for PCa. Likewise, the ROC analysis indicated that the diagnostic efficiency of F/T PSA was inferior compared with that of AFU. These data indicated that the diagnostic value of F/T PSA was more vulnerable to be interfered with other factors such as age and PSA level; for this reason, F/T PSA was not a reliable indicator for PCa patients with gray-zone PSA level. After confirmation of the diagnostic value of AFU for PCa, the possible correlations between AFU expression and PCa patients’ clinicopathological varies, which were further explored. Consistent with the above conclusion, lower expression of AFU implied a worse outcome. Compared with those of the early-stage group (pT1 and pT2 stages), the levels of AFU were markedly decreased in the advanced stage group (pT3 and pT4 stages). Furthermore, the patients with lymph node metastases had lower expression of AFU than those without lymph node metastases. The expression of AFU in prostate tissue was assessed using IHC. Similarly, it indicated the AFU expression was lower in high-grade PCa in contrast to low-grade PCa.
All the above analyses were conducted for AFU protein; next, the mRNA level of AFU was further evaluated based on TCGA database. Previous studies report AFU containing two subtypes, AFU1 and AFU2, which are encoded by genes FUCA1 and FUCA2, respectively (5, 19, 20). Therefore, the relationships between FUCA1/FUCA2 expression and PCa patients’ clinicopathological characteristics were further assessed based on TCGA database. It has long been known that the incidence of malignant disease in human is rapidly increased with aging, while our result suggested that the FUCA1 level was decreased with the increase of age. Beyond that, we found significant correlations among FUCA1/FUCA2 expression and pathological grade, pathological stage, postoperative residual tumor numbers, and primary therapeutic effect. Although FUCA1 and FUCA2 both showed prognostic value for patients’ PFI, the diagnostic performance of FUCA1 is more accurate and stable than that of FUCA2. All of these results imply that FUCA1/FUCA2 may be acting in a tumor-suppressive role, and lower expression of FUCA1/FUCA2 prognosticates worse pathological results, less therapeutic effect, and shorter PFI. This finding is consistent with many previous studies, which further validate the reliability of our conclusion (12, 13, 21–23).
The KEGG analysis indicated the biological function of FUCA1 and FUCA2 mainly involved glycosylation, especially glycoprotein. Glycosylation plays an important role in the initiation and progression of human disease including infection, inflammation, metabolism, and, of course, tumors (24–26). Some well-known tumor markers such as haptoglobin and CA 19-9 are fucosylated glycoproteins (27, 28). Apart from this, several key signal proteins, like integrin, E-cadherin, TGF-β receptors, and epidermal growth factor receptor (EGFR), are glycoproteins as well, which indicates that modification of glycosylation has a complex and crucial effect on their functions (29–32). Remarkably, many studies have revealed that abnormal glycosylation can lead to tumor onset and progression (33–36). AFU encoded by FUCA1 or FUCA2 can remove the terminal fucose residues from glycans and prevents aberrant accumulation of fucose-containing glycans (5, 26). Thus, the lack of AFU, which is responsible for the degradation of glycans, causes the overexpression of glycans and may prompt tumor initiation and development.
In this study, we first showed that AFU could be an effective diagnostic marker for PCa patients who had “gray-zone PSA”. In addition, our study demonstrated that low expression of AFU portends a worse prognosis of PCa. However, some limitations that existed in the present study deserve special attention. First, our study is retrospective research, which only allows for speculation based on the available data. Second, in consideration of the longer survival time of PCa patients, the differences in survival among different subgroups are difficult to be analyzed. Third, by bioinformatics analysis, we speculated that AFU suppressed the progression of PCa via regulation of glycosylation metabolism, which awaited further experimental validation.
Conclusion
AFU can effectively distinguish PCa from patients with gray-zone PSA levels; and lower AFU expression predicates advanced pathological results, poor therapeutic effect, more postoperative residual tumor numbers, and worse prognosis of PCa patients.
Data Availability Statement
The original contributions presented in the study are included in the article/Supplementary Material. Further inquiries can be directed to the corresponding authors.
Ethics Statement
The studies involving human participants were reviewed and approved by the Research Ethics Committee of Qilu Hospital of Shandong University. The patients/participants provided their written informed consent to participate in this study.
Author Contributions
Study design: GC and ZX. Data collection: CZ, JL, DL, and ZX. Writing: CZ, GX, and GC. Editing: CZ, FC, SW, and DH. All authors contributed to the article and approved the submitted version.
Funding
This work was supported by grants from the National Science Foundation of Shanghai (No. 18ZR1405800) and the Project for Key Medical Specialty Construction in Jinshan District (6th Period, Type A) (No. JSZK2019A03) to GC.
Conflict of Interest
The authors declare that the research was conducted in the absence of any commercial or financial relationships that could be construed as a potential conflict of interest.
Publisher’s Note
All claims expressed in this article are solely those of the authors and do not necessarily represent those of their affiliated organizations, or those of the publisher, the editors and the reviewers. Any product that may be evaluated in this article, or claim that may be made by its manufacturer, is not guaranteed or endorsed by the publisher.
Acknowledgments
I am thankful to my fiancee for her help and tolerance and I hope this work can act as a witness for our wedding.
Supplementary Material
The Supplementary Material for this article can be found online at: https://www.frontiersin.org/articles/10.3389/fonc.2021.742354/full#supplementary-material
Abbreviations
PCa, prostate cancer; BPH, benign prostatic hyperplasia; AFU, alpha-l-fucosidase; PSA, prostate-specific antigen; SA, serum sialic acid; LDH, lactate dehydrogenase; AKP, alkaline phosphatase; HR, hazard ratios; PFI, progression-free interval.
References
1. Deng ZH, Yu GS, Deng KL, Feng ZH, Huang Q, Pan B, et al. Hsa_circ_0088233 Alleviates Proliferation, Migration, and Invasion of Prostate Cancer by Targeting hsa-miR-185-3p. Front Cell Dev Biol (2020) 8:528155. doi: 10.3389/fcell.2020.528155
2. Sung H, Ferlay J, Siegel RL, Laversanne M, Soerjomataram I, Jemal A, et al. Global Cancer Statistics 2020: GLOBOCAN Estimates of Incidence and Mortality Worldwide for 36 Cancers in 185 Countries. CA Cancer J Clin (2021) 71(3):209–49. doi: 10.3322/caac.21660
3. Flores-Fraile MC, Padilla-Fernandez BY, Valverde-Martinez S, Marquez-Sanchez M, Garcia-Cenador MB, Lorenzo-Gomez MF, et al. The Association Between Prostate-Specific Antigen Velocity (PSAV), Value and Acceleration, and of the Free PSA/Total PSA Index or Ratio, With Prostate Conditions. J Clin Med (2020) 9(11):3400. doi: 10.3390/jcm9113400
4. Ishida S, Kayamori K, Sakamoto K, Yukimori A, Kugimoto T, Harada H, et al. Alpha-L-Fucosidase-1 Is a Diagnostic Marker That Distinguishes Mucoepidermoid Carcinoma From Squamous Cell Carcinoma. Pathol Int (2019) 69(2):76–85. doi: 10.1111/pin.12764
5. Zhang M, Wang L, Zhang H, Cong J, Zhang L. Serum Alpha-L-Fucosidase Activities are Significantly Increased in Patients With Preeclampsia. Prog Mol Biol Transl Sci (2019) 162:349–62. doi: 10.1016/bs.pmbts.2018.12.008
6. Herrera H, Dilday T, Uber A, Scott D, Zambrano JN, Wang M, et al. Core-Fucosylated Tetra-Antennary N-Glycan Containing A Single N-Acetyllactosamine Branch Is Associated With Poor Survival Outcome in Breast Cancer. Int J Mol Sci (2019) 20(10):2528. doi: 10.3390/ijms20102528
7. Listinsky JJ, Listinsky CM, Alapati V, Siegal GP. Cell Surface Fucose Ablation as a Therapeutic Strategy for Malignant Neoplasms. Adv Anat Pathol (2001) 8(6):330–7. doi: 10.1097/00125480-200111000-00003
8. Huang W, Li X. [Significance of Fucose Expression in Lung Carcinoma and Their Brain Metastases]. Zhonghua Bing Li Xue Za Zhi (2000) 29(4):259–62.
9. Listinsky JJ, Siegal GP, Listinsky CM. The Emerging Importance of Alpha-L-Fucose in Human Breast Cancer: A Review. Am J Transl Res (2011) 3(4):292–322.
10. Fernandez-Rodriguez J, Paez de la Cadena M, Martinez-Zorzano VS, Rodriguez-Berrocal FJ. Fucose Levels in Sera and in Tumours of Colorectal Adenocarcinoma Patients. Cancer Lett (1997) 121(2):147–53. doi: 10.1016/s0304-3835(97)00343-1
11. Ayude D, Fernandez-Rodriguez J, Rodriguez-Berrocal FJ, Martinez-Zorzano VS, de Carlos A, Gil E, et al. Value of the Serum Alpha-L-Fucosidase Activity in the Diagnosis of Colorectal Cancer. Oncology (2000) 59(4):310–6. doi: 10.1159/000012188
12. Otero-Estevez O, Martinez-Fernandez M, Vazquez-Iglesias L, Paez de la Cadena M, Rodriguez-Berrocal FJ, Martinez-Zorzano VS. Decreased Expression of Alpha-L-Fucosidase Gene FUCA1 in Human Colorectal Tumors. Int J Mol Sci (2013) 14(8):16986–98. doi: 10.3390/ijms140816986
13. Ezawa I, Sawai Y, Kawase T, Okabe A, Tsutsumi S, Ichikawa H, et al. Novel P53 Target Gene FUCA1 Encodes a Fucosidase and Regulates Growth and Survival of Cancer Cells. Cancer Sci (2016) 107(6):734–45. doi: 10.1111/cas.12933
14. Shuang Z, Mao Y, Lin G, Wang J, Huang X, Chen J, et al. Alpha-L-Fucosidase Serves as a Prognostic Indicator for Intrahepatic Cholangiocarcinoma and Inhibits Its Invasion Capacity. BioMed Res Int (2018) 2018:8182575. doi: 10.1155/2018/8182575
15. Mazzone E, Dell'Oglio P, Rosiello G, Puliatti S, Brook N, Turri F, et al. Technical Refinements in Superextended Robot-Assisted Radical Prostatectomy for Locally Advanced Prostate Cancer Patients at Multiparametric Magnetic Resonance Imaging. Eur Urol (2021) 80(1):104–12. doi: 10.1016/j.eururo.2020.09.009
16. Wittekind C, Compton CC, Greene FL, Sobin LH. TNM Residual Tumor Classification Revisited. Cancer (2002) 94(9):2511–6. doi: 10.1002/cncr.10492
17. Inahara M, Suzuki H, Kojima S, Komiya A, Fukasawa S, Imamoto T, et al. Improved Prostate Cancer Detection Using Systematic 14-Core Biopsy for Large Prostate Glands With Normal Digital Rectal Examination Findings. Urology (2006) 68(4):815–9. doi: 10.1016/j.urology.2006.05.010
18. Liu J, Wang ZQ, Li M, Zhou MY, Yu YF, Zhan WW. Establishment of Two New Predictive Models for Prostate Cancer to Determine Whether to Require Prostate Biopsy When the PSA Level Is in the Diagnostic Gray Zone (4-10 Ng Ml(-1)). Asian J Androl (2020) 22(2):213–6. doi: 10.4103/aja.aja_46_19
19. Darby JK, Willems PJ, Nakashima P, Johnsen J, Ferrell RE, Wijsman EM, et al. Restriction Analysis of the Structural Alpha-L-Fucosidase Gene and Its Linkage to Fucosidosis. Am J Hum Genet (1988) 43(5):749–55.
20. Eiberg H, Mohr J, Nielsen LS. Linkage of Plasma Alpha-L-Fucosidase (FUCA2) and the Plasminogen (PLG) System. Clin Genet (1984) 26(1):23–9. doi: 10.1111/j.1399-0004.1984.tb00782.x
21. Milde-Langosch K, Karn T, Schmidt M, zu Eulenburg X, Oliveira-Ferrer L, Wirtz RM, et al. Prognostic Relevance of Glycosylation-Associated Genes in Breast Cancer. Breast Cancer Res Treat (2014) 145(2):295–305. doi: 10.1007/s10549-014-2949-z
22. Wang Y, Yan K, Lin J, Li J, Bi J. Macrophage M2 Co-Expression Factors Correlate With the Immune Microenvironment and Predict Outcome of Renal Clear Cell Carcinoma. Front Genet (2021) 12:615655. doi: 10.3389/fgene.2021.615655
23. Vecchio G, Parascandolo A, Allocca C, Ugolini C, Basolo F, Moracci M, et al. Human a-L-Fucosidase-1 Attenuates the Invasive Properties of Thyroid Cancer. Oncotarget (2017) 8(16):27075–92. doi: 10.18632/oncotarget.15635
24. Li J, Hsu HC, Mountz JD, Allen JG. Unmasking Fucosylation: From Cell Adhesion to Immune System Regulation and Diseases. Cell Chem Biol (2018) 25(5):499–512. doi: 10.1016/j.chembiol.2018.02.005
25. Lan Y, Hao C, Zeng X, He Y, Zeng P, Guo Z, et al. Serum Glycoprotein-Derived N- and O-Linked Glycans as Cancer Biomarkers. Am J Cancer Res (2016) 6(11):2390–415.
26. Darby JK, Johnsen J, Nakashima P, Willems PJ, O'Brien JS, Fowler ML, et al. Pvu II RFLP at the Human Chromosome 1 Alpha-L-Fucosidase Gene Locus (Fuca1). Nucleic Acids Res (1986) 14(23):9543. doi: 10.1093/nar/14.23.9543
27. Miyoshi E, Moriwaki K, Nakagawa T. Biological Function of Fucosylation in Cancer Biology. J Biochem (2008) 143(6):725–9. doi: 10.1093/jb/mvn011
28. Takeda Y, Shinzaki S, Okudo K, Moriwaki K, Murata K, Miyoshi E. Fucosylated Haptoglobin Is a Novel Type of Cancer Biomarker Linked to the Prognosis After an Operation in Colorectal Cancer. Cancer (2012) 118(12):3036–43. doi: 10.1002/cncr.26490
29. Hu P, Shi B, Geng F, Zhang C, Wu W, Wu XZ. E-Cadherin Core Fucosylation Regulates Nuclear Beta-Catenin Accumulation in Lung Cancer Cells. Glycoconj J (2008) 25(9):843–50. doi: 10.1007/s10719-008-9144-6
30. Zhao Y, Itoh S, Wang X, Isaji T, Miyoshi E, Kariya Y, et al. Deletion of Core Fucosylation on Alpha3beta1 Integrin Down-Regulates Its Functions. J Biol Chem (2006) 281(50):38343–50. doi: 10.1074/jbc.M608764200
31. Lin H, Wang D, Wu T, Dong C, Shen N, Sun Y, et al. Blocking Core Fucosylation of TGF-Beta1 Receptors Downregulates Their Functions and Attenuates the Epithelial-Mesenchymal Transition of Renal Tubular Cells. Am J Physiol Renal Physiol (2011) 300(4):F1017–25. doi: 10.1152/ajprenal.00426.2010
32. Wang X, Gu J, Ihara H, Miyoshi E, Honke K, Taniguchi N. Core Fucosylation Regulates Epidermal Growth Factor Receptor-Mediated Intracellular Signaling. J Biol Chem (2006) 281(5):2572–7. doi: 10.1074/jbc.M510893200
33. Brockhausen I. Mucin-Type O-Glycans in Human Colon and Breast Cancer: Glycodynamics and Functions. EMBO Rep (2006) 7(6):599–604. doi: 10.1038/sj.embor.7400705
34. Dube DH, Bertozzi CR. Glycans in Cancer and Inflammation–Potential for Therapeutics and Diagnostics. Nat Rev Drug Discov (2005) 4(6):477–88. doi: 10.1038/nrd1751
35. Lau KS, Dennis JW. N-Glycans in Cancer Progression. Glycobiology (2008) 18(10):750–60. doi: 10.1093/glycob/cwn071
Keywords: prostate cancer, AFU, diagnosis, tumor progression, progression-free interval
Citation: Zhang C, Liu J, Chao F, Wang S, Li D, Han D, Xu Z, Xu G and Chen G (2021) Alpha-L-Fucosidase Has Diagnostic Value in Prostate Cancer With “Gray-Zone PSA” and Inhibits Cancer Progression via Regulating Glycosylation. Front. Oncol. 11:742354. doi: 10.3389/fonc.2021.742354
Received: 16 July 2021; Accepted: 29 October 2021;
Published: 22 November 2021.
Edited by:
Tanya I. Stoyanova, Stanford University, United StatesCopyright © 2021 Zhang, Liu, Chao, Wang, Li, Han, Xu, Xu and Chen. This is an open-access article distributed under the terms of the Creative Commons Attribution License (CC BY). The use, distribution or reproduction in other forums is permitted, provided the original author(s) and the copyright owner(s) are credited and that the original publication in this journal is cited, in accordance with accepted academic practice. No use, distribution or reproduction is permitted which does not comply with these terms.
*Correspondence: Gang Chen, Y2hnYW4zNjVAMTI2LmNvbQ==; Zhonghua Xu, eHV6aG9uZ2h1YTE5NjNAMTYzLmNvbQ==