 Muhanad Alhujaily1,2
 Hafsa Abbas2
 Mingzhan Xue2,3
 Alberto de la Fuente3
 Naila Rabbani4,5
 Paul J. Thornalley2,3*
- 1College of Applied Medical Sciences, University of Bisha, Bisha, Saudi Arabia
- 2Clinical Sciences Research Laboratories, Warwick Medical School, University of Warwick, University Hospital, Coventry, United Kingdom
- 3Diabetes Research Center, Qatar Biomedical Research Institute, Hamad Bin Khalifa University, Qatar Foundation, Doha, Qatar
- 4Department of Basic Medical Science, College of Medicine, QU Health, Qatar University, Doha, Qatar
- 5Biomedical & Pharmaceutical Research Unit, QU Health, Qatar University, Doha, Qatar
Background: Tumor glycolysis is a target for cancer chemotherapy. Methylglyoxal (MG) is a reactive metabolite formed mainly as a by-product in anaerobic glycolysis, metabolized by glyoxalase 1 (Glo1) of the glyoxalase system. We investigated the role of MG and Glo1 in cancer chemotherapy related in multidrug resistance (MDR).
Methods: Human Glo1 was overexpressed in HEK293 cells and the effect on anticancer drug potency, drug-induced increase in MG and mechanism of cytotoxicity characterized. Drug-induced increased MG and the mechanisms driving it were investigated and the proteomic response to MG-induced cytotoxicity explored by high mass resolution proteomics of cytoplasmic and other subcellular protein extracts. Glo1 expression data of 1,040 human tumor cell lines and 7,489 tumors were examined for functional correlates and impact of cancer patient survival.
Results: Overexpression of Glo1 decreased cytotoxicity of antitumor drugs, impairing antiproliferative activity of alkylating agents, topoisomerase inhibitors, antitubulins, and antimetabolites. Antitumor drugs increased MG to cytotoxic levels which contributed to the cytotoxic, antiproliferative mechanism of action, consistent with Glo1-mediated MDR. This was linked to off-target effects of drugs on glycolysis and was potentiated in hypoxia. MG activated the intrinsic pathway of apoptosis, with decrease of mitochondrial and spliceosomal proteins. Spliceosomal proteins were targets of MG modification. Spliceosomal gene expression correlated positively with Glo1 in human tumor cell lines and tumors. In clinical chemotherapy of breast cancer, increased expression of Glo1 was associated with decreased patient survival, with hazard ratio (HR) = 1.82 (logrank p < 0.001, n = 683) where upper quartile survival of patients was decreased by 64% with high Glo1 expression.
Conclusions: We conclude that MG-mediated cytotoxicity contributes to the cancer chemotherapeutic response and targets the spliceosome. High expression of Glo1 contributes to multidrug resistance by shielding the spliceosome from MG modification and decreasing survival in the chemotherapy of breast cancer. Adjunct chemotherapy with Glo1 inhibitor may improve treatment outcomes.
Introduction
Cancer is increasing in incidence and mortality worldwide (1). Although improvements have been made in cancer chemotherapy, drug resistance and the resulting decline in effectiveness of drug treatment are considered to contribute to 90% of cancer-related deaths (2). Countering drug resistance effectively is limited by its multifactorial mechanisms which may change in relative importance as tumor stage advances. A common feature of resistance to antiproliferative, cytotoxic antitumor drugs is a cytoprotective response (3). Tumor cell metabolism, including glycolysis, is an influential factor in efficacy of cytotoxic antitumor drug (4), influencing response and development of resistance (5, 6). Formation and metabolism of the glycolysis-linked reactive metabolite, methylglyoxal (MG), has a historical link to the glyoxalase pathway in tumor metabolism, although its role in cancer treatment and multidrug resistance (MDR) is not fully understood (7).
The glyoxalase system catalyzes the metabolism of the reactive dicarbonyl metabolite, methylglyoxal (MG), to D-lactate. Glyoxalase 1 (Glo1) catalyzes the glutathione (GSH)-dependent metabolism of MG to S-D-lactoylglutathione. Glyoxalase 2 (Glo2) catalyzes the hydrolysis of S-D-lactoylglutathione to D-lactate, reforming GSH consumed in the Glo1-catalyzed step (Figure 1A). MG is formed spontaneously by trace-level degradation of triosephosphate glycolytic intermediates, glyceraldehyde-3-phosphate (GA3P) and dihydroxyacetonephosphate (DHAP), and modifies proteins and DNA to form arginine-derived hydroimidazolone, Nδ-(5-hydro-5-methyl-4-imidazolon-2-yl)ornithine (MG-H1), and deoxyguanosine-derived imidazopurinone, 3-(2′-deoxyribosyl)-6,7-dihydro-6,7-dihydroxy-6/7-methylimidazo-[2,3-b]purine-9(8)one (MGdG) as major adducts (Figures 1B, C). Glo1 suppresses the steady-state cellular concentration of MG and thereby the steady-state levels of MG-derived protein and DNA adducts to low, tolerable levels. In previous studies, it has been shown that inhibition of Glo1 in tumor cells in vitro leads to the accumulation of MG, increasing protein and DNA modification (8, 9) and apoptosis (10–12). Treatment of human tumor cells with cell permeable Glo1 inhibitor pro-drug, S-p-bromobenzylglutathione cyclopentyl diester (BBGD)—which delivers the Glo1 competitive inhibitor, S-p-bromobenzylglutathione (Ki = 160 nM) into cells, increased the cellular concentration of MG, protein, and DNA adducts and induced apoptosis (8, 9).
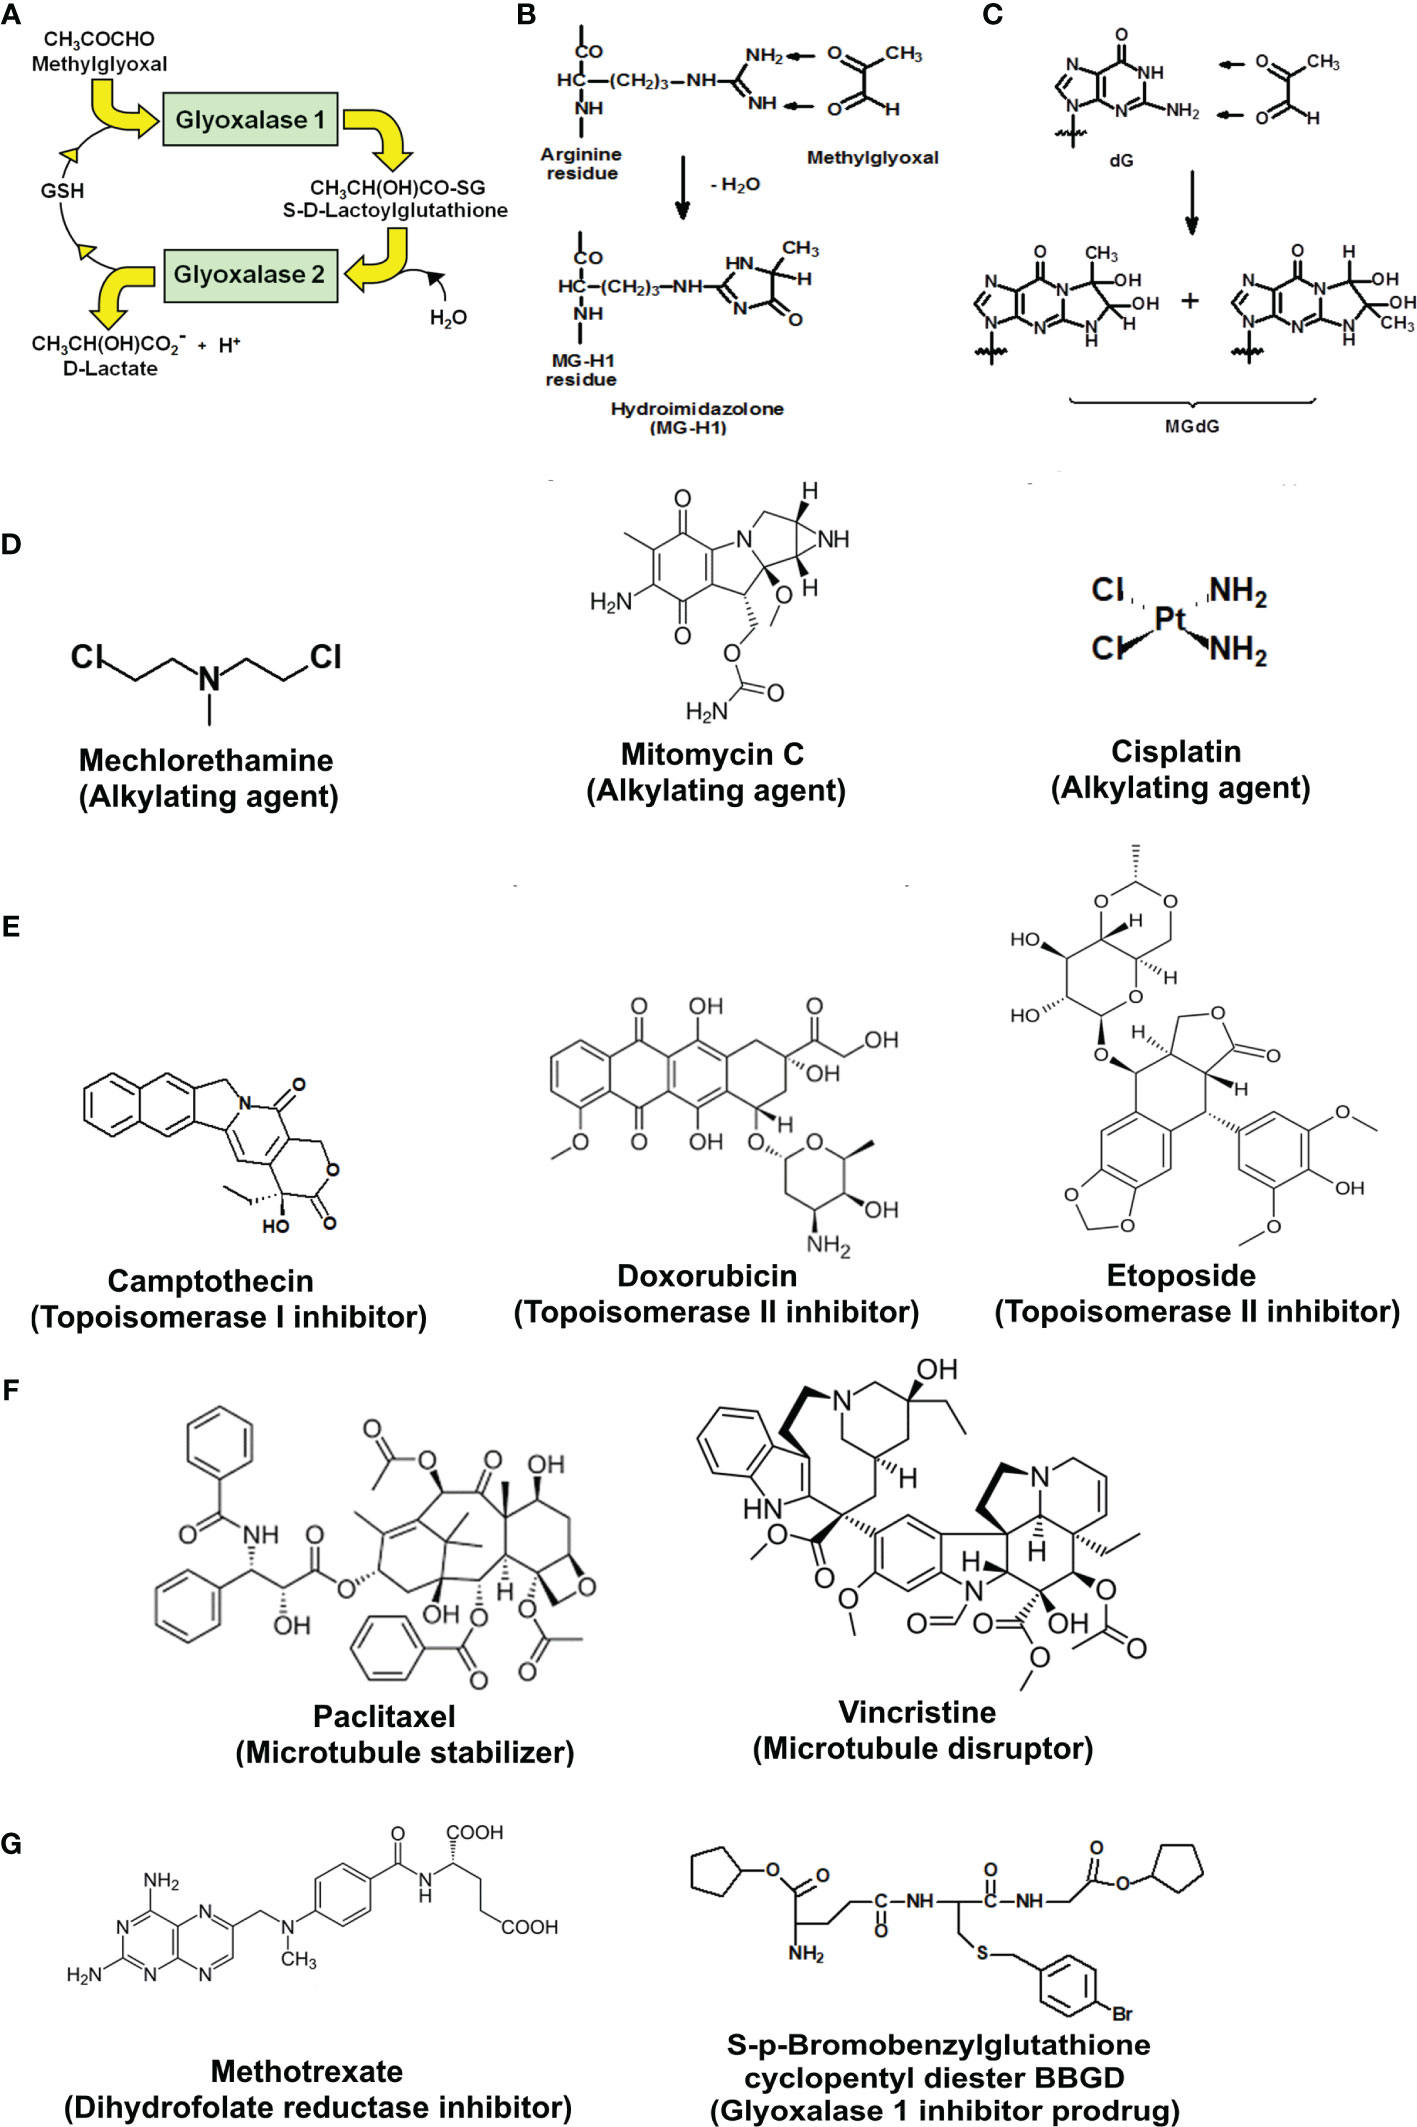
Figure 1 Metabolism of methylglyoxal by the glyoxalase pathway, major glycation reactions of methylglyoxal and clinical and investigational antitumor drugs. (A) Metabolism of methylglyoxal by the glyoxalase pathway. (B) Glycation of arginine residues by methylglyoxal from hydroimidazolone, MG-H1. (C) Glycation of guanyl moieties of DNA by methylglyoxal from isomeric imidazopurinones, MGdG. (D–G) Molecular structures of antitumor drugs. (D) Alkylating agents: mechlorethamine, mitomycin C, and cisplatin. (E) Topoisomerase inhibitors: camptothecin, doxorubicin, and etoposide. (F) Antitubulins: paclitaxel and vincristine. (G) Antimetabolites: methotrexate and glyoxalase 1 inhibitor prodrug, S-p-bromobenzylglutathione cyclopentyl diester (BBGD).
In this study, we explore the effect of overexpression of Glo1 in the antiproliferative activity of clinical antitumor agents, the contribution of MG-induced cytotoxicity in cancer chemotherapy and mechanism of MG increase and cytotoxic response, and Glo1 expression as a risk predictor on cancer chemotherapy outcomes in clinical breast cancer.
Methods
Antibodies, Anticancer Drugs, and Other Reagents
Rat monoclonal anti-Glo1 antibody (SAB4200193) and anti-Rat IgG-biotin conjugate (B7139) were from Sigma-Aldrich (Poole, Dorset, UK). Human cytochrome c ELISA kit (QIA74) was from Oncogene Research Products (San Diego, CA, USA). Mechlorethamine (C2942) was from Cambridge Bioscience Ltd. (Cambridge, UK). Mitomycin C (M4287, from Streptomyces caespitosus), cisplatin (479306), S-(+)-camptothecin (C9911), doxorubicin (D1515), etoposide (E1383), paclitaxel (T7402), vincristine (V8879), and methotrexate (06563) were from Sigma-Aldrich. S-p-Bromobenzylglutathione cyclopentyl diester was prepared in-house (8). D-Lactic dehydrogenase (L9636), pepsin (EC 3.4.23.1; porcine stomach mucosa; P6887), pronase E (EC 3.4.24.31, type XIV, from Streptomyces griseus; P5147), prolidase (EC 3.4.13.9; porcine kidney; P6675), and leucine aminopeptidase (EC 3.4.11.2, type VI, porcine kidney, L9776) were from Sigma-Aldrich. Geneticin (700 µg G-418) was from Fisher Scientific (Loughborough, UK). The HEK293 cell line (CRL-1573) was ATCC (Virginia, USA), and vectors pIRES2-GLO1-EGFP and pIRES2-EGFP were prepared in-house (13).
Culture of HEK293 Cells In Vitro
The HEK293 cell line, seeding density 2 × 10⁴ cells cm−2, was cultured in Dulbecco’s modified Eagle’s medium (DMEM) containing phenol red, L-glutamine, and 4,500 mg/l glucose, supplemented with 10% fetal bovine serum (FBS), 100 U penicillin, and 0.1 mg/ml streptomycin. pIRES2-GLO1-EGFP plasmid (Glo1+ vector) and pIRES2-EGFP plasmid (empty vector) were prepared as described (13). HEK293 cells stably transfected with Glo1 expression plasmid pIRES2-GLO1-EGFP and empty vector pIRE2-EGFP using Lipofectamine 2000 according to the manufacturer’s instructions (plasmid DNA: Lipofectamine 2000, 1:4). After 48 h, cells were subcultured with G-418 disulfate supplement. Transfected colonies with GFP fluorescence were selected using a cloning disc (3.2 mm) and glass cylinder selector (8 mm, 150 µl) and cultured further with G-418 disulfate-containing medium. Assessment of Glo1 activity and protein, as described (14, 15), indicated a four- to fivefold increase in Glo1 activity and protein, as previously reported (16). HEK293 cells stably tranfected with empty and GLO1+ vectors were incubated for 2 days with and without the anticancer drugs at the concentrations indicated—diluted from 100 mM stock solution in dimethylsulfoxide (DMSO), except dimethylformamide (DMF) for cisplatin. The effect on cell growth was assessed by viable cell number counts, using the Trypan blue exclusion method and median growth inhibitory concentrations GC50 deduced. For BBGD, cultures were also performed under an atmosphere of 3% oxygen as a model of hypoxia. HEK293 cells were incubated with 15–400 µM MG for 48 h to determine the GC50 of MG and with 131 µM MG for 6, 12, and 24 h with medium replacement and continued culture for 48 h to determine the period of exposure to MG required for growth arrest and cytotoxicity. Cellular MG concentration and flux of formation of D-lactate, a surrogate measure of flux of formation of MG, was assayed as described (17, 18).
Preparation of Cellular Protein Extracts for Proteomics
Protein extracts of total cell cytoplasm, nuclei, mitochondrial matrix, and intermembrane space and mitochondrial membranes were prepared from HEK293 cells (3 × 10⁶) incubated with and without 131 µM MG for 6 h by adaptation of protocols for subcellular fraction proteomics (19). Protein abundances were analyzed by label-free high-resolution Orbitrap mass spectrometry of tryptic digests, as described (20).
For cytoplasmic extracts, cell pellets were suspended in 10 mM sodium phosphate buffer, pH 7.0, sonicated on ice (110 W, 30 s, 4°C), and membranes sedimented by centrifugation (20,000×g, 30 min, 4°C). An aliquot of protein (300 µg) was washed with argon-purged water by ultradiafiltration over a 10-kDa cutoff membrane microspin filter (14,000×g, 20 min, 4°C); 4 cycles of concentration to 50 µl and 10-fold dilution with water. An aliquot of washed protein (100 µg) was used in proteomics analysis.
For the nuclear extract, cells were washed in PBS, resuspended in buffer (0.3 M sucrose, 10 mM MgCl2, 50 mM Tris-HCl, pH 7.8, and 0.1 mM phenylmethylsulphonyl fluoride (PMSF); 1 ml, 4°C), homogenized in a Teflon-glass homogenizer, and centrifuged (1,000×g, 10 min, 4°C). The pellet was suspended in further buffer without PMSF (0.1 ml) and layered onto a “sucrose cushion” of 2 M sucrose in the same buffer; 1 ml. After centrifugation (16,000×g, 20 min, 4°C), the supernatant was discarded, the pellet of purified nuclei washed twice in PBS, resuspended in buffer (20 mM HEPES, pH 7.9, 1.5 mM MgCl2, 0.5 M NaCl, 0.2 mM EDTA, and 20% glycerol; 25 µl) and incubated for 30 min with gentle rocking at 4°C. Nuclei were then lysed with 10 passages through an 18-gauge needle, the lysate centrifuged (9,000×g, 30 min 4°C), and the supernatant used for proteomics analysis.
For mitochondrial protein extracts, cell pellets were resuspended in isotonic buffer (25 M sucrose, 5 mM Tris-HCl, pH 7.5, and 0.1 mM PMSF; 1 ml) and disrupted in a glass-Teflon homogenizer. Unbroken cells and nuclei were sedimented by centrifugation (600×g, 15 min, 4°C) and supernatants centrifuged again (10,000×g, 25 min, 4°C) to collect the pellet of mitochondria. The mitochondrial pellet was washed once with isotonic buffer containing 1 mM EDTA, pH 7.5; 1 ml. For the mitochondrial matrix and intermembrane space protein extract, samples were suspended in lysis buffer (1 mM dithiothreitol (DTT) and 10 mM HEPES pH 7.4; 200 µl), incubated at 4°C for 30 min, and then sonicated (110 W, 3 × 30 s, 4°C) and centrifuged (1 h, 120,000×g, 4°C). The supernatant was transferred to a 3-kDa cutoff filter and washed by ultradiafiltration at 4°C, concentrating finally to 25 μl and the washed protein used in proteomics analysis. For the mitochondrial membrane protein extract, the membrane pellet was treated with membrane extraction buffer (20 mM Tris-HCl, pH 7.4; 0.4 M NaCl, 15% glycerol, 1 mM DTT, and 1.5% Triton-X-100; 0.2 ml) and samples shaken gently at 4°C for 1 h. Samples were then centrifuged (20,000×g, 4°C, 1 h). The supernatant was retained and protein washed by ultradiafiltration in 1.5% Triton-X100. Protein content was quantified with EZQ™ method and Triton-X100 removed by extraction with ethylacetate (21) before proteomics analysis.
Proteomics Analysis
Protein extracts (100 µg) were reduced by treatment with DTT (6 μl, 6 mM) in the dark for 30 min at 37°C, and then alkylated by treatment with iodoacetamide (5.9 µl, 10.8 mM). Residual iodoacetamide was quenched by further addition of DTT (5.9 μl, 6 mM). Lys-C protease (1 mg/ml, 5 µl) in 500 mM ammonium bicarbonate, pH 8.0, was added, and samples were incubated for 1 h at 37°C. TPCK-treated trypsin (1 mg/ml, 5 µl) in 1 mM calcium chloride/500 mM ammonium bicarbonate, pH 8.0, was then added, and samples were incubated at 37°C for 5 h. An aliquot of 10% trifluoracetic acid in water (5 µl) was added to stop the reaction. Samples were then lyophilized to dryness and resuspended in 0.1% formic acid in water. Processed cell lysate samples were submitted for a label-free proteomic quantitation analysis by reversed phase nanoflow liquid chromatography-mass spectrometry-Orbitrap Fusion mass spectrometer equipped with a microspray source operating in positive ion mode, as previously described (18).
For the peptide ion data search, Mascot (Matrix Science, version 2.5.0) was used against a Homo sapiens database (http://www.uniprot.org/), with product ions and precursor error mass ±5 ppm and ±0.8 Da and allowance made for six trypsin-missed cleavages, carbamidomethylated cysteine, MG-H1, and methionine sulfoxide residues. Only fully tryptic peptide matches were included. Scaffold (version Scaffold 4.3.2, Proteome Software Inc.) was used to validate MS/MS peptide fragmentation and protein identification (false discovery rate (FDR) <5%) and ≥2 unique peptides, with detection probabilities assigned using protein prophet algorithm (22). Label-free quantitation of protein abundances were determined in three independent biological replicate samples using Progenesis QI for proteomics 2.0 software (Nonlinear Dynamics, Newcastle, UK). For the pathway enrichment analysis in transcriptomic and proteomic datasets, pathway analysis was performed using Database for Annotation, Visualization and Integrated Discovery v6.8 (https://david.ncifcrf.gov/) (23). KEGG and REACTOME analyses were used for pathway enrichment analysis and INTERPRO analysis for enrichment of protein domains. Pathway and domain enrichment were considered significant with FDR <0.05.
Cancer Bioinformatics Database CCLE
Data on gene copy number and expression (RNA-seq) in human tumor cell lines were extracted from the Cancer Cell Line Encyclopedia (CCLE) database (https://portals.broadinstitute.org/ccle) for 1,040 human tumor cell lines. Correlation analysis was performed using the R program and Pearson correlation analysis performed on mRNA copy number expressed as reads per kilobase million (RPKM). Data for 10,758 genes were available and a Bonferroni correction applied on outcomes. A Protein Interaction Network was prepared for 340 genes with strong positive correlation with Glo1 expression. The gene list was submitted to STRING (https://string-db.org/) and a network among them prepared based on “experiments” and “databases” as active sources with the highest confidence level (interaction score >0.9). This resulted in a network with 1,617 edges and 322 nodes (18 identifiers could not be mapped) with an average node degree of 10. The network was clustered using the Markov Clustering Algorithm with inflation parameter set to three and the nodes were colored according to the enriched KEGG pathways indicated.
Kaplan-Meier Survival Analysis Database
The Kaplan-Meier plotter analysis tool (http://kmplot.com/analysis/) was used for the analysis of the impact of Glo1 and Glo2 expression on overall survival of breast cancer patients treated with chemotherapy. Correlation analysis was also performed for expression of Glo1 with PPIL1, CDC5L, and TRADD in pan cancer database (7,489 multiple types of human tumor; RNA seq) and breast cancer (n = 4,939, gene chip). The output variables were number of patients, hazard ratio and upper quartile survival (months) for low/high gene expression cohorts, and Logrank p-value (24, 25). Chemotherapy received by patients in this dataset was doxorubicin, mitomycin C, and alkylating agents, cyclophosphamide and thiotepa.
Statistical Analysis
Data are expressed as mean ± SD or SEM, as indicated. Statistical analyses were performed with SPSS, version 24. Normality of data distribution was assessed using Kolmogorov-Smirnov test. Comparisons between two groups were performed using two-tailed Student’s t-test for normally distributed data and Mann-Whitney U test for non-normally distributed data. Differences between multiple groups with one variable were determined using one-way ANOVA for normally distributed data and Kruskal-Wallis test for nonnormally distributed data. Correlation analysis used Pearson and Spearman methods for normally distributed and nonnormally distributed data, respectively.
Results
Overexpression of Glyoxalase 1 in HEK-293 Cells Decreases Antiproliferative Activity of Clinical Antitumor Drugs
We studied the effect of overexpression of Glo1 on the antiproliferative, cytotoxic activity of antitumor drugs: alkylating agents—mechlorethamine, mitomycin C, and cisplatin (Figure 1D); topoisomerase inhibitors—camptothecin, doxorubicin, and etoposide (Figure 1E); antitubulins—paclitaxel and vincristine (Figure 1F); and antimetabolite—methotrexate (Figure 1G). We found overexpression of Glo1 decreased the antiproliferative activity for most anticancer drugs. In order of increasing effect, MDR (fold increase in GC50) was vincristine, 1.3-fold; etoposide, 2-fold; mechlorethamine and methotrexate, 7-fold; paclitaxel, 8-fold; mitomycin C, 15-fold; and doxorubicin, 16-fold (Figures 2A–I and Table 1). MG is the major dicarbonyl endogenous substrate metabolized by Glo1 (26). This finding suggests that anticancer drugs may increase steady-state cellular concentrations of MG to toxic levels as part of their mechanism of action. To test this, we measured the cellular concentration of MG in HEK293 cells after treatment for 3 h with drugs for which Glo1 overexpression produced resistance. Cellular MG concentration was increased twofold with mitomycin C, threefold with mechlorethamine and etoposide, fivefold with doxorubicin and paclitaxel, and eightfold with methotrexate (Figure 3A). Increased MG concentration is often linked to inhibition of Glo1, as in the mechanism of action of BBGD (8) and/or increased formation of MG by increased glycolysis (18). BBGD increased the endogenous concentration of cellular MG by fivefold and also had cytotoxic, antiproliferative activity: GC50 = before 5.12 ± 0.33 µM (n = 18). None of the drugs studied were potent inhibitors of Glo1 over the concentration range studied (Supplementary Figure S1). Rather, the increase of MG may be related to increased flux of formation of MG, as reflected in increased flux of formation of D-lactate—as surrogate measure of flux of formation of MG (27). To explore this, we studied the effect of the 2 × GC50 concentration of anticancer drugs on the flux of formation of D-lactate. The flux of formation of D-lactate over the initial 24 h of drug treatment was increased ca. twofold by treatment with mechlorethamine, doxorubicin, paclitaxel, and methotrexate (Figure 3B). Increased D-lactate often reflects a proportionate increase in metabolism of glucose through glycolysis (18, 28). To test this, we measured the flux of consumption of glucose by HEK293 cells in the initial 24 h of treatment with doxorubicin and found that the flux of glucose consumption was indeed increased twofold, proportionate to increase of flux of D-lactate (Figure 3C). This suggests doxorubicin increased the cellular concentration of MG by increasing the flux of formation of MG as a consequence of the increased of flux of glucose metabolism through glycolysis.
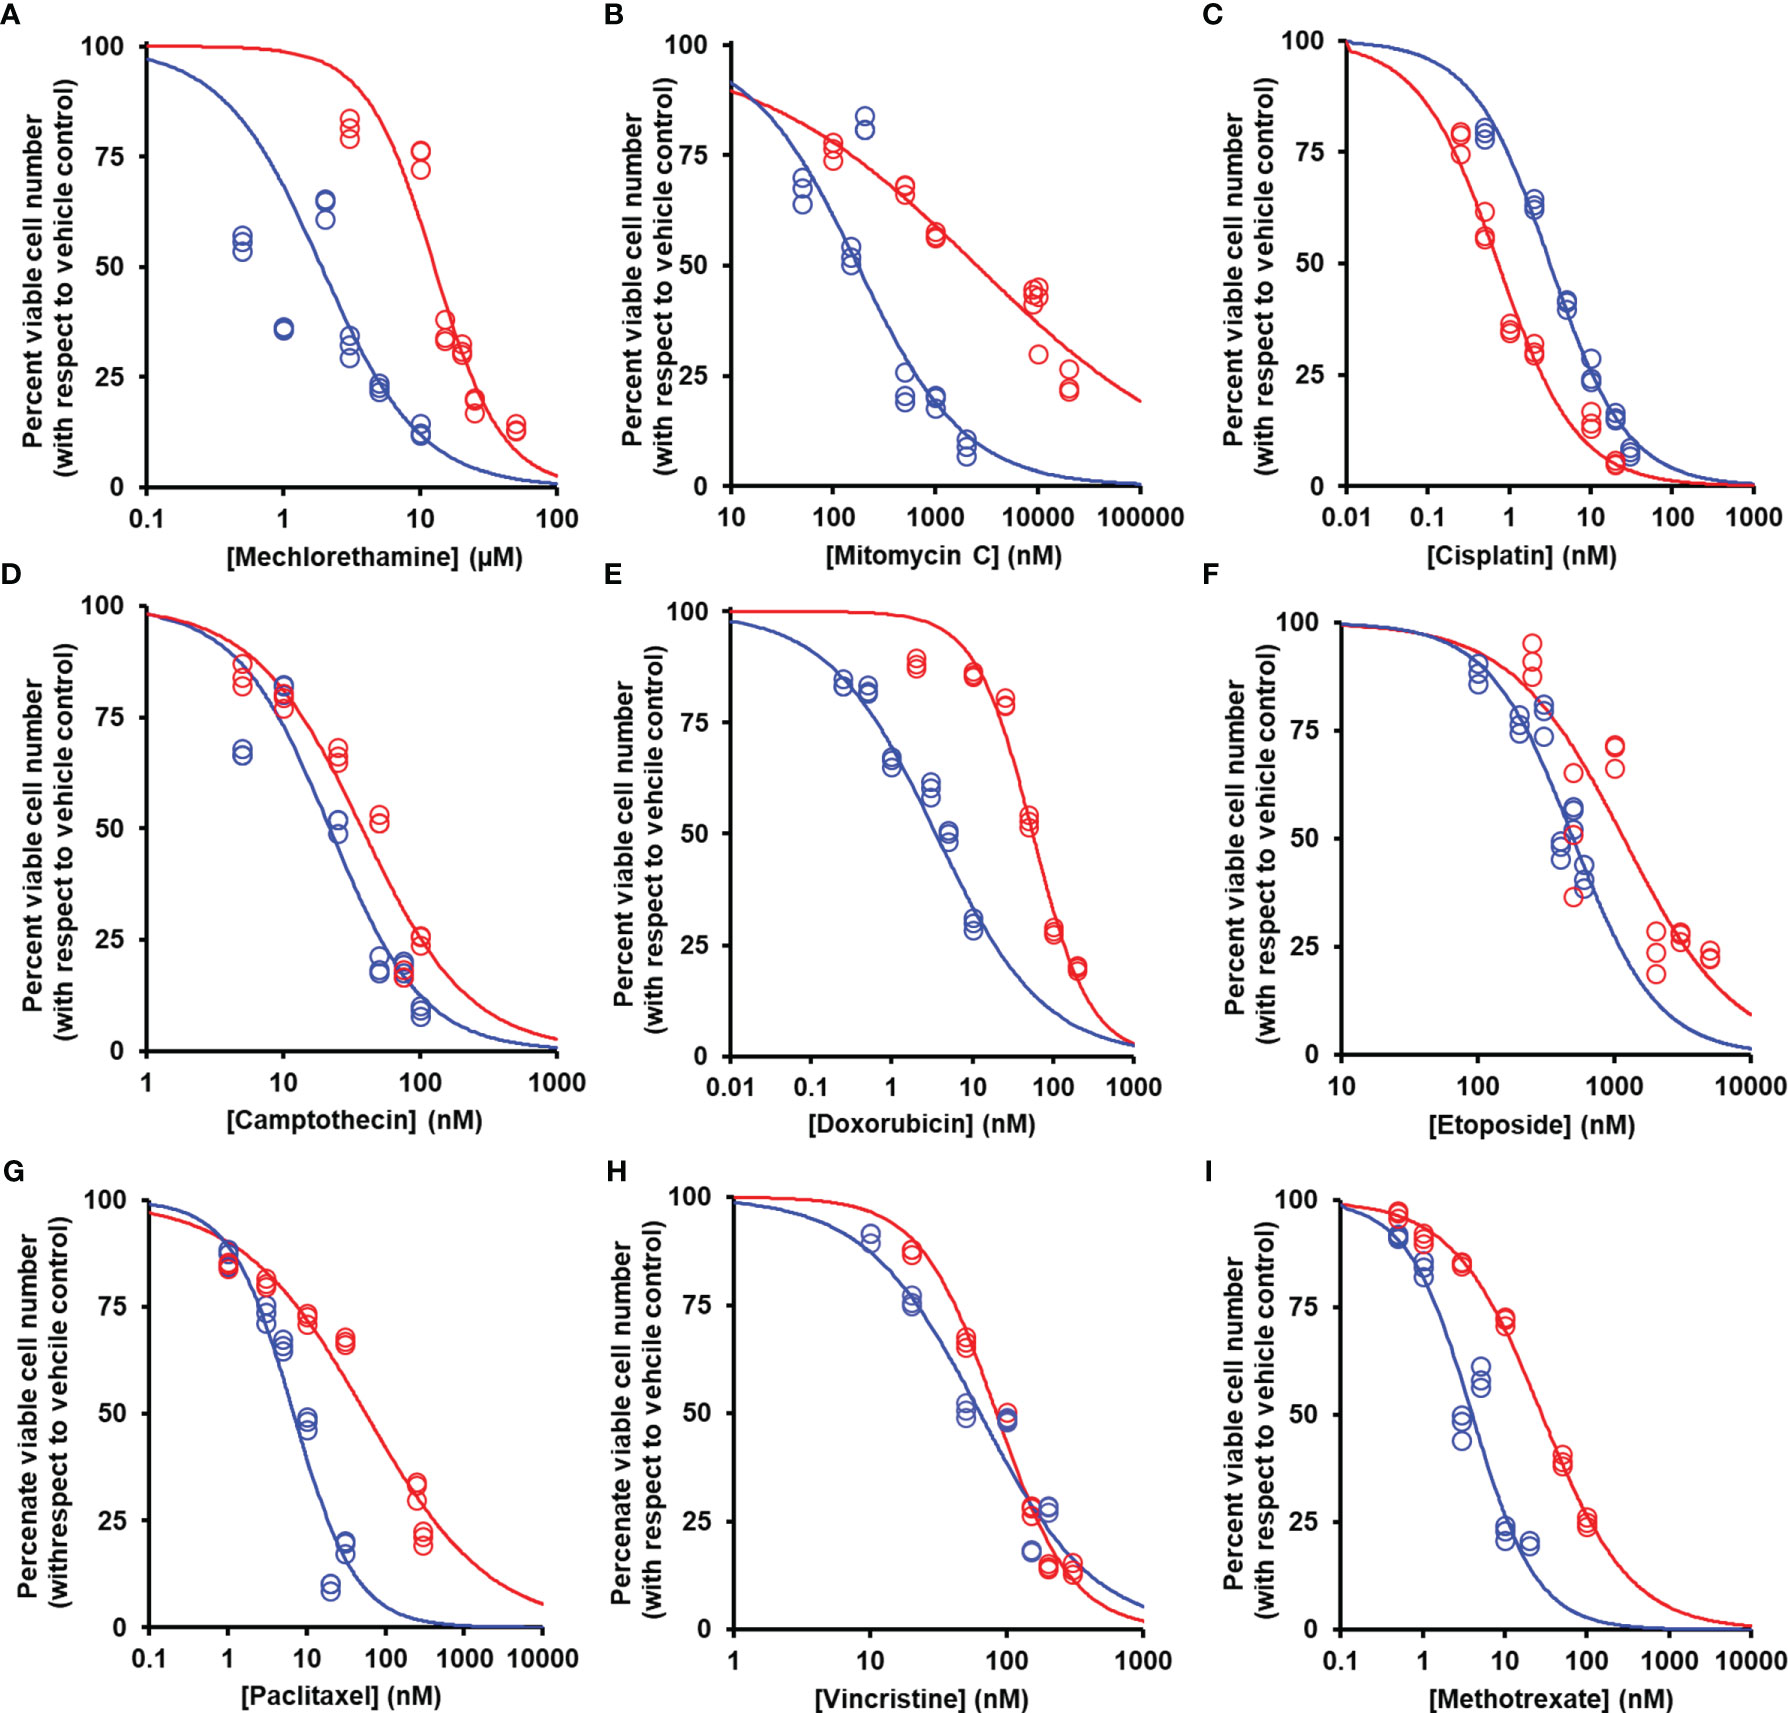
Figure 2 Suppression of antiperoxidative activity of clinical antitumor drugs by overexpression of glyoxalase. Color code for blue data points and curve: blue, empty vector transfected; red, Glo1+ vector transfected. (A) Mechlorethamine. GC50 = 1.90 ± 0.11 µM, n = 1.20 ± 0.09 (empty vector) and GC50 = 12.70 ± 0.90 µM, n = 1.75 ± 0.26 (Glo1+; sevenfold resistance). (B) Mitomycin C. GC50 = 174 ± 29 nM, n = 0.83 ± 0.12 (empty vector) and GC50 = 2,541 ± 360 nM, n = 0.39 ± 0.03 (Glo1+; 15-fold resistance). (C) Cisplatin. GC50 = 3.17 ± 0.35 µM, n = 0.92 ± 0.04 (empty vector) and GC50 = 0.73 ± 0.05 µM, n = 0.89 ± 0.07 (Glo1+; 0.2-fold resistance). (D) Camptothecin. GC50 = 21.8 ± 2.2 nM, n = 1.28 ± 0.15 (empty vector) and GC50 = 37.6 ± 3.3 nM, n = 1.12 ± 0.12 (Glo1+; twofold resistance). (E) Doxorubicin. GC50 = 3.54 ± 0.28 nM, n = 0.71 ± 0.05 (empty vector) and GC50 = 55.9 ± 3.4 nM, n = 1.24 ± 0.10 (Glo1+; 16-fold resistance). (F) Etoposide. GC50 = 500 ± 32 nM, n = 1.41 ± 0.19 (empty vector) and GC50 = 1,170 ± 169 nM, n = 1.06 ± 0.17 (Glo1+; twofold resistance). (G) Paclitaxel. GC50 = 6.8 ± 1.0 nM, n = 1.07 ± 0.17 (empty vector) and GC50 = 56.4 ± 7.2 nM, n = 0.55 ± 0.04 (Glo1+; eightfold resistance). (H) Vincristine. GC50 = 63.4 ± 5.2 nM, n = 1.04 ± 0.10 (empty vector) and GC50 = 83.7 ± 3.3 nM, n = 1.57 ± 0.10 (Glo1+; 1.3-fold resistance). (I) Methotrexate. GC50 = 4.02 ± 0.35 nM, n = 1.10 ± 0.10 (empty vector) and GC50 = 28.5 ± 0.9 nM, n = 0.81 ± 0.02 (Glo1+; sevenfold resistance). Data were fitted by nonlinear regression to the dose-response equation: Viable cell number (% of control) = 100 × GC50n/(GC50n + [Drug]n), solving for GC50 and n (logistic regression coefficient) and plotting the outcome dose-response curves given (six drug concentrations in triplicate; n = 18). GC50 values are summarized (Table 1). Data for doxorubicin and paclitaxel and evidence of increased Glo1 protein in the Glo1+ cell line have been published previously (16).
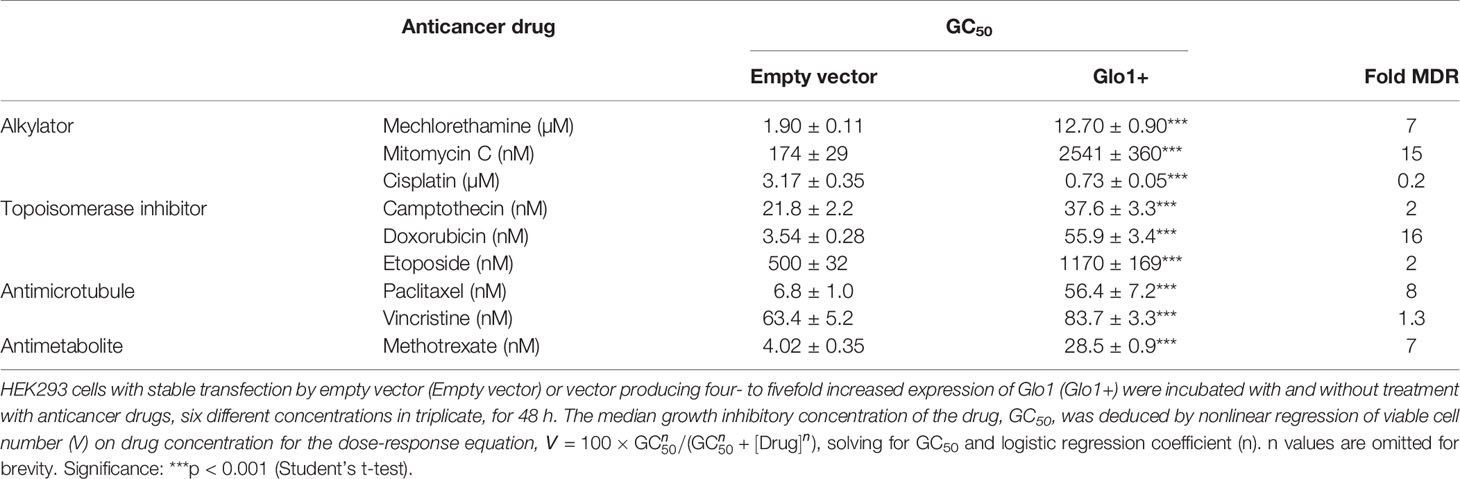
Table 1 Median growth inhibitory concentration of anticancer drugs of HEK-293 cells in vitro—effect of overexpression of glyoxalase 1.
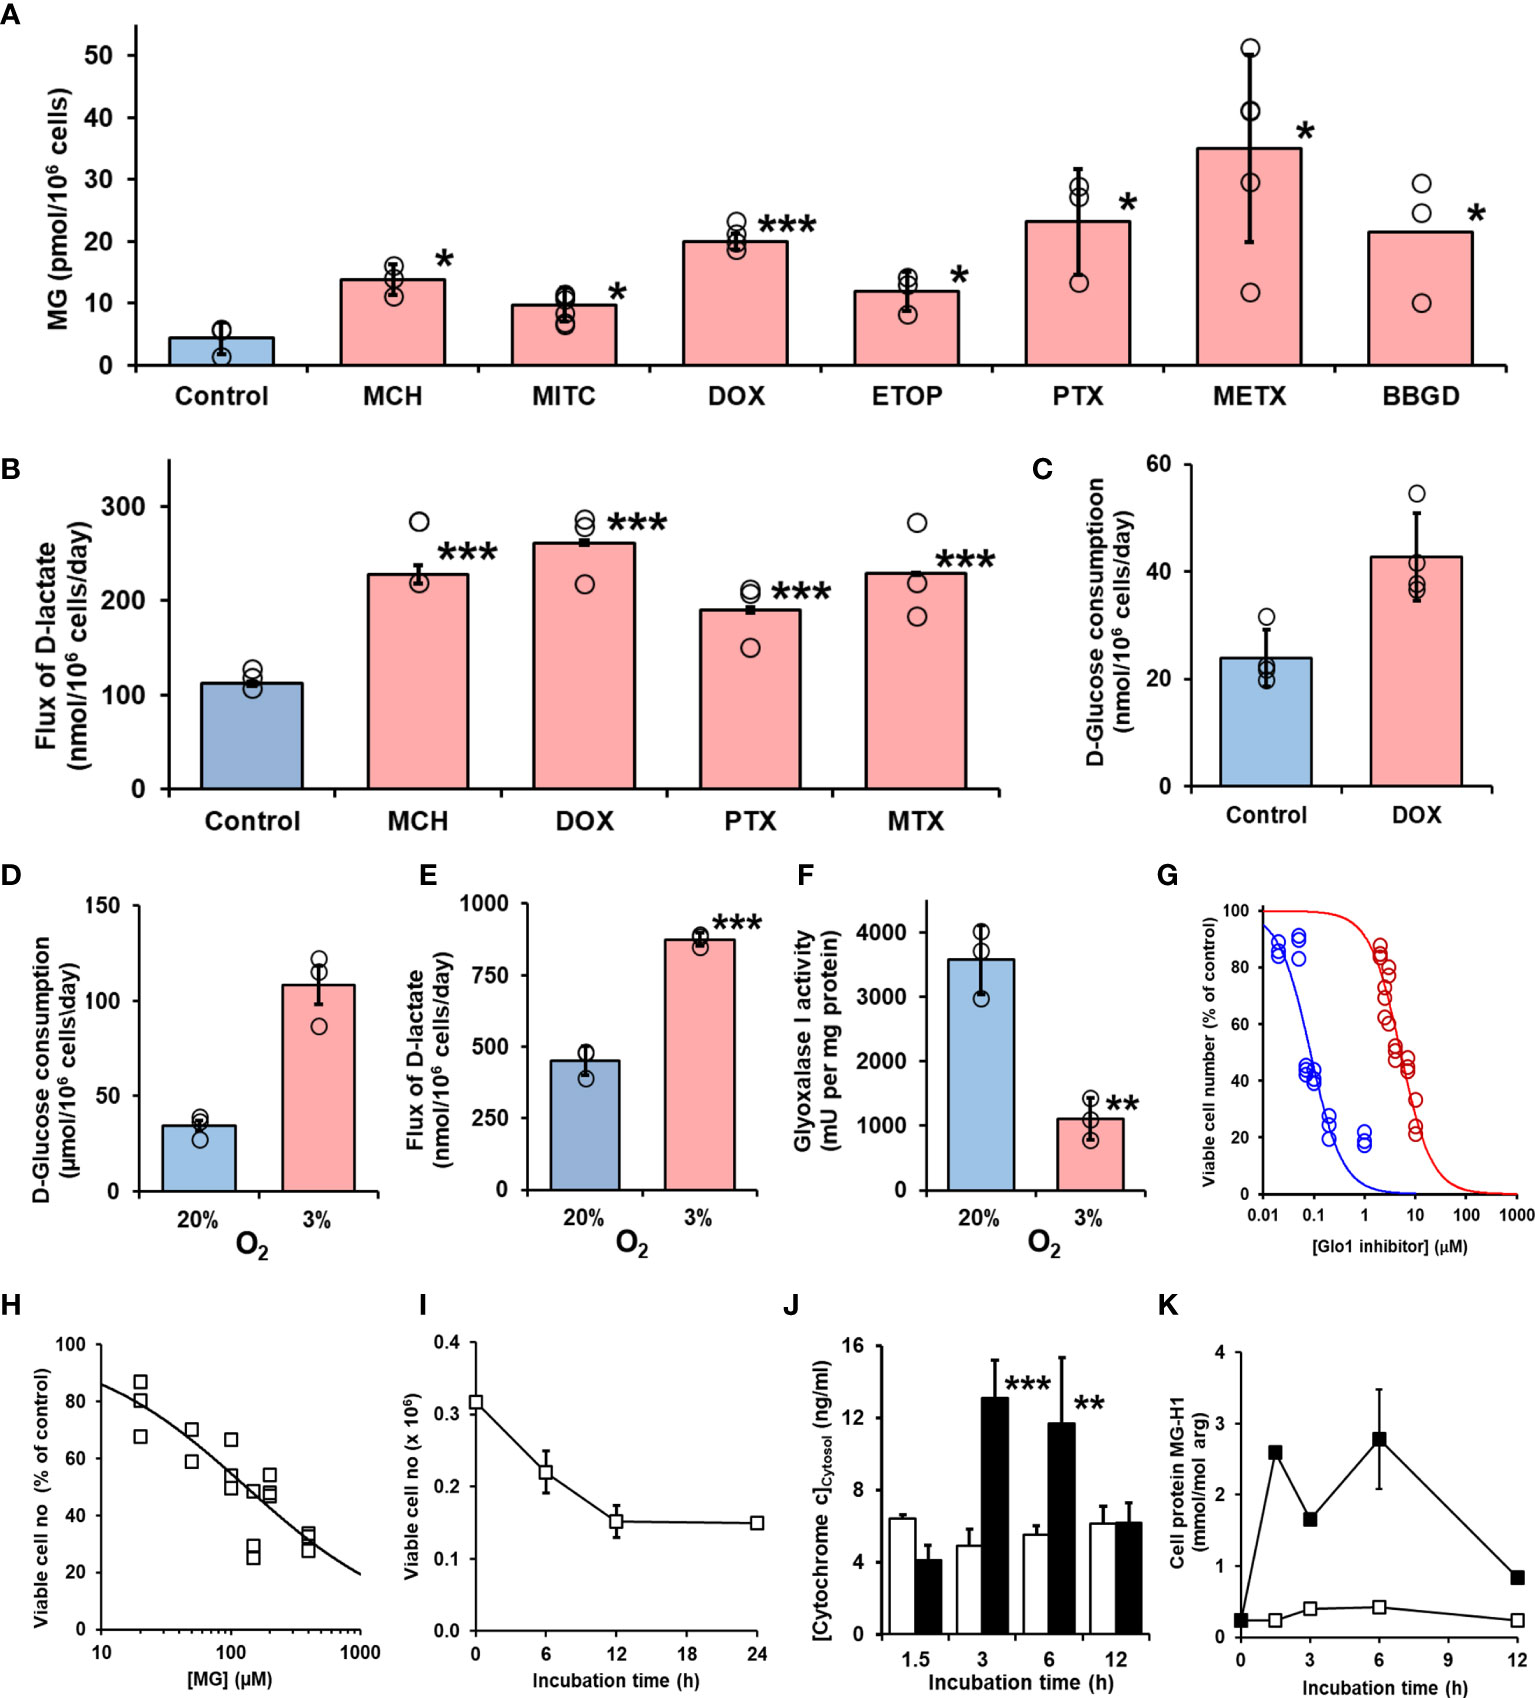
Figure 3 Induction of cellular dicarbonyl stress by antitumor drugs and mechanism methylglyoxal-induced cytotoxicity. (A) Increase in cellular MG in HEK293 cells treated with antitumor drugs for 3 h. Control (no drug added) and ca. 2 × GC50 concentration in nontransfected cells: mechlorethamine (MCH, 4.8 µM), mitomycin C (MITC, 316 nM), doxorubicin (DOX, 6.0 nM), etoposide (ETOP, 323 nM), paclitaxel (PTX, 21 nM), methotrexate (METX, 7.6 nM), and BBGD (7.4 µM). Data are mean ± SEM (p < 0.001; one-way ANOVA; n = 3 except n = 4, 5, and 6 for DOX, METX, and MITC, respectively). (B) Flux of formation of D-lactate (surrogate for flux of MG) and (C) flux of glucose consumption incubated in vitro with and without investigational agent and drugs indicated. Cells were incubated for 24 h with and without 2 × GC50 concentration. Data are mean ± SEM (n = 3). (D–G) Effect of hypoxia on formation and metabolism of methylglyoxal and antiproliferative activity of BBGD. (D–F)) Flux of glucose consumption and formation of D-lactate and Glo1 activity of HEK293 cells incubated for 72 h in 20% and 3% oxygen, models of normoxia and hypoxia, respectively. Data are mean ± SEM (n = 3). (G) Dose-response curve for BBGD. The GC50 values for BBGD under normoxic and hypoxic conditions were 5.12 ± 0.33 µM and 0.085 ± 0.010 μM, respectively (N = 18). (H) Dose-response curve for MG-treated HEK293 cells. GC50 131 µM ± 19.1, with logistic regression coefficient n = 0.70 ± 0.05 (N = 18). (I) Effect of duration of exposure to MG on antiproliferative activity in HEK293 cells in vitro. Cells were incubated with 131 µM MG. Data are mean ± SD (n = 3). (J) Release of cytochrome c from mitochondrial in early-stage MG-induced toxicity. HEK293 cells were incubated with and without MG in vitro and cytosolic cytochrome c assayed by ELISA. Key: hollow bars, control; solid bars, +131 µM MG. Data are mean ± SD (n = 3). Significance: *p < 0.05, **p < 0.01, and ***p < 0.001 with respect to control (t-test). (K) Early-stage accumulation of glycated modified during MG-induced cytotoxicity of HEK293 cells in vitros. Key: open symbols, control; filled symbols, +131 µM MG. Data are mean ± SD (n = 3).
The major source of formation of MG is anaerobic glycolysis and the flux of glucose metabolism through glycolysis and hence formation of MG is increased in hypoxia. Expression of Glo1 is also downregulated in hypoxia inducible factor-1α (29). We explored the effect of low oxygen concentration, an atmosphere of 3% oxygen, compared with culture under normoxic atmosphere containing 20% oxygen on MG-related metabolism and potency of BBGD. In 3% oxygen atmosphere, the flux of glucose consumption and formation of D-lactate were increased twofold and the expression of Glo1 was decreased by 69%. The combined effect of increased MG formation and decreased Glo1 expression was associated with a concomitant increase in potency of the antiproliferative activity of BBGD of ca. 60-fold (Figures 3D–G).
Mechanism of the Antiproliferative, Cytotoxic Activity of Methylglyoxal in HEK293 Cells In Vitro—Early-Stage Proteomic Response to MG-Induced Cytotoxicity
To explore the mechanism of cytotoxicity of MG, we initially characterized the potency and time course of commitment to the antiproliferative response in HEK293 cells in vitro. The GC50 of MG was 131 ± 19.1 µM (Figure 3H) and decrease of viability of HEK293 cells incubated with 131 µM MG reached maximum effect after exposure to MG for 12 h (Figure 3I). We studied cytochrome c increase in the cell cytosol as an indicator of activation of the mitochondrial, intrinsic pathway of apoptosis (30). The cytosolic concentration of cytochrome c was increased from 3 to 6 h with MG treatment and decreased thereafter (Figure 3J). We found the major MG-derived glycation adduct of cell protein, MG-H1 residues, increased rapidly within the initial 1.5 h, remained high until 6 h, and decreased to approach basal levels by 12 h of exposure to MG (Figure 3K). We then investigated the proteomic response in early-stage commitment to apoptosis by a label-free quantitative proteomics study of subcellular fractional proteome HEK293 cells treated with and without 131 µM MG for 6 h, examining total cytoplasmic and thereafter nuclear, mitochondrial matrix and intermembrane space, and mitochondrial membrane proteomes—including proteins with MG-H1 modification. Total protein counts detected, detected with MG-H1 modification and changed in abundance in all replicates of control and MG-treated cells are summarized (Table 2).
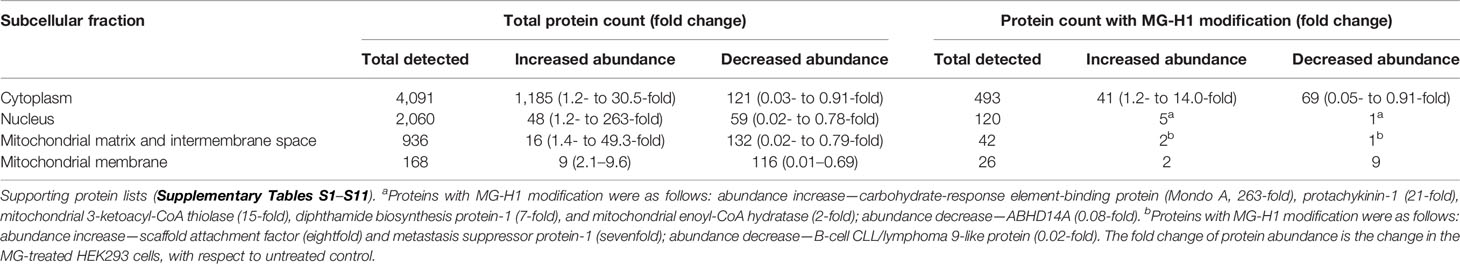
Table 2 Subcellular fractional proteomics of HEK293 cells treated with methylglyoxal.
For the cytoplasmic extract, pathway enrichment analysis of proteins with decreased abundance with MG treatment showed over-representation of proteins in the ribosome, spliceosome, RNA transport, and proteasome metabolic pathways (Table 3). Sixteen proteins of the spliceosome were detected with MG modification (Table 4). For the nuclear extract, proteins decreased were enriched in the major mRNA splicing pathway. In the mitochondrial matrix and intermembrane space and mitochondrial membrane fractions, there were major protein abundance decreases—particularly in the mitochondrial membrane where 116 of 168 proteins detected were decreased in abundance. Pathway enrichment analysis of these proteins revealed enrichment in two key mitochondrial pathways: respiratory electron transport and formation of ATP by chemiosmotic coupling (Table 3). There were no MG modifications detected of mitochondrial permeability transition pore (mPTP), respiratory electron transport, or formation of ATP by chemiosmotic coupling component proteins. Overall, the early-stage proteomic response in MG-induced cytotoxicity in HEK293 cells was characterized by a depletion of the RNA splicing proteins and mitochondrial respiratory electron transport chains, suggesting damage of MG to the spliceosome and activation of the mitochondrial apoptotic pathway.
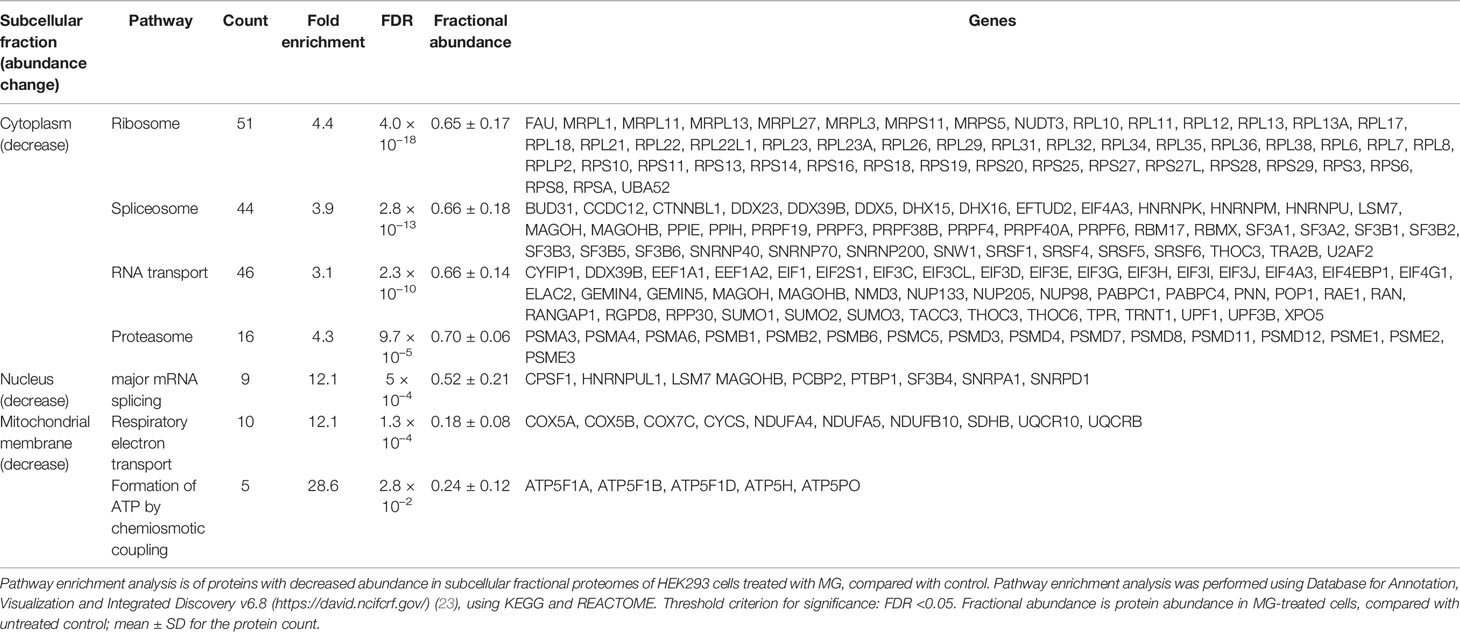
Table 3 Pathway enrichment analysis of proteins changed in abundance in HEK293 cells by treatment with methylglyoxal.
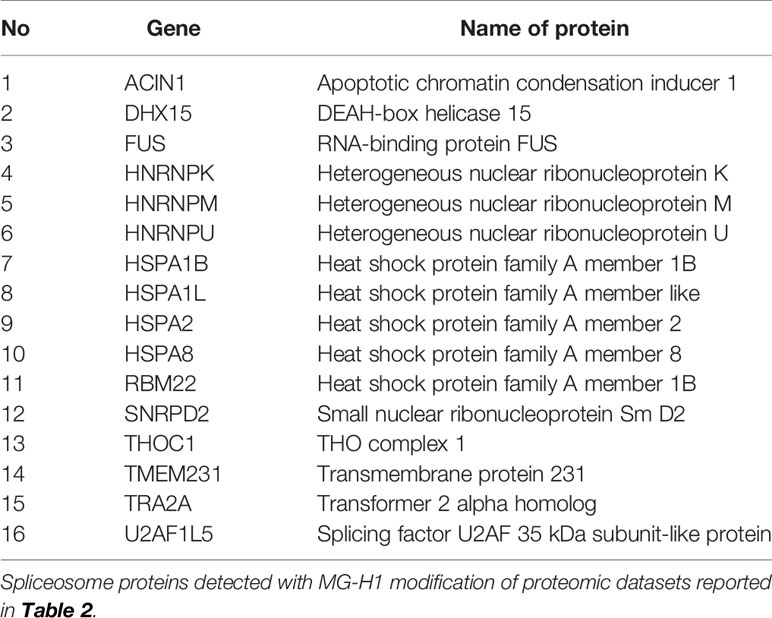
Table 4 Spliceosome proteins detected with MG-H1 modification in HEK293 cells treated with methylglyoxal in vitro.
Association of Methylglyoxal Metabolism With the Spliceosome in Human Tumor Cell Lines and Clinical Human Tumors
Having discovered the spliceosome as a target of MG-induced toxicity, we assessed if expression of Glo1 may be linked to protection of the spliceosome in human tumor cell lines and clinical human tumors. An indication of this would be positive correlation of expression of spliceosome proteins with expression of Glo1. To explore this in human tumor cell lines, we accessed RNA-seq data from the CCLE—a database of gene expression and gene copy number estimates for 1,040 human tumor cell lines (https://portals.broadinstitute.org/ccle). Data were available from 1,010 cell lines of different tumor types. Correlation analysis revealed 4,021 genes correlating significantly with Glo1: 3,032 correlated positively with Glo1 with correlation coefficients (r) in the range 0.134–0.568 and 989 genes correlated negatively with Glo1 with r in the range −0.535 to −0.134 (Supplementary Table S12). Two of the top 4 genes rank ordered by r-value were genes of the spliceosome: PPIL1 (first, r = 0.57) (Figure 4A) and CDC5L (fourth, r = 0.52). There was also a strong positive correlation of Glo1 mRNA copy number with GLO1 gene copy number (r = 0.53), suggesting that increased GLO1 copy number may contribute to increased Glo1 mRNA (Figure 4B). Genes with expression correlating positively with Glo1 were analyzed for pathway enrichment analysis, limiting genes for which correlation coefficient r2 ≥ 0.10, thereby accounting for ≥10% variation in Glo1 expression. For the 340 genes submitted for analysis, pathway enrichment analysis revealed four pathways: spliceosome, RNA transport, cell cycle, and DNA replication (Table 5). This is also illustrated in an interaction network diagram (Figure 4D). Increased expression of Glo1 may provide a protective shield of the spliceosome against MG glycation permissive for tumor growth. DNA replication in the cell cycle is dependent on pre-mRNA splicing and accurate alternative splicing (31). Analysis of structural domains enriched in these proteins showed highest enrichment of chaperonin TCP-1, conserved site (Table 6). This was previously found to be enriched in proteins susceptible to modification by MG (18).
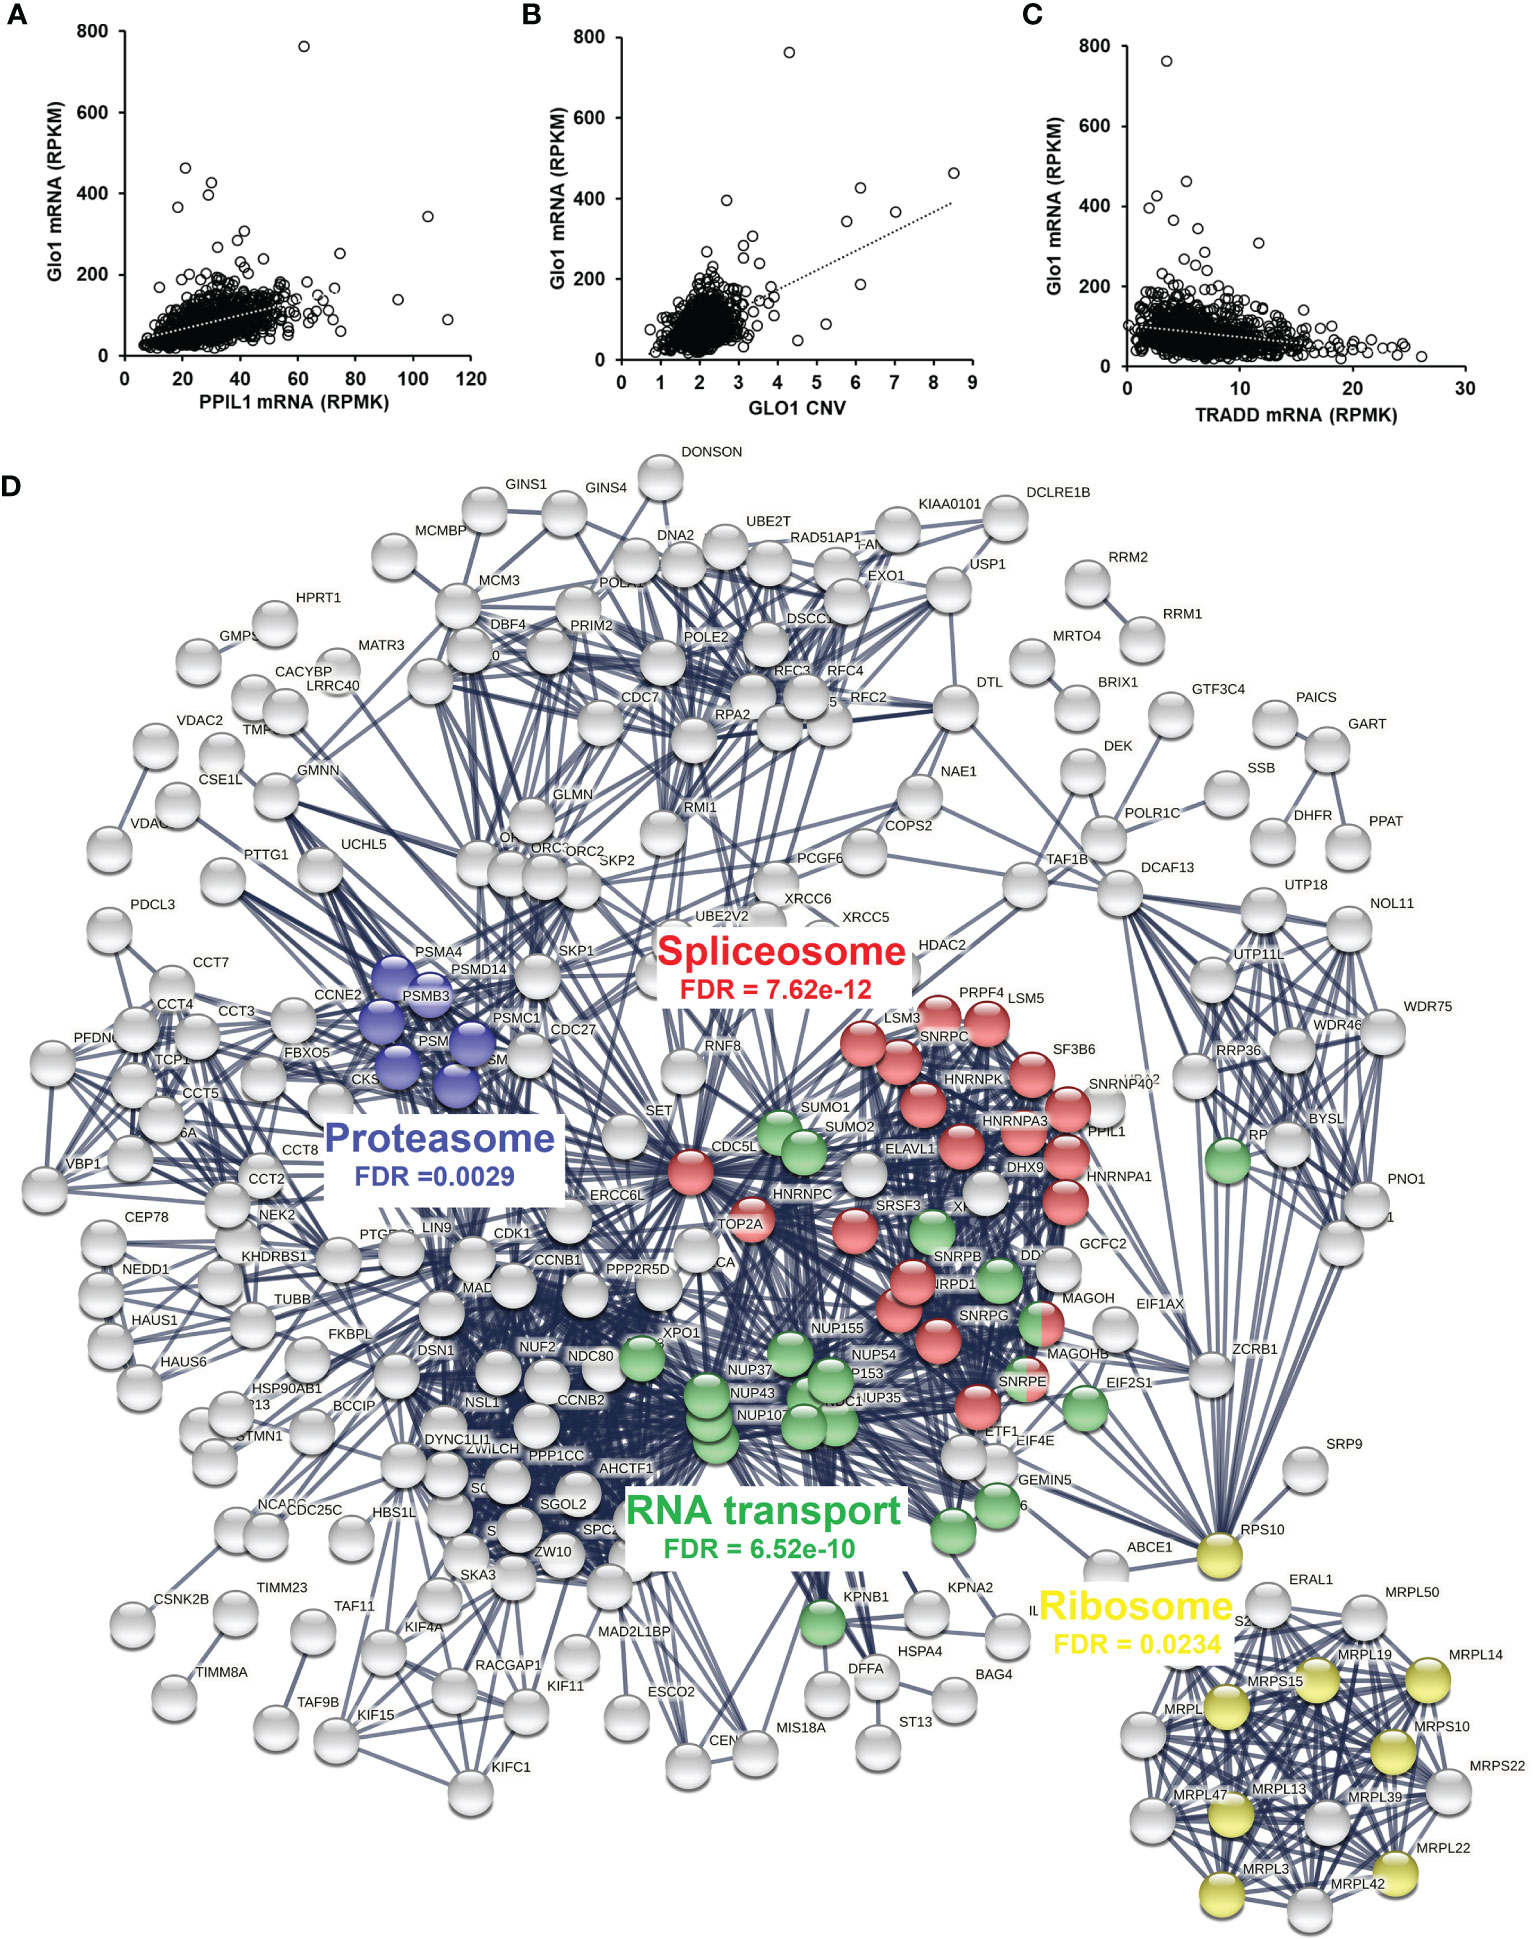
Figure 4 Correlation of glyoxalase 1 expression in human tumor cell lines and clinical human breast cancer with chemotherapy treatment—a negative survival factor. (A–C) Correlation of Glo1 expression in the CCLE human tumor cell line database. (A) Correlation of Glo1 with PPIL1 (r = 0.57). (B) Correlation of Glo1 with GLO1 CNV (r = 0.53). (C) Correlation of Glo1 with TRADD (r = −0.35). (D) Protein interaction network among genes with expression highly correlated positively with GLO1 in the CCLE human tumor cell database. Several enriched KEGG pathways are highlighted and their significance indicated (false discovery rate (FDR)). For clarity, only the largest connected component is shown.
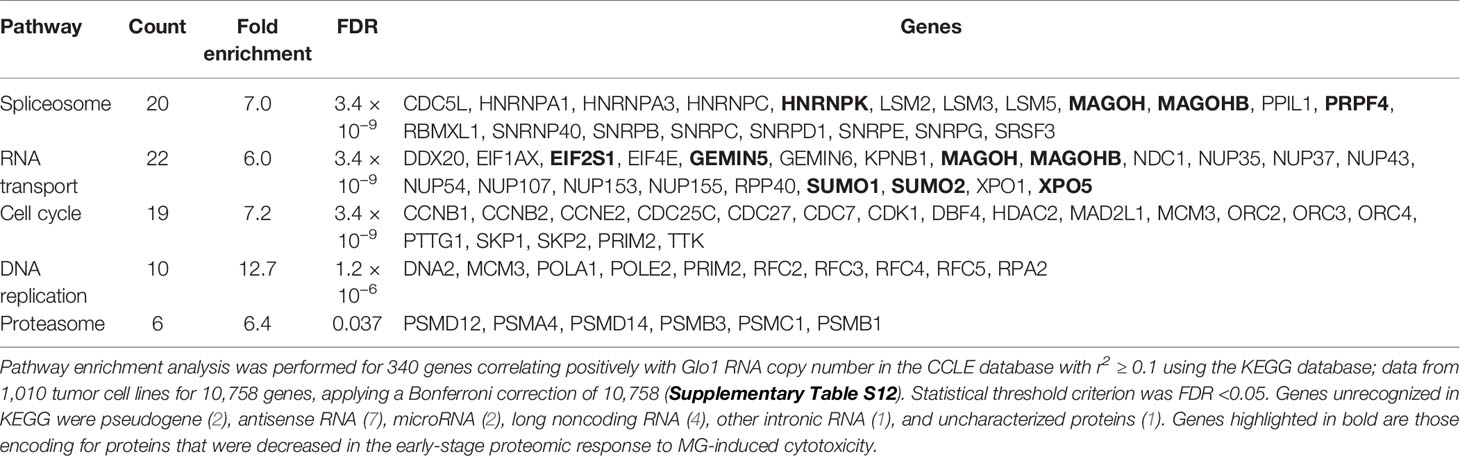
Table 5 Pathway enrichment of gene expression correlating positively with glyoxalase 1 expression in tumor cell lines of the CCLE.
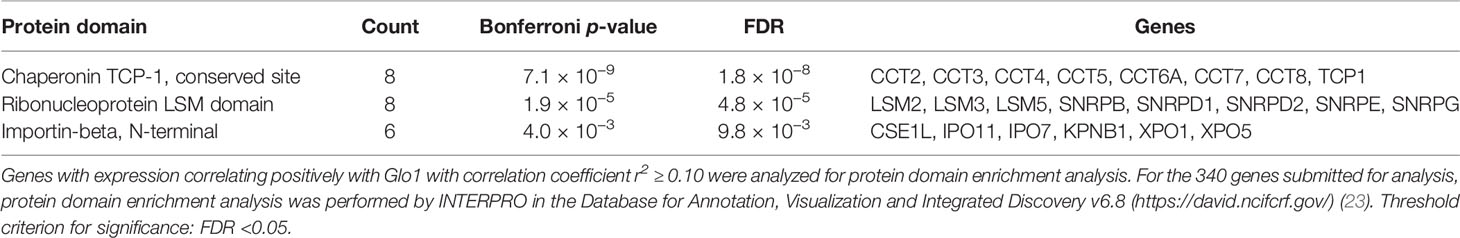
Table 6 Pathway enrichment of protein domains in genes with expression correlating positively with glyoxalase 1 expression in tumor cell lines of the CCLE.
For negative correlation with Glo1, there were only eight genes with r2 ≥ 0.10. These were three pseudogenes and two long noncoding RNAs; N-acetylglucosamine-1-phosphate transferase subunit gamma (GNPTG)—part of a complex targeting lysosomal hydrolases to the lysosome and Tapasin (TAPBL) which mediates binding of newly assembled major histocompatibility complex class I molecules and the transporter associated with antigen processing (TAP), both r2 = 0.11; and tumor necrosis factor receptor type 1-associated death domain protein (TRADD)—an adaptor protein involved in receptor-mediated apoptosis, r = −0.35 (Figure 4C). This supports the link of increased Glo1 expression with decreased risk of apoptosis, through decreased risk of MG-induced apoptosis.
For clinical translation, we performed correlation analysis of Glo1 expression with PPIL1, CDC5L, and TRADD in a pan cancer database (7,489 multiple types of human tumor; RNA seq) and breast cancer (n = 4,939, gene chip) of the KM Plotter database—a compendium of gene expression and survival data of cancer patients receiving chemotherapy and other treatments. Correlation analysis with Glo1 expression gave the following: pan cancer—PPIL1, r = 0.59 and CDC5L, r = 0.58 (p < 1 × 10⁻⁶) and TRADD, r = −0.17 (p = 5 × 10⁻⁴); and for breast cancer—PPIL1, r = 0.55; CDC5L, r = 0.26 and TRADD, r = −0.20 (p < 1 × 10⁻⁶). This indicates that there was a similar correlation of Glo1 expression in human clinical tumors as in the human tumor cell lines of the CCLE.
Glyoxalase 1 Expression as a Risk Predictor of Cancer Patient Survival With Chemotherapy Treatment
To explore the clinical relevance of baseline Glo1 expression in clinical cancer chemotherapy, we investigated association of Glo1 expression with cancer patient survival receiving chemotherapy in the KM Plotter database. For chemotherapy (any), analysis had adequate statistical power for Glo1 expression and patient survival for breast cancer without classification of tumor stage, grade, type, and genotype. The one exception was for analysis of the HER2-negative genotype. For breast cancer patients, high expression of Glo1 was associated with poor survival, with HR = 1.82 (logrank p < 0.001, n = 683) (Figures 5A, D). This effect was also present in HER2-negative breast cancer. For HER2-negative breast cancer, high expression of Glo1 was associated with poor survival, with HR = 2.02 (logrank p < 0.001, n = 531) (Figures 5B, E). The upper quartile survival was low Glo1 expression, 173.7 months, and high Glo1 expression, 63.5 months in both survival analysis datasets; 64% decreased survival. In contrast, there was no significant association of Glo2 (gene HAGH) expression with breast cancer patient survival (Figure 5C). For the entire dataset of breast cancer patients in the KM Plotter database, the expression of Glo1 was increased in cancer compared with nonmalignant breast tissue (Figure 5F).
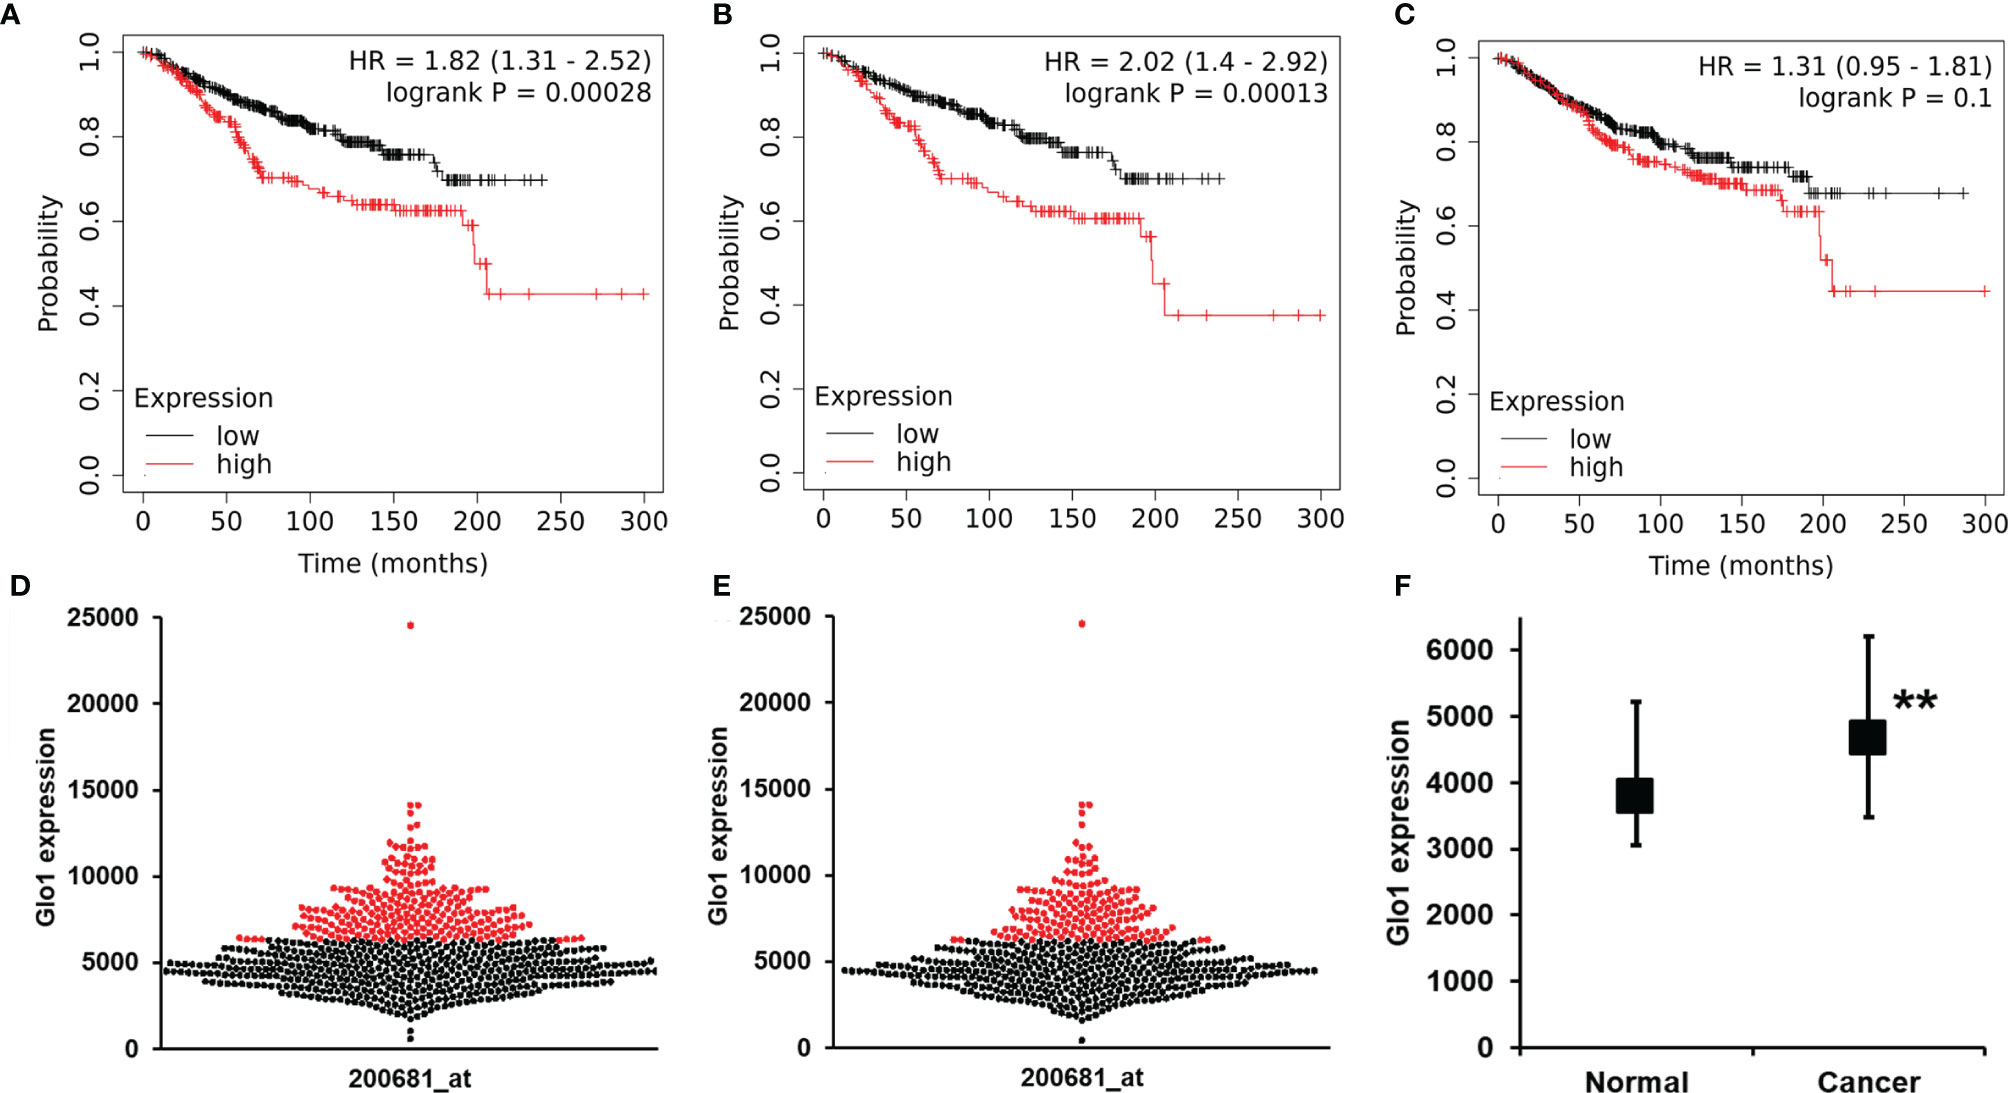
Figure 5 Glyoxalase 1 expression is a negative survival factor in clinical human breast cancer with chemotherapy treatment. Association of baseline Glo1 expression with overall survival in patients with breast cancer treated with chemotherapy (from the KM Plotter database). Glo1 expression in breast cancers of all genotypes: (A) Kapan-Meier survival analysis and (D) butterfly plot of breast cancers of low (black dots) and high (red dots) Glo1 expression (n = 683). Glo1 expression in patients with HER2-negative tumors: (B) Kapan-Meier survival analysis and (E) butterfly plot of breast cancers of low (black dots) and high (red dots) Glo1 expression (n = 531). (C) Kapan-Meier survival analysis for Glo2 expression in breast cancers of all genotypes (n = 683). (F) Glo1 expression in normal breast tissue and breast cancers. Data are median (lower – upper quartile); normal, n = 3778, cancer, n = 4667. Significance: **P < 0.01; Mann-Whitney U test. For the low and high gene expression cutoff, the “Autoselect best cutoff” feature in the KM Plotter was used. This computes survival outcomes for all possible cutoff values between lower and upper quartiles of Glo1 expression and selects the cutoff for FDR below the threshold value (0.05) and minimum p-value (24).
Discussion
Overexpression of Glo1 suppressed the antiproliferative activity of multiple classes of antitumor drugs. Drug-induced increase of cellular MG to cytotoxic levels contributed to the mechanism of action of antitumor drugs, linked to increased formation of MG by off-target drug-induced increased glycolysis. Alkylating agents such as mechlorethamine and topoisomerase inhibitors lead to decreased cellular NAD+ in early-stage of treatment, decreasing glycolysis at the glyceraldehyde-3-phosphate dehydrogenase-catalyzed step and consequently increasing cellular GA3P and DHAP and formation of MG (32–34). Doxorubicin also increases glucose metabolism by increasing expression of glucose transporter GLUT1 and hexokinase-2 (35). Paclitaxel stabilizes microtubules, decreasing free tubulin concentration; the latter increasing mitochondrial voltage-dependent anion channel (VDAC) activity and thereby in situ activity of hexokinase and glycolysis (36). Methotrexate activates AMPK and thereby stimulates glycolysis by activating phosphorylation of 6-phosphofructo-2-kinase/fructose-2,6-bisphosphatase (37). Increased formation of MG by antitumor agents is likely most marked in S phase of the cell cycle when expression of glycolysis enzymes is highest (38). Indeed, early studies of MG-induced apoptosis suggested cell death occurs in this phase (39). The three- to fivefold increase of MG concentration in the total cell population induced by anticancer drugs may underestimate that of S phase cells, accounting for ca. 20% of the cell population (40).
Although anticancer drug-induced increase of MG to cytotoxic levels contributing to the antiproliferative mechanism of action likely explains the susceptibility of the anticancer drugs to Glo1-mediated MDR, the increased cellular concentration of MG assayed after exposure of HEK293 cells to anticancer drugs for 3 h was not strongly correlated to drug-associated fold of Glo1-linked MDR. The latter is expected to correlate with peak MG concentration induced by drug treatment. Increase in MG concentration in response to anticancer drug treatment is expected to increase rapidly and maximize concomitant with increase in the concentration of cellular triosephosphates, as found previously at 3 h for mechlorethamine-treated leukemia L1220 cells (33). However, the time of peak MG concentration likely varies, and so maximal drug-induced MG concentration was not captured herein. Rather, herein, we identified that many anticancer drugs increase cellular MG to cytotoxic levels.
There was an exception to Glo1 expression-linked MDR: enhanced antiproliferative and cytotoxic activity of cisplatin by overexpression of Glo1. Cisplatin is a DNA-alkylating agent, mainly binding and crosslinking N7 sites of deoxyguanosine (dG), intrastrand crosslink, cis-Pt(NH3)2d (pGpG) (41). MG is a major precursor of endogenous DNA modification in vivo forming imidazopurinone MGdG, in slow dynamic equilibrium with MG; degradation half-life 12 h at pH 7.4 and 37°C. Cellular DNA content of MGdG is ca. 1:20,000 dG. Cisplatin may interact favorably with the 6,7-dihydro-6,7-dihydroxy-6/7-methylimidazo moiety of MGdG and thereby be inactivated, explaining why increase of Glo1 with decrease of MG and MGdG increases the cytotoxicity of cisplatin.
A feature of MG metabolism in HEK293 cells was the impact of hypoxia, producing increased flux through anaerobic glycolysis with a twofold increased formation of MG and threefold decrease in activity of Glo1. These responses synergize to increase cellular MG and likely contribute to the 60-fold increased potency of BBGD for induction of cytotoxicity in HEK293 cells with an atmosphere of 3% oxygen versus 20% oxygen. Cell permeable Glo1 inhibitors thereby may have greater potency in hypoxic than normoxic tumors in vivo, assuming the downregulation of Glo1 by hypoxia is maintained. In some instances, however, hypoxia conditioning of tumors leads to dysregulation and increased Glo1 expression in hypoxia (42). From the studies herein, dysregulation of Glo1 in tumor hypoxia may contribute to MDR in cancer chemotherapy and increased tumor survival.
Herein, we provided the first examination of the early-stage proteomic response to MG-induced cytotoxicity, finding protein abundance decrease enriched in pathways involving ribosome, spliceosome, RNA, and proteasome pathways. Ribosomal pathways of protein synthesis contain multiple proteins susceptible to MG modification, as found in studies of cytoplasmic protein extracts of endothelial cells (18). Ribosomal proteins may suffer preferential modification by MG and thereafter increased degradation. This study is the first to implicate the spliceosome in the mechanism of MG cytotoxicity. There was a decreased abundance of 95 ribosomal and spliceosomal proteins in MG-induced cytotoxicity (Table 3). Dysfunction of the spliceosome is induced by multiple classes of anticancer drugs (43). There was a 48% decrease of major pathway of RNA splicing in nuclear extracts. Further associations between MG metabolism and the spliceosome were the positive correlation of Glo1 expression with expression of spliceosomal genes in human tumor cell lines and clinical human tumors and MG modification detected on 16 spliceosome pathway proteins. The arginine-rich domains of serine/arginine-rich splicing factors, SRSFs 1–12, may be targets in MG-induced cytotoxicity. SRSF1, SRSF4, SRSF5, and SRSF6 were decreased by MG-induced toxicity in HEK393 cells herein. Dysregulation of these splicing factors has been implicated in cancers of the breast, lung, and colon; melanoma; and acute myeloid leukemia (44). Activity of Glo1 inhibitor prodrugs may deserve investigation against these tumor types.
In selection of the duration of exposure of HEK293 cells to MG to capture the proteomic signature for commitment to apoptosis, we determined the minimum duration of incubation of HEK293 cells with MG for decrease in cell viability. We incubated cells with MG for varying periods, washed out residual MG and then continued incubations for 48 h for apoptosis to fully develop and decrease in viable cell number. For treatment with the GC50 concentration of MG, the minimum exposure time to decrease cell viability by 50%—complete response—was incubation for 12 h. To capture cells at the midpoint of induction of apoptosis, we therefore incubated cells with MG for 6 h (Figure 3I). Analysis of total cell protein glycation by MG at 6 h also showed that this was the time point of maximum MG-derived glycation adduct, MG-H1, content which facilitated detection of MG-modified protein targets. MG-induced cytotoxicity was also characterized by a profound loss of proteins of the mitochondrial chemiosmotic coupling of ATP formation and respiratory electron transport, disabling cellular metabolic energy and respiration pathways. It has been proposed that MG activates the intrinsic apoptotic pathway by modification of the mPTP complex of proteins, a high conductance channel in mitochondria (45, 46). MG modification was not detected on any mPTP proteins herein, and these proteins were not highly correlated with Glo1 in the CCLE and clinical tumor gene expression. This suggests that the loss of mitochondrial proteins may be secondary to dysregulation of the spliceosome in MG-induced apoptosis (47).
The clinical relevance of the metabolism of MG was investigated in cancer patients treated with chemotherapy. We found a marked, 64% decreased overall survival with high expression of Glo1. This is the first time clinical expression of Glo1 in tumors has been linked to survival in clinical cancer chemotherapy. Removal of MG by Glo1 was key to this effect as there was no similar association with expression of Glo2 (gene HAGH). The clinical endpoint used herein, overall patient survival, is a well-defined and robust endpoint. Our findings implicate expression of Glo1 in human breast cancer as a factor with major impact on patient survival. The effect was found in a cohort that had mainly HER2-negative genotype, representing ca. 60% breast cancers with often poor cancer chemotherapy outcomes (48). Application of Glo1 inhibitors for relief of Glo1-linked MDR may be a beneficial adjunct treatment for breast cancer treatment by chemotherapy.
Previous studies have shown that cytotoxicity of antitumor drugs in drug-resistant cell lines was enhanced by cotreatment with BBGD (49) and treatment of tumor-bearing mice with BBGD decreased tumor growth, including tumors difficult to treat with current clinical antitumor drugs (8, 49–51). Adjunct chemotherapy with Glo1 inhibitor may improve treatment outcomes in clinical cancer chemotherapy, particularly where high expression of Glo1 is a risk predictor of poor survival outcome.
We conclude that MG-mediated cytotoxicity is a common contributor to the cancer chemotherapeutic response, stimulated by off-target effect of anticancer drugs on glycolysis. Enhanced in hypoxia relevant to clinical tumors, its clinical impact has likely been hitherto under-appreciated. MG-mediated cytotoxicity involves activation of the intrinsic apoptotic pathway with targeting of the spliceosome for MG modification. Conversely, Glo1 is a common mediator of MDR in cancer chemotherapy. Glo1-mediated MDR has a major role in poor survival outcomes in breast cancer which may be countered by clinical development of Glo1 inhibitors. Glo1 is an established druggable target (8, 49, 51). Future clinical translation of cell permeable Glo1 inhibitors as adjunct chemotherapy may improve overall survival in breast cancer and other cancers with high Glo1 expression.
Data Availability Statement
The datasets presented in this study can be found in online repositories. CCLE and Kaplan-Meier Survival Analysis Database repositories are described in the Methods Section of this article. The proteomic data presented in the study are deposited in the PRIDE Proteome Xchange repository, accession number PXD029315. Other raw data supporting the conclusions of this article will be made available by the authors, without undue reservation.
Ethics Statement
All methods were carried out in accordance with relevant guidelines and regulations and all experimental protocols were approved by University of Warwick Genetic Modification & Biosafety Committee (Project no. 305).
Author Contributions
HA cultured HEK293 cells, prepared and propagated plasmids, prepared stable transfectant cell lines, and performed metabolite and drug treatment studies. MA cultured HEK293 cells and studied the proteomic response to MG-induced cytotoxicity. AF performed pathway enrichment analysis. MX provided technical guidance and support to HA and MA. PJT assisted with MG analysis. NR and PJT designed and supervised the studies, contributed to the data analysis, and wrote the manuscript. All authors read and approved the published version of the manuscript.
Funding
MA thanks Bisha University for research funding, Project UB-39). PT thanks the Qatar Foundation for funding his research program (project code QB-14). NR thanks Qatar University for funding her research. The findings achieved herein are solely the responsibility of the authors.
Conflict of Interest
The authors declare that the research was conducted in the absence of any commercial or financial relationships that could be construed as a potential conflict of interest.
Publisher’s Note
All claims expressed in this article are solely those of the authors and do not necessarily represent those of their affiliated organizations, or those of the publisher, the editors and the reviewers. Any product that may be evaluated in this article, or claim that may be made by its manufacturer, is not guaranteed or endorsed by the publisher.
Acknowledgments
We thank Dr Ian Richard Thompson for assistance with correlation analysis of data extracted from the CCLE.
Supplementary Material
The Supplementary Material for this article can be found online at: https://www.frontiersin.org/articles/10.3389/fonc.2021.748698/full#supplementary-material
References
1. Bray F, Ferlay J, Soerjomataram I, Siegel RL, Torre LA, And Jemal A. Global Cancer Statistics 2018: Globocan Estimates of Incidence and Mortality Worldwide for 36 Cancers in 185 Countries. CA: A Cancer J Clin (2018) 68(6):394–424. doi: 10.3322/Caac.21492
2. Wang X, Zhang H, And Chen X. Drug Resistance and Combating Drug Resistance in Cancer. Cancer Drug Resistance (2019) 2(2):141–60. doi: 10.20517/Cdr.2019.10
3. Holohan C, Van Schaeybroeck S, Longley DB, And Johnston PG. Cancer Drug Resistance: An Evolving Paradigm. Nat Rev Cancer (2013) 13(10):714–26. doi: 10.1038/Nrc3599
4. Luengo A, Gui DY, And Vander Heiden MG. Targeting Metabolism for Cancer Therapy. Cell Chem Biol (2017) 24(9):1161–80. doi: 10.1016/J.Chembiol.2017.08.028
5. Garnett MJ, Edelman EJ, Heidorn SJ, Greenman CD, Dastur A, Lau KW, et al. Systematic Identification of Genomic Markers of Drug Sensitivity in Cancer Cells. Nature (2012) 483(7391):570–5. doi: 10.1038/Nature11005
6. Zaal EA, And Berkers CR. The Influence of Metabolism on Drug Response in Cancer. Front Oncol (2018) 8:500. doi: 10.3389/Fonc.2018.00500
7. Rabbani N, Xue M, Weickert MO, And Thornalley PJ. Multiple Roles of Glyoxalase 1-Mediated Suppression of Methylglyoxal Glycation in Cancer Biology—Involvement in Tumour Suppression, Tumour Growth, Multidrug Resistance and Target for Chemotherapy. Semin Cancer Biol (2018) 49:83–93. doi: 10.1016/J.Semcancer.2017.05.006
8. Thornalley PJ, Edwards LG, Kang Y, Wyatt C, Davies N, Ladan MJ, et al. Antitumour Activity of S-P-Bromobenzylglutathione Cyclopentyl Diester In Vitro and In Vivo. Inhibition of Glyoxalase I and Induction of Apoptosis. Biochem Pharmacol (1996) 51(10):1365–72. doi: 10.1016/0006-2952(96)00059-7
9. Thornalley PJ, Waris S, Fleming T, Santarius T, Larkin SJ, Winklhofer-Roob BM, et al. Imidazopurinones are Markers of Physiological Genomic Damage Linked to DNA Instability and Glyoxalase 1-Associated Tumour Multidrug Resistance. Nucleic Acids Res (2010) 38(16):5432–42. doi: 10.1093/Nar/Gkq306
10. Antognelli C, Mezzasoma L, Fettucciari K, Mearini E, And Talesa VN. Role of Glyoxalase I in the Proliferation and Apoptosis Control of Human LNCAP and PC3 Prostate Cancer Cells. Prostate (2013) 73(2):121–32. doi: 10.1002/pros.22547
11. Antognelli C, Mezzasoma L, Fettucciari K, And Talesa VN. A Novel Mechanism of Methylglyoxal Cytotoxicity in Prostate Cancer Cells. Int J Biochem Cell Biol (2013) 45(4):836–44. doi: 10.1016/j.biocel.2013.01.003
12. Antognelli C, Palumbo I, Aristei C, And Talesa VN. Glyoxalase I Inhibition Induces Apoptosis in Irradiated Mcf-7 Cells via A Novel Mechanism Involving Hsp27, P53 and Nf-[Kappa]B. Br J Cancer (2014) 111(2):395–406. doi: 10.1038/Bjc.2014.280
13. Ahmed U, Dobler D, Larkin SJ, Rabbani N, And Thornalley PJ. Reversal of Hyperglycemia-Induced Angiogenesis Deficit of Human Endothelial Cells by Overexpression of Glyoxalase 1 In Vitro. Ann N Y Acad Sci (2008) 1126:262–4. doi: 10.1196/Annals.1433.035
14. Arai M, Nihonmatsu-Kikuchi N, Itokawa M, Rabbani N, And Thornalley PJ. Measurement of Glyoxalase Activities. Biochem Soc Trans (2014) 42(2):491–4. doi: 10.1042/Bst20140010
15. Xue M, Rabbani N, And Thornalley PJ. Measurement of Glyoxalase Gene Expression. Biochem Soc Trans (2014) 42(2):495–9. doi: 10.1042/Bst20140026
16. Al-Motawa MS, Abbas H, Wijten P, de la Fuente A, Xue M, Rabbani N, et al. Vulnerabilities of the Sars-Cov-2 Virus to Proteotoxicity—Opportunity for Repurposed Chemotherapy of Covid-19 Infection. Front Pharmacol (2020) 11:585408. doi: 10.3389/Fphar.2020.585408
17. Rabbani N, And Thornalley PJ. Measurement of Methylglyoxal by Stable Isotopic Dilution Analysis Lc-Ms/Ms With Corroborative Prediction in Physiological Samples. Nat Protoc (2014) 9(8):1969–79. doi: 10.1038/Nprot.2014.129
18. Irshad Z, Xue M, Ashour A, Larkin JR, Thornalley PJ, And Rabbani N. Activation of the Unfolded Protein Response in High Glucose Treated Endothelial Cells Os Mediated by Methylglyoxal. Sci Rep (2019) 9:7889. doi: 10.1155/2018/5642148
19. Cox B, And Emili A. Tissue Subcellular Fractionation and Protein Extraction for Use in Mass-Spectrometry-Based Proteomics. Nat Protoc (2006) 1(4):1872–8. doi: 10.1038/Nprot.2006.273
20. Rabbani N, Ashour A, And Thornalley PJ. Mass Spectrometric Determination of Early and Advanced Glycation in Biology. Glycoconjugate J (2016) 33:553–68. doi: 10.1007/S10719-016-9709-8
21. Yeung YG, Nieves E, Angeletti RH, And Stanley ER. Removal of Detergents From Protein Digests for Mass Spectrometry Analysis. Analytical Biochem (2008) 382(2):135–7. doi: 10.1016/J.Ab.20
22. Nesvizhskii AI, Keller A, Kolker E, And Aebersold R. A Statistical Model for Identifying Proteins by Tandem Mass Spectrometry. Analytical Chem (2003) 75(17):4646–58. doi: 10.1021/Ac0341261
23. Huang DW, Sherman BT, And Lempicki RA. Systematic and Integrative Analysis of Large Gene Lists Using David Bioinformatics Resources. Nat Protoc (2008) 4:44–57. doi: 10.1038/Nprot.2008.211
24. Györffy B, Lanczky A, Eklund AC, Denkert C, Budczies J, Li Q, et al. An Online Survival Analysis Tool to Rapidly Assess the Effect of 22,277 Genes on Breast Cancer Prognosis Using Microarray Data of 1,809 Patients. Breast Cancer Res Treat (2010) 123(3):725–31. doi: 10.1007/S10549-009-0674-9
25. Nagy Á, Munkácsy G, And Győrffy B. Pancancer Survival Analysis of Cancer Hallmark Genes. Sci Rep (2021) 11(1):6047. doi: 10.1038/S41598-021-84787-5
26. Rabbani N, And Thornalley PJ. Dicarbonyl Stress in Cell and Tissue Dysfunction Contributing to Ageing and Disease. Biochem Biophys Res Commun (2015) 458(2):221–6. doi: 10.1016/J.Bbrc.2015.01.140
27. Thornalley PJ. Modification of the Glyoxalase System in Human Red Blood Cells by Glucose In Vitro. Biochem J (1988) 254(3):751–5. doi: 10.1042/Bj2540751
28. Ashour A, Xue M, Al-Motawa M, Thornalley PJ, And Rabbani N. Glycolytic Overload-Driven Dysfunction of Periodontal Ligament Fibroblasts in High Glucose Concentration, Corrected by Glyoxalase 1 Inducer. BMJ Open Diabetes Res Care (2020) 8(2):E001458. doi: 10.1136/Bmjdrc-2020-001458
29. Shafie A, Xue M, Barker G, Zehnder D, Thornalley PJ, And Rabbani N. Re-Appraisal of Putative Glyoxalase 1 Deficient Mouse and Dicarbonyl Stress on Embryonic Stem Cells In Vitro. Biochem J (2016) 473:4255–70. doi: 10.1042/Bcj20160691
30. Oberst A, Bender C, And Green DR. Living With Death: The Evolution of the Mitochondrial Pathway of Apoptosis in Animals. Cell Death Differentiation (2008) 15(7):1139–46. doi: 10.1038/Cdd.2008.65
31. Petasny M, Bentata M, Pawellek A, Baker M, Kay G, And Salton M. Splicing to Keep Cycling: The Importance of Pre-MRNA Splicing During the Cell Cycle. Trends Genet (2021) 37(3):266–78. doi: 10.1016/J.Tig.2020.08.013
32. Phillips SA, And Thornalley PJ. The Formation of Methylglyoxal From Triose Phosphates. Investigation Using a Specific Assay for Methylglyoxal. Eur J Biochem (1993) 212(1):101–5. doi: 10.1111/J.1432-1033.1993.Tb17638.X
33. Ronen SM, Distefano F, Mccoy CL, Robertson D, Smith TAD, Al-Saffar NM, et al. Magnetic Resonance Detects Metabolic Changes Associated With Chemotherapy-Induced Apoptosis. Brit J Cancer (1999) 80(7):1035–41. doi: 10.1038/Sj.Bjc.6690459
34. Sullivan LB, Gui DY, And Heiden MGV. Altered Metabolite Levels in Cancer: Implications for Tumour Biology and Cancer Therapy. Nat Rev Cancer (2016) 16(11):680–93. doi: 10.1038/Nrc.2016.85
35. Demel HR, Feuerecker B, Piontek G, Seidl C, Blechert B, Pickhard A, et al. Effects of Topoisomerase Inhibitors That Induce DNA Damage Response on Glucose Metabolism and Pi3k/Akt/Mtor Signaling in Multiple Myeloma Cells. Am J Cancer Res (2015) 5(5):1649–64.
36. Maldonado EN, Patnaik J, Mullins MR, And Lemasters JJ. Free Tubulin Modulates Mitochondrial Membrane Potential in Cancer Cells. Cancer Res (2010) 70(24):10192–201. doi: 10.1158/0008-5472.Can-10-2429
37. Pirkmajer S, Kulkarni SS, Tom RZ, Ross FA, Hawley SA, Hardie DG, et al. Methotrexate Promotes Glucose Uptake and Lipid Oxidation in Skeletal Muscle via Ampk Activation. Diabetes (2015) 64(2):360–9. doi: 10.2337/Db14-0508
38. Kaplon J, Van Dam L, And Peeper D. Two-Way Communication Between the Metabolic and Cell Cycle Machineries: The Molecular Basis. Cell Cycle (Georgetown Tex) (2015) 14(13):2022–32. doi: 10.1080/15384101.2015.1044172
39. Kang Y, Edwards LG, And Thornalley PJ. Effect of Methylglyoxal on Human Leukaemia 60 Cell Growth: Modification of Dna, G1 Growth Arrest and Induction of Apoptosis. Leuk Res (1996) 20:397–405. doi: 10.1016/0145-2126(95)00162-X
40. Liu S, Li J, Wang T, Xu J, Liu Z, Wang H, et al. Illumination of Cell Cycle Progression by Multi-Fluorescent Sensing System. Cell Cycle (2019) 18(12):1364–78. doi: 10.1080/15384101.2019.1618117
41. Blommaert FA, Van Dijk-Knijnenburg HC, Dijt FJ, Den Engelse L, Baan RA, Berends F, et al. Formation of DNA Adducts by the Anticancer Drug Carboplatin: Different Nucleotide Sequence Preferences In Vitro and in Cells. Biochemistry (1995) 34(26):8474–80. doi: 10.1021/Bi00026a031
42. Takeuchi M, Kimura S, Kuroda J, Ashihara E, Kawatani M, Osada H, et al. Glyoxalase-I Is a Novel Target Against Bcr-Abl(+) Leukemic Cells Acquiring Stem-Like Characteristics in a Hypoxic Environment. Cell Death Differentiation (2010) 17(7):1211–20. doi: 10.1038/cdd.2010.6
43. Dutertre M, Sanchez G, Barbier J, Corcos L, And Auboeuf D. The Emerging Role of Pre-Messenger RNA Splicing in Stress Responses: Sending Alternative Messages and Silent Messengers. RNA Biol (2011) 8(5):740–7. doi: 10.4161/Rna.8.5.16016
44. Zheng X, Peng Q, Wang L, Zhang X, Huang L, Wang J, et al. Serine/Arginine-Rich Splicing Factors: The Bridge Linking Alternative Splicing and Cancer. Int J Biol Sci (2020) 16(13):2442–53. doi: 10.7150/Ijbs.46751
45. Speer O, Morkunaite-Haimi S, Liobikas J, Franck M, Hensbo L, Linder MD, et al. Rapid Suppression of Mitochondrial Permeability Transition by Methylglyoxal. J Biol Chem (2003) 278(37):34757–63. doi: 10.1074/Jbc.M301990200
46. Giorgio M, Migliaccio E, Orsini F, Paolucci D, Moroni M, Contursi C, et al. Electron Transfer Between Cytochrome C And P66(Shc) Generates Reactive Oxygen Species That Trigger Mitochondrial Apoptosis. Cell (2005) 122(2):221–33. doi: 10.1016/J.Cell.2005.05.011
47. Schwerk C, And Schulze-Osthoff K. Regulation of Apoptosis by Alternative Pre-MRNA Splicing. Mol Cell (2005) 19(1):1–13. doi: 10.1016/J.Molcel.2005.05.026
48. Dai X, Li T, Bai Z, Yang Y, Liu X, Zhan J, et al. Breast Cancer Intrinsic Subtype Classification, Clinical Use and Future Trends. Am J Cancer Res (2015) 5(10):2929–43.
49. Sakamoto H, Mashima T, Sato S, Hashimoto Y, Yamori T, And Tsuruo T. Selective Activation of Apoptosis Program by S-P-Bromobenzylglutathione Cyclopentyl Diester in Glyoxalase I-Overexpressing Human Lung Cancer Cells. Clin Cancer Res (2001) 7(8):2513–8.
50. Sakamoto H, Mashima T, Kazaki A, Dan S, Hashimoto Y, Naito M, et al. Glyoxalase I is Involved in Resistance of Human Leukemia Cells to Antitumour Agent-Induced Apoptosis. Blood (2000) 95(10):3214–8. doi: 10.1182/Blood.V95.10.3214
Keywords: methylglyoxal, glyoxalase, cancer chemotherapy, multidrug resistance, proteomics
Citation: Alhujaily M, Abbas H, Xue M, de la Fuente A, Rabbani N and Thornalley PJ (2021) Studies of Glyoxalase 1-Linked Multidrug Resistance Reveal Glycolysis-Derived Reactive Metabolite, Methylglyoxal, Is a Common Contributor in Cancer Chemotherapy Targeting the Spliceosome. Front. Oncol. 11:748698. doi: 10.3389/fonc.2021.748698
Received: 28 July 2021; Accepted: 06 October 2021;
Published: 01 November 2021.
Edited by:
Gabi U. Dachs, University of Otago, Christchurch, New ZealandReviewed by:
Vincenzo Talesa, University of Perugia, ItalyMargreet C. M. Vissers, University of Otago, New Zealand
Copyright © 2021 Alhujaily, Abbas, Xue, de la Fuente, Rabbani and Thornalley. This is an open-access article distributed under the terms of the Creative Commons Attribution License (CC BY). The use, distribution or reproduction in other forums is permitted, provided the original author(s) and the copyright owner(s) are credited and that the original publication in this journal is cited, in accordance with accepted academic practice. No use, distribution or reproduction is permitted which does not comply with these terms.
*Correspondence: Paul J. Thornalley, cHRob3JuYWxsZXlAaGJrdS5lZHUucWE=