 Hong Liu1,2†
 Ruiyi Xu3†
 Chun Gao1,2
 Tong Zhu1,2
 Liting Liu1,2
 Yifan Yang1,2
 Haihong Zeng4
 Yafei Huang4*
 Hui Wang1,2,3*
- 1Cancer Biology Research Center (Key Laboratory of the Ministry of Education), Tongji Hospital, Tongji Medical College, Huazhong University of Science and Technology, Wuhan, China
- 2Department of Gynecologic Oncology, Tongji Hospital, Tongji Medical College, Huazhong University of Science and Technology, Wuhan, China
- 3Department of Gynecologic Oncology, Women’s Hospital, Zhejiang University School of Medicine, Hangzhou, China
- 4Department of Pathogen Biology, School of Basic Medicine, Tongji Medical College, Huazhong University of Science and Technology, Wuhan, China
Cervical squamous cell carcinoma (CSCC) is the major pathological type of cervical cancer (CC), the second most prevalent reproductive system malignant tumor threatening the health of women worldwide. The prognosis of CSCC patients is largely affected by the tumor immune microenvironment (TIME); however, the biomarker landscape related to the immune microenvironment of CSCC and patient prognosis is less characterized. Here, we analyzed RNA-seq data of CSCC patients from The Cancer Genome Atlas (TCGA) database by dividing it into high- and low-immune infiltration groups with the MCP-counter and ESTIMATE R packages. After combining weighted gene co-expression network analysis (WGCNA) and differentially expressed gene (DEG) analysis, we found that PLA2G2D, a metabolism-associated gene, is the top gene positively associated with immune infiltration and patient survival. This finding was validated using data from The Cancer Genome Characterization Initiative (CGCI) database and further confirmed by quantitative reverse transcription-polymerase chain reaction (qRT-PCR). Finally, multiplex immunohistochemistry (mIHC) was performed to confirm the differential infiltration of immune cells between PLA2G2D-high and PLA2G2D-low tumors at the protein level. Our results demonstrated that PLA2G2D expression was significantly correlated with the infiltration of immune cells, especially T cells and macrophages. More importantly, PLA2G2D-high tumors also exhibited higher infiltration of CD8+ T cells inside the tumor region than PLA2G2D-low tumors. In addition, PLA2G2D expression was found to be positively correlated with the expression of multiple immune checkpoint genes (ICPs). Moreover, based on other immunotherapy cohort data, PLA2G2D high expression is correlated with increased cytotoxicity and favorable response to immune checkpoint blockade (ICB) therapy. Hence, PLA2G2D could be a novel potential biomarker for immune cell infiltration, patient survival, and the response to ICB therapy in CSCC and may represent a promising target for the treatment of CSCC patients.
Introduction
Cervical cancer (CC) is the fourth common malignant disease for female with an estimated 604,000 new cases and 342,000 deaths worldwide in 2020 (1). Cervical squamous cell carcinoma (CSCC) and adenocarcinoma are the most common pathological types accounting for approximately 70% and 25% of all CC, respectively (2). Among them, CSCC is mainly related to human papillomavirus (HPV) 16 subtype infection and viral gene integration, whereas adenocarcinoma is often complicated with HPV18 infection (3). Despite the substantial efforts being made in promoting HPV vaccination and early screening, the incidence of CC remains alarming in developing countries (2). In fact, CC is the most frequently diagnosed female cancer in 23 countries according to the latest report (2). Current therapies for CC including surgical treatment, chemotherapy, and radiotherapy have greatly improved the clinical outcome of CC; however, the therapeutic efficacy remains limited for patients with advanced and distant conditions, which estimated a median overall survival of 17 months and 5-year survival of 17% (4, 5). Therefore, there is an urgent need for developing novel therapeutic strategies that can effectively treat these patients (6, 7).
Immunotherapy is one of such strategies that has become a rapidly developing field for cancer treatment including cervical cancer. Through replenishing a sufficient number of expanded autologous T cells that can specifically kill cancer cells, adoptive cell transfer (ACT) has shown great promise in treating CC patients with advance diseases. Two major strategies of ACT, tumor infiltrating lymphocyte (TIL) and T-cell receptor-engineered T cell (TCR-T), were reported to have the objective response rate (ORR) of 44.4% and 50% (8, 9), respectively. Immune checkpoint inhibitors (ICBs), another type of immunotherapy that target programmed death-1(PD-1) receptor or ligand and cytotoxic T-lymphocyte-associated protein 4 (CTLA4), have achieved great success in various kinds of tumors. However, in several clinical trials for advanced cervical cancer patients, the response rate to ICBs was relatively low (10–13). Previous studies have shown that multiple factors are correlated with the efficacy of ICB therapy. Among them, more immune cell infiltration, especially the density and localization of CD8+ T cells in the tumor immune microenvironment (TIME) has been demonstrated to be correlated with a favorable response to ICBs in various cancer types (14, 15). However, the prognostic value and underlying molecular mechanism of immune infiltration in CC with or without immunotherapy remain less characterized.
Here, we utilized the RNA-seq data of CSCC patients from The Cancer Genome Atlas (TCGA) database for the sake of finding biomarkers related to prognosis and immune cell infiltration. To this end, we used two immune scoring algorithms to divide them into two groups with high- and low-immune infiltration. By applying weighted gene co-expression network analysis (WGCNA) and differentially expressed gene (DEG) analysis, phospholipase A2 Group IID (PLA2G2D), an immune- and metabolism-associated molecule, was identified to be the biomarker which is predictive for patient prognosis and immune cell infiltration of CC. Furthermore, five immune-related genes (i.e., SLAMF6, SLAMF1, SH2D1A, TRAT1, and ZNF831) were found to be co-expressed with PLA2G2D. In addition, PLA2G2D expression was also found to be positively correlated with the expression of multiple ICP genes. Finally, through a series of bioinformatics analysis and experimental verification approaches at both the transcriptional and protein levels, we proved that PLA2G2D could be a novel biomarker correlating with immune infiltration, especially CD8+ T cells, in CSCC.
Materials and Methods
Data Source and Processing
The Cancer Genome Atlas (TCGA) CSCC RNA-seq gene expression matrix based on Illumina platform and phenotype data were downloaded from UCSC Xena (https://xenabrowser.net/datapages/). Two hundred fifty CSCC patients were selected for subsequent analysis according to pathological diagnosis of squamous cell carcinoma. Two types of data including raw counts and fragments per kilo base per million mapped (FPKM) reads were applied. FPKM data were converted to transcripts per kilobase of per million mapped (TPM) data. In addition, the validation cohort dataset also based on Illumina high-throughput platform was downloaded from The Cancer Genome Characterization Initiative (CGCI) database (16). RNA-seq data from two immunotherapy cohorts for melanoma (17) and urothelial cancer (18) were downloaded from a public database. The gene names of all expression matrix were de-annotated through “ClusterProfiler” and “org.Hs.eg.db” package based on R language (V4.1.1) (19).
Estimation of Tumor Immune Infiltration and Cytolytic Activity Score
The Microenvironment Cell Populations-counter (MCP-counter) algorithm was applied to score the level of immune cell infiltration in tumor, based on which samples were classified into high- and low-immune infiltration groups using the hierarchical clustering method (20). Alternatively, the level of immune and stromal fraction was scored by Estimation of Stromal Immune cells in MAlignant Tumor tissues using Expression data (ESTIMATE) based on log2-transformed TPM data, and samples were further divided into high- and low-immune infiltration groups equally with the cutoff score set at median (21). In addition, EPIC (22) and quanTIseq (23) algorithm were also utilized to calculate immune cell proportion through TPM expression matrix. CYT score was calculated by the log-transformed geometric mean of GZMA and PRF1 TPM value (24).
Gene Screening by WGCNA
The log2-transformed TPM value expression matrix was put into WGCNA R package to select immune-associated genes (25). Firstly, 12,417 genes with coefficient of variation (CV) >0.5 were selected for further analysis by WGCNA R package. Of note, five samples were excluded for the abnormal height value in sample dendrogram analysis. The power of β value was set at 3 to construct the topological overlap matrix (TOM). Next, we set the minimum module gene size at 30 and generated 63 gene modules with different colors based on hierarchical clustering method, then merged multiple similar gene modules into one. Finally, the correlation between gene modules and traits was calculated to determine the most relevant module and WGCNA filtered genes were screened by setting the standard of module membership (MM) >0.8 and gene significance (GS) >0.5. Genes network was constructed by Cytoscape (V3.8.0) based on the genes with weight value >0.20 (26).
Differentially Expressed Gene Analysis and Pathways Enrichment Analysis
In order to determine the DEGs between the high- and low-immune infiltration groups, the raw read count matrix of 250 CSCC patients from TCGA database was brought into DESeq2 (27). Genes with |Log2(FoldChange)| >1 and adjusted P-value <0.01 were considered as DEGs. ClusterProfiler R package was used to perform Gene Ontology (GO) term enrichment analysis for biological pathway. CGCI data matrix was imported into GSEA software (V4.1.0) for gene set enrichment analysis using the Hallmark gene sets database.
Tissue Collection and Processing
Tumor samples from 18 CSCC patients were collected in Tongji Hospital, Tongji Medical College, Huazhong University of Science and Technology. No patient received radiotherapy and chemotherapy before tissue collection. Each tissue was divided into two parts for RNA extraction and formalin-fixed and paraffin-embedded (FFPE), respectively. FFPE tissues were cut into 4-μm-thick sections on slides. This research was approved by the Ethical Committee of Tongji Hospital, Tongji Medical College, Huazhong University of Science and Technology (approval number: TJ-IRB2021207).
RNA Extraction and Quantitative Real-Time PCR
Total RNA was extracted and dissolved by RNA Isolation Kit (Vazyme, RC-112-01). cDNA library was obtained using a quantitative real-time reverse transcription-polymerase chain reaction (qRT-PCR) reagent kit (Vazyme, R223-01). The qRT-PCR reaction system contained 1 μg cDNA, 0.4 μl forward primer, 0.4 μl reverse primer, 8.2 μl H2O, and 10 μl 2× ChamQ Universal SYBR qPCR Master Mix (Vazyme, R223-01). GAPDH was set as internal control for gene quantification. The expression level of each gene was detected at least three times. The primer sequences are listed in Supplementary Table 1.
Multiplex Immunohistochemistry
All FFPE slides were deparaffinized by dipping in xylene for 1 h and then rehydrated using the gradient ethanol method. After deparaffinization and rehydration, all slides were put into boiled AR6 retrieval solution for heat-induced epitope retrieval in a microwave for 15 min. Endogenous peroxidase was eliminated with 3% H2O2 for 15 min. Slides were cooled to room temperature followed by washing with 1× Tris-buffered saline-Tween 20 (TBST) buffer. Then, Opal 7-color manual IHC kit (Akoya Biosciences, NEL811001KT) was used to stain several markers in a single FFPE slide. To block non-specific protein binding sites, slides were incubated with blocking buffer (Antgene, ANT041) at room temperature for 10 min. Subsequently, FFPE tissue slides were incubated with primary antibody at 37°C for 30 min or 4°C overnight, HRP-labeled secondary antibody for 10 min, and Opal fluorescein for 10 min, successively. To stain four markers in a single slide, four rounds of the above staining procedure were performed with indicated primary antibody and matched Opal fluorescein pairs (Supplementary Table 2). The slides were always washed three times between each step with 1× TBST buffer. After four rounds, samples were stained for cellular DNA with 4′,6-diamidino-2-phenylindole (DAPI) (1:10, Servicebio, G1012-10ML) for 10 min followed by mounting with Fluoromount-G (SouthernBiotech, 0100-01) and preserved in the dark at 4°C. All slides were scanned by Verctra V3.0 System, and ×4 and ×20 objective lens were used to acquire low-power and high-power images, respectively. Images were analyzed with Phenochart V1.0 software and inForm V2.4 software for tissue component segmentation of tumor, stroma, and glass regions, respectively. To identify cell phenotypes, a threshold of fluorescein intensity was set for each marker. The ratio of the targeted cell counts and all cell counts in a certain region was used to calculate the percentage of immune cells in each region. The ratio of cell counts and area (cell/mm2) was utilized to reveal the density of a certain cell population.
Survival Analysis and Statistical Analysis
Survival information of TCGA CSCC patients was downloaded from the UCSC Xena database. Patients who survived less than 30 days were excluded from this analysis. Kaplan–Meier survival analysis was applied to educe the correlation between 5-year overall survival and the expression level of indicated genes. Based on the relationship with survival time, survival status, and minus PLA2G2D TPM value, ROC curve analysis was applied by survivalROC R package. Statistical analysis was performed with R statistical package. Wilcoxon rank-sum test was employed for comparison between two groups. P-values <0.05 were considered significant: *P < 0.05, **P < 0.01, ***P < 0.001, and ****P < 0.0001.
Results
Classification of CSCC by Immune Cell Infiltration
The RNA-seq data and clinical information of a CSCC cohort including 250 patients were downloaded from TCGA database for bioinformatics analysis. Firstly, the MCP-counter, a widely used algorithm, was used to evaluate the level of immune infiltration for each sample, according to which CSCC patients were divided into high- and low-immune infiltration clusters based on the unsupervised stratification method (Figure 1A). Subsequently, the 5-year overall survival of the high- and low-immune infiltration groups was compared. The results demonstrated that the high-immune infiltration cluster determined by the MCP-counter had significantly higher survival than the low-immune infiltration cluster in CSCC (Figure 1B). Next, ESTIMATE, another algorithm which can similarly stratify CSCC patients into high- and low-immune fraction clusters by a median cutoff (Figure 1C), was chosen to verify this finding. Again, the high-immune infiltration cluster classified by ESTIMATE was found to have higher survival than the low-immune infiltration cluster in CSCC (Figure 1D). Of note, ESTIMATE can also classify CSCC patients into high- and low-stromal fraction clusters (Figure 1C). However, no difference was found between the two stromal fraction-stratified clusters in terms of patient survival (Figure 1E, P = 0.22). Together, our results demonstrated that immune infiltration, but not stromal fraction, was correlated with patient survival in CSCC. Moreover, the other two algorithms, EPIC and quanTIseq, were used to calculate several immune cell proportions compared with the MCP-counter and ESTIMATE. Moreover, the immune cell infiltration results of EPIC and quanTIseq were consistent with the MCP-counter and ESTIMATE (Figure S1).
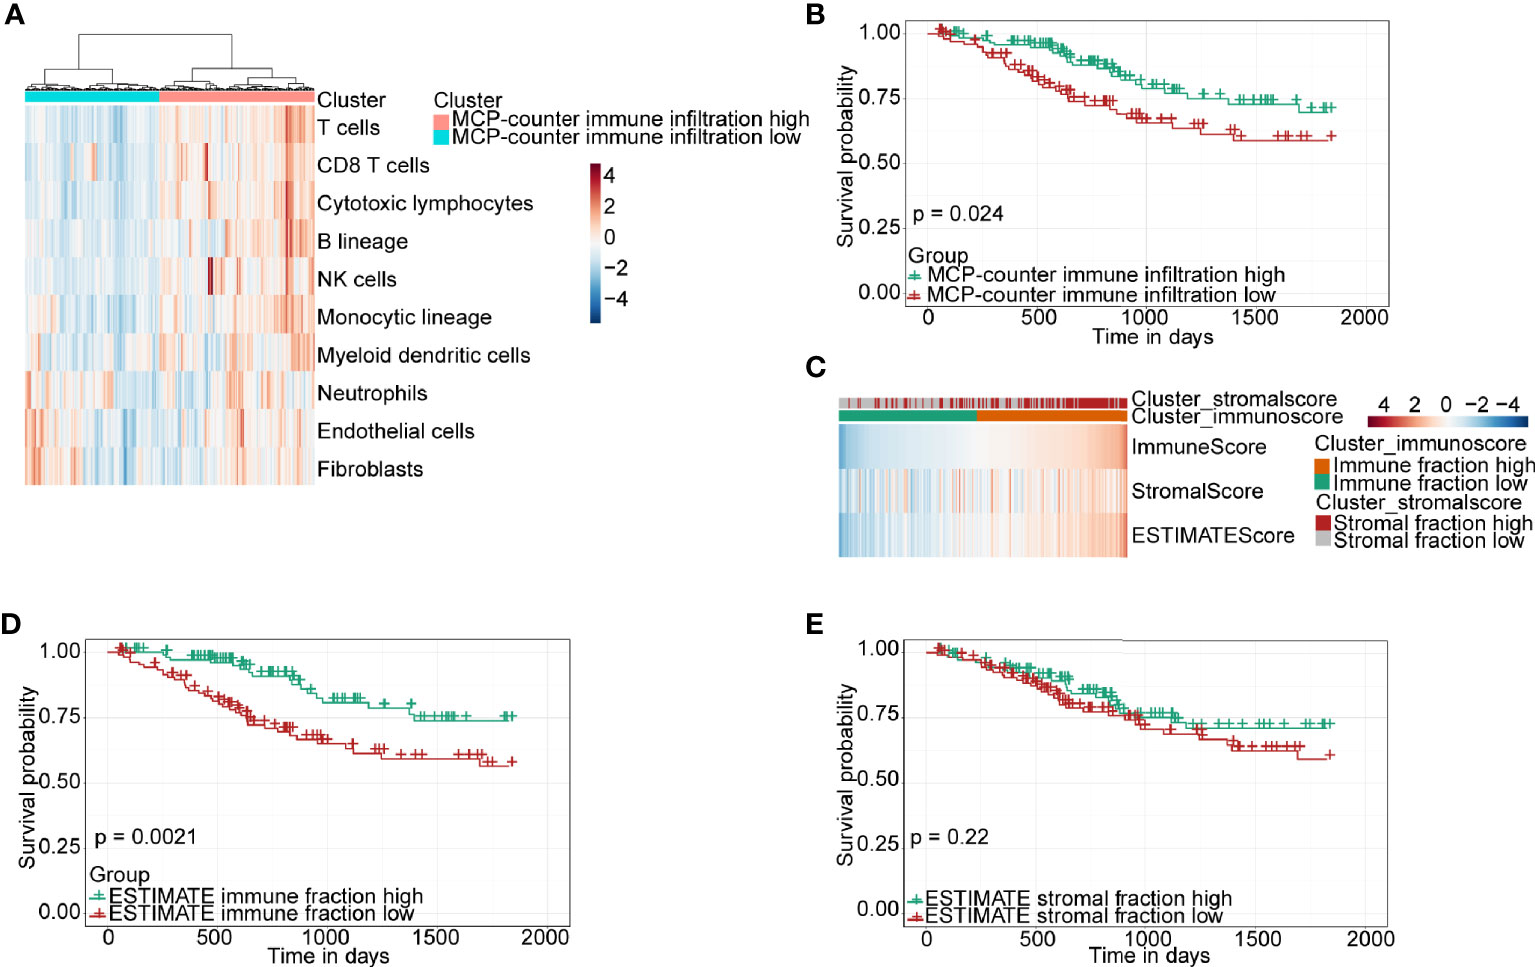
Figure 1 Immune classification and survival analysis of 250 CSCC patients selected from TCGA database. (A) Heatmap of TME composition as defined by the MCP-counter algorithm. (B) Kaplan–Meier survival curve for immune infiltration-high and infiltration-low groups determined by the MCP-counter. (C) Heatmap showing immune and stromal fraction by the ESTIMATE algorithm. (D, E) Kaplan–Meier survival curve for patients with high and low fractions of immune cells and stromal cells classified by the ESTIMATE algorithm.
Construction of Weighted Gene Co-Expression Network and Genes Filtering Analysis
CSCC RNA-seq data from TCGA was imported into WGCNA R package to identify gene modules containing similarly expressed genes, especially immune-related genes. Sample clustering and trait distribution are shown in Figure 2A. Power value was set at β = 3 to build a scale-free network (Figure 2B). Gene modules were calculated and the cutoff height was set at 0.5 to merge similar gene modules into one (Figure 2C). This analysis resulted in 63 merged dynamic gene modules with each module containing dozens to more than a thousand genes (Figure 2D, Supplementary Table 3).
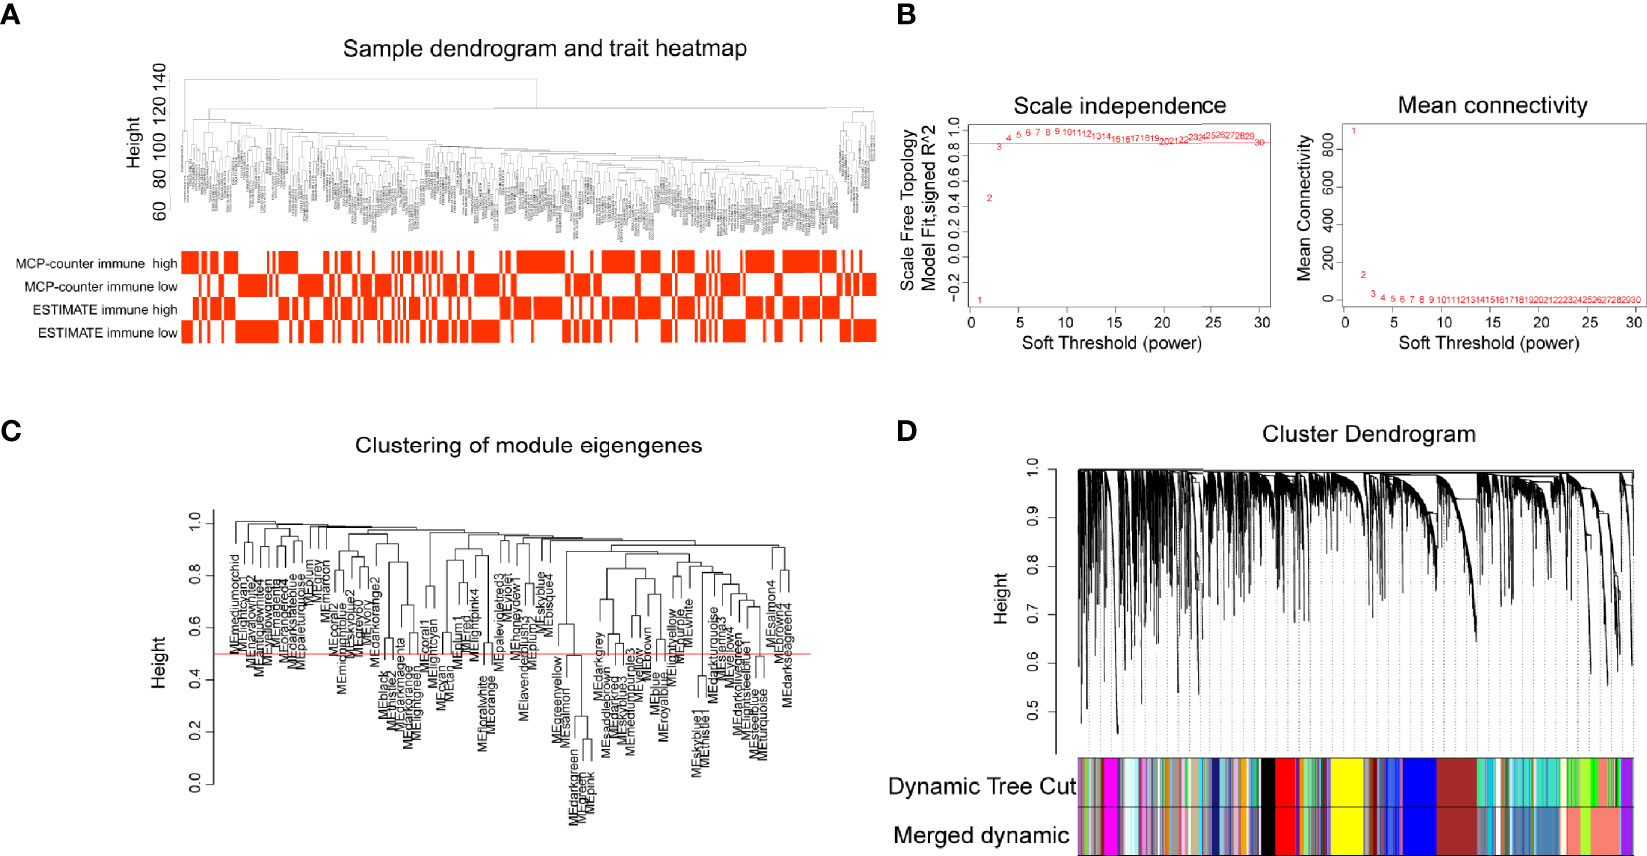
Figure 2 Gene modules construction by weighted gene co-expression network analysis (WGCNA). (A) Sample dendrogram and trait heatmap. (B) The relationship of soft threshold with scale independence and mean connectivity. (C) Clustering of module eigengenes, height set at 0.5 to merge modules. (D) Cluster dendrogram showing the hierarchical cluster tree for the identified co-expression gene modules with different colors.
In order to identify immune-related modules and genes, we constructed the relationship between gene modules and immune infiltration traits (Figure 3A). We focused on the brown module which was most relevant to immune infiltration or immune fraction determined by the MCP-counter and ESTIMATE, respectively. To further identify genes in the brown module that are most correlated with the MCP-counter immune infiltration and ESTIMATE immune fraction, the screening criteria of MM >0.8 and GS >0.5 were applied, through which 77 genes (brown module vs. MCP-counter immune infiltration) and 73 genes (brown module vs. ESTIMATE immune fraction) were filtered (Figures 3B, C). Next, Venn plot was used to reveal the overlapped filtered genes of these two groups. As shown in Figure 3D, all 73 brown module genes contained in the ESTIMATE high-immune fraction group were found to be presented in the MCP-counter high-immune infiltration group as well. Finally, GO pathways enrichment analysis for the shared 73 WGCNA genes showed that these genes were mostly involved in immune-associated pathways, such as T-cell activation, lymphocyte differentiation, and regulation of T-cell activation (Figure 3E).
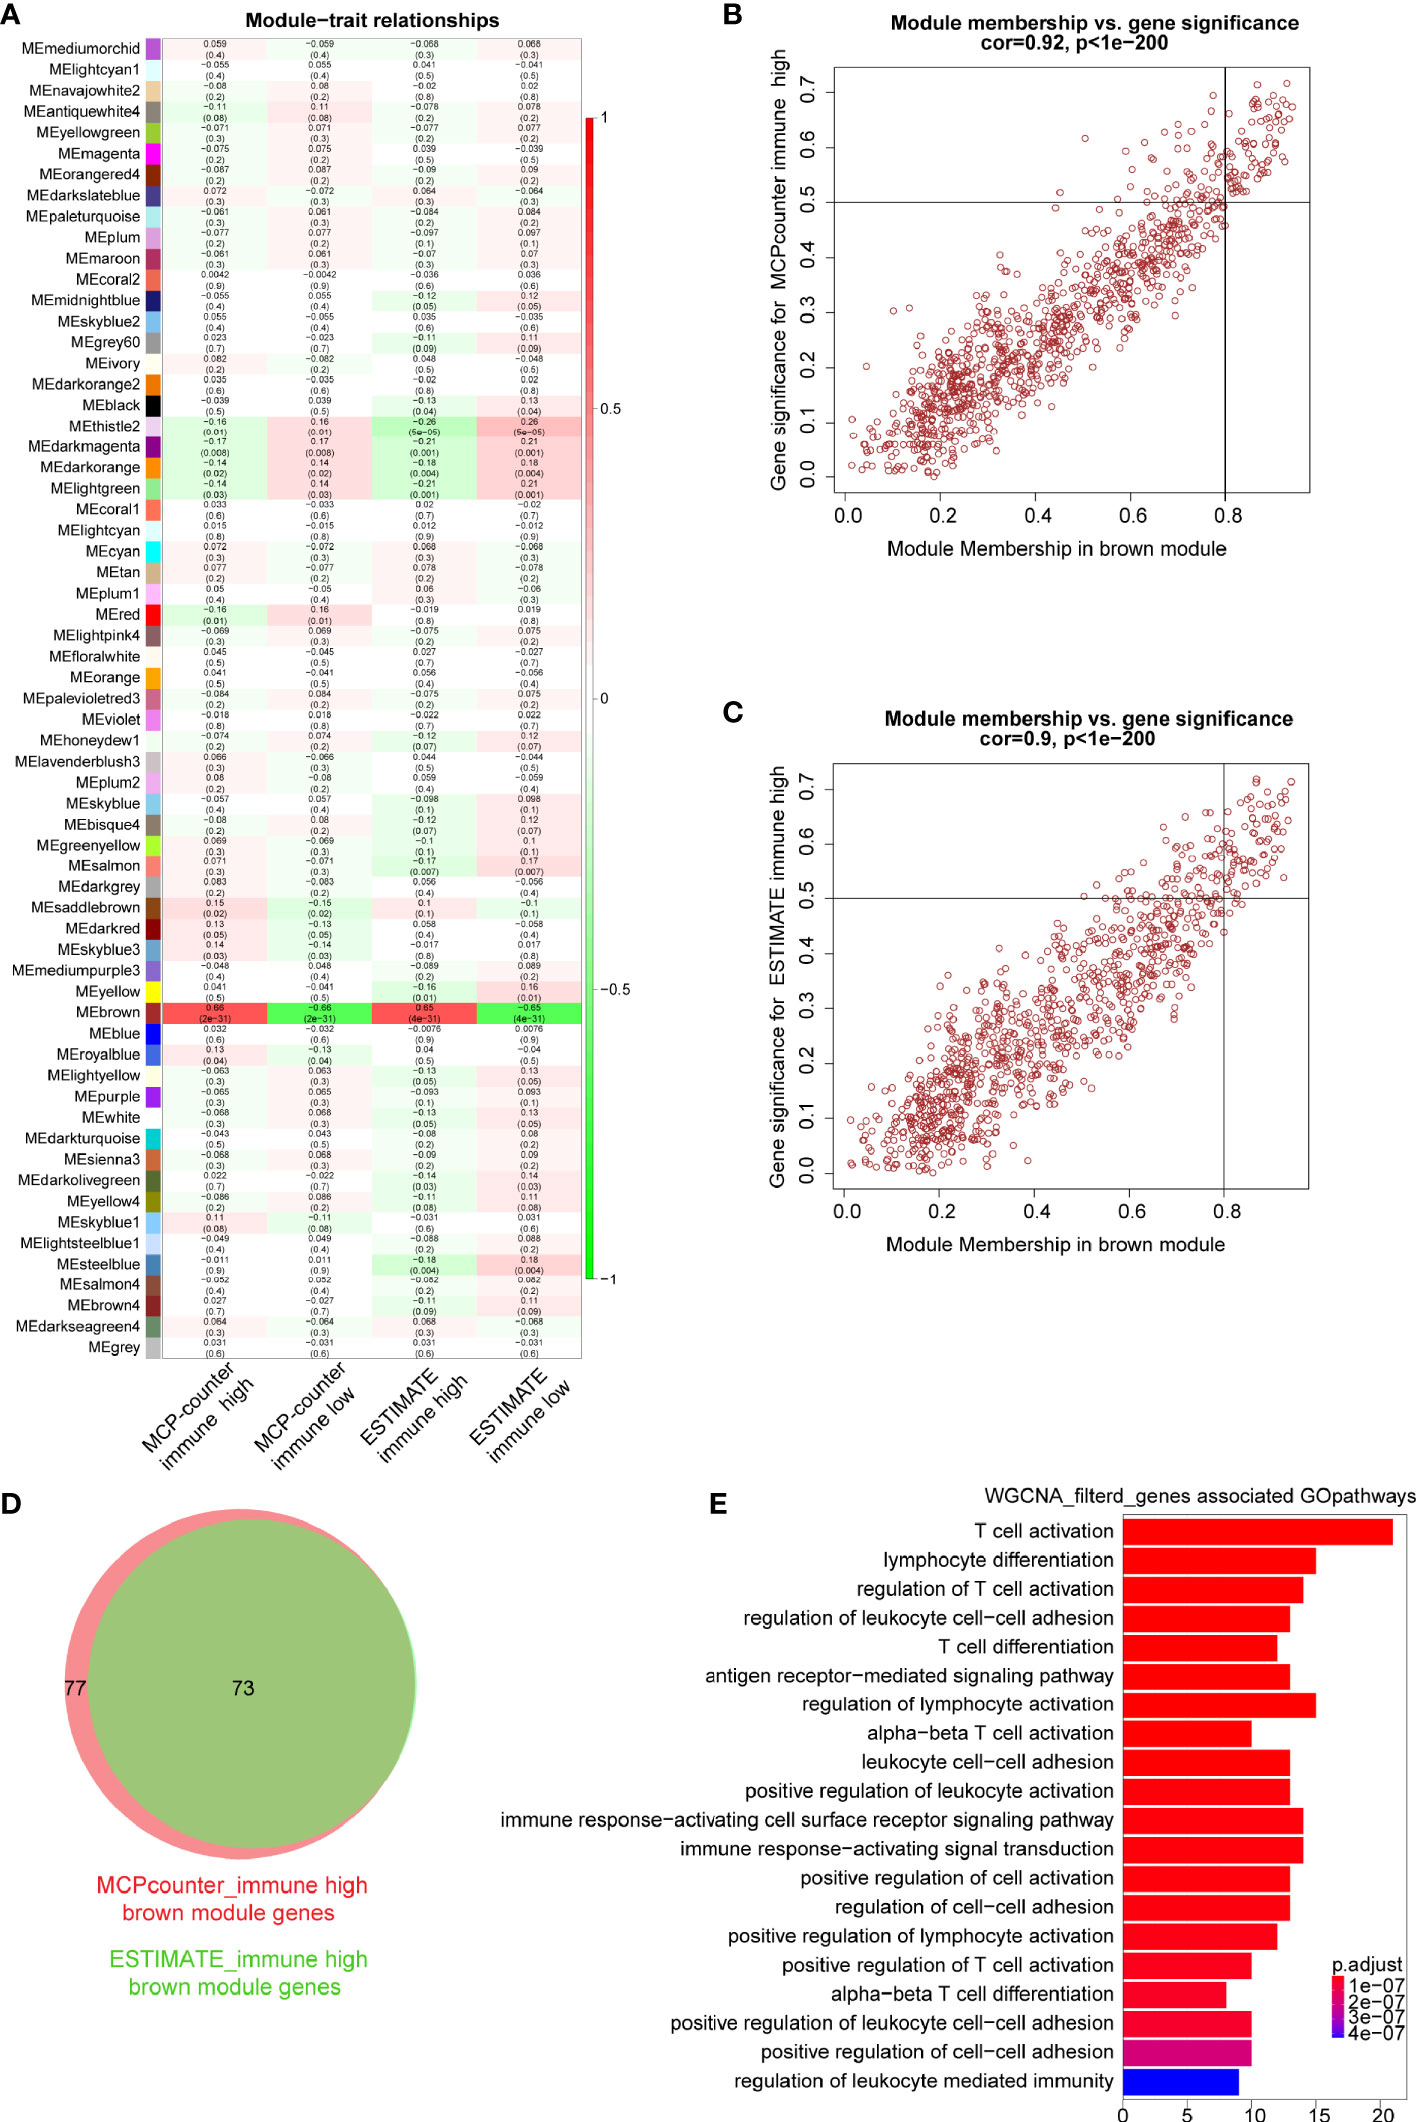
Figure 3 Key modules and genes identified based on module–trait relationship. (A) The relationship between co-expression modules and traits; each grid includes the degree of correlation and P-value. (B, C) Scatter plots showing the relationship of module membership (MM) in brown module, with gene significance (GS) for high-immune infiltration determined by the MCP-counter and ESTIMTE algorithms, for which MM >0.8 and GS >0.5 were set as gene filtered standard, respectively. (D) Venn plot showing common filtered genes identified in the high-immune infiltration groups determined by the MCP-counter and ESTIMATE. (E) GO analysis for WGCNA filtered genes in the biological process.
PLA2G2D Is Positively Correlated With Immune infiltration and Patient Survival
To further explore hub genes from these 73 genes, DEG analysis was performed using DESeq2 R package. DEGs were determined between the high- and low-immune infiltration groups determined by the MCP-counter, through which 968 upregulated genes and 323 downregulated genes were found in the high- and low-immune infiltration groups, respectively (Figure 4A). Similarly, 1,060 upregulated genes and 650 downregulated genes were found in the high- and low-immune fraction groups determined by ESTIMATE, respectively (Figure 4B). Interestingly, all 73 WGCNA filtered genes were presented in these two upregulated gene sets. Notably, PLA2G2D, a metabolism-related gene, was identified as the most differentially expressed gene among the 73 genes, as determined by the log2 (FoldChange) value of these genes (Table 1 and Figures 4A, B).
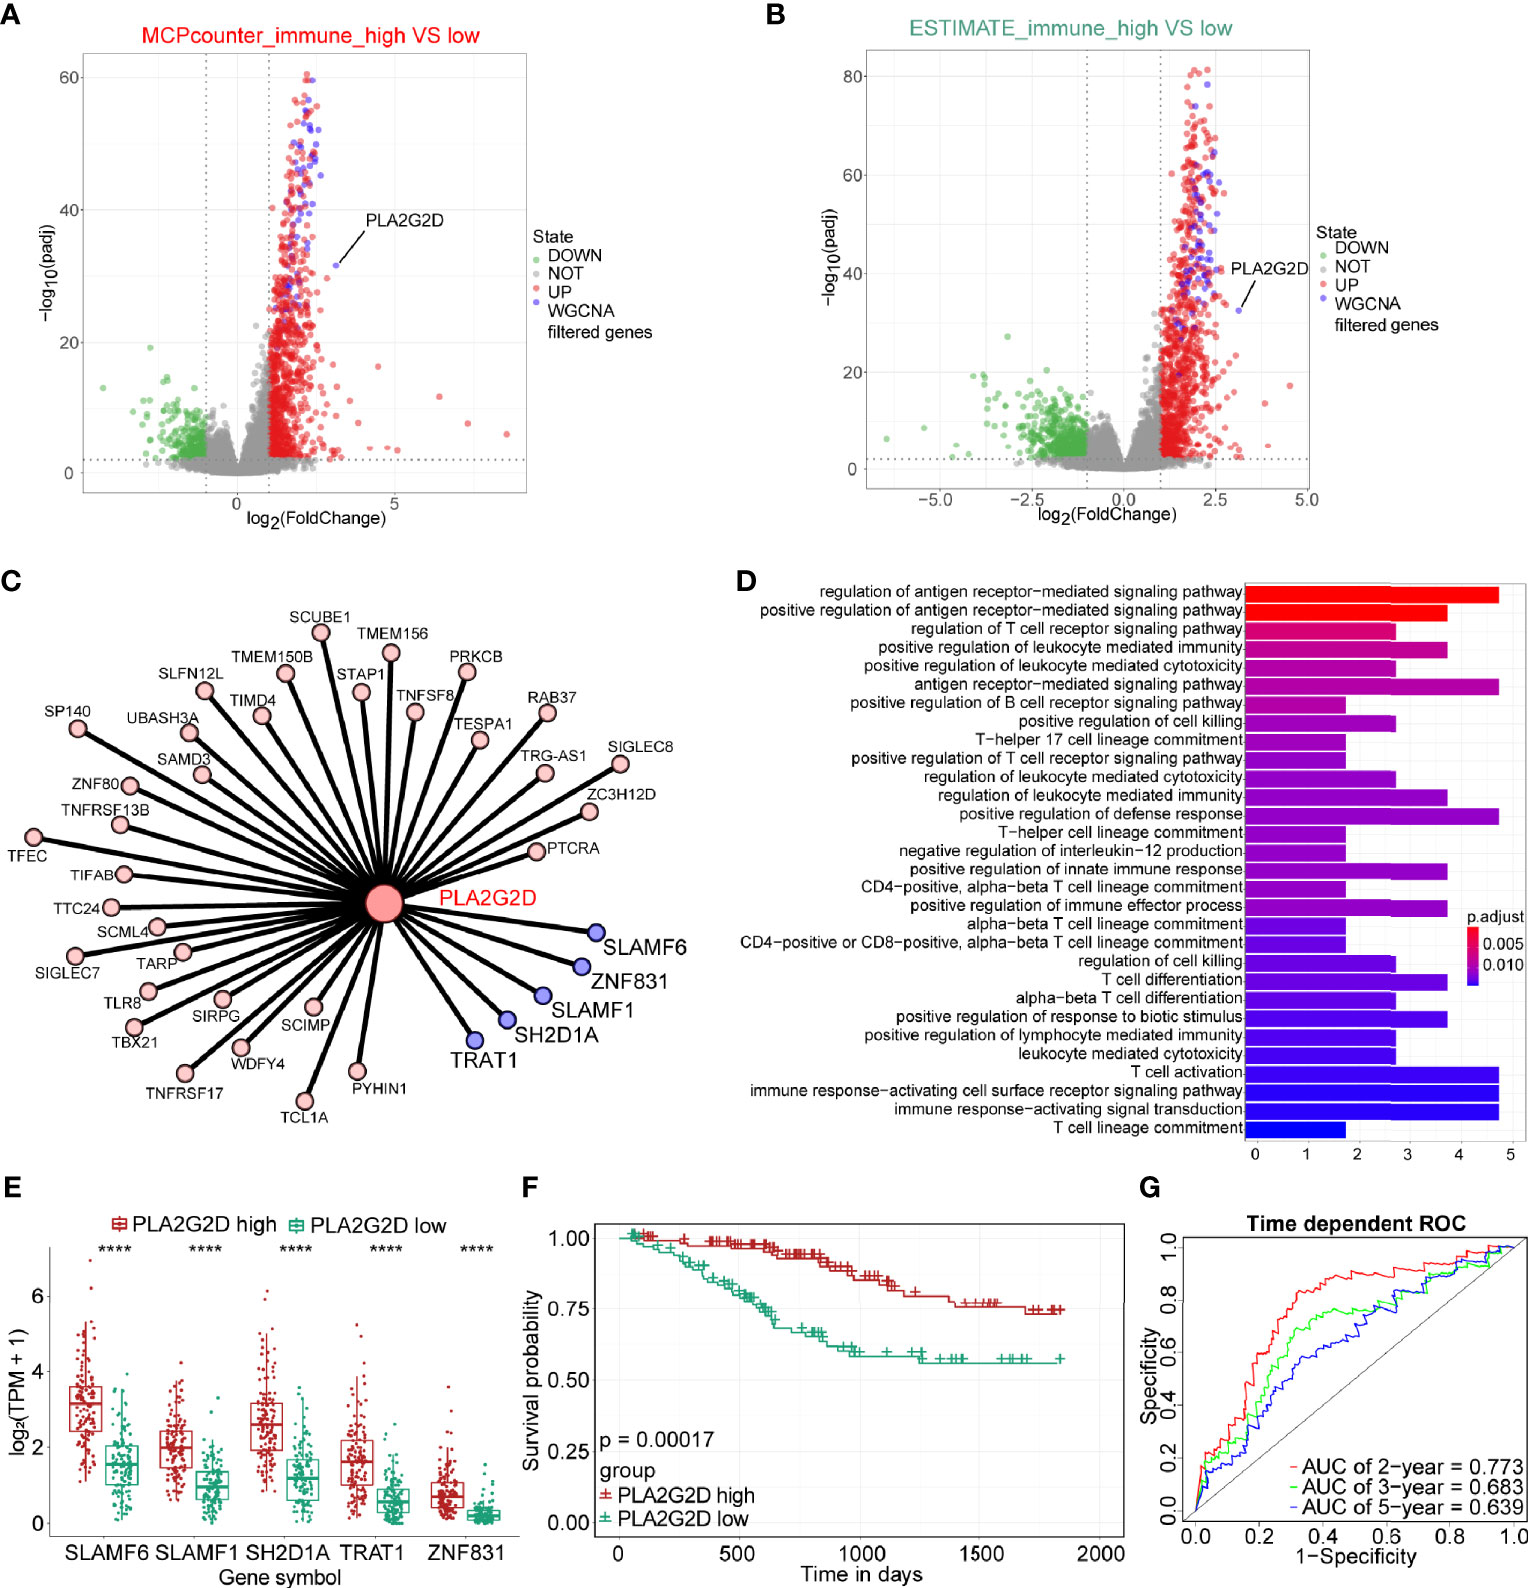
Figure 4 The expression of PLA2G2D is positively correlated with immune infiltration and patient survival. Volcano plot for DEGs identified for high- and low-immune infiltration groups based on the MCP-counter (A) and ESTIMATE (B). The green and red dots represented the significantly downregulated and upregulated genes, respectively, and the gray dots represented the undifferentiated genes; the purple dots showed the WGCNA filtered genes, with |Log2(FoldChange)| >1 and adjusted P-value <0.01. (C) Cytoscape network plot showed the relationship between PLA2G2D and other co-expressed genes with weight value >0.2. The purple nodes showing the co-expressed genes with weight value >0.3. (D) GO pathways enrichment analysis for genes co-expressed with PLA2G2D. (E) Histogram showing the relationship between the expression levels of PLA2G2D and other five co-expressed genes, ****P < 0.0001. (F) Kaplan–Meier survival curve plot showing the relationship between PLA2G2D expression level and patient survival. (G) Time-dependent ROC curve analysis for minus PLA2G2D TPM value at 2-, 3-, and 5-year cutoffs.
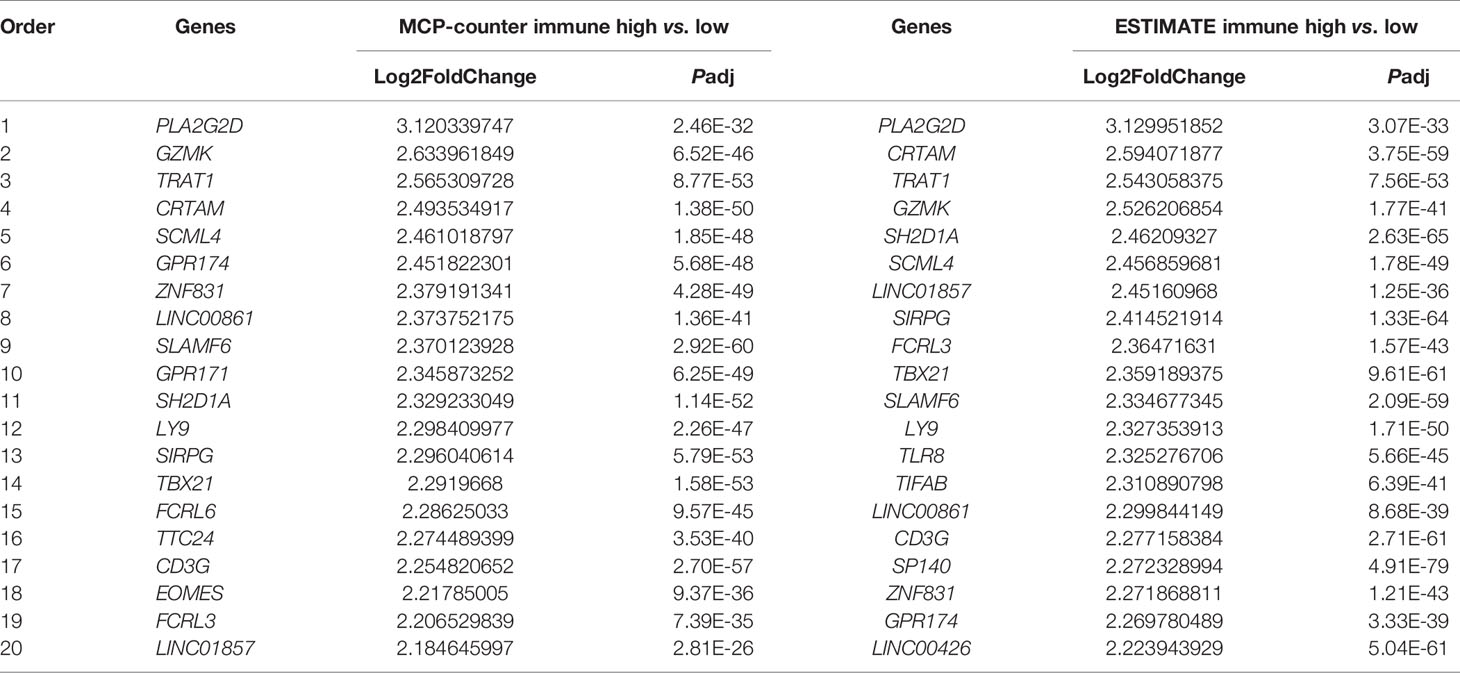
Table 1 Top 20 WGCNA filtered genes determined by DEG analysis of high- and low-immune infiltration groups classified by the MCP-counter and ESTIMATE algorithms.
Next, we sought to identify the genes that were co-expressed with PLA2G2D. The co-expression network between PLA2G2D and other genes was constructed by using the criteria of weight >0.20 (Figure 4C and Table 2). To gain insight into the function of these co-expressed genes, GO analysis of the biological process was conducted and the most co-expressed genes were enriched in immune-related pathways (Figure 4D). Of note, several genes with weight >0.3 including SLAMF6, SLAMF1, SH2D1A, TRAT1, and ZNF831 were most co-expressed with PLA2G2D (Figure 4E). Importantly, Kaplan–Meier survival curve analysis showed that the expression level of PLA2G2D was positively correlated with patient survival (Figure 4F, P = 0.00017). Finally, ROC curve was constructed to demonstrate the prognostic ability of PLA2G2D in TCGA-CSCC cohort. The AUCs of PLA2G2D TPM minus value for 2, 3, and 5 years were 0.773, 0.683, and 0.639, respectively (Figure 4G).
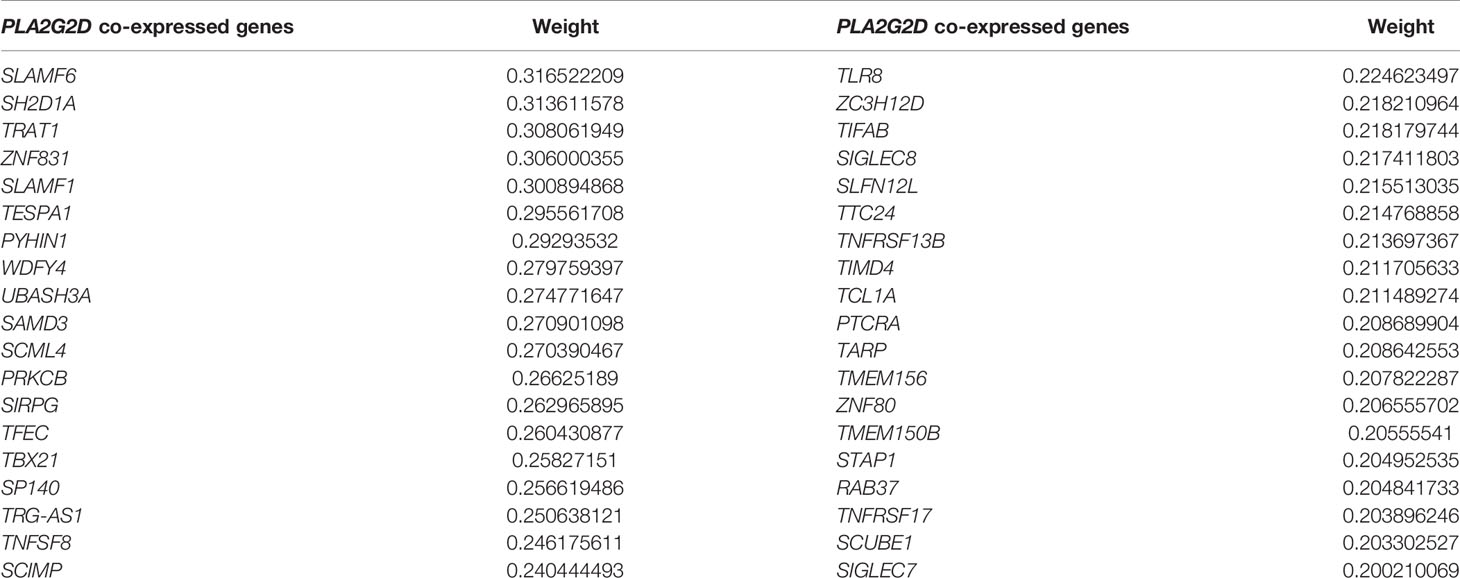
Table 2 List of genes co-expressed with PLA2G2D with weight value >0.20.
Bioinformatic Validation Using Data From the CGCI Database and PCR Validation Using Tumor Tissues
To validate the correlation between overexpressed PLA2G2D and more immune cell infiltration demonstrated in Figure 1, we analyzed RNA-seq data of CSCC from the CGCI database that was also sequenced on an Illumina high-throughput sequence platform. The immune characteristics of patients in the PLA2G2D high- and low-expression clusters are illustrated in Figure 5A by the analysis with the four algorithms. Overexpressed PLA2G2D was bound up with more immune cell infiltration such as T cells, B cells, NK cells, and myeloid dendritic cells (Figure 5B). Similarly, ImmuneScore, StromalScore, and ESTIMATEScore were higher in the PLA2G2D high-expression cluster than in the PLA2G2D low-expression cluster (Figure 5C). CD8+ T cells, macrophages, and B cells were also higher in the PLA2G2D-high group based on quanTIseq and EPIC algorithms (Figure 5D). GSEA analysis showed that the PLA2G2D high-expression cluster was enriched in several immune-associated pathways such as allograft rejection, interferon gamma response, interferon alpha response, complement, and oxidative phosphorylation pathways (Figure S2A), whereas PLA2G2D low-expression cluster was enriched in hypoxia, apical junction, glycolysis, mitotic spindle, and angiogenesis pathways (Figure S2B). We also validated whether PLA2G2D was co-expressed with other genes as indicated by the aforementioned WGCNA analysis. Our analysis demonstrated that the expression level of PLA2G2D was also positively associated with SLAMF6, SLAMF1, SH2D1A, TRAT1, and ZNF831 when the CGCI database was used (Figure 5E). To further validate these results using fresh-isolated clinical samples, 18 cervical squamous carcinoma samples were collected and the corresponding clinical data are shown in Table 3. Total RNA per sample was isolated and qRT-PCR was performed to examine the gene expression levels of PLA2G2D and other five genes (Table 4). Our cohort was classified into PLA2G2D high- and low-expression groups according to the median expression level of PLA2G2D. Similarly, the expression levels of four immune-related genes were significantly higher in the PLA2G2D high-expression group, except for ZNF831, which could hardly be detected by qRT-PCR in both groups (Figure 5F and Table 4).
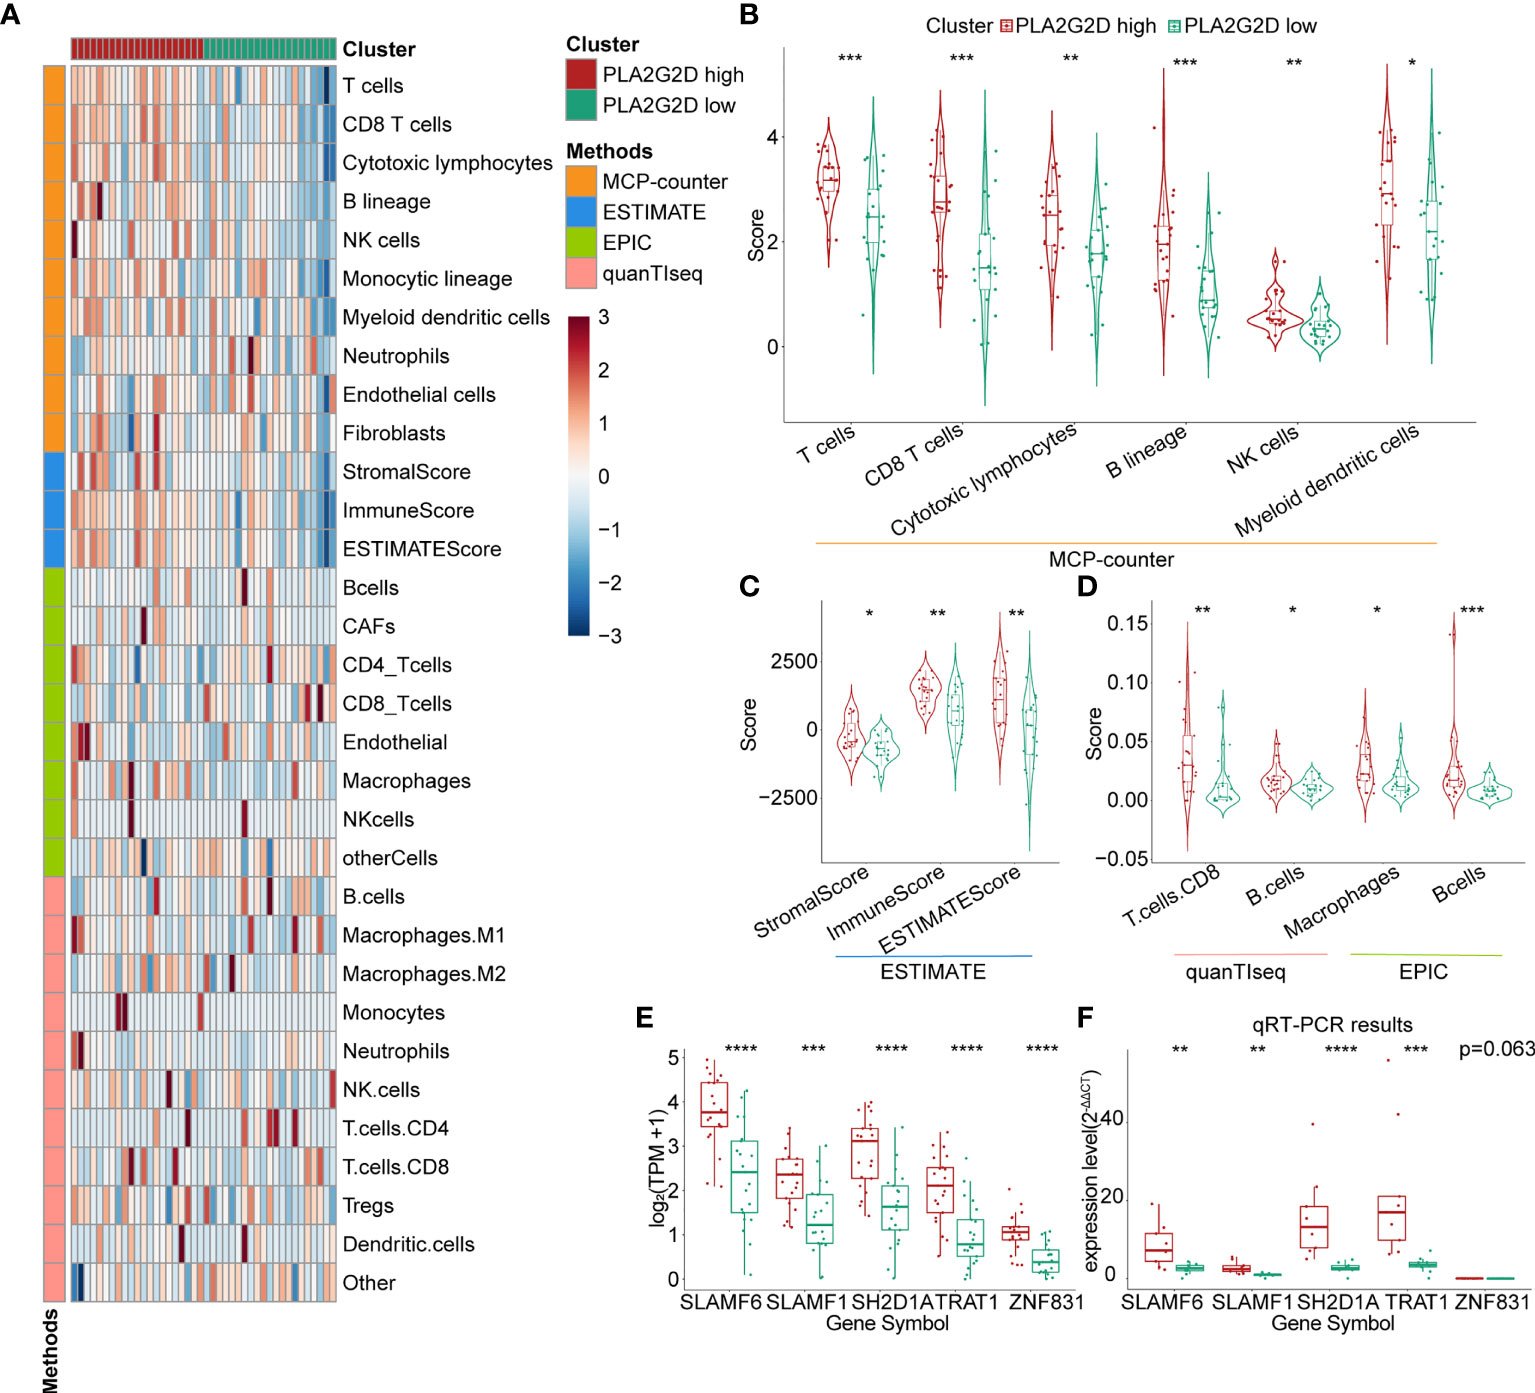
Figure 5 Further validation of the relationship between PLA2G2D expression and immune infiltration. (A) Heatmap for PLA2G2D high- and low-expression groups based on the MCP-counter, ESTIMATE, EPIC, and quanTIseq algorithms using data from the CGCI database. (B) Violin plot showing the differential scores of six immune cell types determined by the MCP-counter algorithm. (C) Violin plot showing the differential StromalScore, ImmuneScore, and ESTIMATEScore determined by the ESTIMATE algorithm. (D) Violin plot showing the differential immune cell types determined by quanTIseq and EPIC algorithms. (E, F) Histograms showing the relationship between the expression levels of PLA2G2D and WGCNA filtered five co-expressed genes using data from the CGCI database (D) and freshly isolated clinical samples (E). *P < 0.05, **P < 0.01, ***P < 0.001, and ****P < 0.0001.
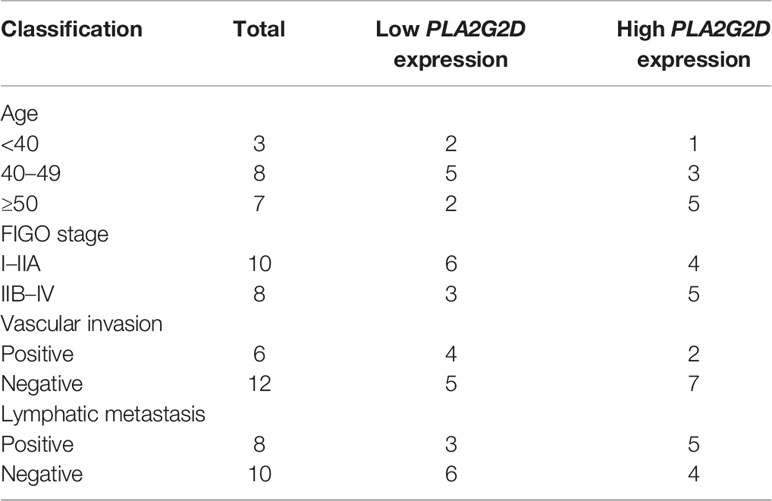
Table 3 Clinical characteristics of patients from our CSCC cohort.
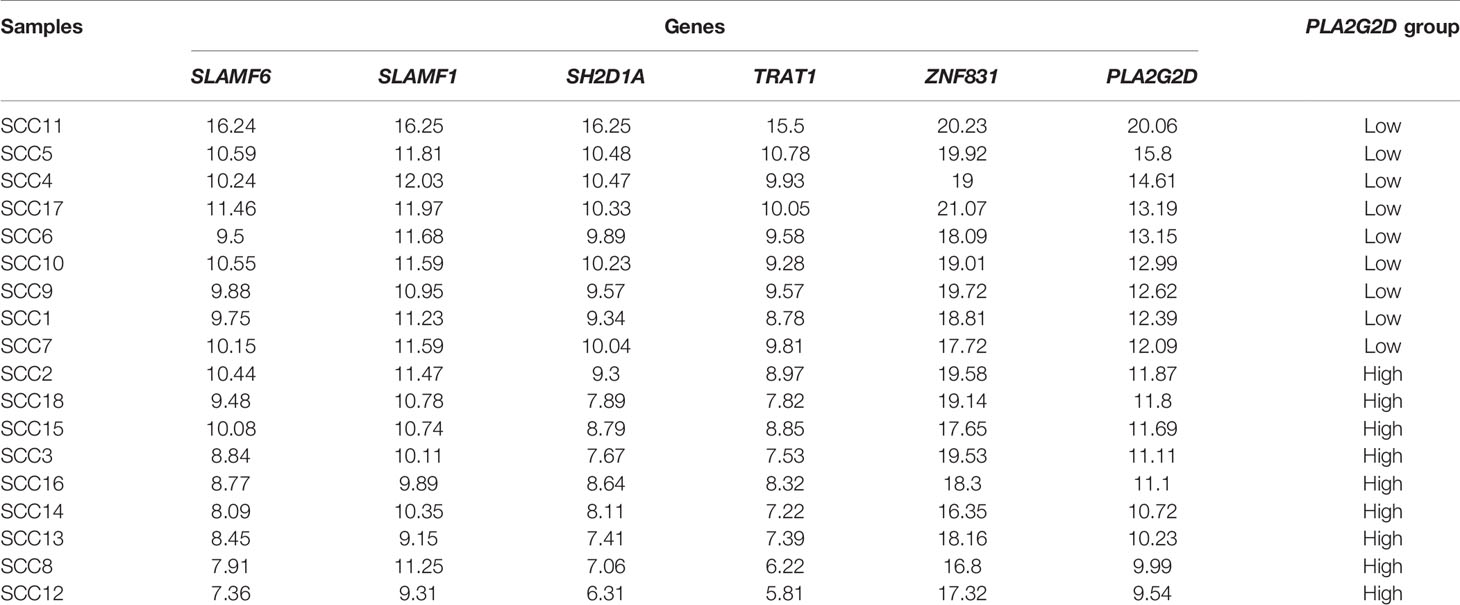
Table 4 qRT-PCR ΔCT value of PLA2G2D and other five co-expressed genes.
More Immune Cell Infiltration Determined by Multiplex Immunohistochemistry in PLA2G2D High-Expression Samples
Next, the multiplex immunohistochemistry (mIHC) method was performed to validate whether immune cell infiltration was correlated with PLA2G2D expression in our cohort of 18 CSCC clinical samples. As our aforementioned bioinformatic analysis indicated that T cells and macrophages were the most prevalent cells among the infiltrated immune cells positively correlated with PLA2G2D expression, and previous studies have shown that the number and percentage of T cells and macrophages were more than the other kind of immune cells in cervical cancer (28, 29), we chose these two cells along with tumor cells to determine the percentage and density of individual immune cell populations in each slide. For this purpose, the mIHC panel (Supplementary Table 2) was designed to simultaneously stain several markers including CD3 (for all T cells), CD8 (for cytotoxic T cells), CD68 (for macrophages), PCK (for tumor cells), and DAPI (for nucleic identification). Of note, CD3+CD8− TILs were defined as CD4+ TILs. Our results indicated that CD3+ T cells, including both CD4+ and CD8+ TILs, and CD68+ macrophages were more abundant in the PLA2G2D-high group than in the PLA2G2D-low group, as shown by representative merged images at low magnification (Figures 6A, D) and high magnification (Figures 6B, E) and by single spectrum images for each marker (Figures 6C, F). After comparing PLA2G2D-high and PLA2G2D-low groups for the compositions of individual cell populations in different regions (Figure 7A) and the percentages of individual cell populations in each sample (Figure S3), we found that the percentage values of CD3+ TILs, CD8+ TILs, and macrophages in the stromal region and all regions of the PLA2G2D high-expression group were significantly higher compared with that of the PLA2G2D low-expression group (Figure 7B). Importantly, in the tumor region, CD8+ TILs were the only cell population that were more frequently observed in the PLA2G2D high-expression group (Figure 7B).
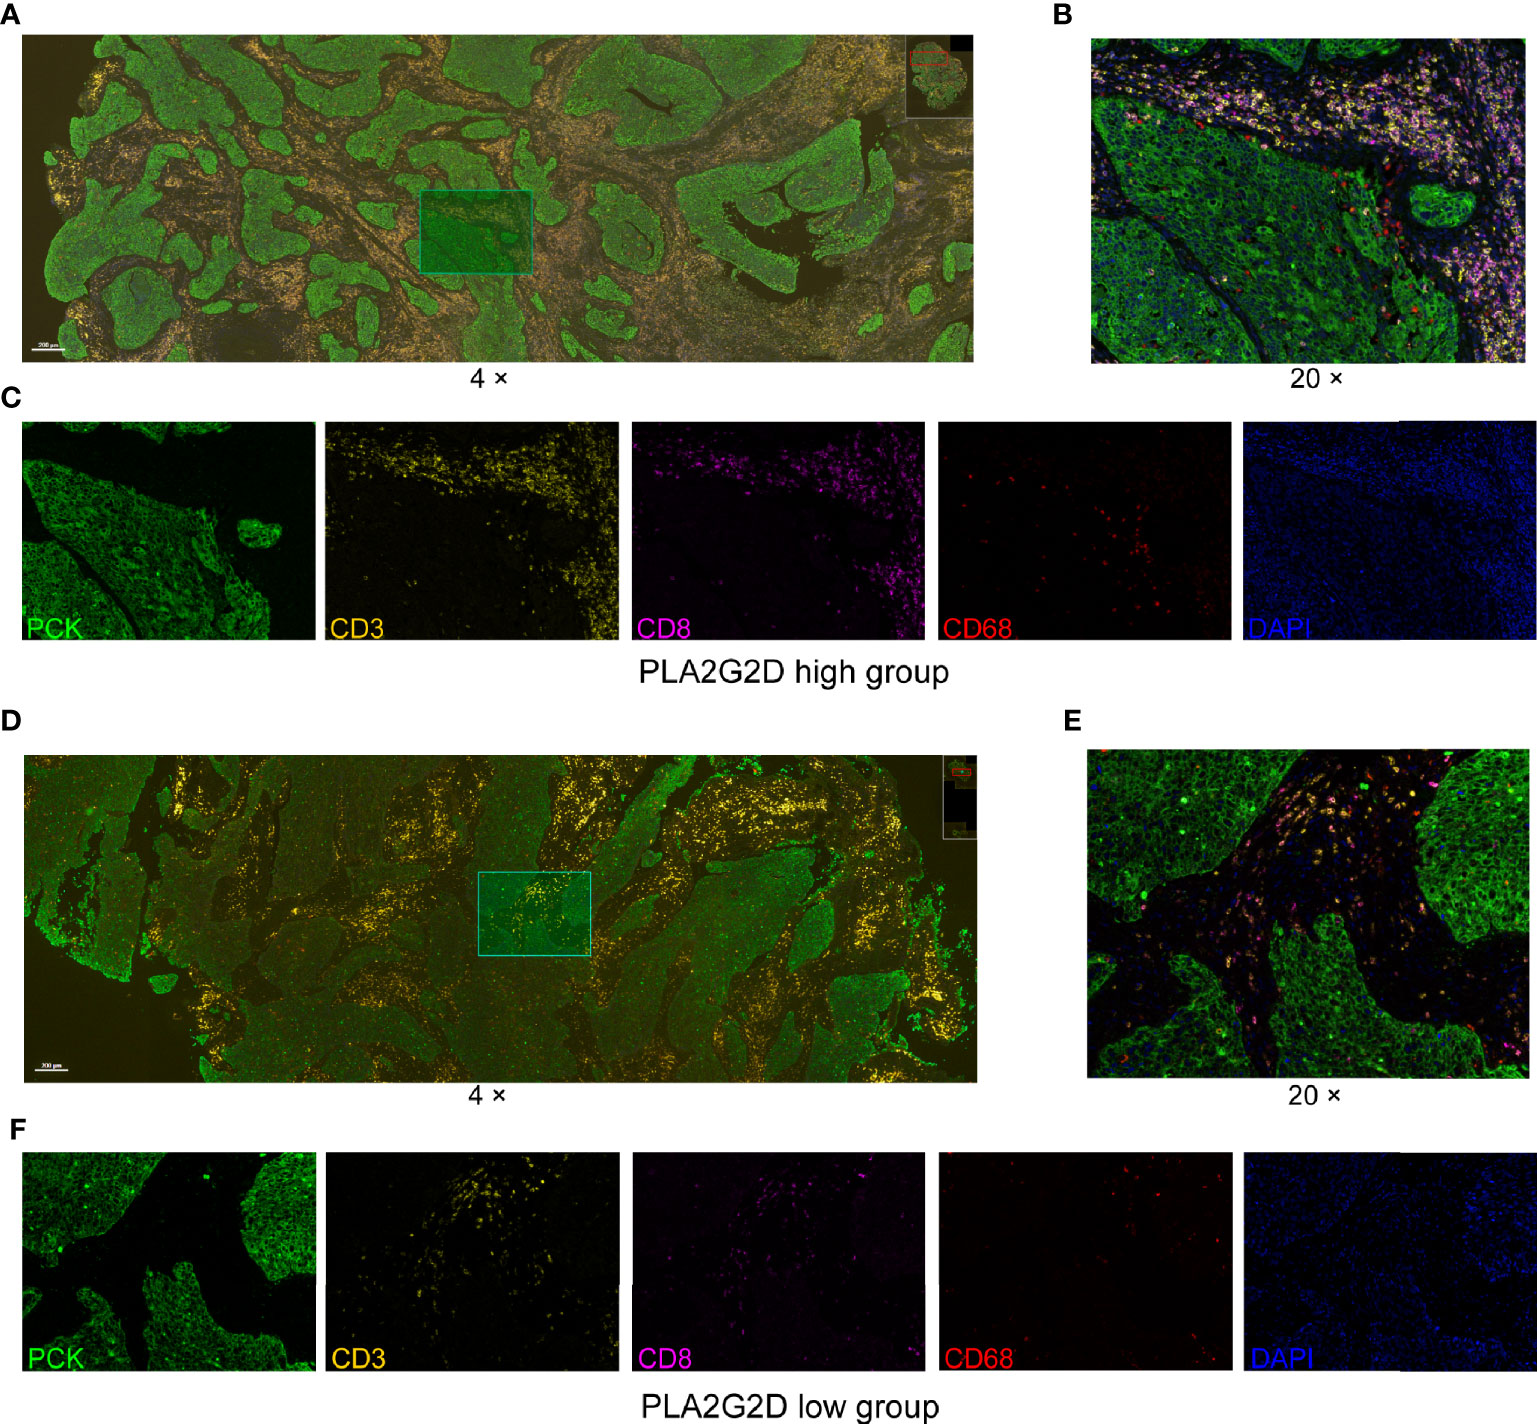
Figure 6 mIHC staining for CD3, CD8, CD68, PCK, and DAPI in cervical squamous cancer specimens with high (A–C) and low expression (D–F) of the PLA2G2D gene. (A, D) Merged mIHC images at low magnification (×4). (B, E) Merged mIHC images at high magnification (×20) indicating the same filed in (A, D). (C, F) Single spectral images indicating the same filed in (B, E).
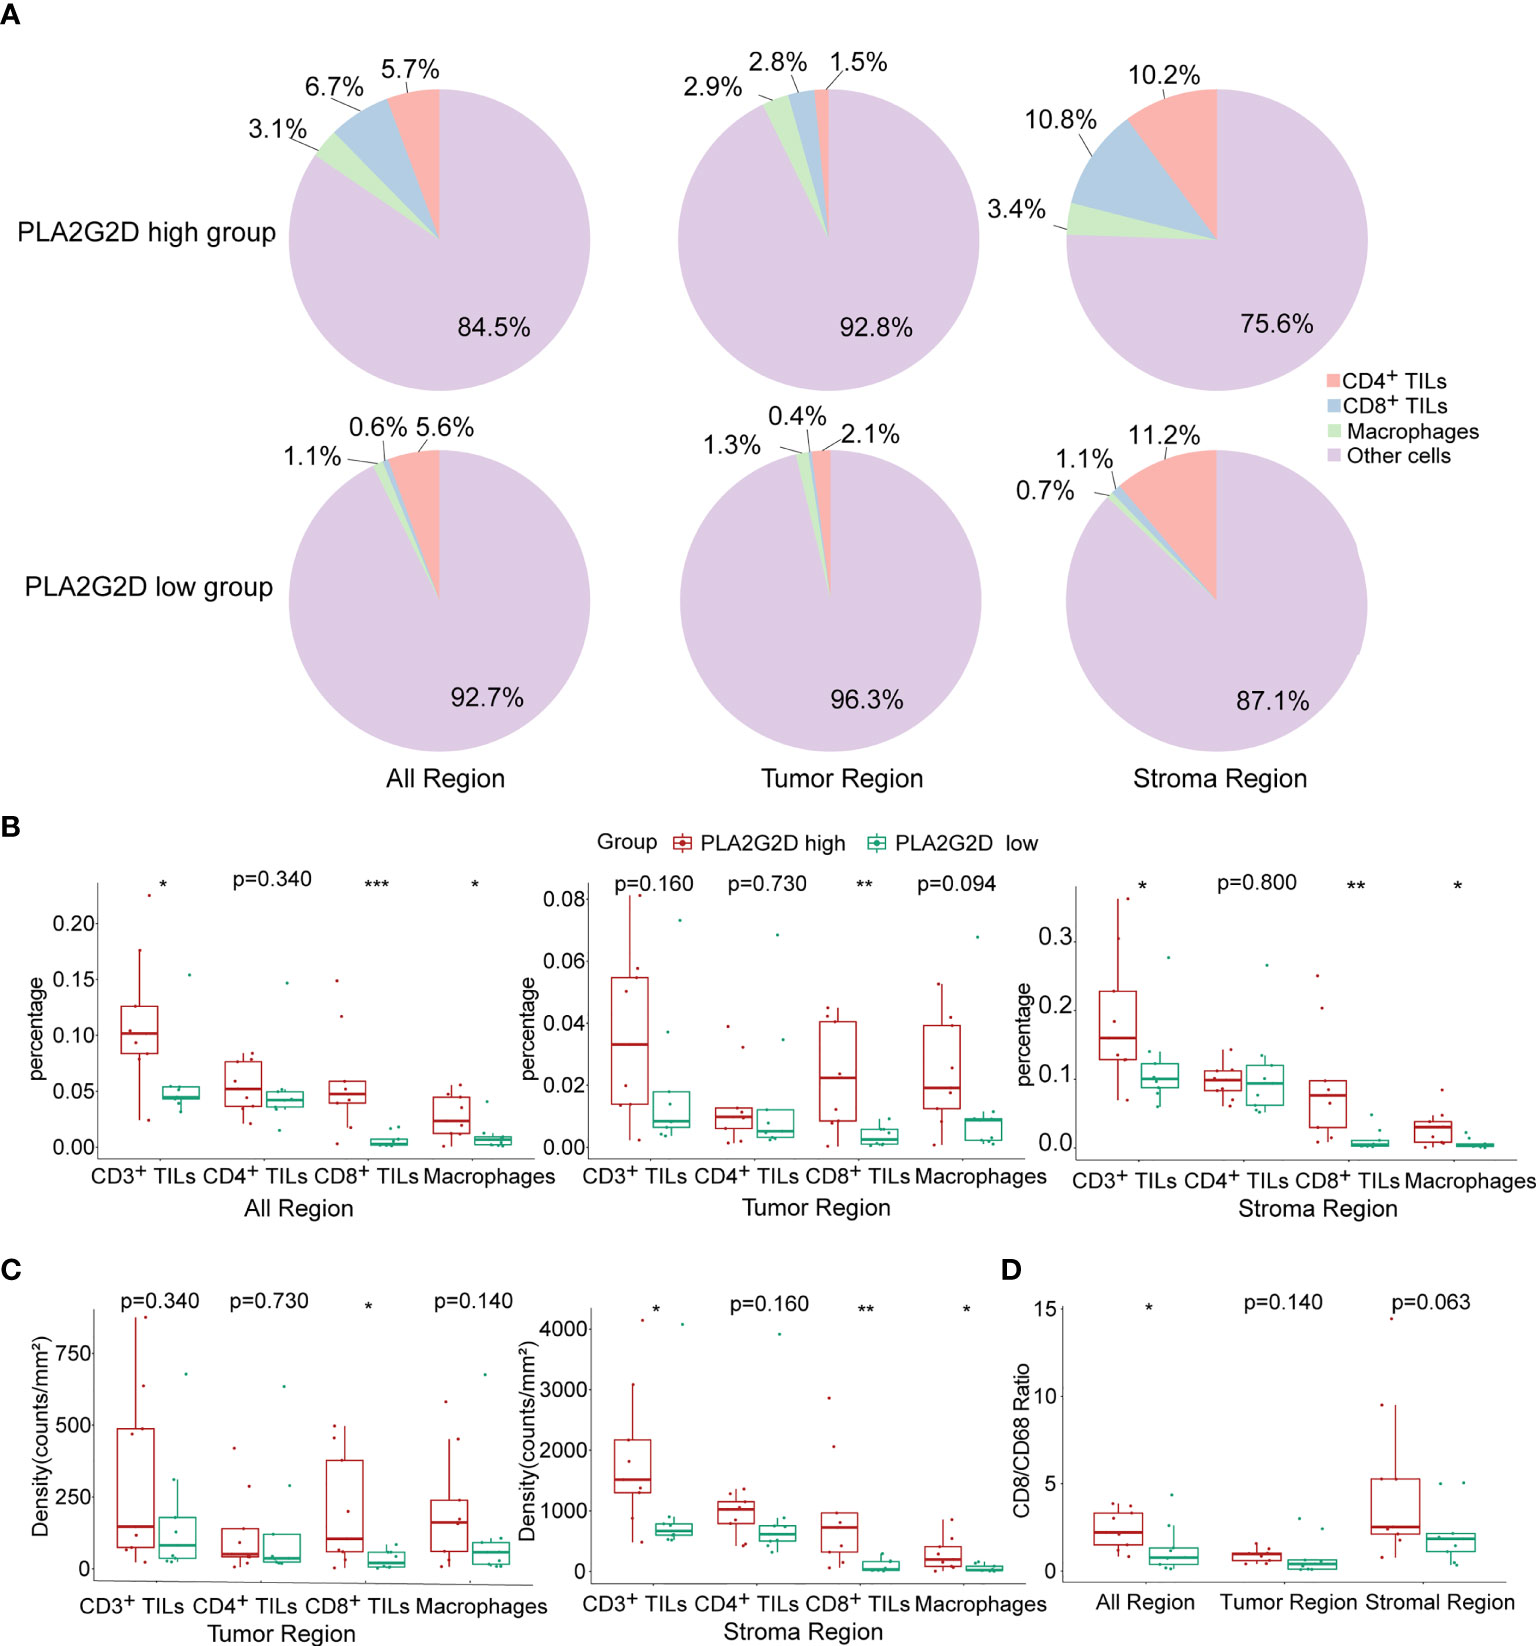
Figure 7 Statistical analysis for mIHC staining. (A) Pie plots showing the composition of immune cells within different regions in PLA2G2D high- and low-expression groups. (B) Histograms showing the comparison of the percentage of individual immune cell populations between PLA2G2D high- and low- expression groups in different regions. (C) Histograms showing the comparison of the density of individual immune cell populations between PLA2G2D high- and low-expression groups in different regions. (D) Histogram showing the comparison of the CD8/CD68 ratio between PLA2G2D high- and low-expression groups in different regions. *P < 0.05, **P < 0.01, and ***P < 0.001.
Next, cell density (cell counts/mm2 area) was analyzed in the tumor and stromal region, respectively. Similar to the comparison of cell percentage, cell densities of CD3+ TILs, CD8+ TILs, and macrophages were significantly higher in the stromal region of the PLA2G2D high-expression group than those of the PLA2G2D low-expression group. Moreover, in the tumor region, only CD8+ TIL density in the PLA2G2D high-expression group was higher compared with that in the PLA2G2D low-expression group (Figure 7C).
Tumor-resident macrophages were previously considered as a major cell population in suppressing the function of cytotoxic T cells and were reported to be associated with poor prognosis of cancer (30). Therefore, we assessed the CD8/CD68 ratio between these two groups. The ratio was higher in all areas in the PLA2G2D high-expression group (Figure 7D).
Positive Correlation Between the Expression of PLA2G2D and ICPs
The expression of immune checkpoint genes [e.g., PDCD1 (PD1), CD274 (PDL1), CTLA4, LAG3, and HAVCR2 (TIM3)] has been utilized in predicting the response of patients to ICB therapy in a variety of cancers including CC. To evaluate the possible relationship between the expression of PLA2G2D and these ICPs, correlation analysis was performed using transcriptomic data from TCGA database. Our analysis indicated that the expression of ICP genes was significantly higher in the PLA2G2D high-expression group compared with that in the PLA2G2D low-expression group. Through Pearson correlation analysis, we found that these common ICP genes were positively correlated with PLA2G2D expression (Figures 8A, C). Similar findings were noted when using the CGCI validation cohort except for CD274, the expression of which was comparable in the PLA2G2D low-expression and high-expression groups and was not correlated with the expression of PLA2G2D. This discrepancy may be attributable to the small sample size in this cohort (Figures 8B, D).
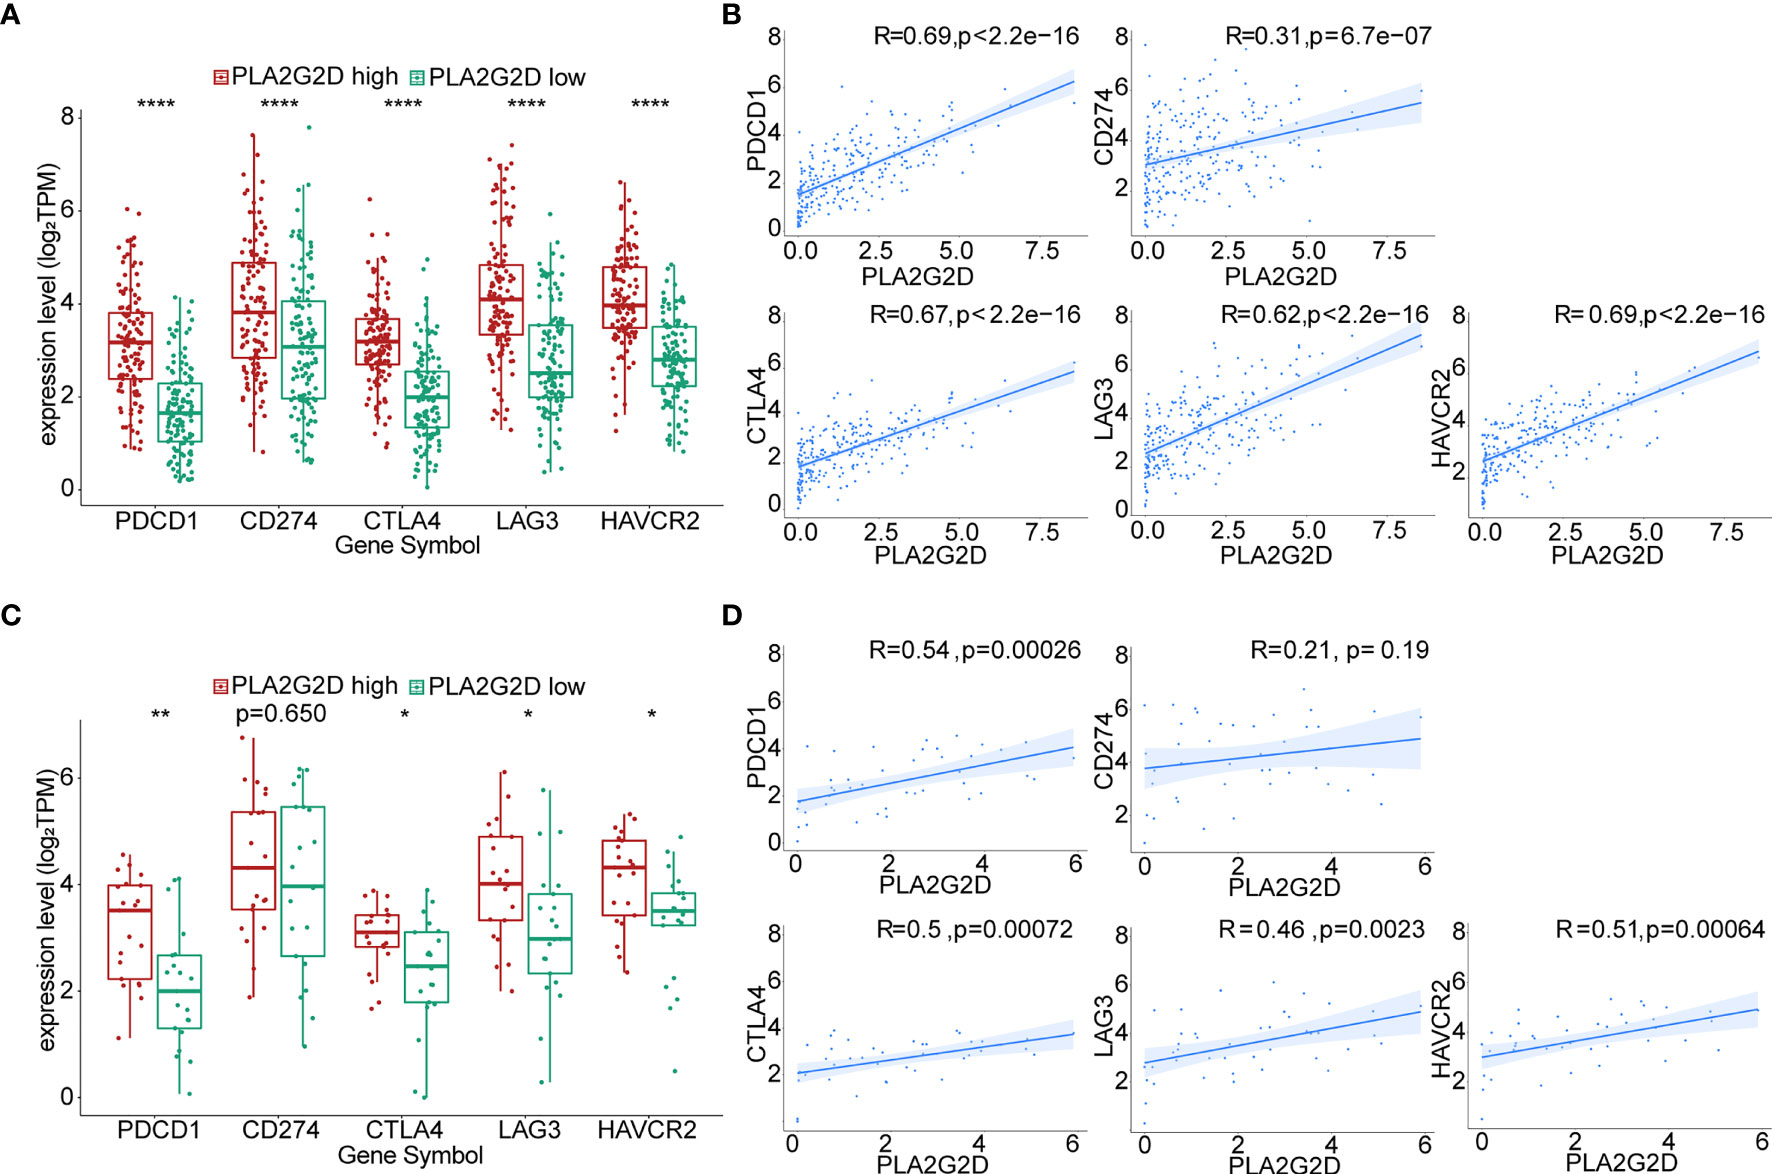
Figure 8 Correlation of the expression level of PLA2G2D and ICPs. Histograms showing the comparison of ICP expression level between PLA2G2D-high and PLA2G2D-low groups in TCGA (A) and CGCI database (C). Pearson correlation analysis for the expression level of PLA2G2D and ICPs in TCGA (B) and CGCI (D) database. *P < 0.05, **P < 0.01, and ****P < 0.0001.
Positive Correlation Between the Expression of PLA2G2D and the Response to ICB Therapy in Immunotherapy Cohorts
ICB therapy has been performed in patients with advanced cervical cancer, but transcriptional data for these cohorts are not accessible. To validate the relationship between PLA2G2D and the response to ICB treatment, we analyzed the transcriptome data from immunotherapy cohorts of melanoma and urothelial carcinoma. In the melanoma anti-PD1 therapy cohort, we selected patients who have not previously received immunotherapy for enrollment analysis and divided them based on PLA2G2D expression at pretreatment stage. The percentage of compete response or partial response (CR/PR) was higher in PLA2G2D-high patients (Figure 9A). PLA2G2D expression level of CR/PR patients also showed a higher tendency compared with stable disease (SD) and progressive disease (PD) patients; however, these differences failed to reach statistical significance (Figure 9B). In this cohort, 9 and 10 pairs of pre- and on-treatment patients were assigned to the PLA2G2D-high and PLA2G2D-low cluster, respectively. Before ICB therapy, PLA2G2D-high patients show higher ICP expression and CYT score (Figures 9C–E). Interestingly, after ICB therapy, PLA2G2D-high patients also have higher ICP expression and CYT score (Figures 9C, F, G). Importantly, compared with pretreatment patients, on-treatment patients have stronger cytotoxicity and higher ICP expression after anti-PD-1 therapy regardless of PLA2G2D-high or PLA2G2D-low groups (Figure 9C). Furthermore, in the urothelial carcinoma anti-PDL1 therapy cohort, the percentage of CR/PR patients was higher in PLA2G2D-high patients, which is similar to that in melanoma immunotherapy cohort (Figure 9H). CR/PR patients showed a higher tendency of PLA2G2D expression level than SD and PD patients (Figure 9I). Unfortunately, only pretreatment transcriptome data are available for this cohort, thus preventing us from performing similar analysis for on-treatment data. Nevertheless, PLA2G2D-high expression was also accompanied by high expression of ICPs despite no statistical significance (Figures 9J, K), while expression level of cytotoxicity markers (GZMA and PRF1) and the CYT score were significantly higher in the PLA2G2D-high group (Figures 9J–L).
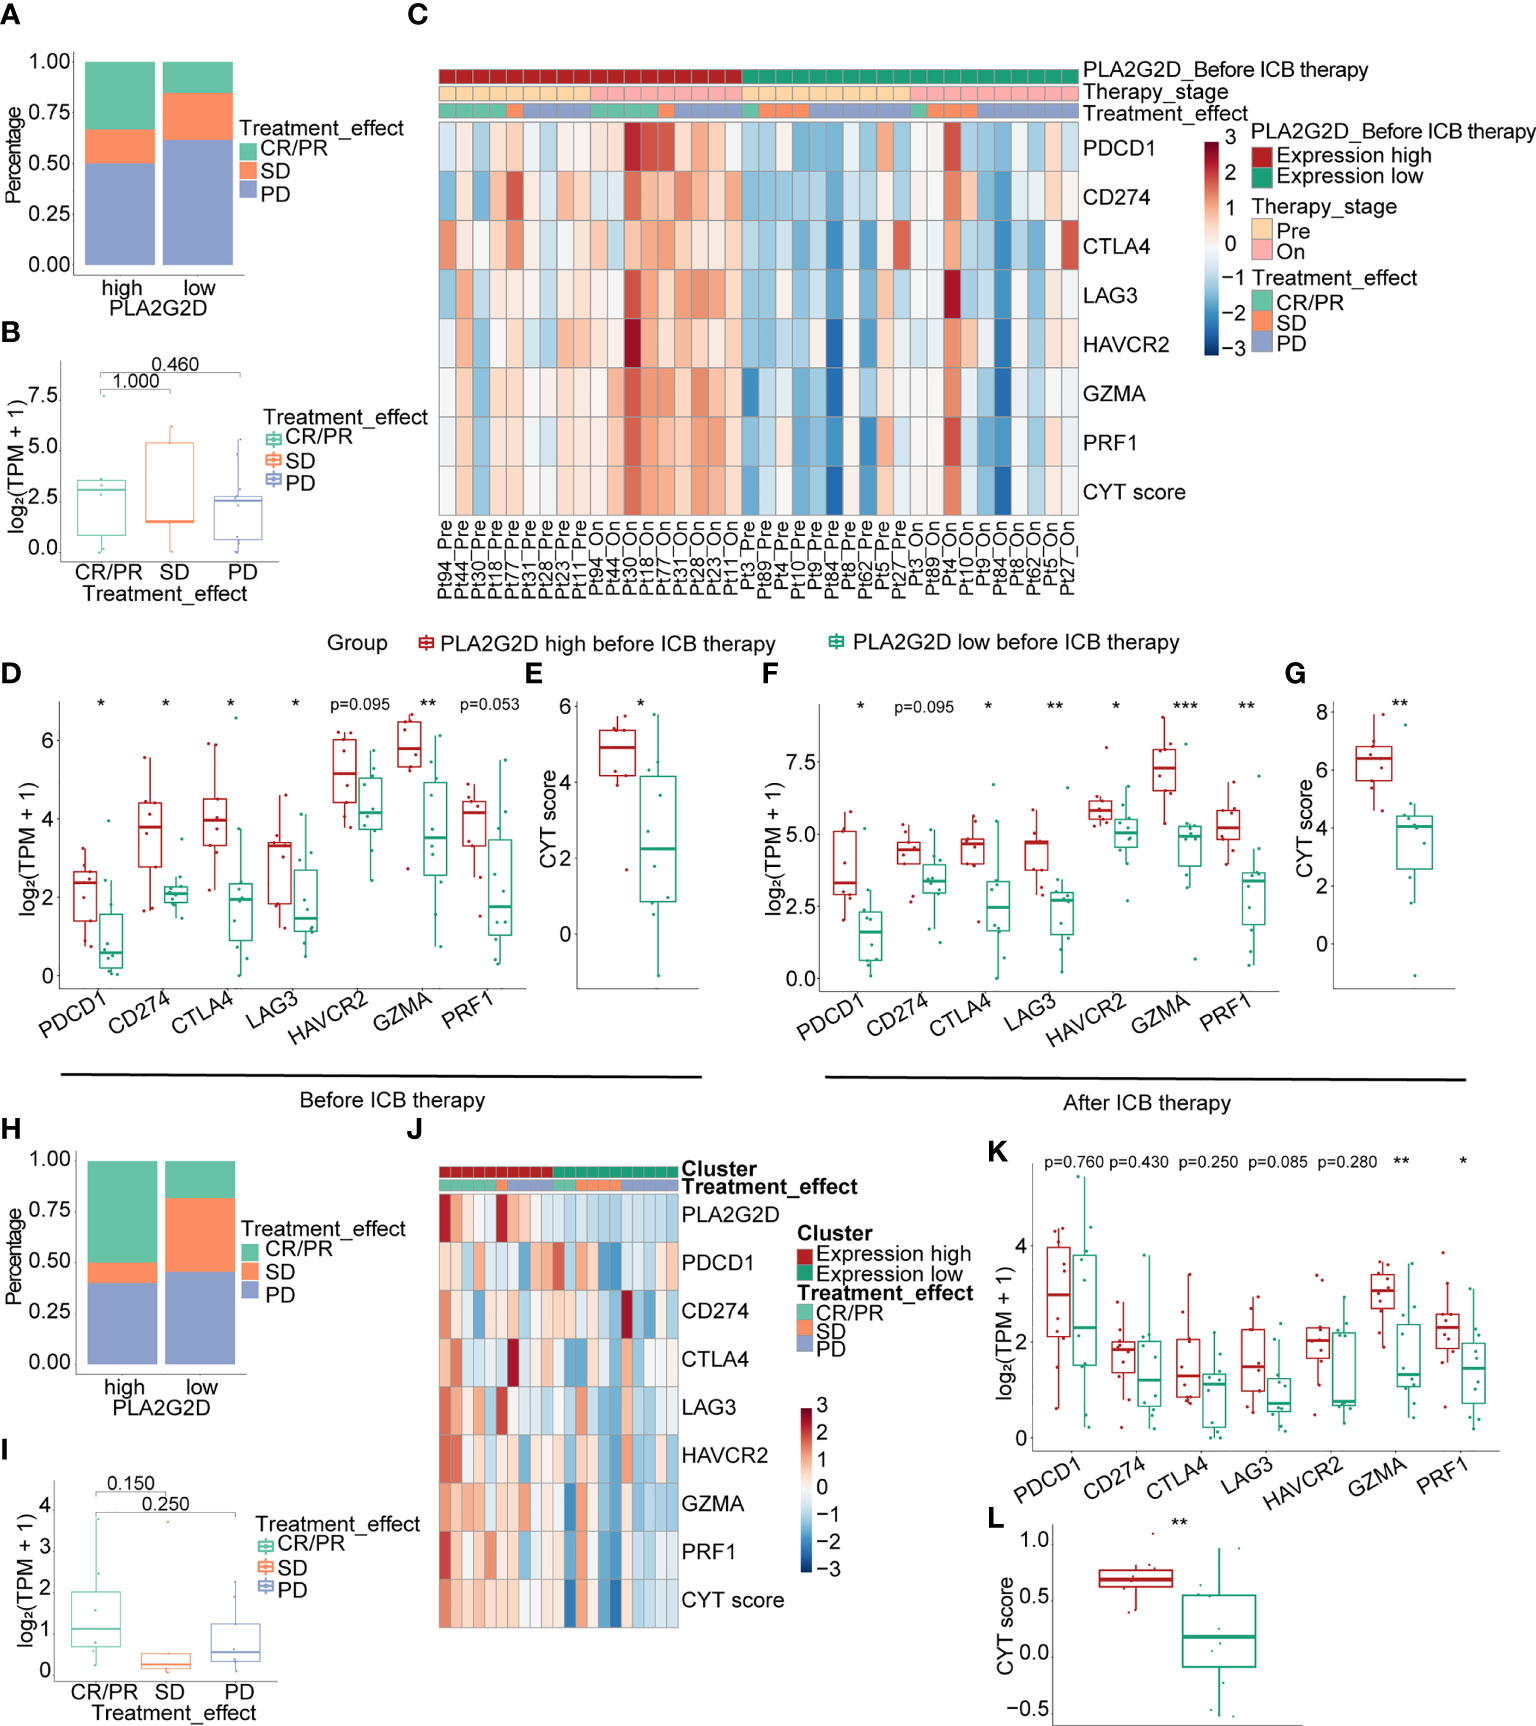
Figure 9 Correlation of the expression level of PLA2G2D and response to ICB treatment in melanoma (A–G) and urothelial carcinoma immunotherapy cohorts (H–L). (A, B) Bar and boxplot for the relationship between PLA2G2D expression and response to ICB treatment in melanoma cohort. (C) Heatmap of the relationship of ICPs, cytotoxic genes, and CYT score with different PLA2G2D expression levels and response to treatment in paired pre- and on-treatment patients. Boxplots showing the differential expression of ICPs, cytotoxic genes, and CYT scores between patients with different PLA2G2D expression levels before ICB therapy (D, E) and after ICB therapy (F, G). (H, I) Bar and boxplot for the relationship between PLA2G2D expression and response to ICB treatment in urothelial carcinoma cohort. (J) Heatmap of the relationship of ICPs, cytotoxic genes, and CYT score with different PLA2G2D expression levels. (K, L) Boxplots showing the differential expression of ICPs, cytotoxic genes, and CYT score between patients with different PLA2G2D expression levels. *P < 0.05, **P < 0.01, and ***P < 0.001.
Discussion
The tumor microenvironment (TME) is a complex milieu that comprises diverse cell populations including malignant cells, immune cells, stromal cells, and other cell types (31). Each cell population can impact others through releasing soluble molecules and/or by direct cell–cell interaction. As a crucial part of the tumor microenvironment, TIME plays a pivotal role in tumorigenesis and the clinical outcomes of cancer patients (32). Accumulating lines of evidence have suggested that a certain type of TIME characterized by more immune cell infiltration is indicative of a better prognosis and a favorable response to ICBs (15, 33). Furthermore, several factors from tumor cells themselves, immune cells, and stromal cells were reported to be implicated in shaping the landscape of TIME (34–36). However, for CSCC, the connection between TIME (especially immune infiltration) and cancer prognosis and the possible underpinning molecular mechanism are far from elucidated. This limitation greatly prevents the identification of new therapeutic targets that can be utilized to improve patient prognosis through transforming the TIME with poor-immune infiltration to high-immune infiltration. Therefore, this study was designed to address this issue. Through bioinformatics analyses, we identified a key immune- and metabolism-associated molecule PLA2G2D that was significantly related to better prognosis of CSCC patients and more immune cell infiltration.
Metabolism-associated molecules are critical components of TIME (37). Metabolic reprograming of tumor cells may promote tumor growth and metastasis directly or indirectly through influencing the functions of a variety of immune cells, especially T cells (38–40), and the shape of TIME. Phospholipase A2 (PLA2) proteins are a group of lipid metabolism-associated molecules that can catalyze the hydrolysis of the sn-2 position of membrane glycerophospholipids to release unsaturated fatty acid and lysophospholipid, thereby playing a pivotal role in multiple biochemical processes including inflammatory response. While both cytosolic and secreted forms of PLA2 have been identified, more than one-third of the PLA2 enzymes belong to the secreted PLA2 (sPLA2) family, which have both pro- and anti-inflammatory functions as a result of the production of diverse lipid mediators (41, 42). As a member of sPLA2, group IID PLA2 (encoded by PLA2G2D), is broadly expressed in human body, such as the spleen, lymph nodes, squamous epithelium, and colorectal cancer tissue (43–45). In the current investigation, PLA2G2D was also found to be expressed in CSCC specimens at the transcriptional level (Figure 5E). Previous studies have also shown that PLA2G2D was preferentially expressed in lymphoid tissue-resident dendritic cells and macrophages and implicated in anti-inflammation response in an array of inflammation-related conditions including contact hypersensitivity (43), viral infection-associated inflammation (46), experimental encephalomyelitis and colitis (47), and contact dermatitis and psoriasis (48). The role of Pla2g2d in cancer has been investigated as well. Using both Pla2g2d-deficient and Pla2g2d-transgenic mouse models, Miki et al. found that Pla2g2d could facilitate the development of chemical-induced skin cancer accompanied by macrophage polarization toward M2 phenotype and decreased number of cytotoxic T cells (48). The cancer-promoting effect of PLA2G2D has also been suggested in human. Recently, PLA2G2D was identified as one of the high-risk genes for colorectal and rectum adenocarcinoma that were negatively correlated with patient survival. However, PLA2G2D expression was also found to be positively correlated with immune infiltration and better prognosis in head and neck squamous cell carcinoma and breast cancer in human (49, 50), which is consistent with our current findings in CSCC. The opposite effects of PLA2G2D in different cancer types may result from the distinct microenvironments and different downstream lipid mediators presented in each cancer type, which in turn result in either an elevated or dampened inflammatory responses, thereby leading to the distinct clinical outcomes reported in these investigations (48).
In this study, the relationship between PLA2G2D overexpression and more immune cell infiltration in CSCC was validated through two approaches. Firstly, another dataset from the CGCI database was used for validation at the transcriptional level. Secondly, mIHC, a multispectral microscopy technique that can reveal the TIME profile on FFPE slides, was applied to determine the major immune cell populations infiltrated in tumor including CD4+ T cells, CD8+ T cells, and macrophages, which were subsequently used to confirm their relationship with PLA2G2D expression. Our results demonstrated that PLA2G2D high-expressed samples had more immune cells infiltrated in the stroma region. More importantly, CD8+ TILs were the only cell population that were more frequently found inside the tumor region in PLA2G2D high-expressed samples, suggesting that PLA2G2D could participate in the recruitment of CD8+ TILs into the cancer nests, either directly or indirectly. The presence of tumor-associated macrophages is often associated with tumorigenesis, immune suppression, and poor prognosis of patients (35, 51). Indeed, macrophages can directly suppress CD8+ T-cell proliferation in vitro (30, 52–54). Therefore, we compared the CD8/CD68 ratio between PLA2G2D-high and PLA2G2D-low samples. Again, a significantly higher ratio of CD8/CD68 was found in PLA2G2D-high samples compared with that in PLA2G2D-low samples. Taken together, these results not only confirmed the aforementioned relationship between immune infiltration and PLA2G2D expression, but also revealed the spatial characteristics of immune infiltration in PLA2G2D-high samples.
The mechanism by which PLA2G2D affects immune infiltration in CSCC is currently unclear, and lipid mediators downstream of PLA2G2D might contribute. For example, the enzyme activity of PLA2G2D could result in the production of leukotriene B4, a potent chemotactic molecule with the capacity to recruit neutrophils, monocytes/macrophages, CD8+ cytotoxic T lymphocyte, and Th17 cells (55). However, molecules other than these lipid mediators may be involved as well. To explore the possible candidates, genes that co-expressed with PLA2G2D were determined by WGCNA analysis, which resulted in the identification of the top 5 genes, namely, SLAMF6, SLAMF1, SH2D1A, TRAT1, and ZNF831. These genes were successfully validated using another dataset from the CGCI database and confirmed by qRT-PCR using fresh-isolated CSCC samples, with the exception of ZNF831, the expression of which was extremely low and no statistical significance was found between PLA2G2D-high and PLA2G2D-low samples. It is noteworthy that these five genes are all associated with immunity. SLAMF1 (CD150) and SLAMF6 belong to the signaling lymphocytic activation molecule (SLAM) family and express on several immune cells including T cells, B cells, and NK cells (56). Previous studies have shown that the expressions of SLAMF1 in cervical cancer and SLAMF6 in liver cancer were closely related to tumor infiltration of immune cells and patient prognosis (57, 58). The SH2D1A gene encodes SH2 domain-containing protein 1A, which is often known as SLAM-associated protein. SLAM can transduce the tyrosine signaling pathway to promote interferon-γ production in the presence of SH2D1A (56, 59). TRAT1 encodes the tripartite motif (TRIM) protein which is essential for T-cell activation and positively correlated with the survival of patients with metastatic melanoma (59). ZNF831 is a transcription factor gene and was also significantly correlated with immune cell infiltration in triple negative breast cancer (60). Together, in light of the role of the aforementioned co-expressed genes in various immune-related pathways, PLA2G2D may interact with these co-expressed genes indirectly or directly, thereby influencing immune cell infiltration.
Immune cell infiltration, along with PDL1 expression and tumor mutation burden (TMB), has been frequently used as independent biomarkers in predicting the response of patients to ICB therapy in multiple cancer types (61). Therefore, the positive correlation between immune cell infiltration and the expression of PLA2G2D in CSCC identified in this study indicates that PLA2G2D expression may also represent another predictive biomarker for ICB in CSCC. In support of this notion, we found that the levels of ICP genes, another independent biomarker for ICB therapy, were markedly higher in the PLA2G2D high-expression group than those in the PLA2G2D low-expression group at the transcriptional level. Furthermore, a positive correlation between the expression of PLA2G2D and ICP genes was noted in both TCGA and CGCI cohorts. Finally, we directly examined the predictive value of PLA2G2D expression for patient response to ICB therapy in melanoma and urothelial carcinoma immunotherapy cohorts, given the lack of transcriptional data in CSCC immunotherapy cohorts. Before ICB therapy, PLA2G2D-high patients have higher ICP expression and CYT score. After ICB therapy, the expression level of ICPs and CYT score were further increased compared with the pretreatment stage, as indicated by paired analysis. Hence, PLA2G2D-high patients have higher cytotoxicity and favorable response to ICB treatment. Taken together, PLA2G2D expression may represent a novel biomarker with a better predictive power for ICB therapy.
In conclusion, through integrating bioinformatics and experimental verification, we demonstrated that the metabolic molecule PLA2G2D was positively correlated with immune infiltration and patient prognosis in CSCC, suggesting that PLA2G2D could be a novel prognosis biomarker for CSCC patients. Furthermore, PLA2G2D might be a promising biomarker for the evaluation of immune infiltration situation across different patients and represent another independent predictive biomarker for ICB therapy in CSCC. However, the underpinning mechanism regarding how PLA2G2D works in TME is unclear and warrants further investigations.
Data Availability Statement
The datasets presented in this study can be found in online repositories. The names of the repository/repositories and accession number(s) can be found in the article/Supplementary Material.
Ethics Statement
The studies involving human participants were reviewed and approved by the Ethical Committee of Tongji Hospital, Tongji Medical College, Huazhong University of Science and Technology (approval number: TJ-IRB2021207). The patients/participants provided their written informed consent to participate in this study.
Author Contributions
HW, YH, HL, and RX conceived and designed the study. HL did bioinformatics analysis and wrote the manuscript. HL and RX did the PCR and mIHC experiments and analyzed the data. CG designed the mIHC panel. HL, CG, TZ, LL, YY, and HZ handled the clinical samples and collected clinical data. HW and YH had supervised this project and contributed to writing and revision of the manuscript. All authors contributed to the article and approved the submitted version.
Funding
This study was supported by grants from the National Natural Science Foundation of China (NSFC No. 81772786, No. 81830074) and the Research Funds from Tongji Hospital (No. 20185BJRC004, No. 2019BJRC008).
Conflict of Interest
The authors declare that the research was conducted in the absence of any commercial or financial relationships that could be construed as a potential conflict of interest.
Publisher’s Note
All claims expressed in this article are solely those of the authors and do not necessarily represent those of their affiliated organizations, or those of the publisher, the editors and the reviewers. Any product that may be evaluated in this article, or claim that may be made by its manufacturer, is not guaranteed or endorsed by the publisher.
Supplementary Material
The Supplementary Material for this article can be found online at: https://www.frontiersin.org/articles/10.3389/fonc.2021.755668/full#supplementary-material
Supplementary Figure 1 | Similarity of MCP-counter, ESTIMATE, EPIC and quanTIseq in characterizing immune infiltrations. Heatmap and boxplot showing the similarity between MCP-counter, EPIC and quanTIseq (A, C). Heatmap and boxplot showing the similarity between ESTIMATE, EPIC and quanTIseq (B, D). Pie plots showing the percentage of several kinds of immune cells based on EPIC (E) and quanTIseq (F) algorithms. *P < 0.05, **P < 0.01, ***P < 0.001, and ****P < 0.0001.
Supplementary Figure 2 | GSEA analysis for RNA-seq data from the CGCI database. (A) Several pathways enriched in PLA2G2D high-expression cluster. (B) Several pathways enriched in PLA2G2D low-expression cluster.
Supplementary Figure 3 | Frequencies of the major cell populations for each sample calculated by mIHC method. Composition of different kind of cells for each sample in all region (A), stromal region (B) and tumor region (C).
References
1. Sung H, Ferlay J, Siegel RL, Laversanne M, Soerjomataram I, Jemal A. Global Cancer Statistics 2020: GLOBOCAN Estimates of Incidence and Mortality Worldwide for 36 Cancers in 185 Countries. CA Cancer J Clin (2021) 71:209–49. doi: 10.3322/caac.21660
2. Cohen PA, Jhingran A, Oaknin A, Denny L. Cervical Cancer. Lancet (2019) 393:169–82. doi: 10.1016/S0140-6736(18)32470-X
3. Hu Z, Zhu D, Wang W, Li W, Jia W, Zeng X, et al. Genome-Wide Profiling of HPV Integration in Cervical Cancer Identifies Clustered Genomic Hot Spots and a Potential Microhomology-Mediated Integration Mechanism. Nat Genet (2015) 47:158–63. doi: 10.1038/ng.3178
4. Van Meir H, Kenter GG, Burggraaf J, Kroep Jr, Welters MJ, Melief CJ, et al. The Need for Improvement of the Treatment of Advanced and Metastatic Cervical Cancer, the Rationale for Combined Chemo-Immunotherapy. Anti-Cancer Agents in Medicinal Chemistry. Anticancer Agents Med Chem (2014) 14:190–203. doi: 10.2174/18715206113136660372
5. National Cancer Institute. Cancer Stat Facts: Cervical Cancer. Cancer Statistics. (2021). Available at https://seer.cancer.gov/statfacts/html/cervix.html [Accessed October 9, 2021]
6. Tewari KS, Sill MW, Long HJ 3rd, Penson RT, Huang H, Ramondetta LM, et al. Improved Survival With Bevacizumab in Advanced Cervical Cancer. N Engl J Med (2014) 370:734–43. doi: 10.1056/NEJMoa1309748
7. Tewari KS, Monk BJ. New Strategies in Advanced Cervical Cancer: From Angiogenesis Blockade to Immunotherapy. Clin Cancer Res (2014) 20:5349–58. doi: 10.1158/1078-0432.CCR-14-1099
8. Nagarsheth NB, Norberg SM, Sinkoe AL, Adhikary S, Meyer TJ, Lack JB, et al. TCR-Engineered T Cells Targeting E7 for Patients With Metastatic HPV-Associated Epithelial Cancers. Nat Med (2021) 27:419–25. doi: 10.1038/s41591-020-01225-1
9. Jazaeri AA, Zsiros E, Amaria RN, Artz AS, Edwards RP, Wenham RM, et al. Safety and Efficacy of Adoptive Cell Transfer Using Autologous Tumor Infiltrating Lymphocytes (LN-145) for Treatment of Recurrent, Metastatic, or Persistent Cervical Carcinoma. J Clin Oncol (2019) 37:2538–8. doi: 10.1200/JCO.2019.37.15_suppl.2538
10. Lheureux S, Butler MO, Clarke B, Cristea MC, Martin LP, Tonkin K, et al. Association of Ipilimumab With Safety and Antitumor Activity in Women With Metastatic or Recurrent Human Papillomavirus-Related Cervical Carcinoma. JAMA Oncol (2018) 4:e173776. doi: 10.1001/jamaoncol.2017.3776
11. Petitprez F, Meylan M, De Reynies A, Sautes-Fridman C, Fridman WH. The Tumor Microenvironment in the Response to Immune Checkpoint Blockade Therapies. Front Immunol (2020) 11:784. doi: 10.3389/fimmu.2020.00784
12. Chung HC, Ros W, Delord JP, Perets R, Italiano A, Shapira-Frommer, et al. Efficacy and Safety of Pembrolizumab in Previously Treated Advanced Cervical Cancer: Results From the Phase II KEYNOTE-158 Study. J Clin Oncol (2019) 37:1470–8. doi: 10.1200/JCO.18.01265
13. Frenel JS, Le Tourneau C, O'neil B, Ott PA, Piha-Paul SA, Gomez-Roca C, et al. Safety and Efficacy of Pembrolizumab in Advanced, Programmed Death Ligand 1-Positive Cervical Cancer: Results From the Phase Ib KEYNOTE-028 Trial. J Clin Oncol (2017) 35:4035–41. doi: 10.1200/JCO.2017.74.5471
14. Tumeh PC, Harview CL, Yearley JH, Shintaku IP, Taylor EJ, Robert L, et al. PD-1 Blockade Induces Responses by Inhibiting Adaptive Immune Resistance. Nature (2014) 515:568–71. doi: 10.1038/nature13954
15. Herbst RS, Soria JC, Kowanetz M, Fine GD, Hamid O, Gordon MS, et al. Predictive Correlates of Response to the Anti-PD-L1 Antibody MPDL3280A in Cancer Patients. Nature (2014) 515:563–7. doi: 10.1038/nature14011
16. Gagliardi A, Porter VL, Zong Z, Bowlby R, Titmuss E, Namirembe C, et al. Analysis of Ugandan Cervical Carcinomas Identifies Human Papillomavirus Clade-Specific Epigenome and Transcriptome Landscapes. Nat Genet (2020) 52:800–10. doi: 10.1038/s41588-020-0673-7
17. Riaz N, Havel JJ, Makarov V, Desrichard A, Urba WJ, Sims JS, et al. Tumor and Microenvironment Evolution During Immunotherapy With Nivolumab. Cell (2017) 171:934–49.e916. doi: 10.1016/j.cell.2017.09.028
18. Snyder A, Nathanson T, Funt SA, Ahuja A, Buros Novik J, Hellmann MD, et al. Contribution of Systemic and Somatic Factors to Clinical Response and Resistance to PD-L1 Blockade in Urothelial Cancer: An Exploratory Multi-Omic Analysis. PLoS Med (2017) 14:e1002309. doi: 10.1371/journal.pmed.1002309
19. Yu G, Wang LG, Han Y, He QY. Clusterprofiler: An R Package for Comparing Biological Themes Among Gene Clusters. OMICS (2012) 16:284–7. doi: 10.1089/omi.2011.0118
20. Becht E, Giraldo NA, Lacroix L, Buttard B, Elarouci N, Petitprez F, et al. Estimating the Population Abundance of Tissue-Infiltrating Immune and Stromal Cell Populations Using Gene Expression. Genome Biol (2016) 17:218. doi: 10.1186/s13059-016-1070-5
21. Yoshihara K, Shahmoradgoli M, Martinez E, Vegesna R, Kim H, Torres-Garcia W, et al. Inferring Tumour Purity and Stromal and Immune Cell Admixture From Expression Data. Nat Commun (2013) 4:2612. doi: 10.1038/ncomms3612
22. Racle J, De Jonge K, Baumgaertner P, Speiser DE, Gfeller D. Simultaneous Enumeration of Cancer and Immune Cell Types From Bulk Tumor Gene Expression Data. Elife (2017) 6:e26476. doi: 10.7554/eLife.26476
23. Finotello F, Mayer C, Plattner C, Laschober G, Rieder D, Hackl H, et al. Molecular and Pharmacological Modulators of the Tumor Immune Contexture Revealed by Deconvolution of RNA-Seq Data. Genome Med (2019) 11:34. doi: 10.1186/s13073-019-0638-6
24. Rooney MS, Shukla SA, Wu CJ, Getz G, Hacohen N. Molecular and Genetic Properties of Tumors Associated With Local Immune Cytolytic Activity. Cell (2015) 160:48–61. doi: 10.1016/j.cell.2014.12.033
25. Langfelder P, Horvath S. WGCNA: An R Package for Weighted Correlation Network Analysis. BMC Bioinf (2008) 9:559. doi: 10.1186/1471-2105-9-559
26. Shannon P, Markiel A, Ozier O, Baliga NS, Wang JT, Ramage D, et al. Cytoscape: A Software Environment for Integrated Models of Biomolecular Interaction Networks. Genome Res (2003) 13:2498–504. doi: 10.1101/gr.1239303
27. Love MI, Huber W, Anders S. Moderated Estimation of Fold Change and Dispersion for RNA-Seq Data With Deseq2. Genome Biol (2014) 15:550. doi: 10.1186/s13059-014-0550-8
28. Zou R, Gu R, Yu X, Hu Y, Yu J, Xue X, et al. Characteristics of Infiltrating Immune Cells and a Predictive Immune Model for Cervical Cancer. J Cancer (2021) 12:3501–14. doi: 10.7150/jca.55970
29. Wang J, Li Z, Gao A, Wen Q, Sun Y. The Prognostic Landscape of Tumor-Infiltrating Immune Cells in Cervical Cancer. BioMed Pharmacother (2019) 120:109444. doi: 10.1016/j.biopha.2019.109444
30. Ruffell B, Coussens LM. Macrophages and Therapeutic Resistance in Cancer. Cancer Cell (2015) 27:462–72. doi: 10.1016/j.ccell.2015.02.015
31. Lei X, Lei Y, Li JK, Du WX, Li RG, Yang J, et al. Immune Cells Within the Tumor Microenvironment: Biological Functions and Roles in Cancer Immunotherapy. Cancer Lett (2020) 470:126–33. doi: 10.1016/j.canlet.2019.11.009
32. Su D, Wu G, Xiong R, Sun X, Xu M, Mei Y, et al. Tumor Immune Microenvironment Characteristics and Their Prognostic Value in Non-Small-Cell Lung Cancer. Front Oncol (2021) 11:634059. doi: 10.3389/fonc.2021.634059
33. Binnewies M, Roberts EW, Kersten K, Chan V, Fearon DF, Merad M, et al. Understanding the Tumor Immune Microenvironment (TIME) for Effective Therapy. Nat Med (2018) 24:541–50. doi: 10.1038/s41591-018-0014-x
34. Li J, Byrne KT, Yan F, Yamazoe T, Chen Z, Baslan T, et al. Tumor Cell-Intrinsic Factors Underlie Heterogeneity of Immune Cell Infiltration and Response to Immunotherapy. Immunity (2018) 49:178–93.e177. doi: 10.1016/j.immuni.2018.06.006
35. Denardo DG, Ruffell B. Macrophages as Regulators of Tumour Immunity and Immunotherapy. Nat Rev Immunol (2019) 19:369–82. doi: 10.1038/s41577-019-0127-6
36. Khalili JS, Liu S, Rodriguez-Cruz TG, Whittington M, Wardell S, Liu C, et al. Oncogenic BRAF(V600E) Promotes Stromal Cell-Mediated Immunosuppression via Induction of Interleukin-1 in Melanoma. Clin Cancer Res (2012) 18:5329–40. doi: 10.1158/1078-0432.CCR-12-1632
37. Cassim S, Pouyssegur J. Tumor Microenvironment: A Metabolic Player That Shapes the Immune Response. Int J Mol Sci (2019) 21:157. doi: 10.3390/ijms21010157
38. Kolb D, Kolishetti N, Surnar B, Sarkar S, Guin S, Shah AS, et al. Metabolic Modulation of the Tumor Microenvironment Leads to Multiple Checkpoint Inhibition and Immune Cell Infiltration. ACS Nano (2020) 14:11055–66. doi: 10.1021/acsnano.9b10037
39. Leone RD, Zhao L, Englert JM, Sun IM, Oh MH, Sun IH, et al. Glutamine Blockade Induces Divergent Metabolic Programs to Overcome Tumor Immune Evasion. Science (2019) 366:1013–21. doi: 10.1126/science.aav2588
40. Kishton RJ, Sukumar M, Restifo NP. Metabolic Regulation of T Cell Longevity and Function in Tumor Immunotherapy. Cell Metab (2017) 26:94–109. doi: 10.1016/j.cmet.2017.06.016
41. Lindbom J, Ljungman AG, Lindahl M, Tagesson C. Increased Gene Expression of Novel Cytosolic and Secretory Phospholipase A(2) Types in Human Airway Epithelial Cells Induced by Tumor Necrosis Factor-Alpha and IFN-Gamma. J Interferon Cytokine Res (2002) 22:947–55. doi: 10.1089/10799900260286650
42. Lambeau G, Lazdunski M. Receptors for a Growing Family of Secreted Phospholipases A2. Trends Pharmacol Sci (1999) 20:162–70. doi: 10.1016/S0165-6147(99)01300-0
43. Miki Y, Yamamoto K, Taketomi Y, Sato H, Shimo K, Kobayashi T, et al. Lymphoid Tissue Phospholipase A2 Group IID Resolves Contact Hypersensitivity by Driving Antiinflammatory Lipid Mediators. J Exp Med (2013) 210:1217–34. doi: 10.1084/jem.20121887
44. Mounier CM, Wendum D, Greenspan E, Flejou JF, Rosenberg DW, Lambeau G. Distinct Expression Pattern of the Full Set of Secreted Phospholipases A2 in Human Colorectal Adenocarcinomas: Spla2-III as a Biomarker Candidate. Br J Cancer (2008) 98:587–95. doi: 10.1038/sj.bjc.6604184
45. Haas U, Podda M, Behne M, Gurrieri S, Alonso A, Fürstenberger G, et al. Characterization and Differentiation-Dependent Regulation of Secreted Phospholipases A2 in Human Keratinocytes and in Healthy and Psoriatic Human Skin. J Invest Dermatol (2005) 124:204–11. doi: 10.1111/j.0022-202X.2004.23513.x
46. Vijay R, Hua X, Meyerholz DK, Miki Y, Yamamoto K, Gelb M, et al. Critical Role of Phospholipase A2 Group IID in Age-Related Susceptibility to Severe Acute Respiratory Syndrome-CoV Infection. J Exp Med (2015) 212:1851–68. doi: 10.1084/jem.20150632
47. Von Allmen CE, Schmitz N, Bauer M, Hinton HJ, Kurrer MO, Buser RB, et al. Secretory Phospholipase A2-IID Is an Effector Molecule of CD4+CD25+ Regulatory T Cells. Proc Natl Acad Sci USA (2009) 106:11673–8. doi: 10.1073/pnas.0812569106
48. Miki Y, Kidoguchi Y, Sato M, Taketomi Y, Taya C, Muramatsu K, et al. Dual Roles of Group IID Phospholipase A2 in Inflammation and Cancer. J Biol Chem (2016) 291:15588–601. doi: 10.1074/jbc.M116.734624
49. Ye Z, Zou S, Niu Z, Xu Z, Hu Y. A Novel Risk Model Based on Lipid Metabolism-Associated Genes Predicts Prognosis and Indicates Immune Microenvironment in Breast Cancer. Front Cell Dev Biol (2021) 9:691676. doi: 10.3389/fcell.2021.691676
50. Xiong Y, Si Y, Feng Y, Zhuo S, Cui B, Zhang Z. Prognostic Value of Lipid Metabolism-Related Genes in Head and Neck Squamous Cell Carcinoma. Immun Inflamm Dis (2021) 9:196–209. doi: 10.1002/iid3.379
51. Mantovani A, Marchesi F, Malesci A, Laghi L, Allavena P. Tumour-Associated Macrophages as Treatment Targets in Oncology. Nat Rev Clin Oncol (2017) 14:399–416. doi: 10.1038/nrclinonc.2016.217
52. Doedens AL, Stockmann C, Rubinstein MP, Liao D, Zhang N, Denardo DG, et al. Macrophage Expression of Hypoxia-Inducible Factor-1 Alpha Suppresses T-Cell Function and Promotes Tumor Progression. Cancer Res (2010) 70:7465–75. doi: 10.1158/0008-5472.CAN-10-1439
53. Denardo DG, Brennan DJ, Rexhepaj E, Ruffell B, Shiao SL, Madden SF, et al. Leukocyte Complexity Predicts Breast Cancer Survival and Functionally Regulates Response to Chemotherapy. Cancer Discov (2011) 1:54–67. doi: 10.1158/2159-8274.CD-10-0028
54. Ruffell B, Chang-Strachan D, Chan V, Rosenbusch A, Ho CM, Pryer N, et al. Macrophage IL-10 Blocks CD8+ T Cell-Dependent Responses to Chemotherapy by Suppressing IL-12 Expression in Intratumoral Dendritic Cells. Cancer Cell (2014) 26:623–37. doi: 10.1016/j.ccell.2014.09.006
55. Jiang X, Nicolls MR, Tian W, Rockson SG. Lymphatic Dysfunction, Leukotrienes, and Lymphedema. Annu Rev Physiol (2018) 80:49–70. doi: 10.1146/annurev-physiol-022516-034008
56. Veillette A, Latour S. The SLAM Family of Immune-Cell Receptors. Curr Opin Immunol (2003) 15:277–85. doi: 10.1016/S0952-7915(03)00041-4
57. Chen Q, Qiu B, Zeng X, Hu L, Huang D, Chen K, et al. Identification of a Tumor Microenvironment-Related Gene Signature to Improve the Prediction of Cervical Cancer Prognosis. Cancer Cell Int (2021) 21:182. doi: 10.1186/s12935-021-01867-2
58. Liu X, Niu X, Qiu Z. A Five-Gene Signature Based on Stromal/Immune Scores in the Tumor Microenvironment and Its Clinical Implications for Liver Cancer. DNA Cell Biol (2020) 39:1621–38. doi: 10.1089/dna.2020.5512
59. Bogunovic D, O'neill DW, Belitskaya-Levy I, Vacic V, Yu YL, Adams S, et al. Immune Profile and Mitotic Index of Metastatic Melanoma Lesions Enhance Clinical Staging in Predicting Patient Survival. Proc Natl Acad Sci U S A (2009) 106:20429–34. doi: 10.1073/pnas.0905139106
60. He Y, Jiang Z, Chen C, Wang X. Classification of Triple-Negative Breast Cancers Based on Immunogenomic Profiling. J Exp Clin Cancer Res (2018) 37:327. doi: 10.1186/s13046-018-1002-1
Keywords: cervical squamous cell carcinoma, PLA2G2D, tumor immune microenvironment, immune infiltration, metabolism, multiplex immunohistochemistry
Citation: Liu H, Xu R, Gao C, Zhu T, Liu L, Yang Y, Zeng H, Huang Y and Wang H (2021) Metabolic Molecule PLA2G2D Is a Potential Prognostic Biomarker Correlating With Immune Cell Infiltration and the Expression of Immune Checkpoint Genes in Cervical Squamous Cell Carcinoma. Front. Oncol. 11:755668. doi: 10.3389/fonc.2021.755668
Received: 09 August 2021; Accepted: 24 September 2021;
Published: 18 October 2021.
Edited by:
Yapeng Su, Fred Hutchinson Cancer Research Center, United StatesReviewed by:
Haitang Yang, Shanghai Jiaotong University, ChinaJinhui Liu, Nanjing Medical University, China
Copyright © 2021 Liu, Xu, Gao, Zhu, Liu, Yang, Zeng, Huang and Wang. This is an open-access article distributed under the terms of the Creative Commons Attribution License (CC BY). The use, distribution or reproduction in other forums is permitted, provided the original author(s) and the copyright owner(s) are credited and that the original publication in this journal is cited, in accordance with accepted academic practice. No use, distribution or reproduction is permitted which does not comply with these terms.
*Correspondence: Hui Wang, d2FuZzcxaHVpQGFsaXl1bi5jb20=; Yafei Huang, aHVhbmd5MjAxOEBodXN0LmVkdS5jbg==
†These authors have contributed equally to this work