 Weiyu Dai1
 Jing Wang2
 Zhi Wang1
 Yizhi Xiao1
 Jiaying Li1
 Linjie Hong1
 Miaomiao Pei1
 Jieming Zhang1
 Ping Yang1
 Xiaosheng Wu1
 Weimei Tang1
 Xiaoling Jiang1
 Ping Jiang1
 Li Xiang3
 Aimin Li1*
 Jianjiao Lin3*
 Side Liu1,3*
 Jide Wang1,3*
- 1Guangdong Provincial Key Laboratory of Gastroenterology, Department of Gastroenterology, Nanfang Hospital, Southern Medical University, Guangzhou, China
- 2Department of Pathology, School of Basic Medical Sciences, Southern Medical University, Guangzhou, China
- 3Department of Gastroenterology, Longgang District People’s Hospital, Shenzhen, China
Background: Accumulating studies have demonstrated the abnormal expressions and prognostic values of certain members of the tripartite motif (TRIM) family in diverse cancers. However, comprehensive prognostic values of the TRIM family in hepatocellular carcinoma (HCC) are yet to be clearly defined.
Methods: The prognostic values of the TRIM family were evaluated by survival analysis and univariate Cox regression analysis based on gene expression data and clinical data of HCC from The Cancer Genome Atlas (TCGA) and Gene Expression Omnibus (GEO) databases. The expression profiles, protein–protein interaction among the TRIM family, prediction of transcription factors (TFs) or miRNAs, genetic alterations, correlations with the hallmarks of cancer and immune infiltrates, and pathway enrichment analysis were explored by multiple public databases. Further, a TRIM family gene-based signature for predicting overall survival (OS) in HCC was built by using the least absolute shrinkage and selection operator (LASSO) regression. TCGA–Liver Hepatocellular Carcinoma (LIHC) cohort was used as the training set, and GSE76427 was used for external validation. Time-dependent receiver operating characteristic (ROC) and survival analysis were used to estimate the signature. Finally, a nomogram combining the TRIM family risk score and clinical parameters was established.
Results: High expressions of TRIM family members including TRIM3, TRIM5, MID1, TRIM21, TRIM27, TRIM32, TRIM44, TRIM47, and TRIM72 were significantly associated with HCC patients’ poor OS. A novel TRIM family gene-based signature (including TRIM5, MID1, TRIM21, TRIM32, TRIM44, and TRIM47) was built for OS prediction in HCC. ROC curves suggested the signature’s good performance in OS prediction. HCC patients in the high-risk group had poorer OS than the low-risk patients based on the signature. A nomogram integrating the TRIM family risk score, age, and TNM stage was established. The ROC curves suggested that the signature presented better discrimination than the similar model without the TRIM family risk score.
Conclusion: Our study identified the potential application values of the TRIM family for outcome prediction in HCC.
Introduction
Liver cancer is ranked as the sixth most common malignancy and is the fourth leading cause of cancer-related deaths with an estimated 841,000 new cases and 782,000 deaths occurring worldwide in 2018 (1). Hepatocellular carcinoma (HCC), the major histological type of liver cancer, is related to well-known risk factors, including hepatitis virus (B and C) infections, aflatoxin B1 exposure, alcohol abuse, and smoking, etc (2). Regretfully, less than 40% of HCC patients are eligible for surgery because of advanced stages of HCC at the time of diagnosis (3). Moreover, though the selected HCC patients have received surgical resection, their prognoses remain unsatisfactory due to the high incidence of recurrence (4, 5). Predicting the prognosis accurately may be of use for choosing effective personalized treatment, hence prolonging the survival time for patients with HCC. Therefore, identification of novel biomarkers for outcome prediction is of great importance for HCC.
The tripartite motif (TRIM) family proteins, also named RBBC proteins, are defined by the presence of the TRIM composed of a RING domain, one or two B-box motifs, and a coiled-coil region (6, 7). Most of them process E3 ubiquitin ligase activities because of a RING domain at the N-terminus (8). Accumulating studies have suggested that the TRIM family proteins play important roles in cell proliferation (9, 10), migration and invasion (9–11), metabolism (12), autophagy, immunity, and carcinogenesis (13), etc. A study in prostate cancer showed that collaborating with the AR signaling, TRIM24 could act as a transcriptional activator of genes involved in the progression of the cell cycle (14). It was indicated that AMP-activated protein kinase (AMPK) could be suppressed through its ubiquitination and degradation by the MAGE-A3/6-TRIM28 ubiquitin ligase complex (15). TRIM29 could serve as a scaffold protein for assembling DNA repair proteins into chromatin for efficient DDR activation (16). TRIM32 might target GLUT1 and HKII to mediate the metabolism of glycolysis in gastric cancer cells (12). What is more, the abnormal expressions of many TRIM family proteins have been reported to be a prognostic factor in cancer (17–21). In HCC, Liu et al. found that TRIM25 could directly target Keap1 and promote its ubiquitination and degradation, activating Nrf2 and bolstering antioxidant defense and cell survival (22). A study reported that by directly binding with SNAIL and inducing its K-48 linked poly-ubiquitous degradation, TRIM50 could reverse SNAIL-mediated epithelial-to-mesenchymal transition (EMT) (23) in HCC. It has been demonstrated that the TIF1-related subfamily of TRIM proteins could interact to create regulatory complexes and mediate HCC in mice (24). These studies suggested the important roles of TRIM family proteins in HCC progression. However, the potential application values of the TRIM family for outcome prediction in HCC remain poorly investigated.
In this study, investigations of survival analysis, expression profiles, correlation analysis between the TRIM family and hallmarks of cancer, etc., were performed based on the gene expression and clinical data of HCC from The Cancer Genome Atlas (TCGA) and Gene Expression Omnibus (GEO). Then, a risk score model was constructed by using the least absolute shrinkage and selection operator (LASSO) regression with moderate accuracy. Finally, to improve the predictive value of the TRIM family for HCC patients, a nomogram was built by integrating clinical parameters and the risk score.
Materials and Methods
Data Acquisition
The RNA-Seq and clinical information of TCGA–Liver Hepatocellular Carcinoma (LIHC) cohort, which included 50 normal control samples and 374 HCC samples, were downloaded from the Genomic Data Commons Data Portal (GDC; https://portal.gdc.cancer.gov/). The workflow type of transcriptome profiling of TCGA-LIHC was “HTSeq-FPKM”, and the format of the clinical data was “bcr xml”. The gene expression and clinical data of GSE76427 were obtained from GEO (https://www.ncbi.nlm.nih.gov/geo/) for external validation, including 52 normal liver tissue samples and 115 HCC samples (25). GSE76427 was performed on the GPL10558 platform (Illumina HumanHT-12 V4.0 expression beadchip). The gene list of the TRIM family was derived from HUGO Gene Nomenclature Committee (HGNC) database (https://www.genenames.org/). All the data were downloaded in April 2020.
Univariate Cox Regression Analysis and Survival Analysis
Univariate Cox regression was applied to investigate the prognostic value of reported HCC prognostic biomarkers and the TRIM family members in HCC by using the R package “survival” (26, 27). The Kaplan–Meier curve with a two-sided log-rank test was analyzed to evaluate whether the TRIM family members or the signature was associated with the outcome of patients with HCC. X-tile was used to investigate the optimal cutoff value for survival analysis (28).
Analysis of the Expression of the TRIM Family
The expression profiles of the TRIM family were presented by using the R package “pheatmap” (29). The expressions of the TRIM family members between tumor and normal samples from TCGA and GEO cohorts were shown by boxplots. The correlations among the TRIM family or the correlations between the TRIM family and several molecular markers relevant to the hallmarks of cancer were plotted with the R package “corrplot” (30), and they were analyzed by Spearman’s test.
Cell Culture
Human HCC cell lines HepG2, Huh7, Hep3B, and SK-Hep-1 were purchased from Procell (Wuhan, China). MHCC97-H was acquired from GuangZhou Jennio Biotech Co., Ltd. (Guangzhou, China). A human normal hepatocyte line MIHA was purchased from Shanghai Honsun Biological Technology Co., Ltd. (Shanghai, China). Human HCC cell lines HepG2, Huh7, MHCC97H, Hep3B, and SK-Hep-1 and human normal hepatocyte cell line MIHA were cultured using Dulbecco’s modified Eagle’s medium (DMEM; Gibco, Carlsbad, CA, USA) supplemented with 10% fetal bovine serum (FBS; Gibco, Carlsbad, CA, USA) at 37°C in 5% CO2.
Patients and Tissue Samples
The liver tissue samples including 38 HCC samples and paired adjacent normal tissue samples were obtained from HCC patients receiving surgical resection in Nanfang Hospital, Southern Medical University (Guangzhou, China). None of the patients underwent chemotherapy, radiotherapy, or immunotherapy before surgery. The experiments conducted in this study were approved by the Medical Ethics Committee of Nanfang Hospital, Southern Medical University.
RNA Isolation and Quantitative Real-Time PCR
Total RNAs from cultured cells, HCC samples, and adjacent normal liver tissue samples were extracted using TRIzol reagent (Invitrogen, Carlsbad, CA, USA). To detect the mRNA expression, a qRT-PCR assay was carried out using the PrimeScript RT Reagent Kit (Takara Bio, Inc., Shiga, Japan) and SYBR Premix Ex Taq (Takara Bio, Inc., Shiga, Japan) according to the manufacturer’s instructions. GAPDH was chosen as the endogenous control. The final data were calculated using the 2−ΔΔCt method. The primer sequences are listed in Supplementary Table 1.
Public Database Mining
Expressions of the TRIM family members in both HCC and normal liver tissue at the protein level were retrieved from the Human Protein Atlas (https://www.proteinatlas.org/) (31, 32). The co-expressed genes of the TRIM family members with Spearman’s correlation ≥0.3 or <−0.3 were retrieved from the cBioportal database (33), and they were annotated by the Kyoto Encyclopedia of Genes and Genomes (KEGG) pathway. The KEGG (34) enrichment analysis was conducted with the package “clusterProfiler” (35) and visualized with package “enrichplot” (36) in R. The enrichment results with p-value <0.05 and q-value <0.05 were considered statistically significant. The cBioPortal database was used to explore the genetic alterations of the TRIM family members. Protein–protein interaction of the TRIM family members was analyzed by STRING database (minimum required interaction score = 0.150, https://string-db.org/) (37). NetworkAnalyst (https://www.networkanalyst.ca/) (38) was applied to predict the potential transcription factors (TFs) and miRNAs of the TRIM family members, and the results were presented by using Cytoscape 3.7.0 (39). The potential TFs were retrieved from the ENCODE database (40) via the NetworkAnalyst platform, while the predictions of miRNAs were based on the TarBase database (41). The correlations between TRIM family and immune infiltrates including B cells, CD8+ T cells, CD4+ T cells, macrophages, neutrophils, and dendritic cells were analyzed via the TIMER (Tumor IMmune Estimation Resource, https://cistrome.shinyapps.io/timer/) platform (42), shown by the purity-corrected partial Spearman method.
Construction of the TRIM Family Gene-Based Signature
The LASSO regression was applied to construct the prognostic with the R package “glmnet” (43) based on lambda.min. The optimal tuning parameter (lambda) was determined through tenfold cross-validations. To calculate the risk score, the expression of each gene in the signature was multiplied by its regression coefficient, and then these values were summed. Survival analysis was applied to assess the predictive value of the signature. Time-dependent receiver operating characteristic (ROC) curve was performed to calculate the area under the curve (AUC) for 1-, 3-, or 5-year overall survival (OS) and to evaluate the discrimination of the signature by using the R package “survivalROC” (44). Univariate and multivariate Cox regression analyses were performed by using the R package “survival” to investigate whether the risk score was an independent OS predictor for patients with HCC.
Correlation Between the Signature and Clinical Factors
To confirm the predictive value of the signature, patients were stratified into different subgroups according to age, gender, TNM stage, T stage, N stage, M stage, or BCLC stage; and survival analysis was performed in each subgroup. Boxplots were applied to present the risk score in different subgroups. The chi-square test or Fisher’s exact test was used to analyze the relationship between the risk score levels and clinical parameters.
Gene Set Enrichment Analysis
Differences of KEGG pathways between high- and low-risk groups stratified based on the signature were analyzed by using GESA (v4.0.3, https://www.gsea-msigdb.org/gsea/index.jsp) (45). Enrichment results with a p-value <0.05 and a false discovery rate (FDR) <0.25 after performing 1,000 permutations were considered statistically significant. c2.cp.kegg.v7.0.symbols.gmt was selected as the reference set for calculating Enrichment Score (ES). The results were plotted with R package “ggplot2” (46).
Establishment of the Nomogram
Combining the risk score and some clinical factors, a nomogram was built by using the R package “rms” (47). C-index, time-dependent ROC curve, and calibration curve were applied to evaluate the discrimination and calibration of the nomogram. The calibration curve was performed to observe whether the predicted survival outcome was close to the actual outcome by a bootstrap method with 1,000 resamples.
Statistical Analysis
All statistical analyses were conducted with R software version 3.6.0 (The R Foundation for Statistical Computing, Vienna, Austria), IBM SPSS Statistics 23 (SPSS, Inc., Chicago, IL, USA), and GraphPad Prism software version 7.0 (GraphPad Software Inc. USA). The statistical significance of boxplots was analyzed by the Mann–Whitney U test. The differences in group comparisons from qRT-PCR results were assessed using a two-tailed Student’s t-test or one-way ANOVA. The qRT-PCR results were shown as mean ± SD. A p-value <0.05 was considered statistically significant.
Results
The Prognostic Values and Expression Profiles of the TRIM Family
Our study was conducted as illustrated in Figure 1A. A total of 343 patients in TCGA-LIHC and 95 patients in GSE76427 with survival time of no less than 30 days were included for survival analysis. All genes in the TRIM family were subjected to the analysis, and then nine genes including TRIM3, TRIM5, MID1, TRIM21, TRIM27, TRIM32, TRIM44, TRIM47, and TRIM72 were identified as genes that might be associated with HCC patients’ OS in both TCGA-LIHC and GSE76427 (p < 0.05, Figures 1B, C). Moreover, we applied univariate Cox regression analyses to explore prognostic values of five reported HCC prognostic biomarkers and nine TRIM family members in HCC (Supplementary Figures 1A, B and Figures 2A, B) (48–52). The results showed that five recognized prognostic biomarkers (PDCD10, TFAP4, LYRM4, VPS35, and PPM1D) were prognosis-associated in TCGA-LIHC, and VPS35 was related to prognosis in both TCGA-LIHC and GSE76427 with an HR > 1 (p < 0.05). Six genes (TRIM5, MID1, TRIM21, TRIM32, TRIM44, and TRIM47) were prognosis-associated in TCGA-LIHC, while only one gene (TRIM72) was relevant to prognosis in GSE76427 with an HR > 1 among the nine TRIM family members (p < 0.05), which was similar to results of the five reported HCC prognostic biomarkers. The expression profiles of the nine TRIM family members in TCGA-LIHC and GSE76427 are shown in Figures 2C, D. The correlations among the nine TRIM family members in TCGA-LIHC and GSE76427 are presented in Figures 2E, F.
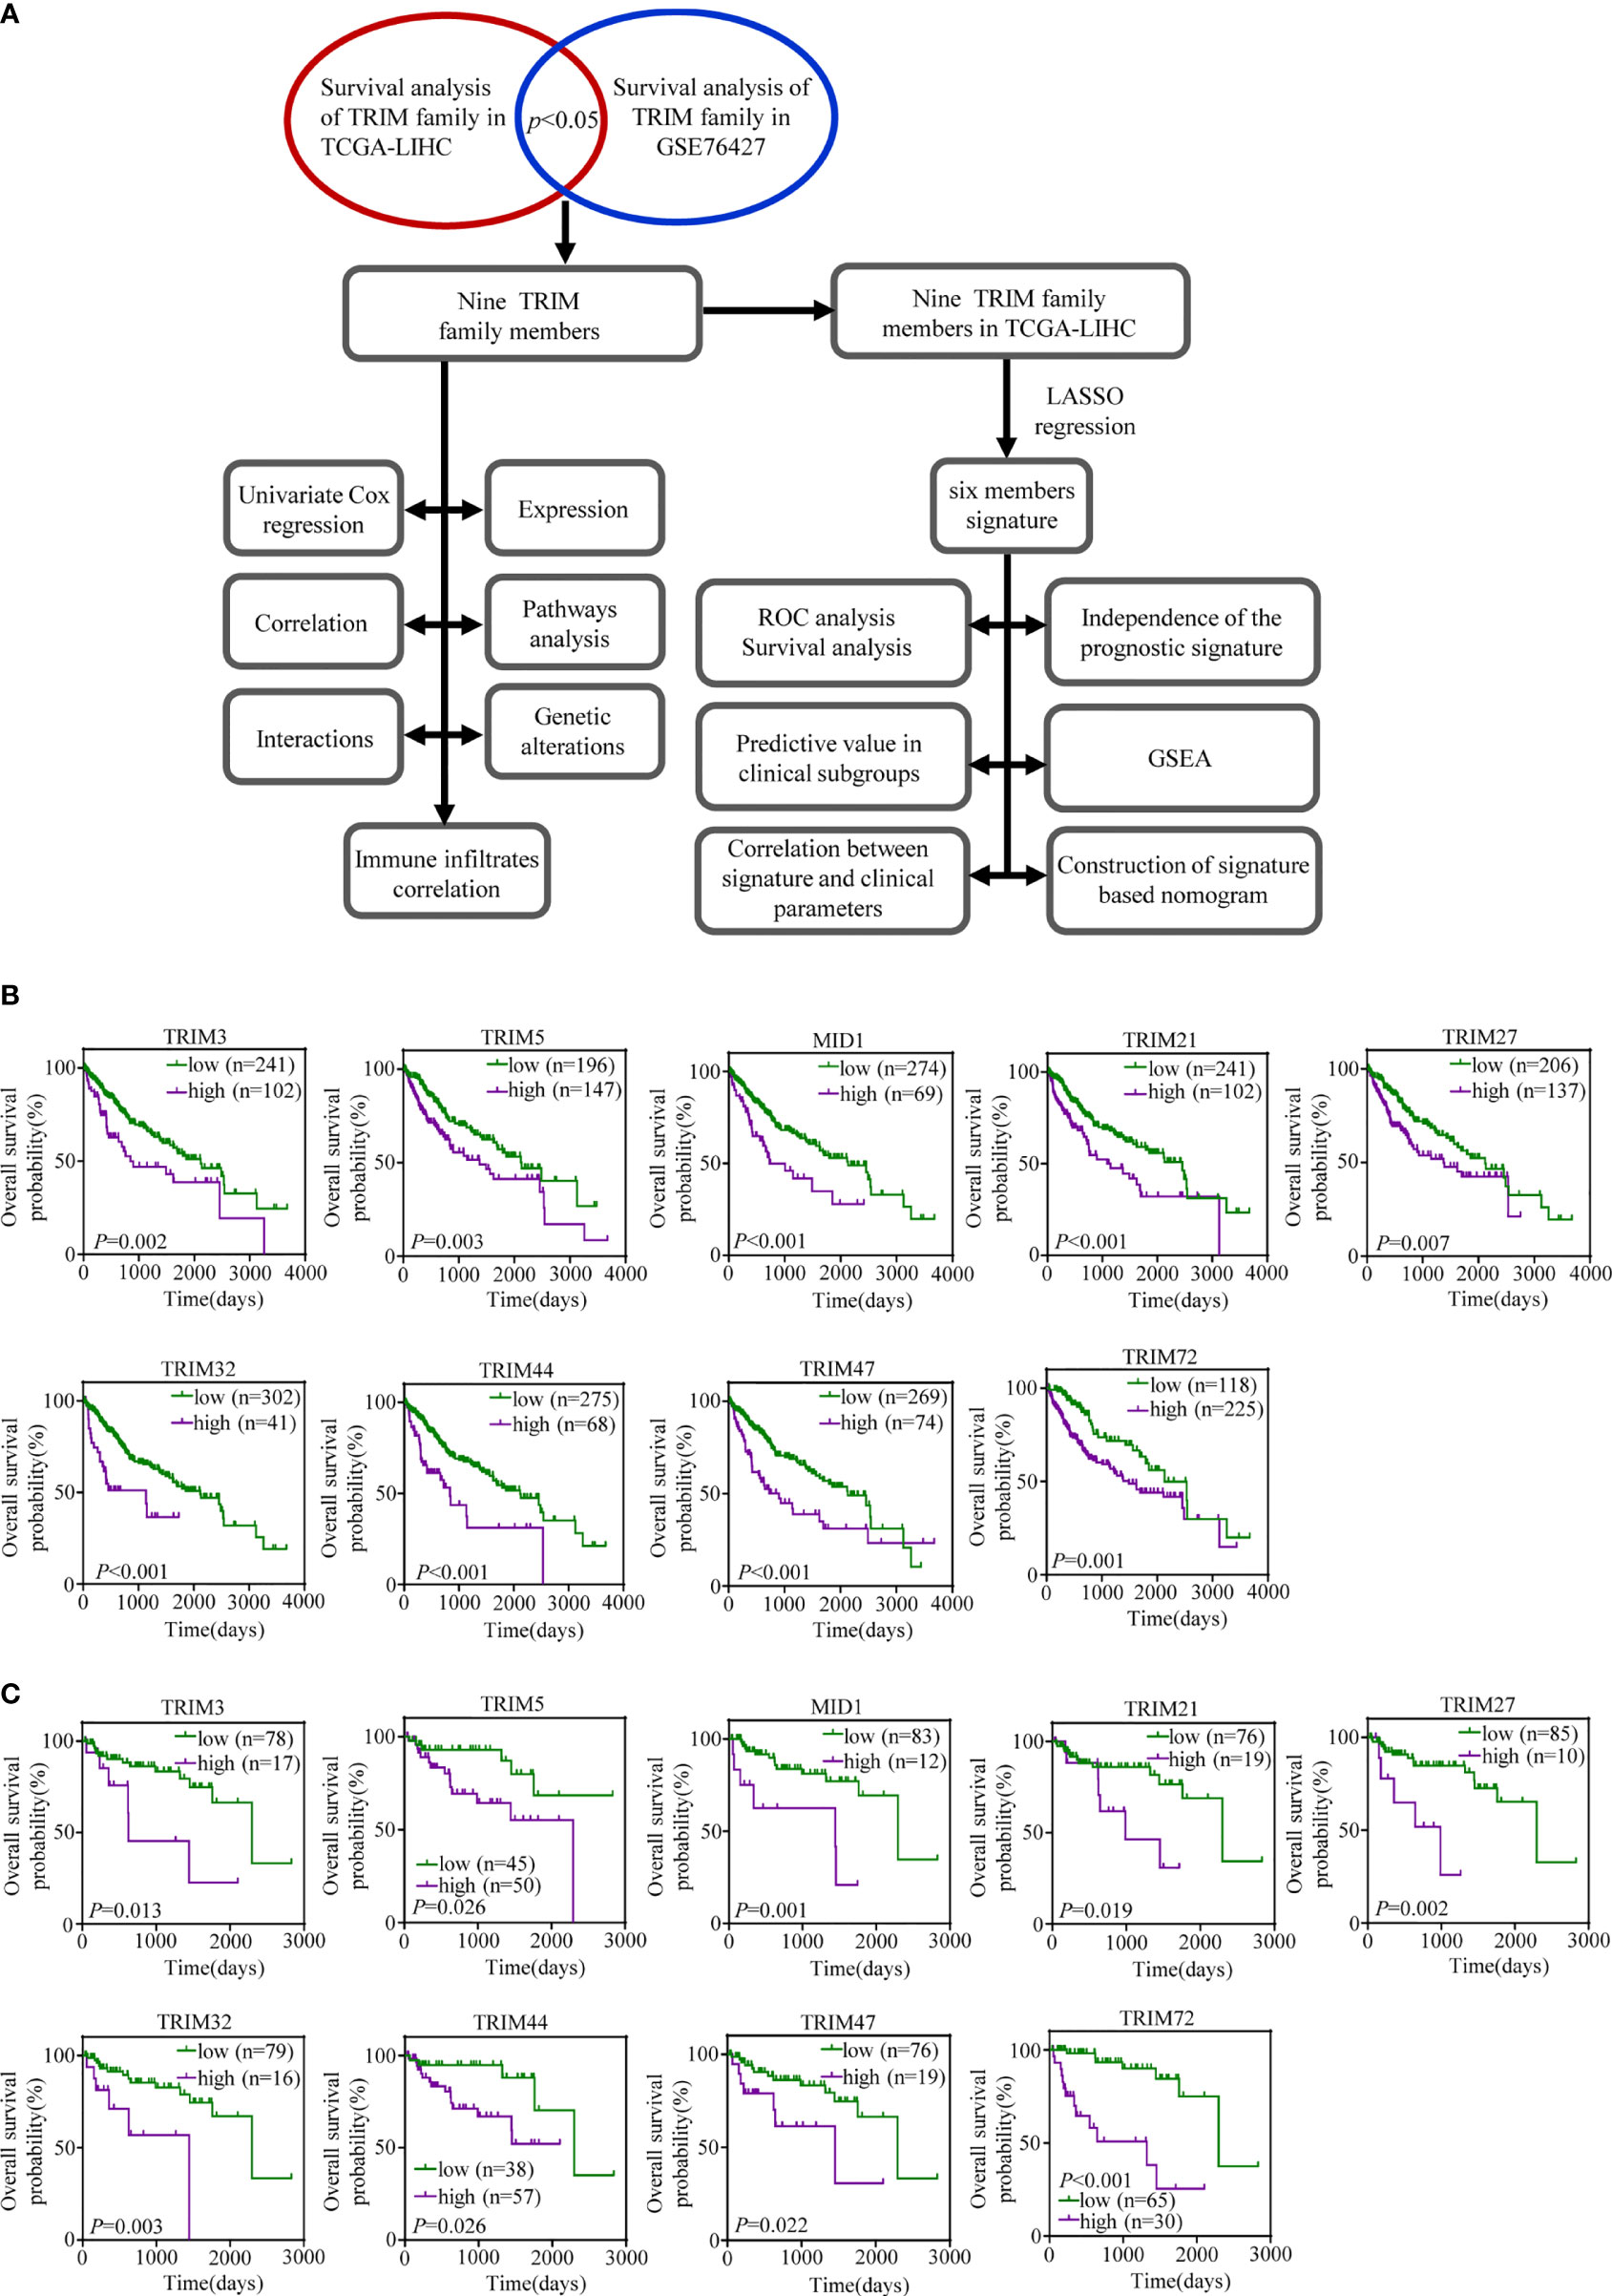
Figure 1 The prognostic values of the nine TRIM family members in HCC. (A) The workflow of our analysis steps. (B, C) Kaplan–Meier estimates of OS based on the nine TRIM family members in TCGA-LIHC (B) and GSE76427 (C). TRIM, tripartite motif; HCC, hepatocellular carcinoma; OS, overall survival; TCGA-LIHC, The Cancer Genome Atlas Liver Hepatocellular Carcinoma.
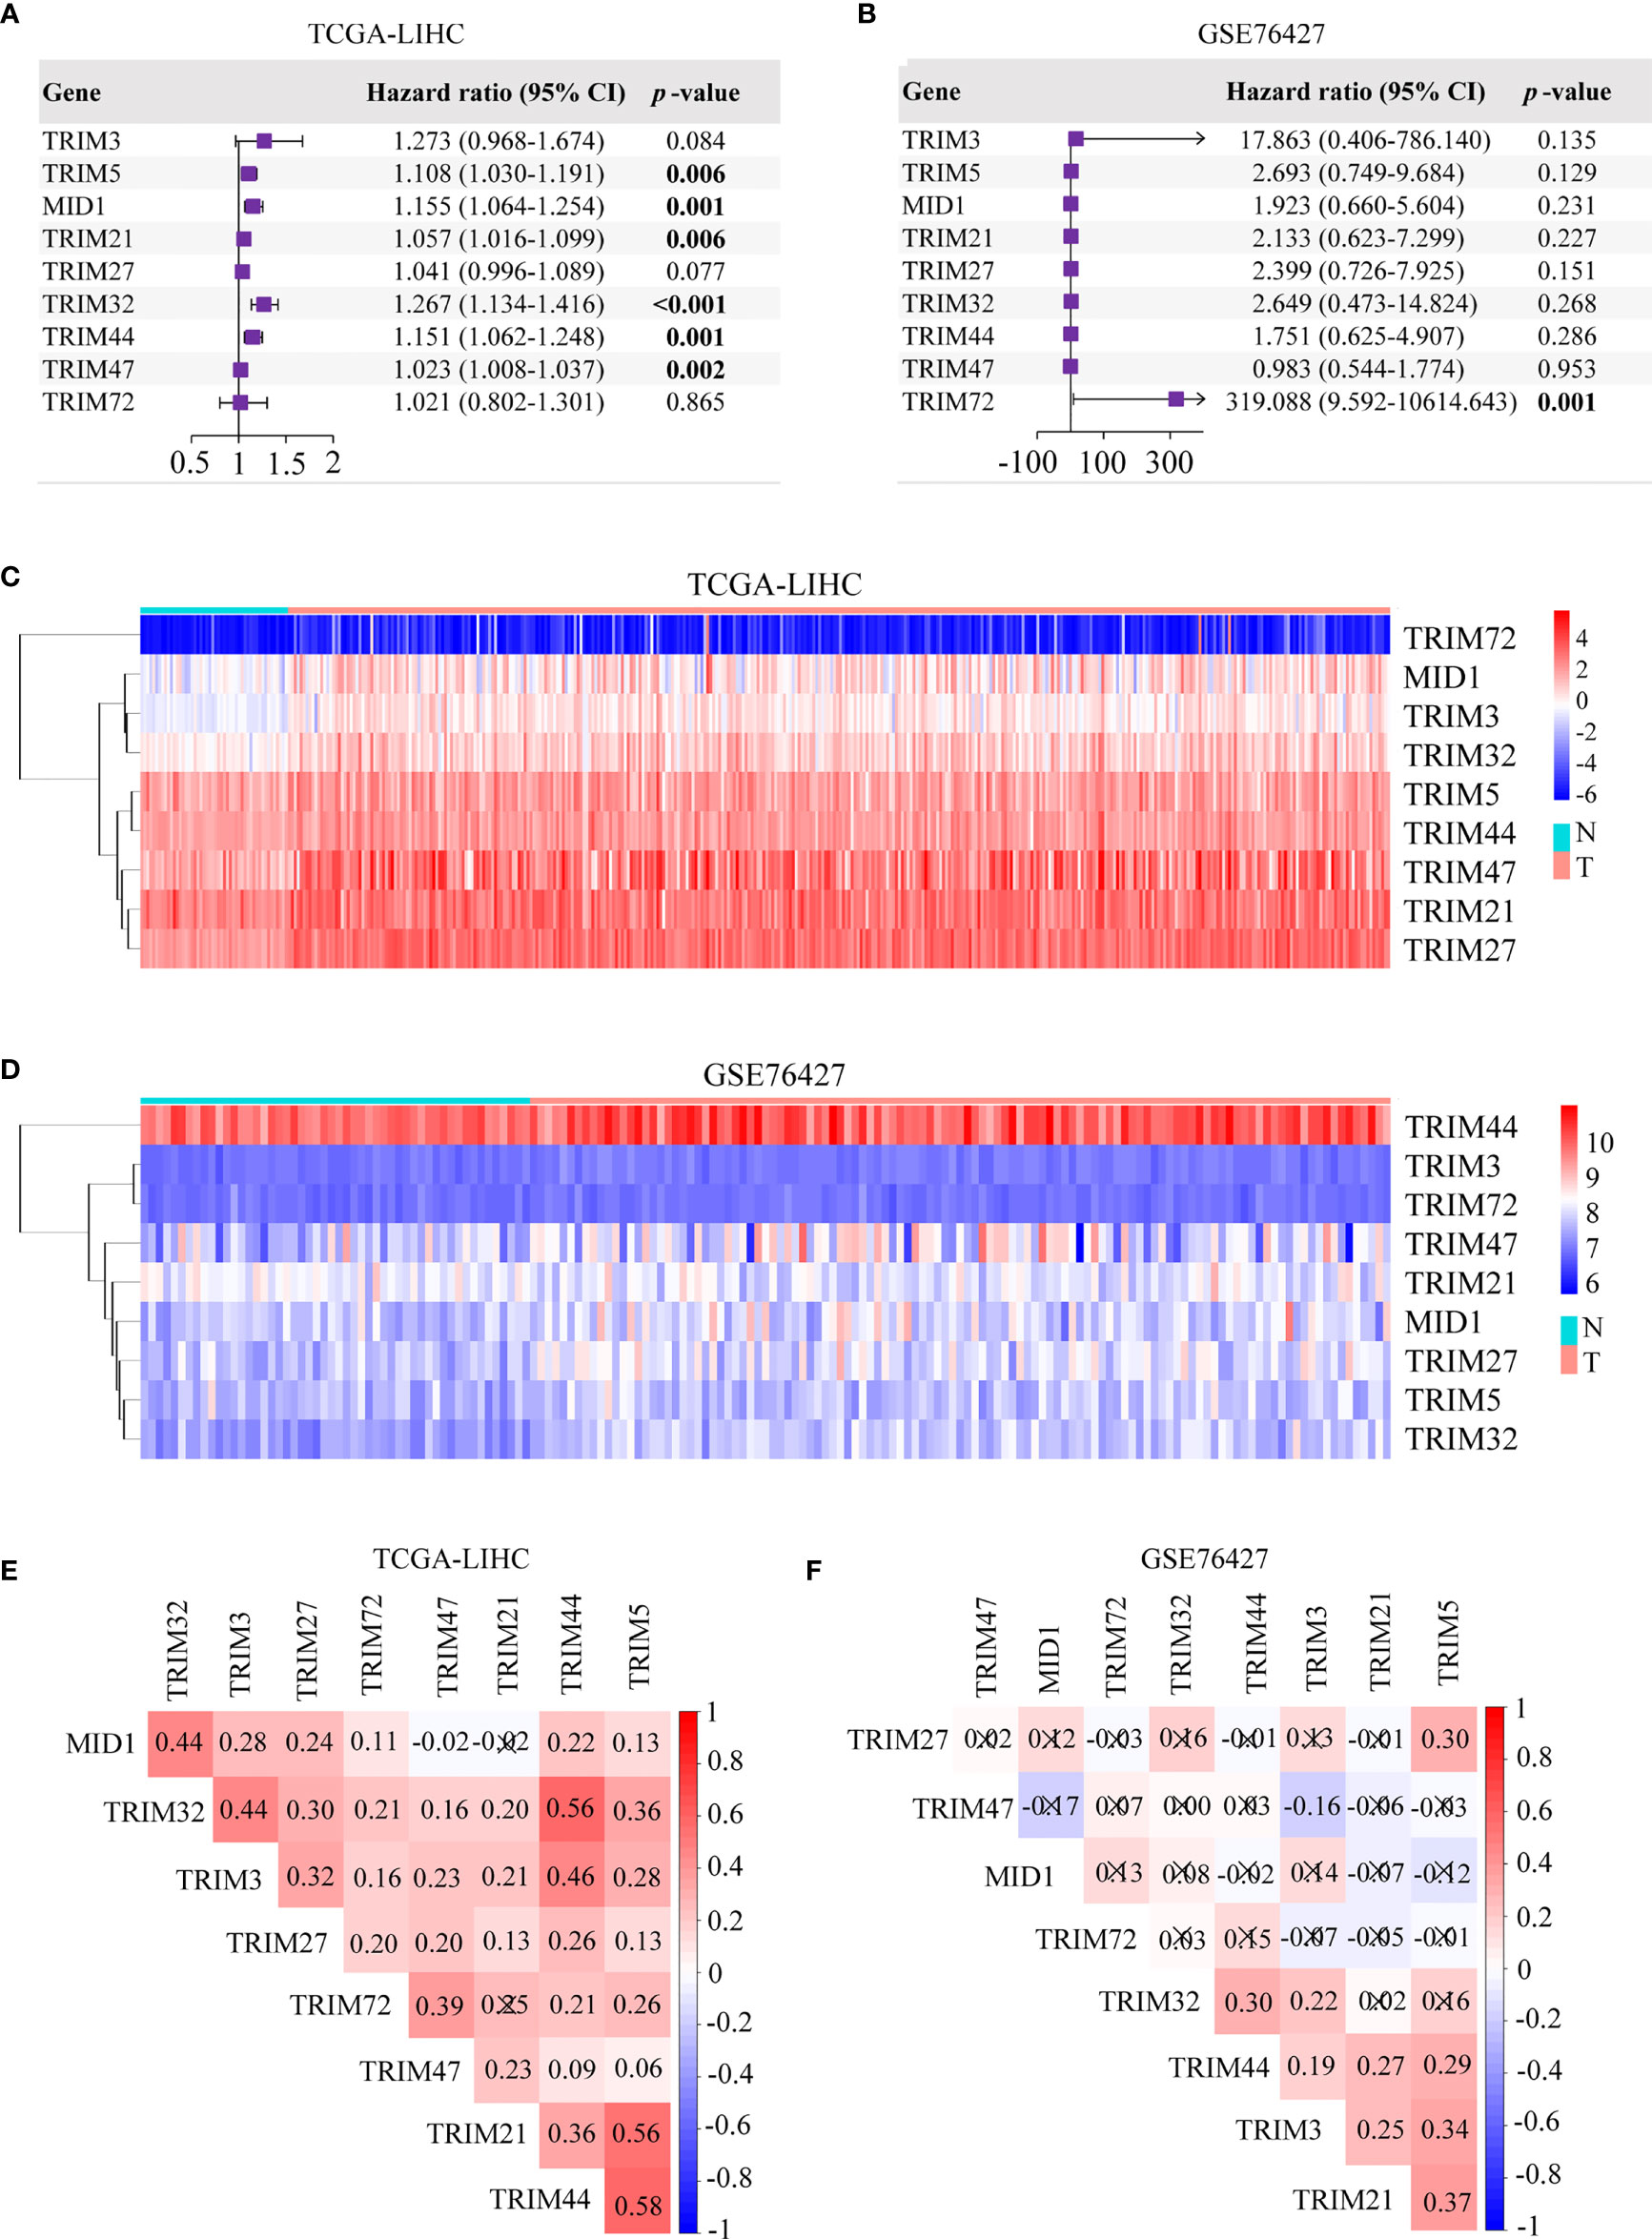
Figure 2 Univariate Cox regression analyses and the heatmaps of nine TRIM family members in HCC. (A, B) Univariate Cox regression analyses of nine TRIM family members in TCGA-LIHC (A) and GSE76427 (B). (C, D) The heatmaps depict the expression profiles of nine TRIM family members in TCGA-LIHC (C) and GSE76427 (D). (E, F) Correlation plots of nine TRIM family members in TCGA-LIHC (E) and GSE76427 (F). TRIM, tripartite motif; HCC, hepatocellular carcinoma; TCGA-LIHC, The Cancer Genome Atlas Liver Hepatocellular Carcinoma.
Expression Patterns, Pathway Analysis, and Genetic Alterations of the TRIM Family
The differential expressions of the nine genes between normal tissues and HCC tissues were investigated. It was found that eight genes consisting of TRIM3, TRIM5, MID1, TRIM21, TRIM27, TRIM32, TRIM44, and TRIM47 were upregulated in HCC with significant differentiation in TCGA-LIHC and GSE76427 cohorts (p < 0.05, Figures 3A, B). The expressions at a translational level of the nine genes were shown by the immunohistochemistry (IHC) staining images from The Human Protein Atlas database (Figure 3C).
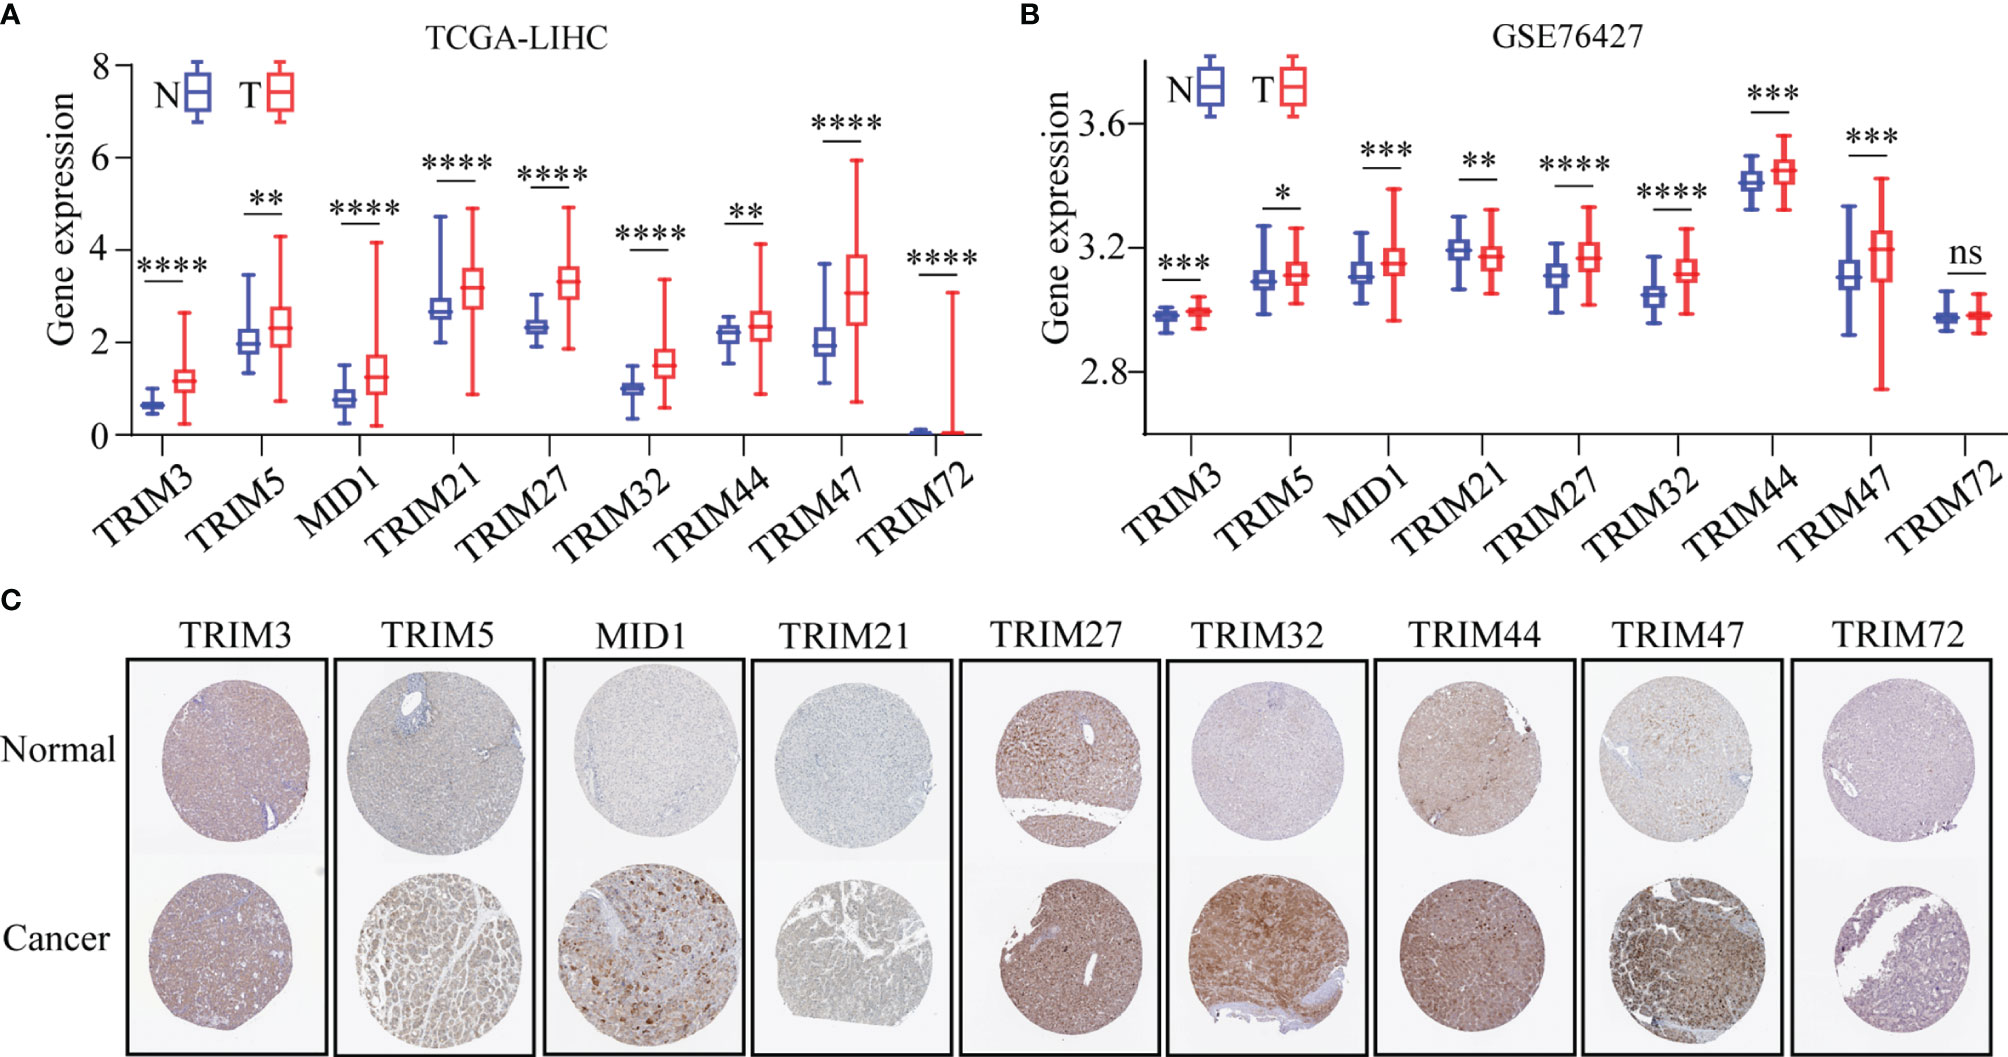
Figure 3 The expression profiles of the nine TRIM family members in HCC. (A, B) The expressions of nine TRIM family members in TCGA-LIHC (A) and GSE76427 (B). (C) Expressions at the protein level of nine TRIM family members via the Human Protein Atlas database. ns, no significance; *p < 0.05; **p < 0.01; ***p < 0.001; ****p < 0.0001. TRIM, tripartite motif; HCC, hepatocellular carcinoma; TCGA-LIHC, The Cancer Genome Atlas Liver Hepatocellular Carcinoma.
Furthermore, the mRNA expression levels of the nine TRIM family members (TRIM3, TRIM5, MID1, TRIM21, TRIM27, TRIM32, TRIM44, TRIM47, and TRIM72) were detected in human HCC cell lines (HepG2, Huh7, MHCC97H, Hep3B, and SK-Hep-1) and normal human hepatocyte cell line MIHA by qRT-PCR assays (Figure 4A). The mRNA levels of TRIM5 in Hep3B, MID1 in Hep3B and SK-Hep-1, TRIM27 in HepG2 and Hep3B, TRIM32 in HepG2, and TRIM44 in Huh7 and Hep3B were 2-fold higher than those in MIHA. The mRNA expressions of the nine TRIM family members in 38 HCC samples and corresponding adjacent normal liver tissue samples were investigated by qRT-PCR assays (Figure 4B). The results showed that the mRNA levels of TRIM5, MID1, TRIM21, TRIM27, TRIM32, and TRIM47 were significantly upregulated in the HCC tissues.
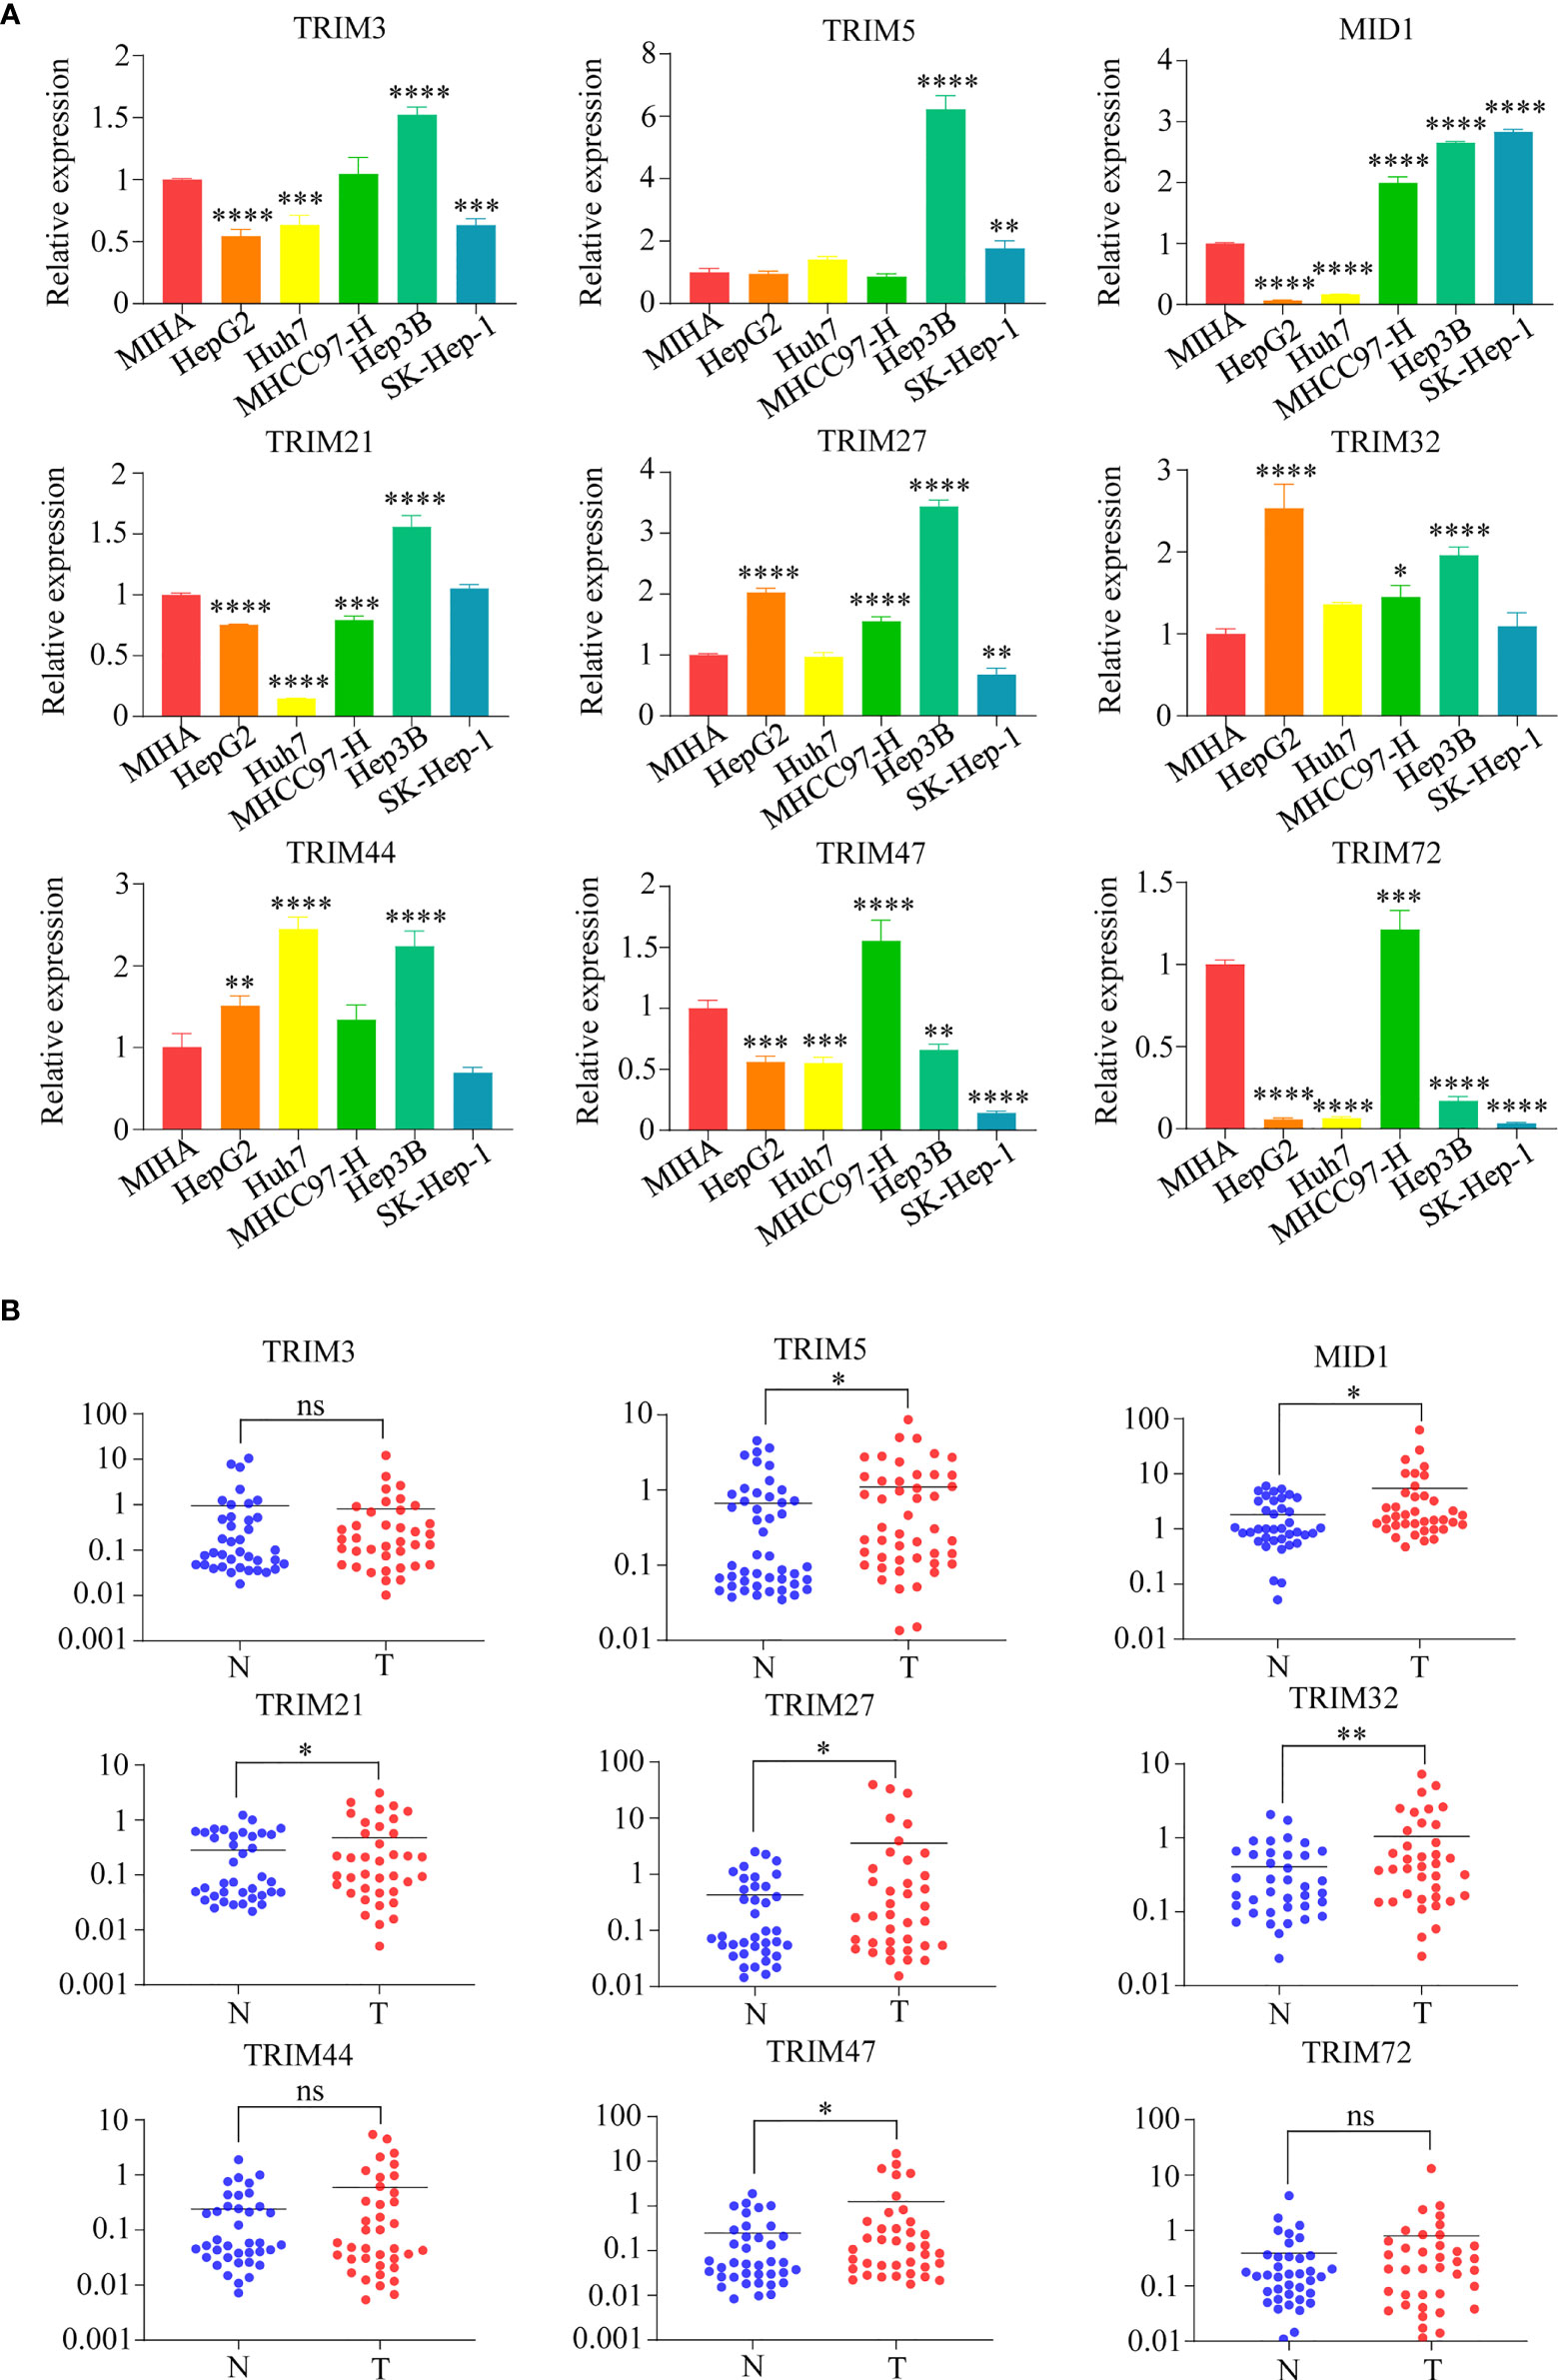
Figure 4 The mRNA expressions of nine TRIM family members (TRIM3, TRIM5, MID1, TRIM21, TRIM27, TRIM32, TRIM44, TRIM47, and TRIM72) in human HCC cell lines and HCC samples. (A) The mRNA expressions of nine TRIM family members in human HCC cell lines (HepG2, Huh7, MHCC97H, Hep3B, and SK-Hep-1) and normal human hepatocyte cell line MIHA were measured by qRT-PCR. The normal human liver cell line MIHA was used as a control. (B) The mRNA expressions of nine TRIM family members in 38 HCC samples and the corresponding adjacent normal tissue samples. ns, no significance; *p < 0.05; **p < 0.01; ***p < 0.001; ****p < 0.0001. TRIM, tripartite motif; HCC, hepatocellular carcinoma.
The co-expressed genes of the nine TRIM family members were annotated by the KEGG pathway (Figure 5A). Wnt signaling pathway; Epstein–Barr virus infection; protein processing in the endoplasmic reticulum; thermogenesis; valine, leucine, and isoleucine degradation; and ascorbate and aldarate metabolism were the top KEGG pathways of MID1, TRIM21, TRIM27, TRIM32, TRIM47, and TRIM72, respectively. On the other hand, there was no significant term for TRIM3. Ribosome was the top term in KEGG for both TRIM44 and TRIM5. The genetic alterations of the nine TRIM family members explored by using the cBioPortal database ranged from 1.9% to 21% (Figure 5B).
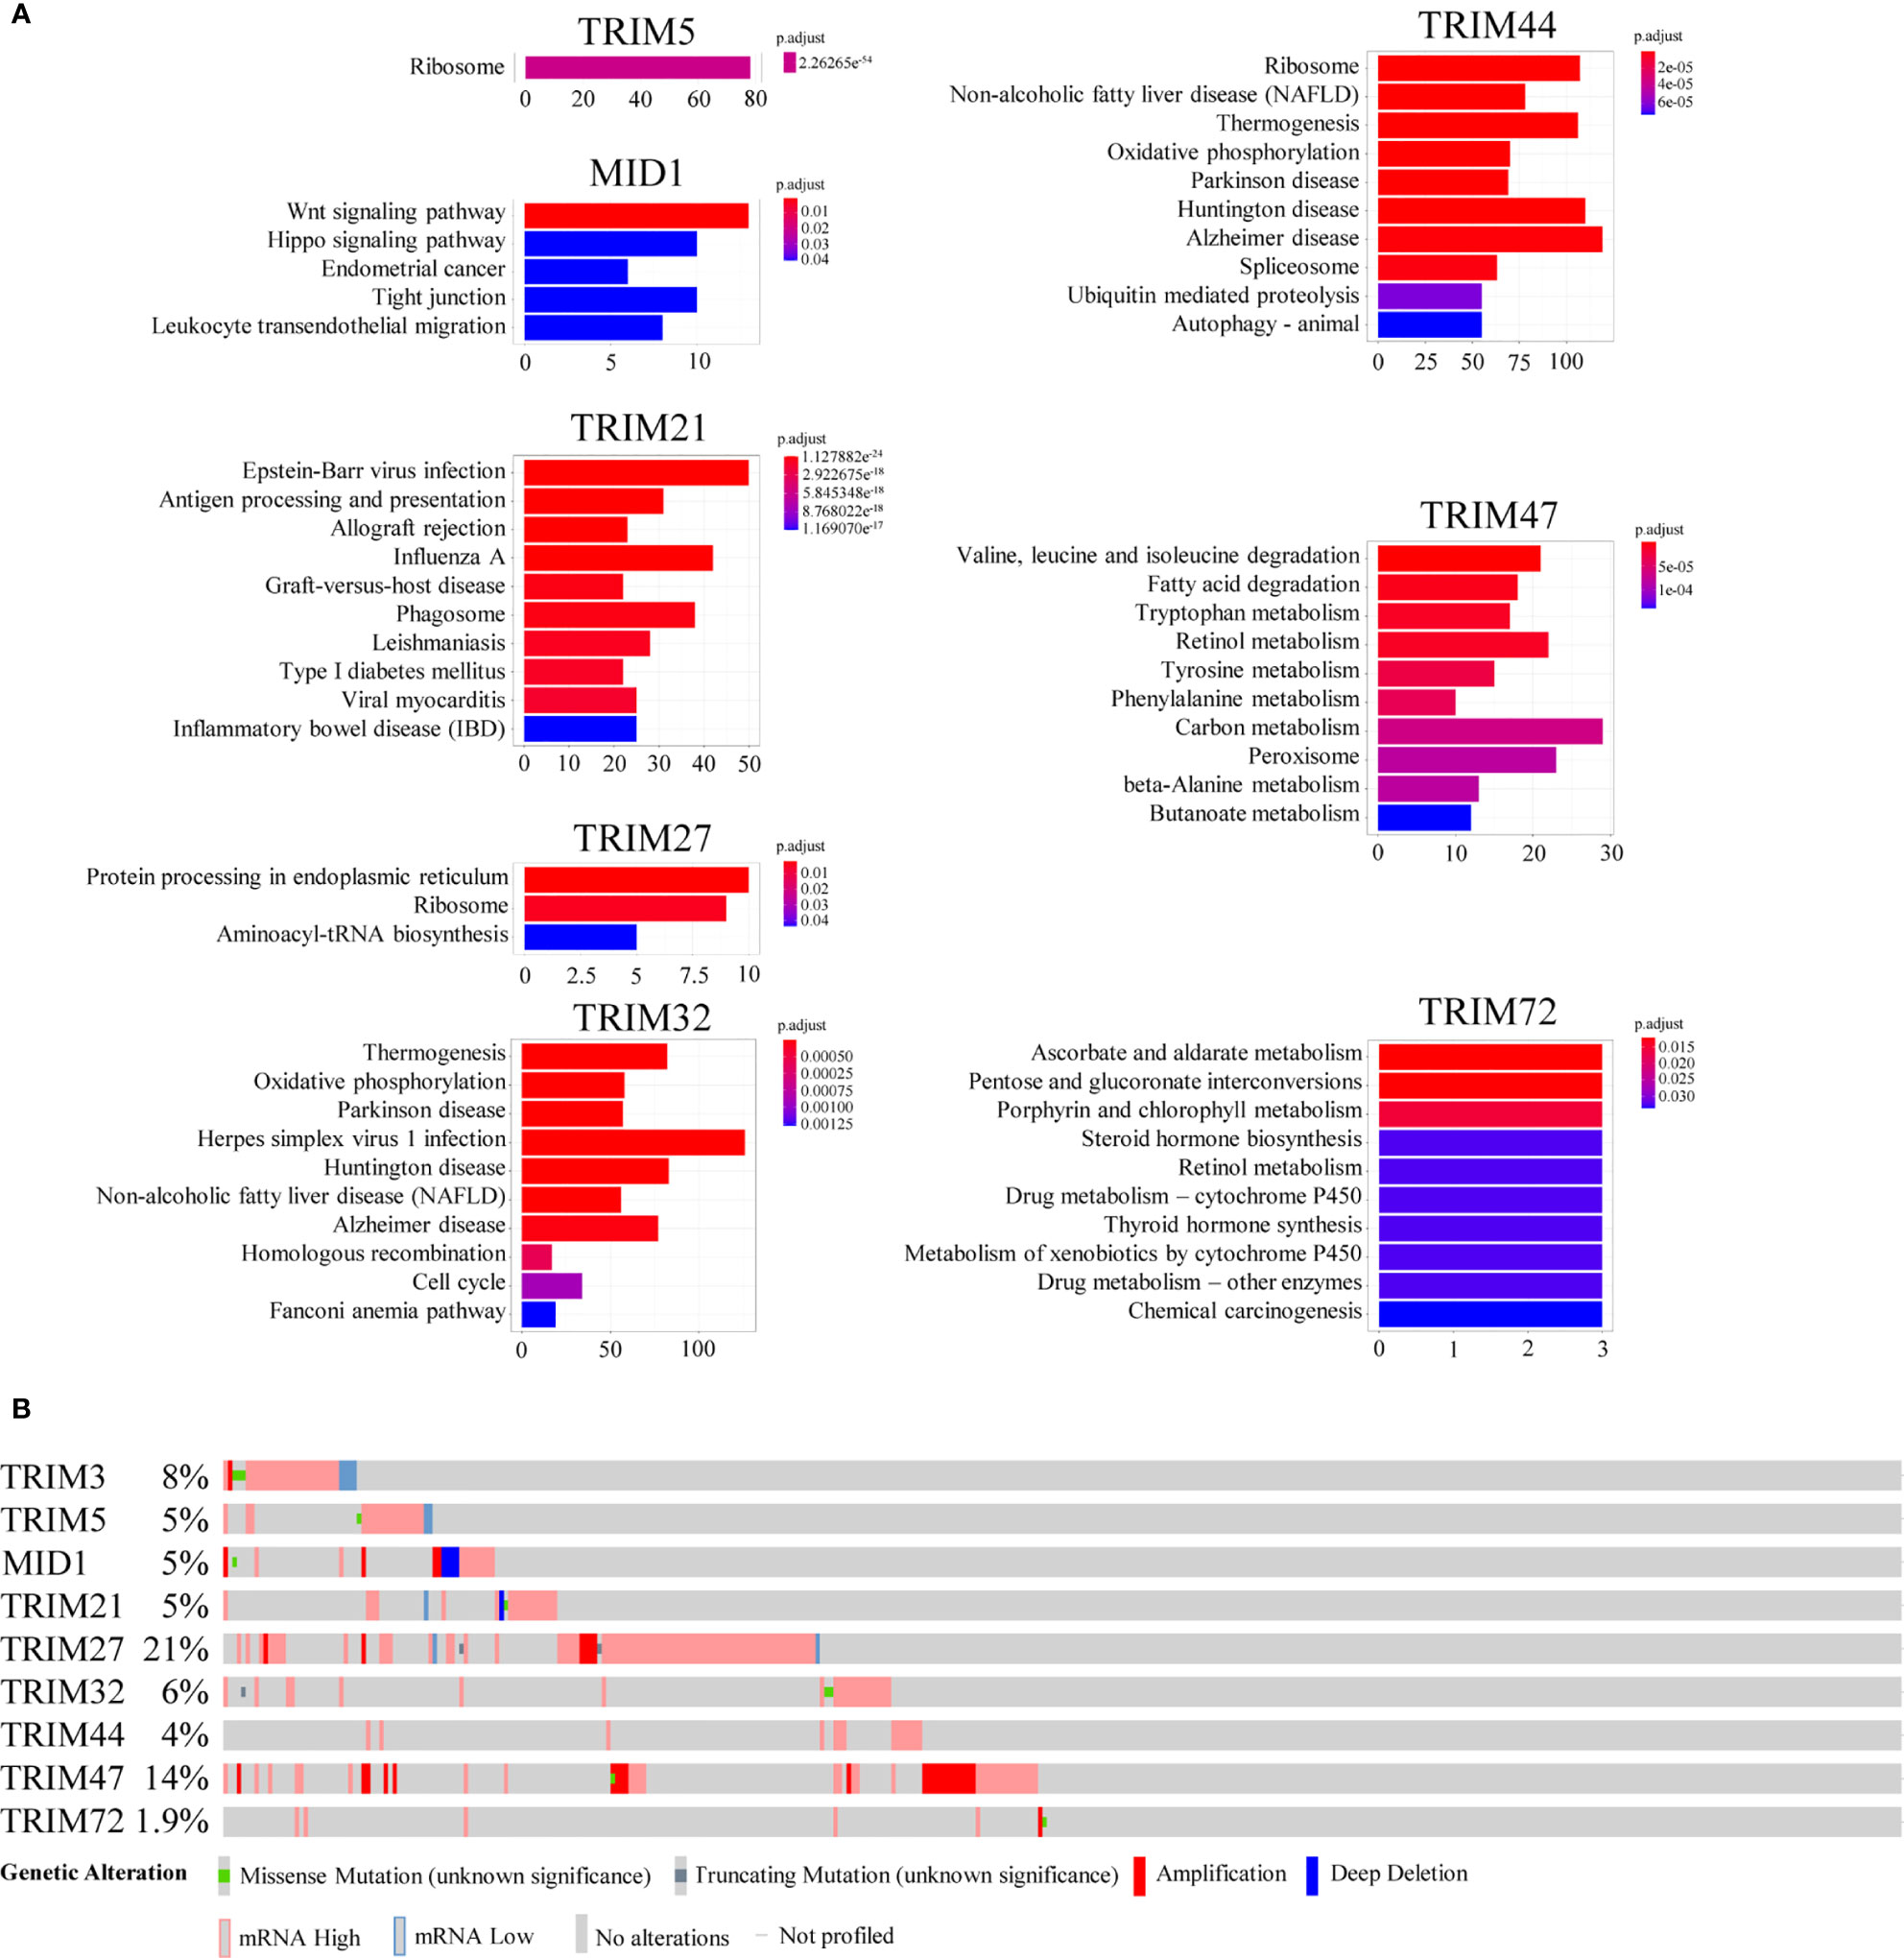
Figure 5 The potential mechanisms of the nine TRIM family members. (A) KEGG enrichment analyses for co-expressed genes associated with the nine TRIM family members. (B) The genetic alteration profiles of the nine TRIM family members via the cBioportal database. TRIM, tripartite motif; KEGG, Kyoto Encyclopedia of Genes and Genomes.
Protein–Protein Interaction, Transcription Factors, and miRNA Predictions of the TRIM Family
The protein–protein interaction network constructed by STRING database suggested that the nine members showed extensive associations with each other at the protein level (Figure 6A). With the use of the NetworkAnalyst database, the predicted TFs and miRNAs that connected with the nine members are shown in Figures 6B, C.
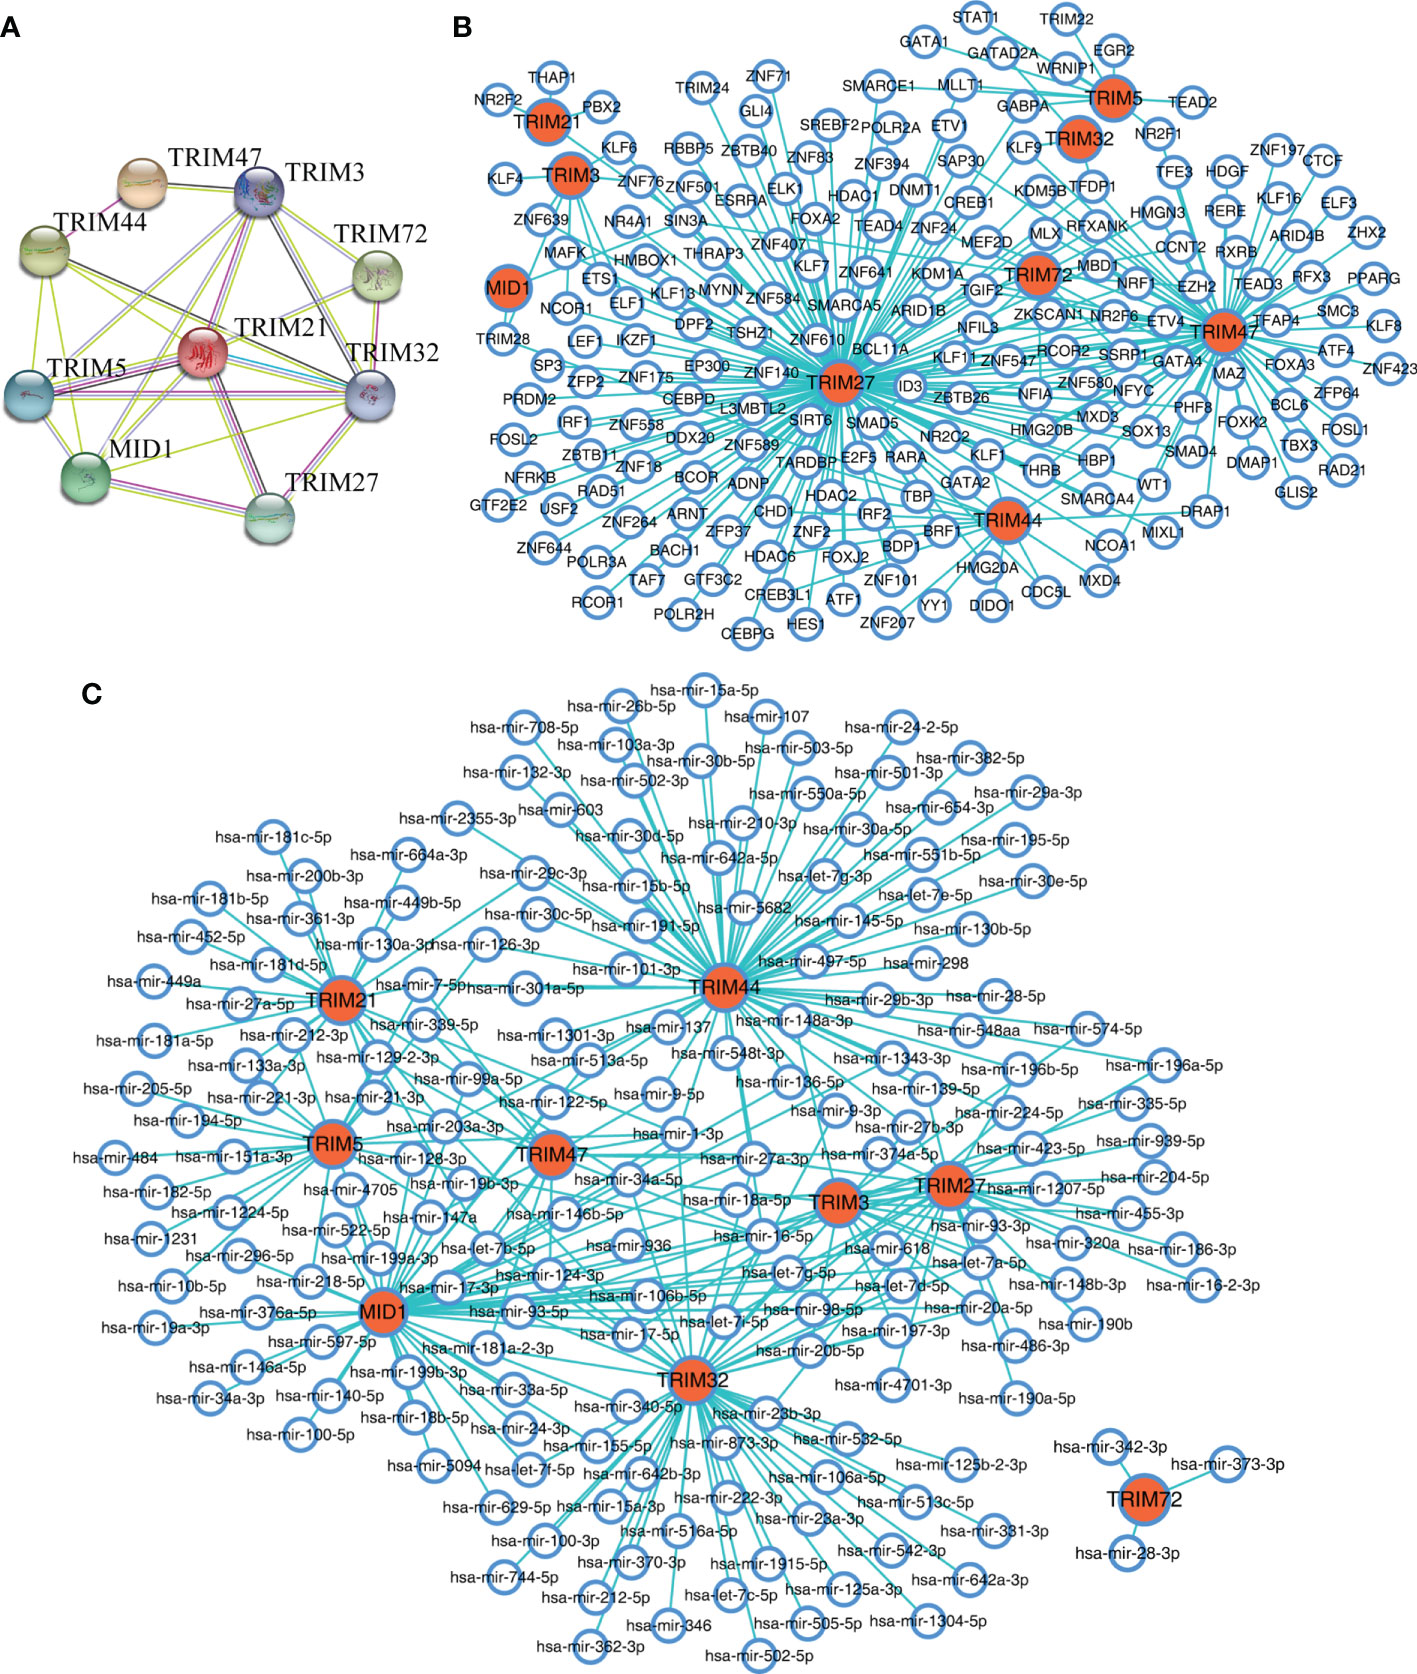
Figure 6 The interaction networks of the nine TRIM family members. (A) The protein–protein interaction network of the nine TRIM family members based on the STRING database. (B, C) The predicted TFs (B) and miRNAs (C) connected with the nine TRIM family members in the NetworkAnalyst database. TRIM, tripartite motif; TFs, transcription factors.
Correlations With the Hallmarks of Cancer of the Nine TRIM Family Members
To explore the potential mechanisms of the nine TRIM family members in HCC, the correlations between the nine TRIM family members and several markers of proliferation, cell cycle, invasion/migration, EMT, stemness, angiogenesis, and lymphangiogenesis were analyzed (Figures 7A, B). TRIM32 was shown to be positively correlated with the proliferation index proliferating cell nuclear antigen (PCNA) and cell cycle markers (CCNB2, CDK2, CDK4, and CDKN2A) in both cohorts, and MID1 exhibited significant positive correlations with CDK6 and MYC in TCGA-LIHC and GSE76427 cohorts. However, though some correlations between TRIM family and the markers of invasion/migration, EMT, and stemness could be observed in TCGA cohort, we could not obtain similar results in the GSE76427 cohort. As regards angiogenesis and lymphangiogenesis, TRIM47 presented positive correlations with SPHK1 in both cohorts. Besides, positive correlations were shown between TRIM27 and the lymphangiogenesis marker DSP in the two cohorts. Thus, the nine TRIM family members may play important roles in cell proliferation, cell cycle, angiogenesis, and lymphangiogenesis.
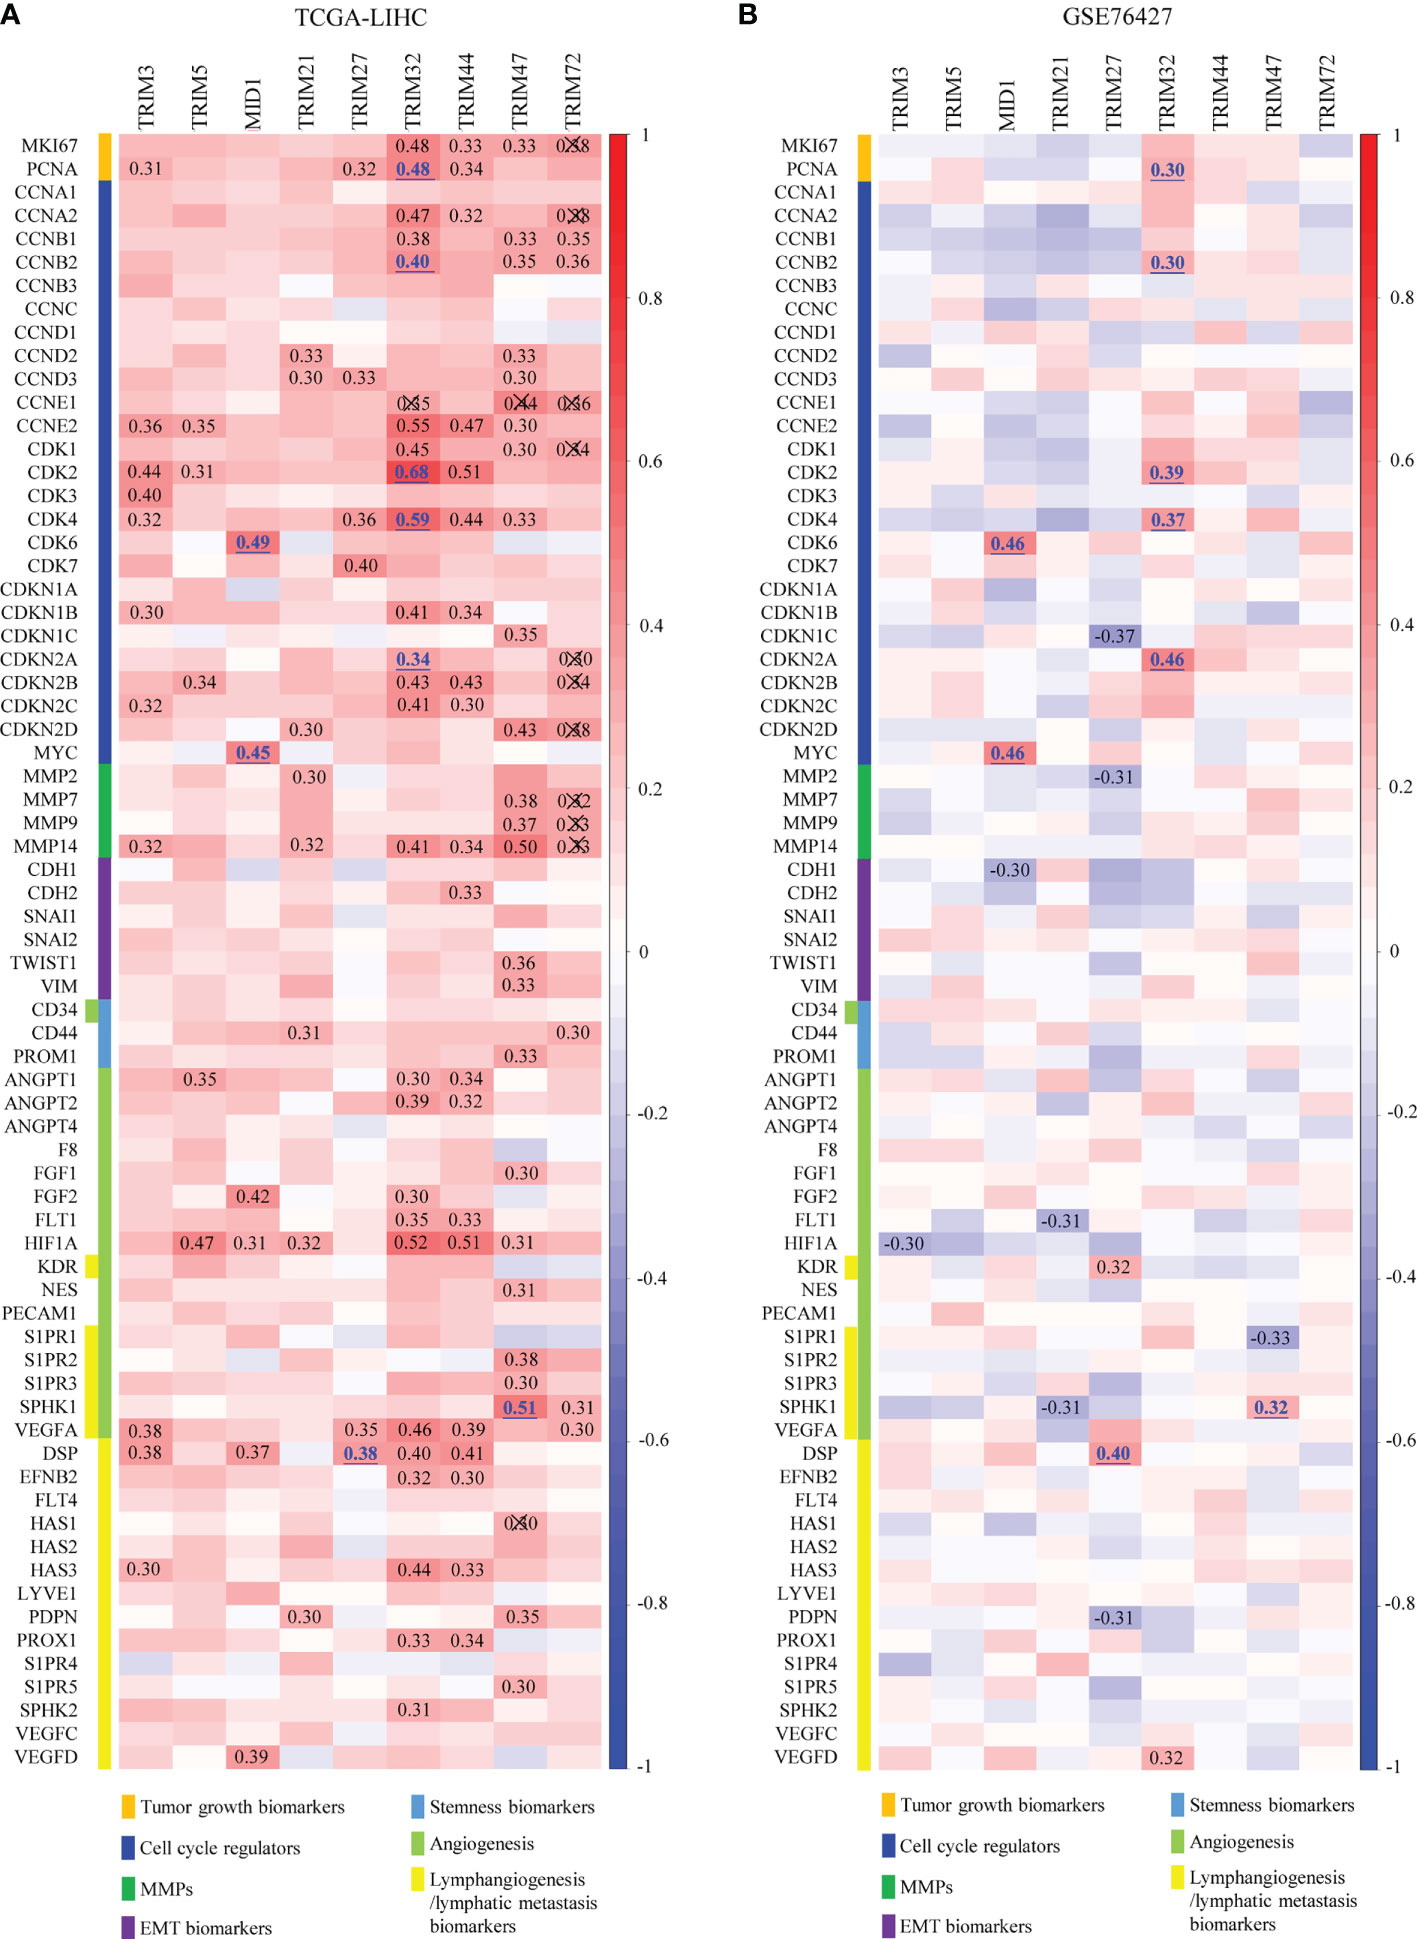
Figure 7 Overall correlations between the expressions of the nine TRIM family members and the hallmarks of cancer. (A, B) Correlations between the expressions of the nine TRIM family members and several markers of proliferation, cell cycle, invasion/migration, EMT, stemness, angiogenesis, and lymphangiogenesis in TCGA-LIHC (A) and GSE76427 (B). TRIM, tripartite motif; EMT, epithelial-to-mesenchymal transition; TCGA-LIHC, The Cancer Genome Atlas Liver Hepatocellular Carcinoma.
TRIM Family Members Associate With Immune Infiltrates
In order to investigate whether the TRIM family plays potential biological roles in immune infiltrates, the correlations between the nine TRIM family members and the immune infiltration level in LIHC were analyzed based on the TIMER database (Figure 8). Intriguingly, positive correlations were identified between TRIM3 and CD4+ T cell (r = 0.358, p = 7.25e−12), macrophages (r = 0.378, p = 5.20e−13), or neutrophils (r = 0.355, p = 1.15e−11). TRIM5 expression exhibited significant associations with CD4+ T cell (r = 0.3, p = 1.43e−08), macrophages (r = 0.332, p = 3.40e−10), neutrophils (r = 0.461, p = 1.45e−19), and dendritic cells (r = 0.31, p = 4.95e−09). By using the TIMER database, Qi et al. reported the positive correlations between TRIM21 expression and immune infiltrates, such as B cells, CD4+ T cells, macrophages, neutrophils, and dendritic cells (53). Positive associations were shown between TRIM32 and CD4+ T cell (r = 0.372, p = 1.06e−12), macrophages (r = 0.428, p = 1.22e−16), neutrophils (r = 0.482, p = 1.88e−21), and dendritic cells (r = 0.407, p = 5.07e−15). TRIM44 expression was significantly correlated with CD4+ T cell (r = 0.318, p = 1.62e−09), macrophages (r = 0.398, p = 2.10e−14), neutrophils (r = 0.504, p = 1.31e−23), and dendritic cells (r = 0.305, p = 9.56e−09). Positive correlations could be found between TRIM47 and CD4+ T cell (r = 0.427, p = 1.05e−16), macrophages (r = 0.412, p = 2.10e−15), and neutrophils (r = 0.356, p = 9.46e−12). Besides, TRIM72 expression showed a significant correlation with neutrophils (r = 0.309, p = 4.82e−09).
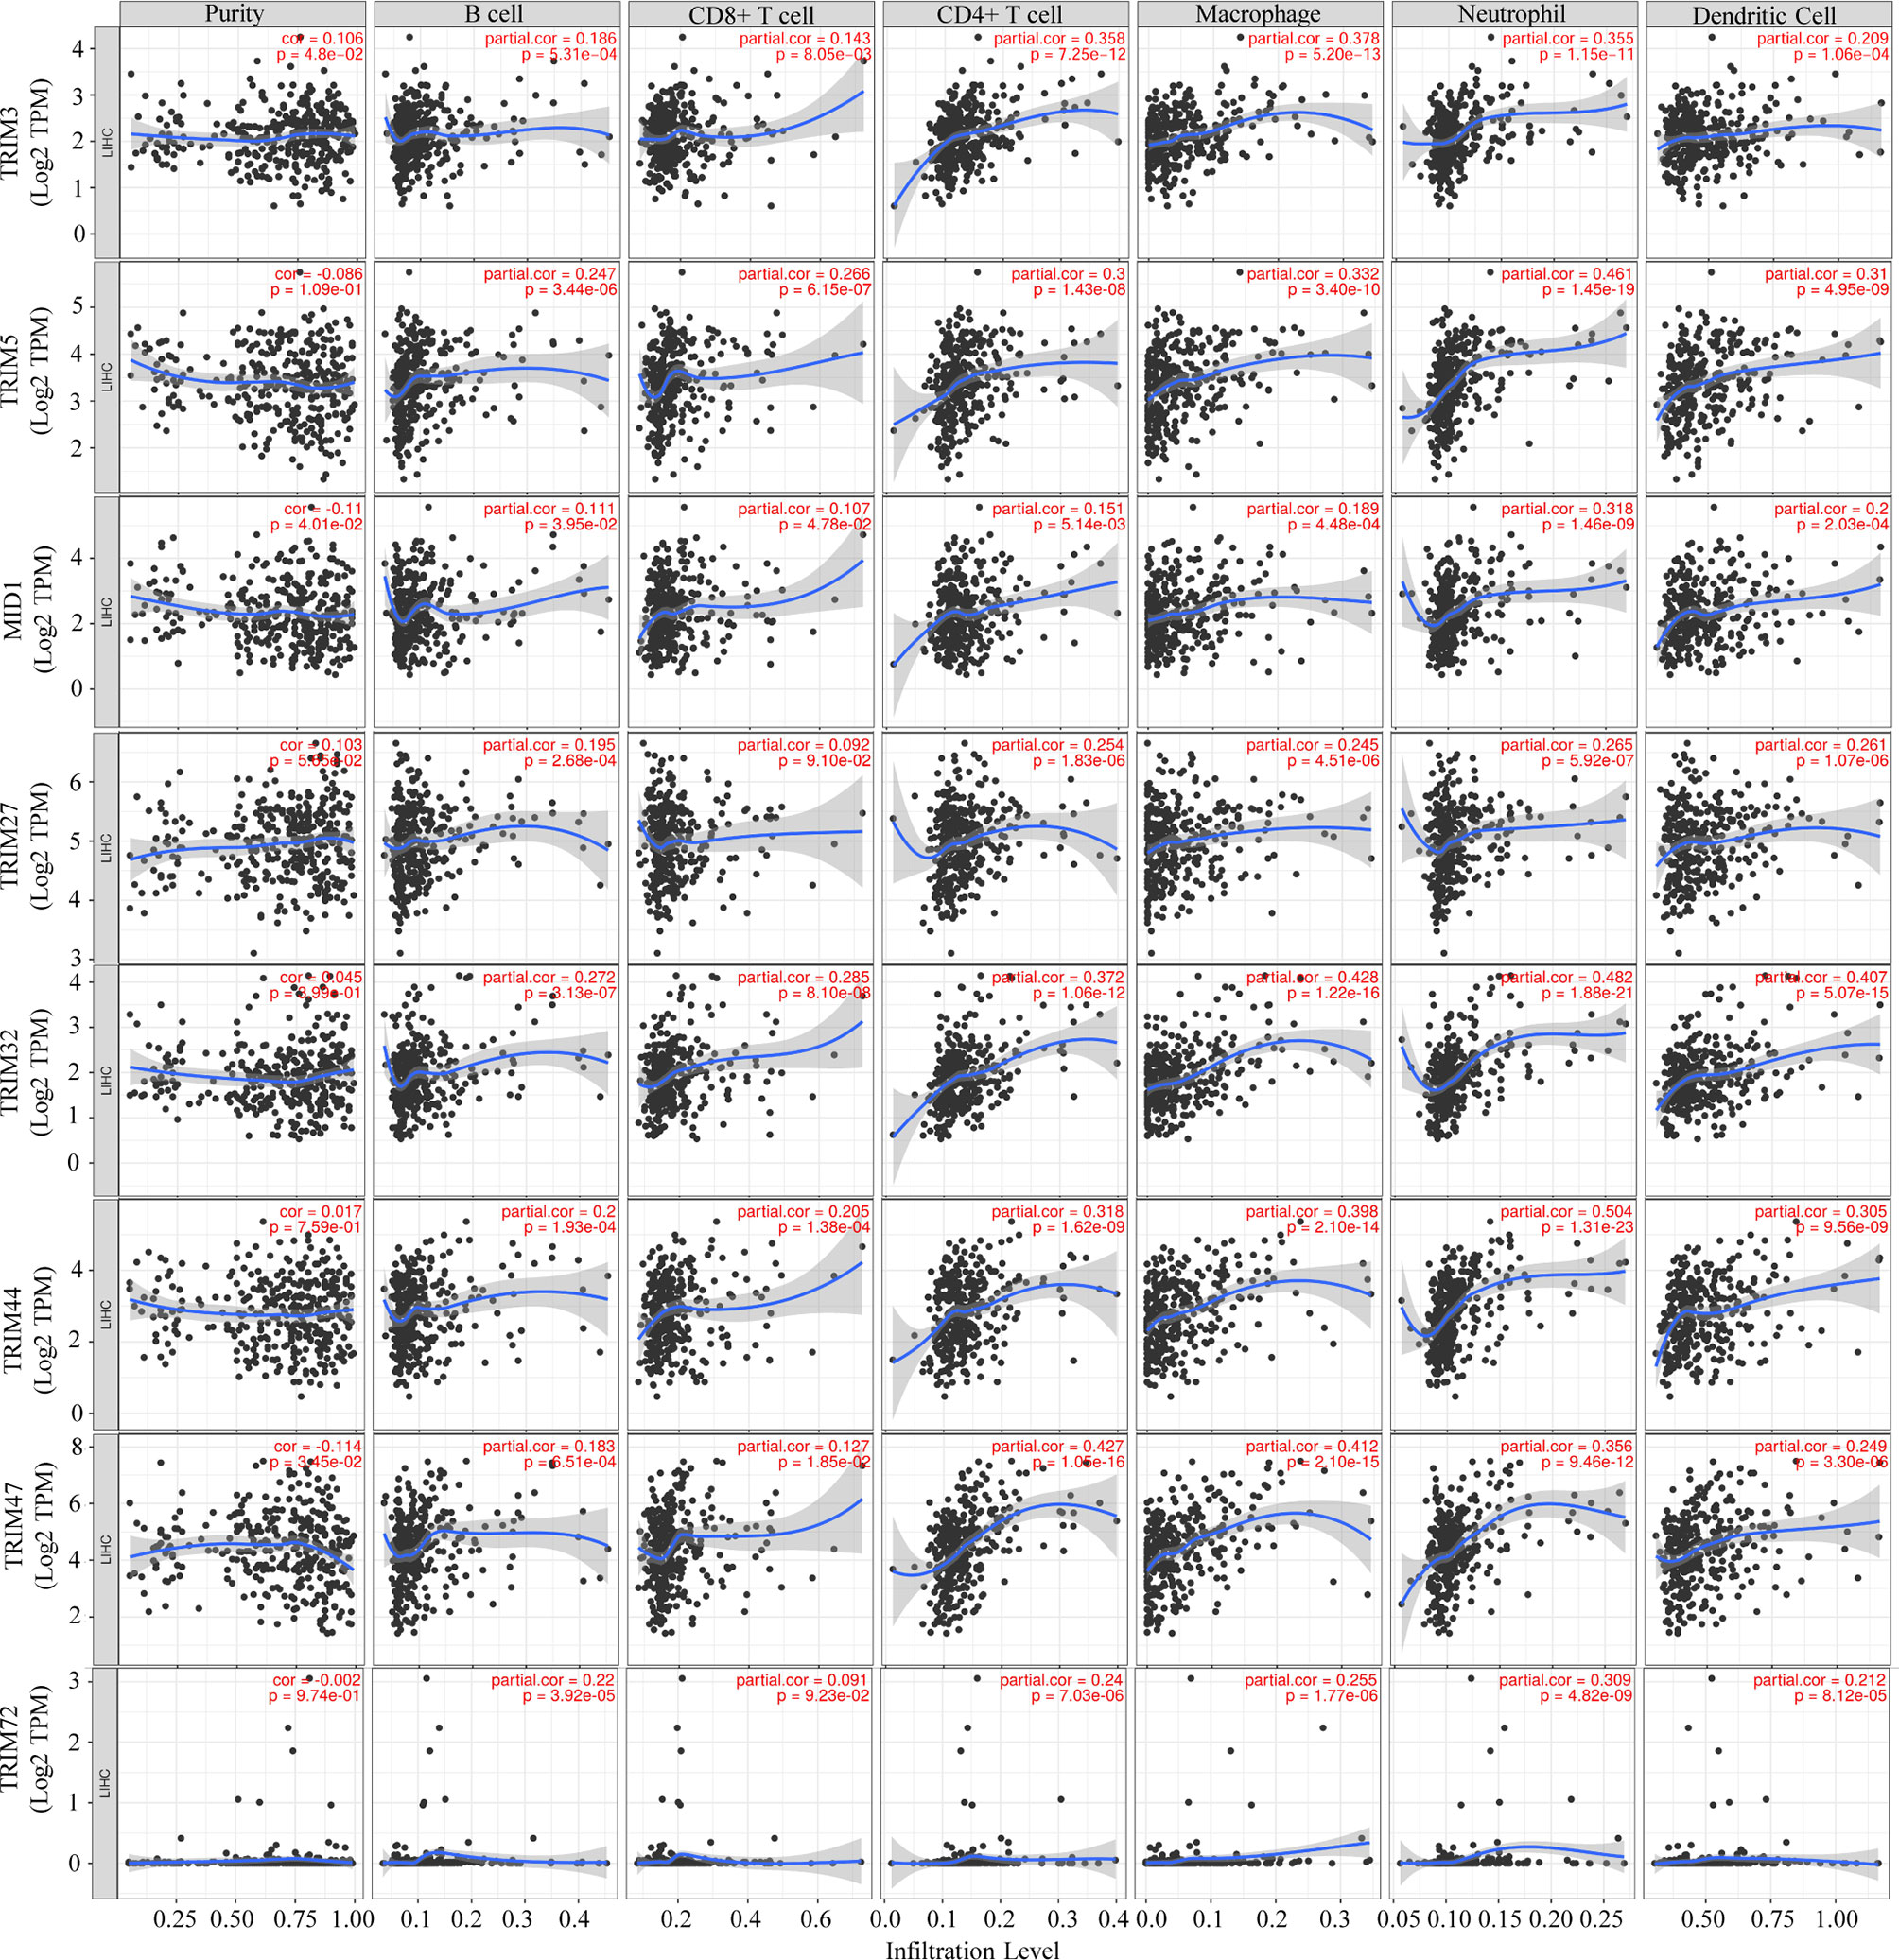
Figure 8 Associations of the nine TRIM family members with tumor immune infiltrating cells (B cells, CD8+ T cells, CD4+ T cells, macrophages, neutrophils, and dendritic cells) via the TIMER database. TRIM, tripartite motif; TIMER, Tumor IMmune Estimation Resource.
Construction and Validation of the TRIM Family Gene-Based Signature
Given that more and more attention is being paid to the prognostic value of gene signature, a TRIM family signature was also constructed based on the nine members, which had significant values for OS prediction. TCGA-LIHC dataset (n = 343) was used as the testing set, and GSE76427 (n = 95) was selected for validation. The LASSO regression was applied to reduce multicollinearity among the TRIM family members and select the appropriate members for the signature (Figures 9A, B). Therefore, a six-gene-based signature was constructed with their regression coefficients derived from the LASSO regression analysis: risk score = 0.00563719 × Exp(TRIM5) + 0.03899426 × Exp(MID1) + 0.00885929 × Exp(TRIM21) + 0.09782539 × Exp(TRIM32) + 0.01168274 × Exp(TRIM44) + 0.00588728 × Exp(TRIM47). As above, the coefficients of the six members indicated that they were all risk factors for OS, and TRIM32 had the most influence on OS while TRIM5 had the least. The risk score of each patient was calculated based on the formula above. Then, patients were divided into high- and low-risk groups based on the optimal cutoff, which was determined by X-tile software. The profiles of the risk score, survival status, and gene expression levels are shown in Supplementary Figures 2A, B. In the training set, the survival analysis manifested that patients in the high-risk group had worse OS than the low-risk patients (Figure 9C). Time-dependent ROC analysis showed that the AUCs for 1-, 3-, and 5-year OS were 0.709, 0.604, and 0.566, respectively (Figure 9E). Similar results could be obtained in the validation set. The OS of the patients who belonged to the high-risk group was worse than that of the low-risk group (Figure 9D). The ROC analysis indicated that the prognostic accuracy of the signature was 0.618 at 1 year, 0.602 at 3 years, and 0.672 at 5 years (Figure 9F). Together, the six-gene prognostic signature performed well in OS prediction for HCC patients.
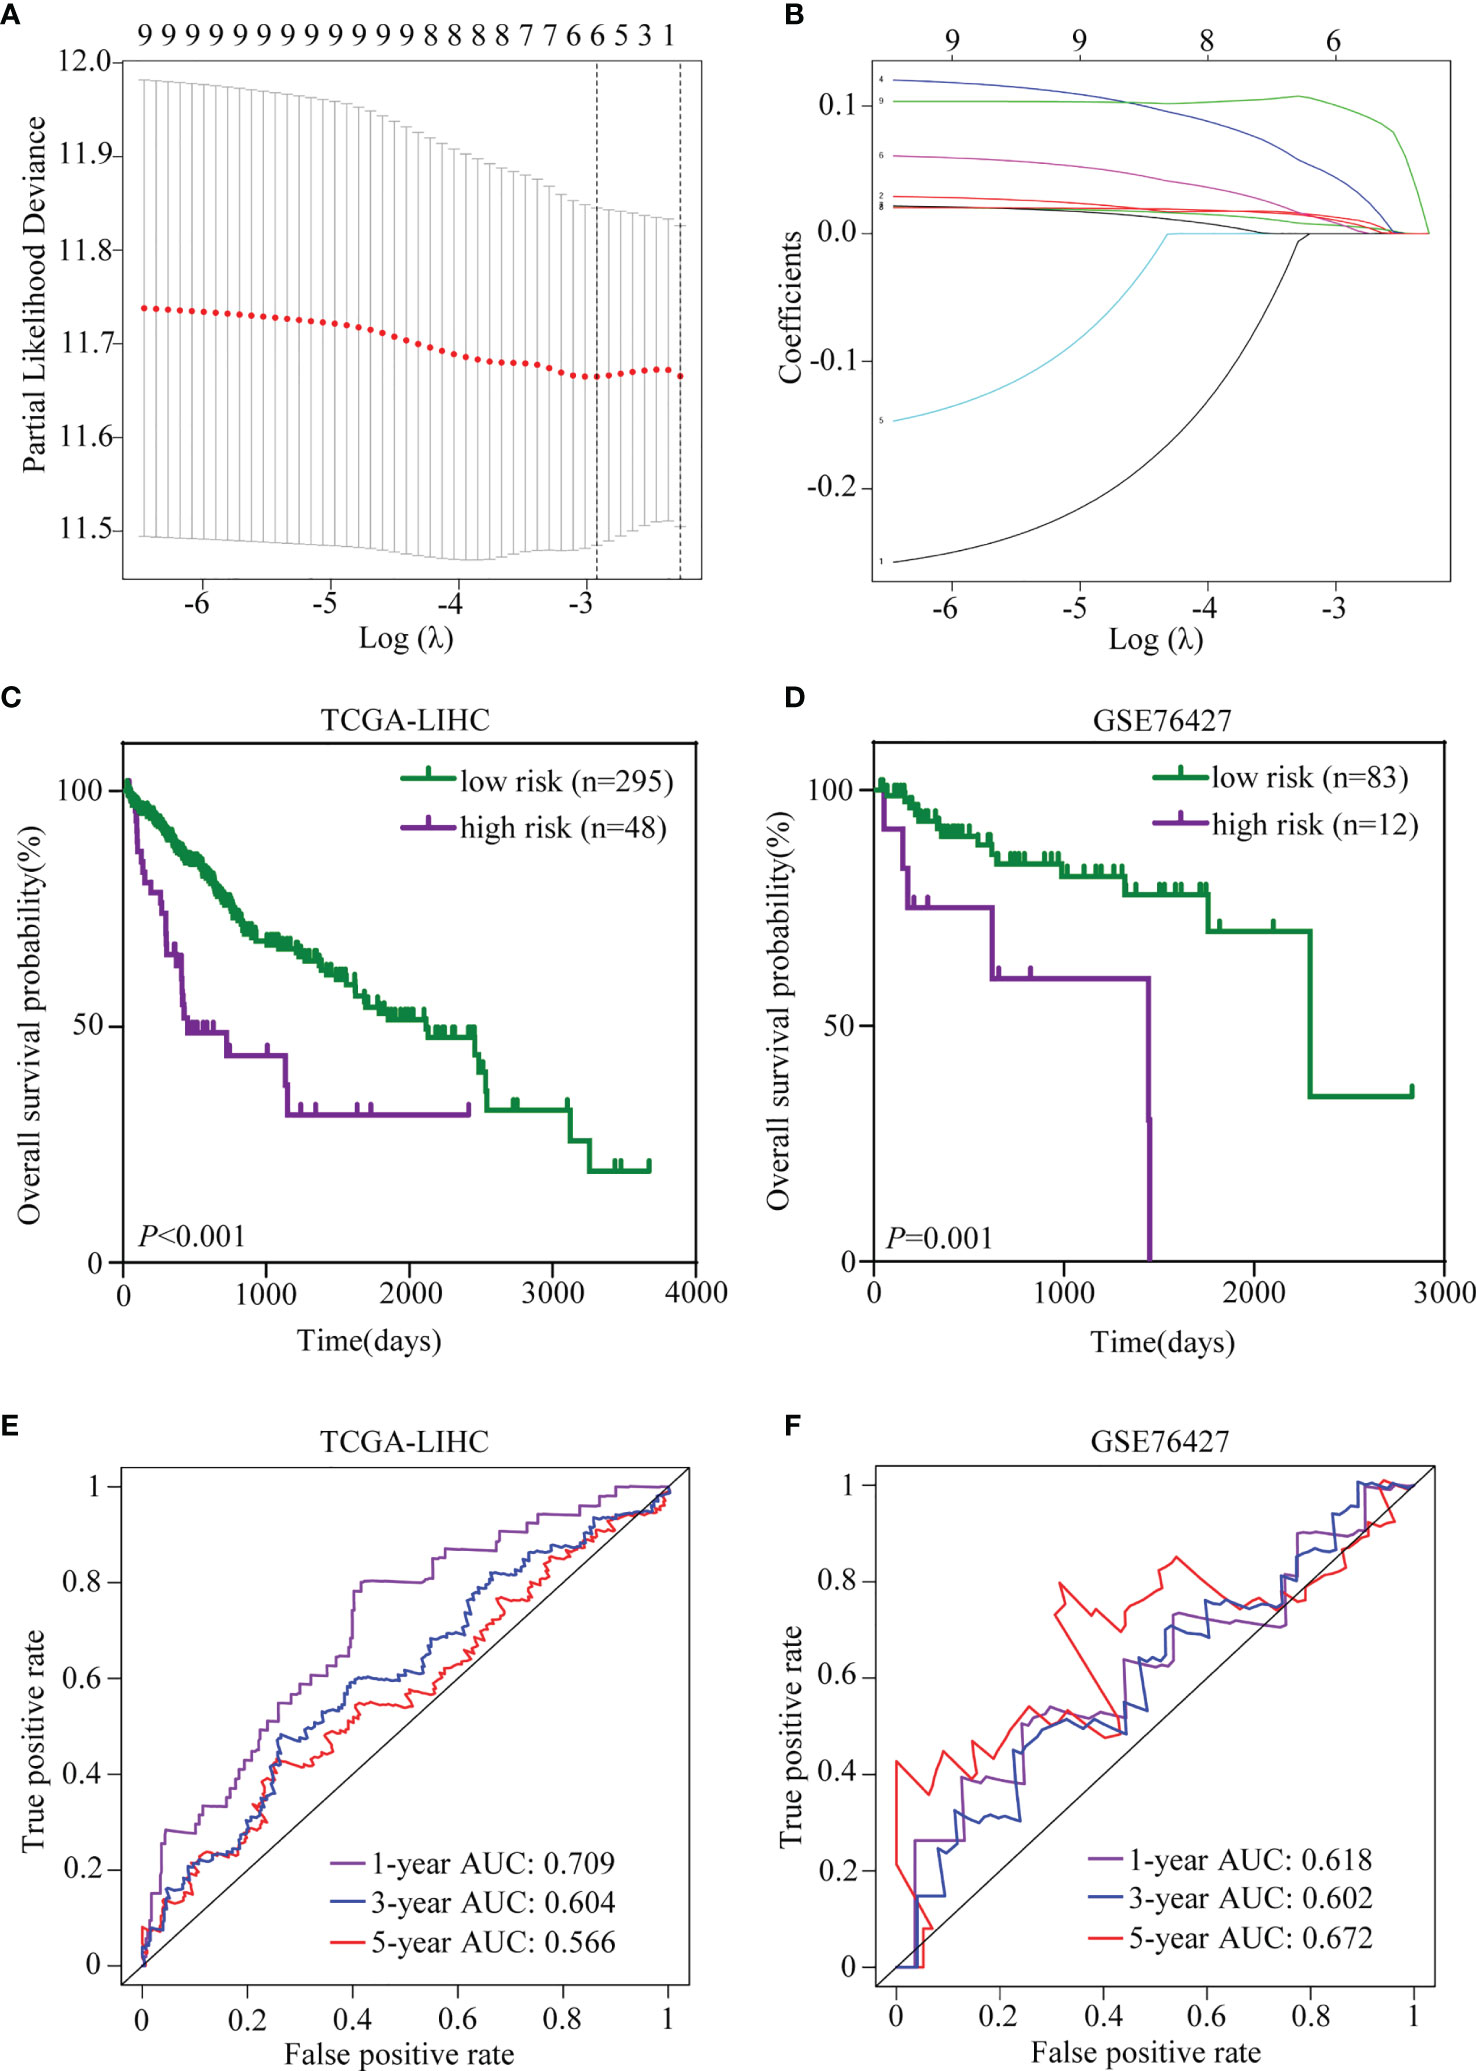
Figure 9 Establishment and validation of the TRIM family gene-based signature. (A) Tenfold cross-validation for selecting the optimal tuning parameter (λ) in the LASSO model. (B) LASSO coefficient profiles of the nine TRIM family members. (C, D) Kaplan–Meier plots of OS for HCC patients based on the TRIM family gene-based signature in TCGA-LIHC (C) and GSE76427 (D) cohorts. (E, F) Time-dependent ROC curves for OS of the TRIM family gene-based signature in TCGA-LIHC (E) and GSE76427 (F) cohorts. TRIM, tripartite motif; LASSO, least absolute shrinkage and selection operator; OS, overall survival; HCC, hepatocellular carcinoma; TCGA-LIHC, The Cancer Genome Atlas Liver Hepatocellular Carcinoma; ROC, receiver operating characteristic.
Univariate and Multivariate Cox Regression Analyses and Subgroup Analyses of the Signature
A total of 317 patients in TCGA-LIHC with complete clinical information, including age, gender, grade, TNM stage, T stage, N stage, and M stage, and 94 patients in GSE76427 with sufficient information on age, gender, TNM stage, and BCLC stage were included for subsequent analyses. In TCGA-LIHC cohort, the univariate and multivariate Cox regression analyses suggested that the risk score was an independent predictor for OS (Table 1). To investigate whether the prognostic signature was applicable to other clinical parameters, all patients were divided into subgroups according to the clinical parameters. Survival analyses in subgroups indicated that the signature was quite useful in several subgroups such as <60 years (p < 0.001), male (p < 0.001), G1–2 (p < 0.001), TNM stage III–IV (p < 0.001), T3–4 (p < 0.001), N0 (p < 0.001), and M0 (p < 0.001) in TCGA-LIHC cohort (Figure 10A). Similarly, the signature performed well in subgroups including ≥60 years (p = 0.007), male (p < 0.001), BCLC stage B–C (p = 0.012), and TNM stage I–II (p < 0.001) for OS prediction in GSE76427 (Figure 10B).
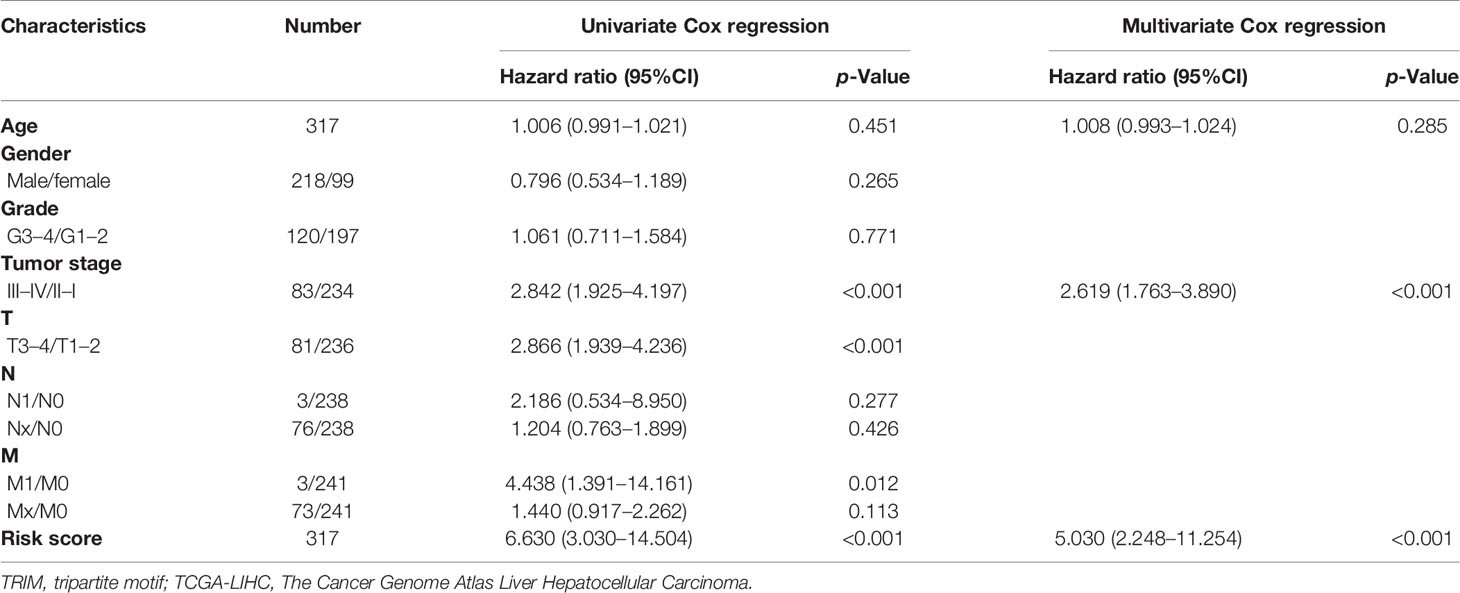
Table 1 Univariate and multivariate Cox regression analyses of the TRIM family gene-based signature and clinical parameters in TCGA-LIHC.
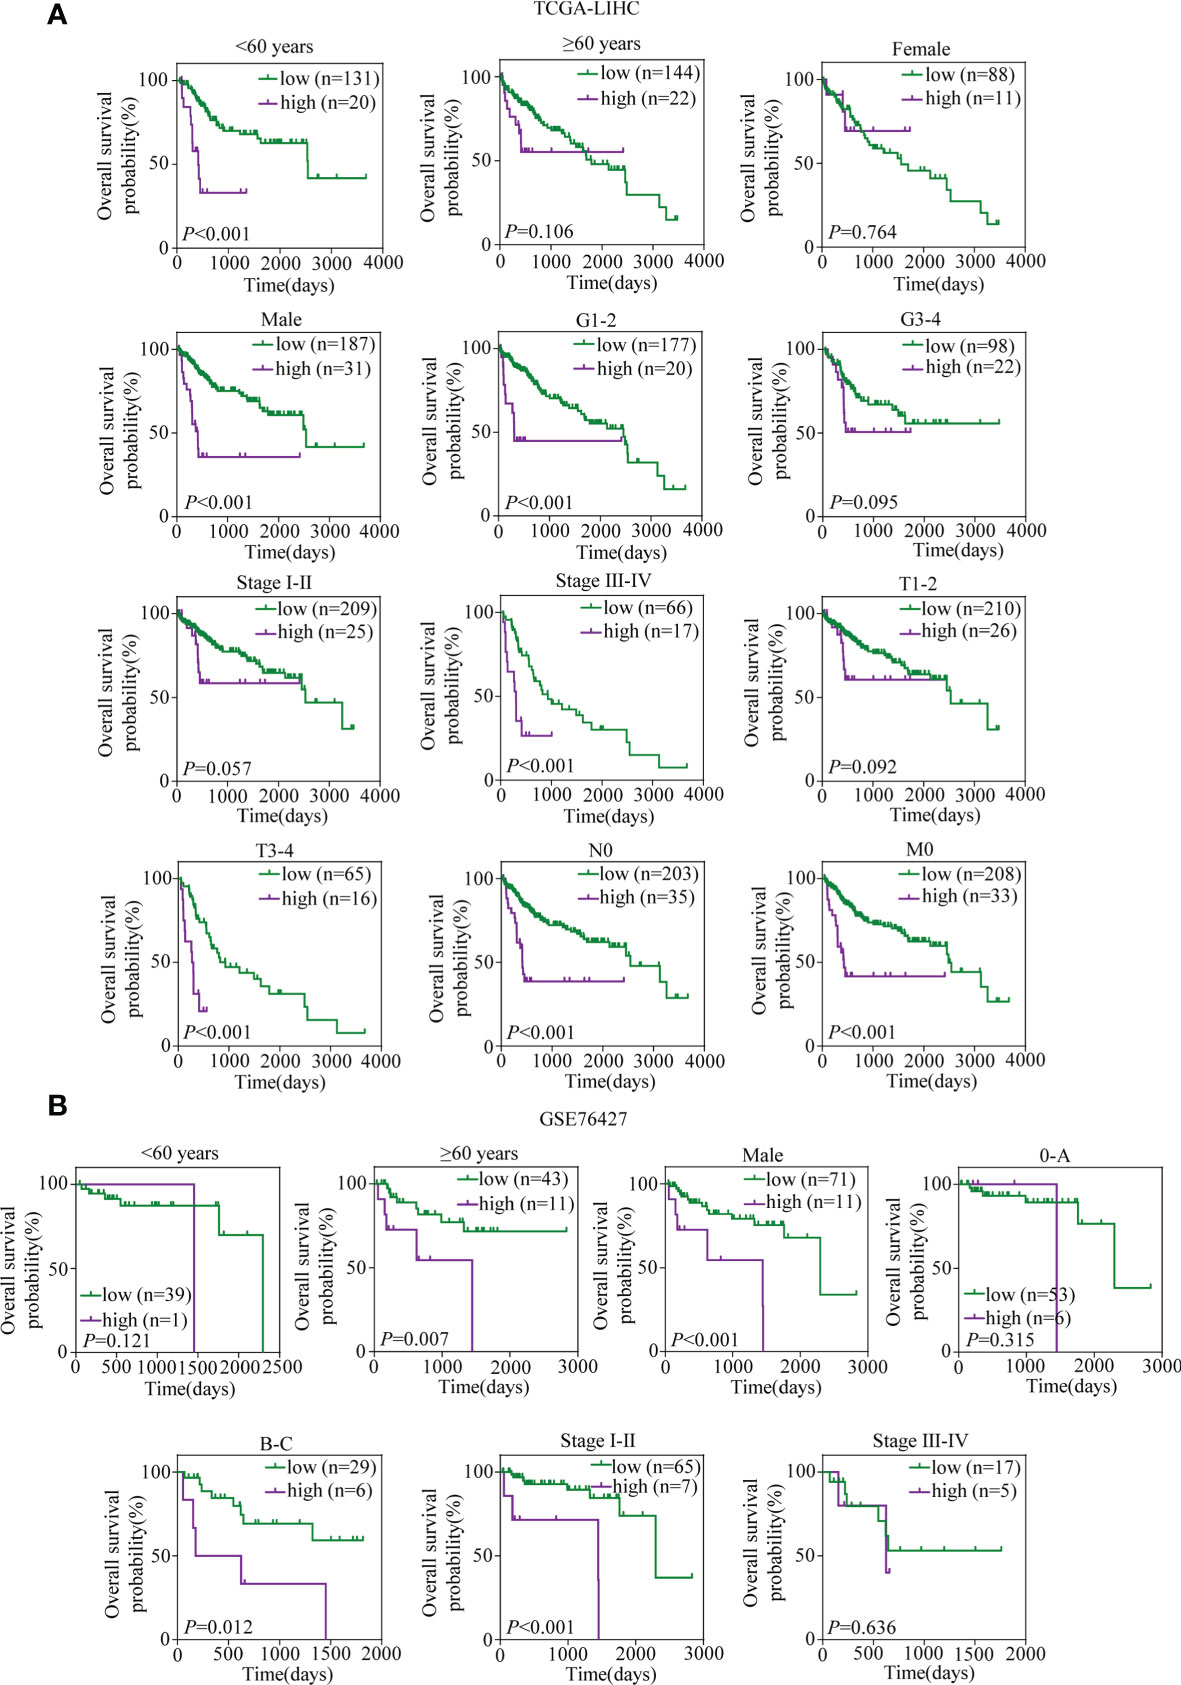
Figure 10 Kaplan–Meier survival analyses for prognostic values of the TRIM family gene-based signature in different subgroups stratified by clinical features. (A) Kaplan–Meier curves for OS of the six-TRIM family gene risk score level in subgroups including <60 years, ≥60 years, female, male, G1–2, G3–4, stage I–II, stage III–IV, T1–2, T3–4, N0, and M0 in TCGA-LIHC cohort. (B) Kaplan–Meier curves for OS of the six-TRIM family gene risk score level in subgroups including <60 years, ≥60 years, male, 0–A, B–C stage I–II, and stage III–IV in GSE76427. TRIM, tripartite motif; OS, overall survival; TCGA-LIHC, The Cancer Genome Atlas Liver Hepatocellular Carcinoma.
Correlations Between the Signature and Clinical Factors
It was illustrated that the risk score was correlated with the clinical parameters in TCGA-LIHC. There was a higher percentage of the high-grade G3–4 cases in the high-risk group than in the low-risk group (52.4% vs. 35.6%, p = 0.037, Figure 11A, Supplementary Table 2). Similar results could be observed when referring to TNM stage (40.5% vs. 24.0%, p = 0.024) and T stage (38.1% vs. 23.6%, p = 0.045). In the GSE76427 cohort, there were more ≥60-year cases in the high-risk group than in the low-risk group (91.7% vs. 52.4%, p = 0.010, Figure 11A, Supplementary Table 3). What is more, the risk score was found to be roughly increased in patients with higher grade (p = 0.001), TNM stage (p = 0.002), and T stage (p = 0.003) in TCGA-LIHC (Figure 11B).
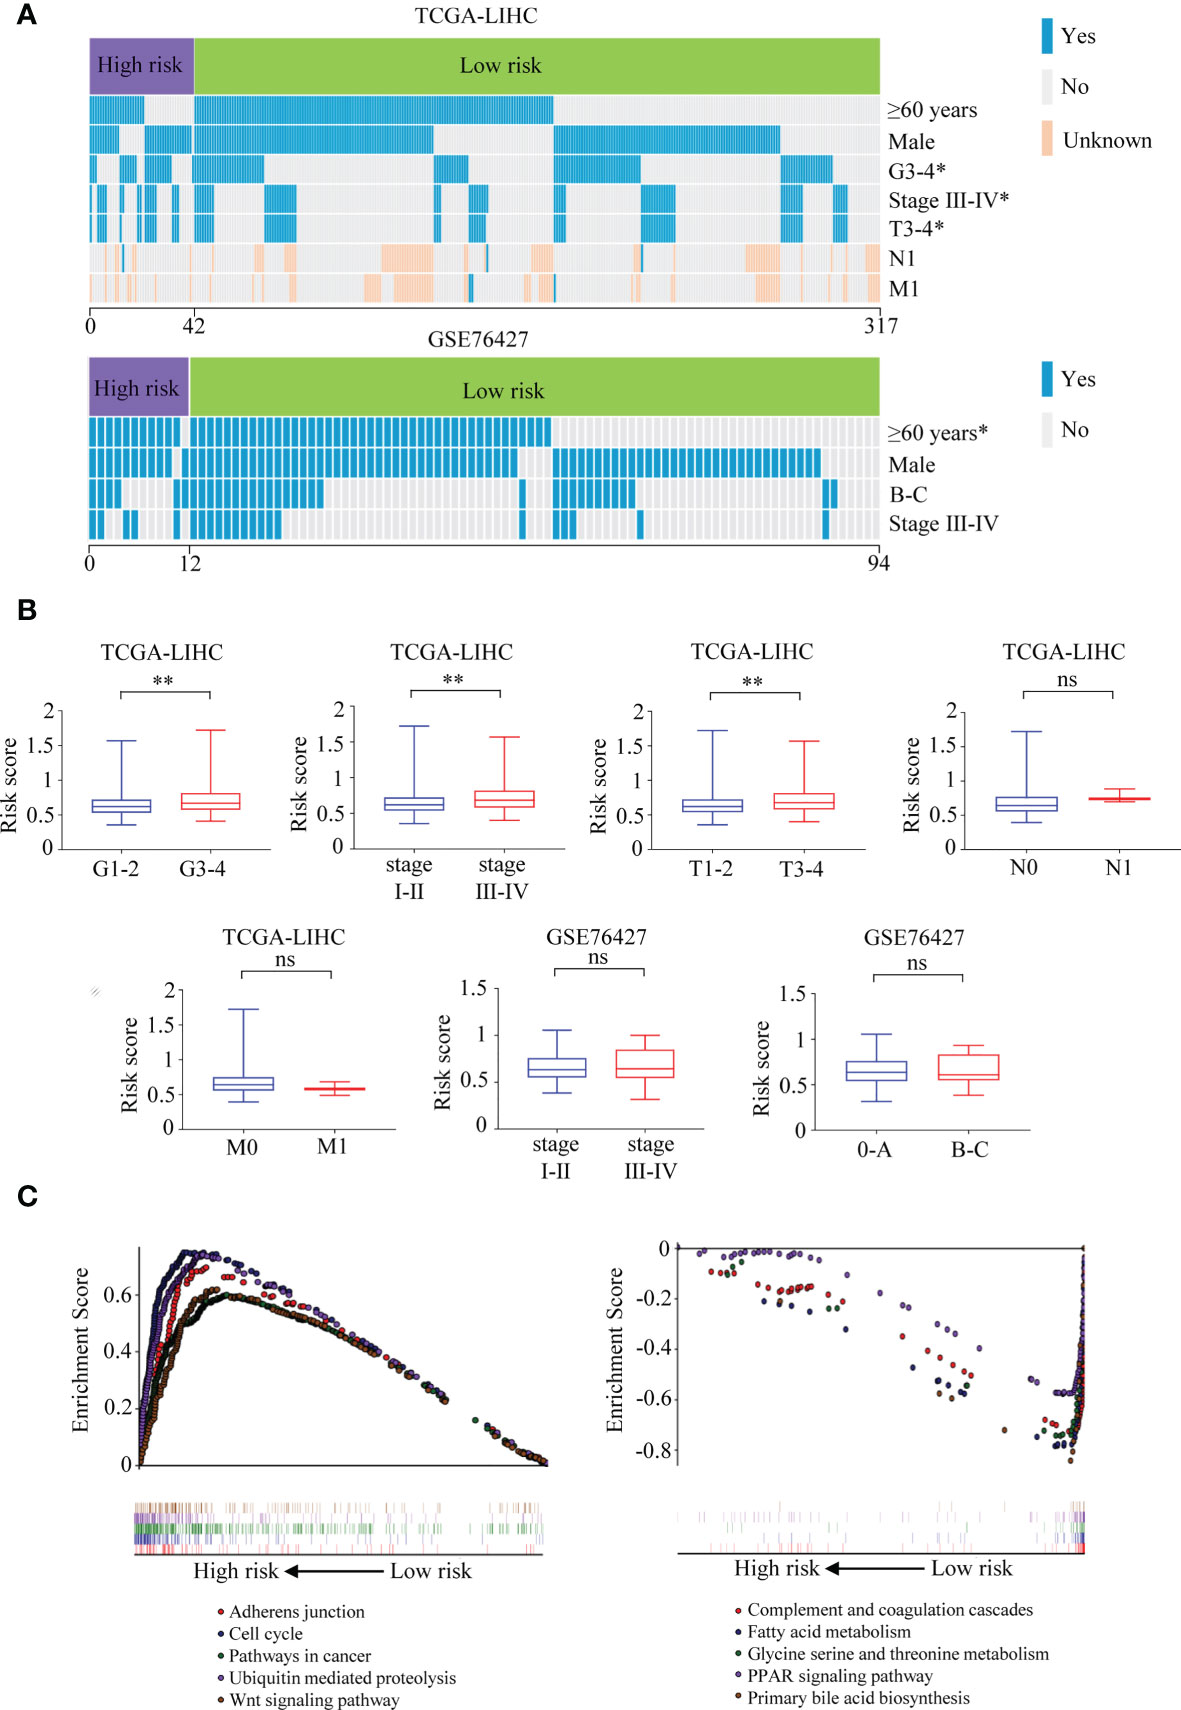
Figure 11 Correlations between the six-TRIM family gene risk score and clinical characteristics and GSEA for the signature. (A) Heatmaps describe the associations between the six-TRIM family gene risk score and clinical factors in TCGA-LIHC and GSE76427 cohorts. (B) Distributions and comparisons of the six-TRIM family gene risk score among different subgroups stratified by grade, TNM stage, T stage, N stage, and M stage in TCGA-LIHC cohort and TNM stage and BCLC stage in GSE76427 cohort. (C) GSEA shows the enriched KEGG pathways in the high- and low-risk groups based on the TRIM family gene-based signature. ns, no significance; *p < 0.05; **p < 0.01. TRIM, tripartite motif; GSEA, Gene Set Enrichment Analysis; TCGA-LIHC, The Cancer Genome Atlas Liver Hepatocellular Carcinoma; KEGG, Kyoto Encyclopedia of Genes and Genomes.
Gene Set Enrichment Analysis
Comparing the high- and low-risk groups in TCGA-LIHC cohort (n = 343), Gene Set Enrichment Analysis (GSEA) was performed to explore the underlying mechanisms of the six-gene-based prognostic signature. The enriched KEGG pathways in the high-risk group were adherens junction, cell cycle, pathways in cancer, ubiquitin-mediated proteolysis, Wnt signaling pathway, and so on (Figure 11C). In the low-risk group, complement and coagulation cascades, patty acid metabolism, glycine serine and threonine metabolism, PPAR signaling pathway, primary bile acid biosynthesis, and other KEGG pathways were significantly enriched (Figure 11C).
Establishment and Estimation of the TRIM Family Gene-Based Nomogram
Considering the results of the univariate and multivariate Cox regression analyses and clinical evidence of some parameters such as age and TNM stage for OS prediction, a nomogram was built by integrating risk score, age, and TNM stage to predict OS for patients with HCC (Figure 12A) based on TCGA-LIHC cohort. C-index, ROC curve, and calibration curve were applied to assess the discrimination and calibration for the nomogram. The C-index of the nomogram was 0.694, and the AUCs were 0.775 at 1 year, 0.711 at 3 years, and 0.695 at 5 years; and the largest AUCs for OS prediction were presented when compared with the age, TNM stage, risk score, and the age + TNM stage model (Figures 12B–D), suggesting that including the TRIM family signature to the model could provide improvement for OS prediction in HCC and present better discrimination. The calibration plots indicated that the nomogram performed well in comparison with an ideal model (Figures 12E–G).
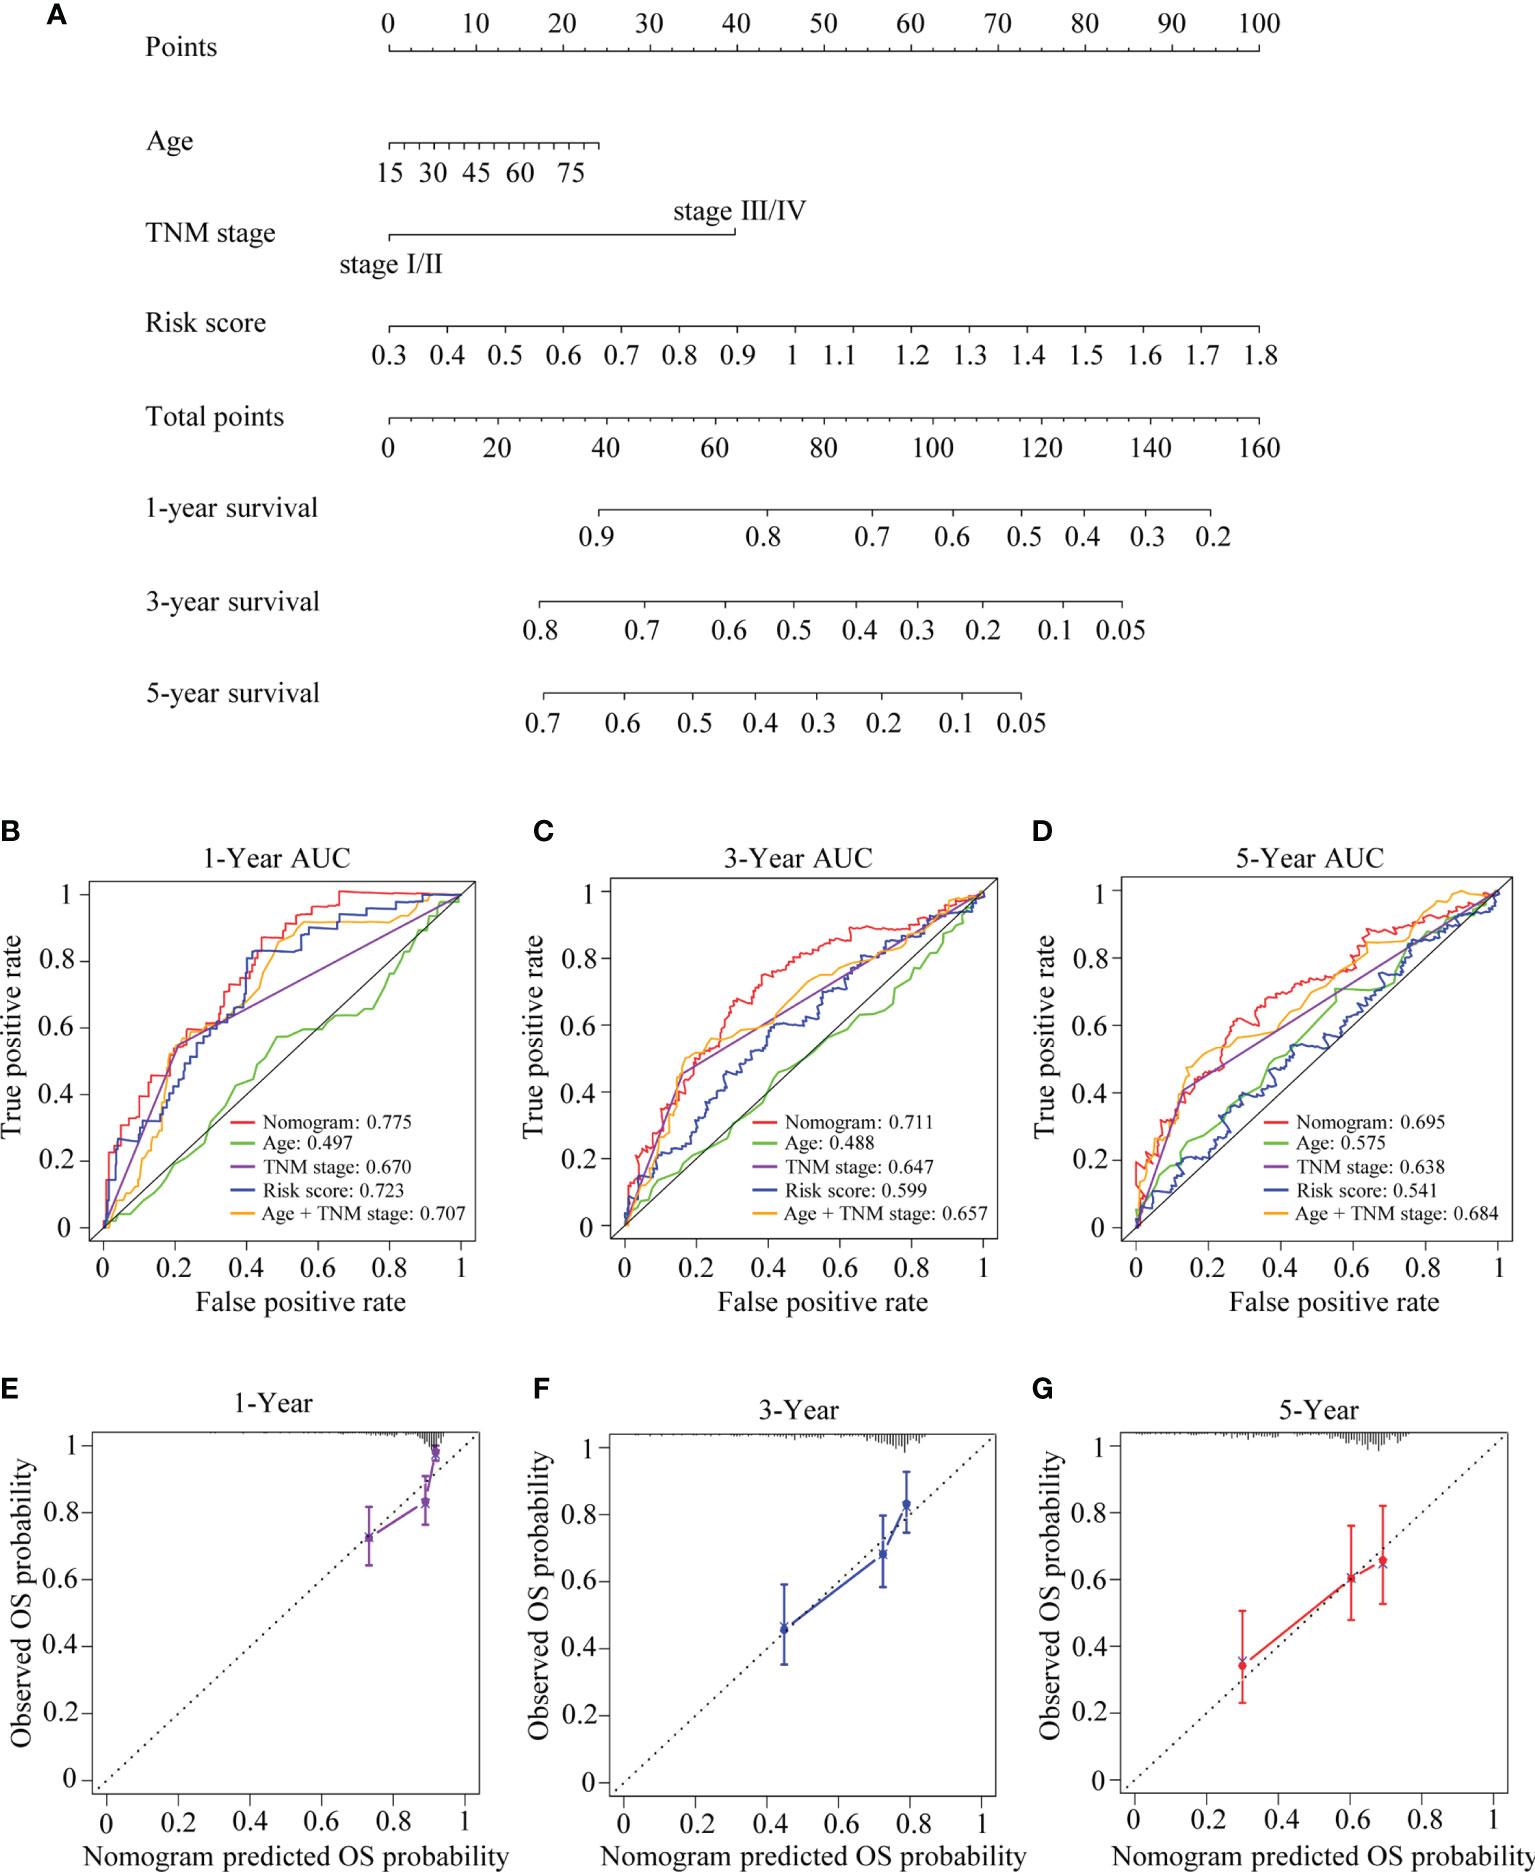
Figure 12 The developed nomogram for predicting OS in HCC. (A) The nomogram was built in TCGA-LIHC cohort with the six-TRIM family gene risk score, age, and TNM stage incorporated. (B–D) Time-dependent ROC curves for predicting 1- (B), 3- (C), and 5-year (D) OS based on the nomogram, age, TNM stage, risk score, or age + TNM stage in TCGA-LIHC cohort. (E–G) Calibration curves of the nomogram in terms of the agreement between predicted and observed 1- (E), 3- (F), and 5-year (G) OS. The relative 45° line represents an ideal prediction. Nomogram performance is indicated by the plot relative to the relative 45° line. TRIM, tripartite motif; OS, overall survival; HCC, hepatocellular carcinoma; TCGA-LIHC, The Cancer Genome Atlas Liver Hepatocellular Carcinoma; ROC, receiver operating characteristic.
Discussion
HCC remains a global health issue, attracting wide attention due to its high incidence and mortality and poor outcomes. It is of great clinical significance to investigate the potential therapeutic targets and prognostic biomarkers, improve the outcome prediction, and facilitate the individualized clinical management for HCC.
TRIM family members have attracted more and more attention because of their important roles in cancer. Increasing evidence indicates that TRIM family proteins act as regulators of oncoproteins or tumor suppressor proteins, thus regulating cell growth, migration, metabolism, autophagy, and other biological processes (12, 54, 55). Their abnormal expressions and potential mechanisms have been confirmed in diverse cancers. Exploration of the biological and prognostic values of TRIM family proteins in cancers has flourished. Similar to our study, Xia et al. investigated the relation between the TRIM family and the prognosis of melanoma by bioinformatics analyses and discovered that TRIM27 might be a prognostic biomarker in melanoma (56). What is more, by using TRIM family genes, Wu et al. built a prognostic risk model by using TRIM family genes with a good predictive performance for kidney renal clear cell carcinoma, indicating the outcome predictive values of TRIM family in kidney renal clear cell carcinoma (57). Although some studies have indicated the significant prognostic roles of TRIM family members in HCC (22, 58, 59), the whole picture of the prognostic values of TRIM family members remains poorly characterized. Here, we tried to investigate the prognostic values of the TRIM family in HCC.
Our study was an attempt to explore the implications of the TRIM family members in HCC by analyzing the publicly available data. The hub TRIM family members were selected based on the results of the survival analysis and LASSO regression. A total of nine TRIM family members were identified as prognosis-associated genes in HCC, and six members were included in the TRIM family signature for risk stratification of HCC patients. Subsequently, a nomogram integrating the prognostic signature and clinical parameters was formulated to help us predict OS for HCC patients more intuitively. These results indicated that the TRIM family signature has a certain value in facilitating individualized treatment and clinical decision-making. Investigating the prognostic values of TRIM family members in HCC is important for the stratification of patients with diverse outcomes.
The human TRIM3 gene maps to chromosome 11p15.5, a region containing numerous cancer-related genes (60). It was validated that overexpression of TRIM3 could induce G0/G1 phase arrest, reducing cell proliferation in liver cancer (60). Chao et al. reported that decreased TRIM3 expression was associated with poor prognosis in HCC (59). However, the previous reports were not consistent with our findings as shown in Figures 1B, C, which suggested that HCC patients with high TRIM3 expression yielded poor survival. Since this article only collected the TRIM3 expression and HCC patient information from online databases, the role of TRIM3 in liver cancer needs to be verified with more databases, cell lines, clinical samples, and experimental researches. TRIM5, acting as a retrovirus limiting factor, serves a critical function in autophagic degradation, protecting immune cells from infection with HIV-1 (61). By using bioinformatics analysis, Wang et al. developed a prognostic model of glioma based on immune-related genes including TRIM5, suggesting its role in glioma (62). But the role of TRIM5 in HCC has not been uncovered clearly. MID1, a microtubule-associated ubiquitin E3 ligase, has been reported to play an important role in cancer. Zhang et al. revealed that MID1 functioned as an oncogene in lung adenocarcinoma, involved in apoptosis, proliferation, and cell cycle arrest (63). Besides, it was reported that MID1 could act as a translational inducer of AR protein, which in turn decreased MID1 levels in response to androgen stimulation in prostate cancer (64). TRIM21, well known to play a role in innate immunity, systemic lupus erythematosus, and Sjögren’s syndrome, has been observed to participate in cancer proliferation (65). It was demonstrated that TRIM21 was highly expressed in HCC, and genetic ablation of TRIM21 resulted in protection from oxidative hepatic damage and decreased carcinogenesis in HCC (66). However, Ding et al. found that downregulation of TRIM21 was correlated with poor prognosis in HCC (67). Given the different roles of TRIM21 in HCC suggested above, its mechanisms in HCC need to be explored with more experimental researches in the lab. TRIM27 was originally characterized as a gene related to oncogenic rearrangements with the RET proto-oncogene (68). It has been shown that TRIM27 had an oncogenic role in HCC cells by promoting cell proliferation, migration, and invasion (69). TRIM32 has been reported to be involved in cancer development. TRIM32 could regulate UVB-induced keratinocyte apoptosis through induction of nuclear factor-κB by promoting Piasy ubiquitination and degradation (70). TRIM32 could promote tumorigenesis via ubiquitination and degradation of Abi2 (71). In HCC, overexpression of TRIM32 could promote cell cycle progression, induce oxaliplatin resistance, and predict poor prognosis (72). TRIM44 may function as a “USP-like TRIM” and promote cancer development by regulating de-ubiquitination and stabilization of oncogenes, and its overexpression could contribute to malignant outcomes in gastric cancer (73). In HCC, it was validated that TRIM44 overexpression correlated with shorter OS; facilitated cell proliferation, migration, invasion; and enhanced resistance to doxorubicin (74). TRIM47 has been found as a mediator for malignant progression in multiple cancers (75, 76). In renal cell carcinoma, TRIM47 exerted an E3 ligase activity, binding to P53 protein to increase its ubiquitination and degradation of P53. In pancreatic cancer, TRIM47 could promote the aerobic glycolysis by interacting with and ubiquitination of fructose-1,6-bisphosphatase (FBP1). Some reports demonstrated that TRIM72 could act as a tumor suppressor in cancer. A recent report by Fernández-Aceñero et al. has demonstrated that low immunohistochemical expression of TRIM72 could predict relapse in stage II colon carcinoma (77). TRIM72 was also revealed to inhibit tumor progression in tongue cancer by regulating PI3K-AKT signaling pathway (78). However, the role of TRIM47 and TRIM72 in HCC is not yet clear, and investigating the mechanisms of TRIM47 and TRIM72 in HCC may shed light upon further biological values. Collectively, the TRIM family was worthy of further investigation in HCC, and the prognosis-related genes should be characterized for both their roles in tumor progression and their values as therapeutic targets.
However, there were some limitations in our study that need to be taken into consideration. First, our studies were based on public databases, and the sample size of the public datasets or collected human tissue samples was relatively limited, so larger population and multi-centered clinical studies are needed to increase the reliability of our results. Second, since all the mechanical analyses were descriptive in our study, more experiment researches in the lab were crucial for understanding the potential roles of the TRIM family in HCC. Third, more clinical parameters concerning the progression and prognosis of HCC such as the presence of cirrhosis, Child-Pugh scoring, vascular invasion, or other parameters should be included to better understand the association between the TRIM family and HCC. Due to the limitations above, further well-designed studies are required to increase the credibility of our findings.
Conclusion
We systemically explored the roles of the TRIM family in HCC by a series of bioinformatics analyses. Our results may contribute to finding novel prognostic biomarkers and developing new therapeutic targets.
Data Availability Statement
Publicly available datasets were analyzed in this study. These data can be found here: TCGA database: https://portal.gdc.cancer.gov/; GEO database: https://www.ncbi.nlm.nih.gov/geo/.
Ethics Statement
The studies involving human participants were reviewed and approved by the Medical Ethics Committee of Nanfang Hospital, Southern Medical University. The patients/participants provided their written informed consent to participate in this study.
Author Contributions
JidW, SL, JJL, and AL contributed to the concept and design of the study. WD, YX, JYL, LH, and WT performed the data collection, data analyses, and experiments in the lab. MP, JZ, PY, and XW carried out the statistical analyses. JinW, ZW, and AL collected the human samples. XJ and PJ coordinated the project. LX and AL supervised the project. WD wrote and revised the manuscript. All authors contributed to the article and approved the submitted version.
Funding
This work was supported by grants from the National Natural Science Foundation of China (Nos. 81772964, 81974448, and 82073066), the President Foundation of Nanfang Hospital, Southern Medical University (No. 2020C005), National Major New Drug Creation Science and Technology Major Special Fund Funding Project (No. 2020ZX09201017), Guangdong gastrointestinal disease research center (No. 2017B020209003), the Special Scientific Research Fund of Public Welfare Profession of National Health and Family Planning Commission (No. 201502026), and Shenzhen Science and Technology Innovation Commission (Nos. JCYJ20180306170328854 and JCYJ20210324135005013).
Conflict of Interest
The authors declare that the research was conducted in the absence of any commercial or financial relationships that could be construed as a potential conflict of interest.
Publisher’s Note
All claims expressed in this article are solely those of the authors and do not necessarily represent those of their affiliated organizations, or those of the publisher, the editors and the reviewers. Any product that may be evaluated in this article, or claim that may be made by its manufacturer, is not guaranteed or endorsed by the publisher.
Acknowledgments
We appreciate the generous support of the Guangdong Provincial Key Laboratory of Gastroenterology, Department of Gastroenterology, Nanfang Hospital, Southern Medical University, and the Department of Gastroenterology, Longgang District People’s Hospital, Shenzhen.
Supplementary Material
The Supplementary Material for this article can be found online at: https://www.frontiersin.org/articles/10.3389/fonc.2021.767644/full#supplementary-material
Supplementary Figure 1 | Univariate Cox regression analyses of the five prognostic biomarkers (PDCD10, TFAP4, LYRM4, VPS35 and PPM1D) in TCGA-LIHC (A) and GSE76427 cohorts (B).
Supplementary Figure 2 | Risk score analyses including the risk score distributions, survival statuses and gene expression levels. (A, B) The profiles of the risk score distributions, survival statuses and heatmaps of gene expression levels in TCGA-LIHC (A) and GSE76427 (B).
Supplementary Table 1 | List of the primers used for qRT-PCR.
Supplementary Table 2 | Clinical characteristics of the TCGA-LIHC cohort patients in different risk groups based on the TRIM family gene-based signature.
Supplementary Table 3 | Clinical characteristics of the GSE76427 cohort patients in different risk groups based on the TRIM family gene-based signature.
References
1. Bray F, Ferlay J, Soerjomataram I, Siegel RL, Torre LA, Jemal A. Global Cancer Statistics 2018: GLOBOCAN Estimates of Incidence and Mortality Worldwide for 36 Cancers in 185 Countries. CA Cancer J Clin (2018) 68(6):394–424. doi: 10.3322/caac.21492
2. El-Serag HB, Rudolph KL. Hepatocellular Carcinoma: Epidemiology and Molecular Carcinogenesis. Gastroenterology (2007) 132(7):2557–76. doi: 10.1053/j.gastro.2007.04.061
3. Li J, Han X, Yu X, Xu Z, Yang G, Liu B, et al. Clinical Applications of Liquid Biopsy as Prognostic and Predictive Biomarkers in Hepatocellular Carcinoma: Circulating Tumor Cells and Circulating Tumor DNA. J Exp Clin Cancer Res (2018) 37(1):213. doi: 10.1186/s13046-018-0893-1
4. Zheng J, Kuk D, Gonen M, Balachandran VP, Kingham TP, Allen PJ, et al. Actual 10-Year Survivors After Resection of Hepatocellular Carcinoma. Ann Surg Oncol (2017) 24(5):1358–66. doi: 10.1245/s10434-016-5713-2
5. Joliat GR, Allemann P, Labgaa I, Demartines N, Halkic N. Treatment and Outcomes of Recurrent Hepatocellular Carcinomas. Langenbecks Arch Surg (2017) 402(5):737–44. doi: 10.1007/s00423-017-1582-9
6. Reymond A, Meroni G, Fantozzi A, Merla G, Cairo S, Luzi L, et al. The Tripartite Motif Family Identifies Cell Compartments. EMBO J (2001) 20(9):2140–51. doi: 10.1093/emboj/20.9.2140
7. Torok M, Etkin LD. Two B or Not Two B? Overview of the Rapidly Expanding B-Box Family of Proteins. Differentiation (2001) 67(3):63–71. doi: 10.1046/j.1432-0436.2001.067003063.x
8. Meroni G, Diez-Roux G. TRIM/RBCC, A Novel Class of ‘Single Protein RING Finger’ E3 Ubiquitin Ligases. Bioessays (2005) 27(11):1147–57. doi: 10.1002/bies.20304
9. Chen Y, Sun J, Ma J. Proliferation and Invasion of Ovarian Cancer Cells Are Suppressed by Knockdown of TRIM11. Oncol Lett (2017) 14(2):2125–30. doi: 10.3892/ol.2017.6432
10. Tang SL, Gao YL, Wen-Zhong H. Knockdown of TRIM37 Suppresses the Proliferation, Migration and Invasion of Glioma Cells Through the Inactivation of PI3K/Akt Signaling Pathway. BioMed Pharmacother (2018) 99:59–64. doi: 10.1016/j.biopha.2018.01.054
11. Chen W, Zhao K, Miao C, Xu A, Zhang J, Zhu J, et al. Silencing Trim59 Inhibits Invasion/Migration and Epithelial-to-Mesenchymal Transition via TGF-Beta/Smad2/3 Signaling Pathway in Bladder Cancer Cells. Onco Targets Ther (2017) 10:1503–12. doi: 10.2147/OTT.S130139
12. Wang J, Fang Y, Liu T. TRIM32 Promotes the Growth of Gastric Cancer Cells Through Enhancing AKT Activity and Glucose Transportation. BioMed Res Int (2020) 2020:4027627. doi: 10.1155/2020/4027627
13. Hatakeyama S. TRIM Family Proteins: Roles in Autophagy, Immunity, and Carcinogenesis. Trends Biochem Sci (2017) 42(4):297–311. doi: 10.1016/j.tibs.2017.01.002
14. Groner AC, Cato L, de Tribolet-Hardy J, Bernasocchi T, Janouskova H, Melchers D, et al. TRIM24 Is an Oncogenic Transcriptional Activator in Prostate Cancer. Cancer Cell (2016) 29(6):846–58. doi: 10.1016/j.ccell.2016.04.012
15. Pineda CT, Ramanathan S, Fon Tacer K, Weon JL, Potts MB, Ou YH, et al. Degradation of AMPK by a Cancer-Specific Ubiquitin Ligase. Cell (2015) 160(4):715–28. doi: 10.1016/j.cell.2015.01.034
16. Masuda Y, Takahashi H, Sato S, Tomomori-Sato C, Saraf A, Washburn MP, et al. TRIM29 Regulates the Assembly of DNA Repair Proteins Into Damaged Chromatin. Nat Commun (2015) 6:7299. doi: 10.1038/ncomms8299
17. Han Y, Tan Y, Zhao Y, Zhang Y, He X, Yu L, et al. TRIM23 Overexpression is a Poor Prognostic Factor and Contributes to Carcinogenesis in Colorectal Cancer. J Cell Mol Med (2020) 24(10):5491–500. doi: 10.1111/jcmm.15203
18. Han X, Huang C, Qu X, Liu S, Yang X, Wang Y, et al. Tripartite Motif-Containing 15 Overexpression in Non-Small Cell Lung Cancer is Associated With Poor Patient Prognoses. J Cancer (2019) 10(4):843–52. doi: 10.7150/jca.27856
19. Wang Y, Zhou Z, Wang X, Zhang X, Chen Y, Bai J, et al. TRIM59 Is a Novel Marker of Poor Prognosis and Promotes Malignant Progression of Ovarian Cancer by Inducing Annexin A2 Expression. Int J Biol Sci (2018) 14(14):2073–82. doi: 10.7150/ijbs.28757
20. Xia Y, Wei Z, Huang W, Wei X, He Y. Trim47 Overexpression Correlates With Poor Prognosis in Gastric Cancer. Neoplasma (2021) 68(2):307–16. doi: 10.4149/neo_2020_200708N706
21. Zhou W, Chen H, Ruan Y, Zeng X, Liu F. High Expression of TRIM15 Is Associated With Tumor Invasion and Predicts Poor Prognosis in Patients With Gastric Cancer. J Invest Surg (2021) 34(8):853–61. doi: 10.1080/08941939.2019.1705443
22. Liu Y, Tao S, Liao L, Li Y, Li H, Li Z, et al. TRIM25 Promotes the Cell Survival and Growth of Hepatocellular Carcinoma Through Targeting Keap1-Nrf2 Pathway. Nat Commun (2020) 11(1):348. doi: 10.1038/s41467-019-14190-2
23. Ma X, Ma X, Qiu Y, Zhu L, Lin Y, You Y, et al. TRIM50 Suppressed Hepatocarcinoma Progression Through Directly Targeting SNAIL for Ubiquitous Degradation. Cell Death Dis (2018) 9(6):608. doi: 10.1038/s41419-018-0644-4
24. Herquel B, Ouararhni K, Khetchoumian K, Ignat M, Teletin M, Mark M, et al. Transcription Cofactors TRIM24, TRIM28, and TRIM33 Associate to Form Regulatory Complexes That Suppress Murine Hepatocellular Carcinoma. Proc Natl Acad Sci U S A (2011) 108(20):8212–7. doi: 10.1073/pnas.1101544108
25. Grinchuk OV, Yenamandra SP, Iyer R, Singh M, Lee HK, Lim KH, et al. Tumor-Adjacent Tissue Co-Expression Profile Analysis Reveals Pro-Oncogenic Ribosomal Gene Signature for Prognosis of Resectable Hepatocellular Carcinoma. Mol Oncol (2018) 12(1):89–113. doi: 10.1002/1878-0261.12153
26. Therneau TM, Grambsch PM. Modeling Survival Data: Extending the Cox Model. New York: Springer (2000).
27. Therneau TM. A Package for Survival Analysis in R. R package version 3.1-11 (2020). Available at: https://CRAN.R-project.org/package=survival [Accessed April 16, 2020].
28. Camp RL, Dolled-Filhart M, Rimm DL. X-Tile: A New Bio-Informatics Tool for Biomarker Assessment and Outcome-Based Cut-Point Optimization. Clin Cancer Res (2004) 10(21):7252–9. doi: 10.1158/1078-0432.CCR-04-0713
29. Kolde R. Pheatmap: Pretty Heatmaps. R package version 1.0.12 (2019). Avaialble at: https://CRAN.R-project.org/package=pheatmap [Accessed April 18, 2020].
30. Wei T, Simko V. R package “corrplot”: Visualization of a Correlation Matrix. Version 0.84 (2017). Available at: https://github.com/taiyun/corrplot [Accessed April 18, 2020].
31. Uhlen M, Zhang C, Lee S, Sjostedt E, Fagerberg L, Bidkhori G, et al. A Pathology Atlas of the Human Cancer Transcriptome. Science (2017) 357(6352):eaan2507. doi: 10.1126/science.aan2507
32. Uhlen M, Bjorling E, Agaton C, Szigyarto CA, Amini B, Andersen E, et al. A Human Protein Atlas for Normal and Cancer Tissues Based on Antibody Proteomics. Mol Cell Proteomics (2005) 4(12):1920–32. doi: 10.1074/mcp.M500279-MCP200
33. Gao J, Aksoy BA, Dogrusoz U, Dresdner G, Gross B, Sumer SO, et al. Integrative Analysis of Complex Cancer Genomics and Clinical Profiles Using the Cbioportal. Sci Signal (2013) 6(269):pl1. doi: 10.1126/scisignal.2004088
34. Kanehisa M, Goto S. KEGG: Kyoto Encyclopedia of Genes and Genomes. Nucleic Acids Res (2000) 28(1):27–30. doi: 10.1093/nar/28.1.27
35. Yu G, Wang LG, Han Y, He QY. Clusterprofiler: An R Package for Comparing Biological Themes Among Gene Clusters. OMICS (2012) 16(5):284–7. doi: 10.1089/omi.2011.0118
36. Yu G. Enrichplot: Visualization of Functional Enrichment Result. R package version 1.6.1. (2019). Available at: https://github.com/GuangchuangYu/enrichplot [Accessed April 20, 2020].
37. Szklarczyk D, Gable AL, Lyon D, Junge A, Wyder S, Huerta-Cepas J, et al. STRING V11: Protein-Protein Association Networks With Increased Coverage, Supporting Functional Discovery in Genome-Wide Experimental Datasets. Nucleic Acids Res (2019) 47(D1):D607–D13. doi: 10.1093/nar/gky1131
38. Zhou G, Soufan O, Ewald J, Hancock REW, Basu N, Xia J. NetworkAnalyst 3.0: A Visual Analytics Platform for Comprehensive Gene Expression Profiling and Meta-Analysis. Nucleic Acids Res (2019) 47(W1):W234–W41. doi: 10.1093/nar/gkz240
39. Shannon P, Markiel A, Ozier O, Baliga NS, Wang JT, Ramage D, et al. Cytoscape: A Software Environment for Integrated Models of Biomolecular Interaction Networks. Genome Res (2003) 13(11):2498–504. doi: 10.1101/gr.1239303
40. Consortium EP. An Integrated Encyclopedia of DNA Elements in the Human Genome. Nature (2012) 489(7414):57–74. doi: 10.1038/nature11247
41. Vlachos IS, Paraskevopoulou MD, Karagkouni D, Georgakilas G, Vergoulis T, Kanellos I, et al. DIANA-TarBase V7.0: Indexing More Than Half a Million Experimentally Supported miRNA:mRNA Interactions. Nucleic Acids Res (2015) 43(Database issue):D153–9. doi: 10.1093/nar/gku1215
42. Li T, Fan J, Wang B, Traugh N, Chen Q, Liu JS, et al. TIMER: A Web Server for Comprehensive Analysis of Tumor-Infiltrating Immune Cells. Cancer Res (2017) 77(21):e108–e10. doi: 10.1158/0008-5472.CAN-17-0307
43. Friedman J, Hastie T, Tibshirani R. Regularization Paths for Generalized Linear Models via Coordinate Descent. J Stat Softw (2010) 33(1):1–22.
44. Heagerty PJ, Lumley T, Pepe MS. Time-Dependent ROC Curves for Censored Survival Data and a Diagnostic Marker. Biometrics (2000) 56(2):337–44. doi: 10.1111/j.0006-341x.2000.00337.x
45. Subramanian A, Tamayo P, Mootha VK, Mukherjee S, Ebert BL, Gillette MA, et al. Gene Set Enrichment Analysis: A Knowledge-Based Approach for Interpreting Genome-Wide Expression Profiles. Proc Natl Acad Sci U S A (2005) 102(43):15545–50. doi: 10.1073/pnas.0506580102
46. Wickham H. Ggplot2: Elegant Graphics for Data Analysis. New York: Springer-Verlag New York (2016).
47. Harrell FE Jr. Rms: Regression Modeling Strategies. R package version 5.1-4. (2019). Available at: https://CRAN.R-project.org/package=rms [Accessed April 23, 2020].
48. Sun B, Zhong FJ, Xu C, Li YM, Zhao YR, Cao MM, et al. Programmed Cell Death 10 Promotes Metastasis and Epithelial-Mesenchymal Transition of Hepatocellular Carcinoma via PP2Ac-Mediated YAP Activation. Cell Death Dis (2021) 12(9):849. doi: 10.1038/s41419-021-04139-z
49. Huang T, Chen QF, Chang BY, Shen LJ, Li W, Wu PH, et al. TFAP4 Promotes Hepatocellular Carcinoma Invasion and Metastasis via Activating the PI3K/AKT Signaling Pathway. Dis Markers (2019) 2019:7129214. doi: 10.1155/2019/7129214
50. Pang Y, Tan G, Yang X, Lin Y, Chen Y, Zhang J, et al. Iron-Sulphur Cluster Biogenesis Factor LYRM4 is a Novel Prognostic Biomarker Associated With Immune Infiltrates in Hepatocellular Carcinoma. Cancer Cell Int (2021) 21(1):463. doi: 10.1186/s12935-021-02131-3
51. Zhang G, Tang X, Liang L, Zhang W, Li D, Li X, et al. DNA and RNA Sequencing Identified a Novel Oncogene VPS35 in Liver Hepatocellular Carcinoma. Oncogene (2020) 39(16):3229–44. doi: 10.1038/s41388-020-1215-6
52. Yu Z, Song Y, Cai M, Jiang B, Zhang Z, Wang L, et al. PPM1D is a Potential Prognostic Biomarker and Correlates With Immune Cell Infiltration in Hepatocellular Carcinoma. Aging (Albany NY) (2021) 13(17):21294–308. doi: 10.18632/aging.203459
53. Qi Z, Yan F, Chen D, Xing W, Li Q, Zeng W, et al. Identification of Prognostic Biomarkers and Correlations With Immune Infiltrates Among cGAS-STING in Hepatocellular Carcinoma. Biosci Rep (2020) 40(10):BSR20202603. doi: 10.1042/BSR20202603
54. Lan Q, Tan X, He P, Li W, Tian S, Dong W. TRIM11 Promotes Proliferation, Migration, Invasion and EMT of Gastric Cancer by Activating Beta-Catenin Signaling. Onco Targets Ther (2021) 14:1429–40. doi: 10.2147/OTT.S289922
55. Hu J, Ding X, Tian S, Chu Y, Liu Z, Li Y, et al. TRIM39 Deficiency Inhibits Tumor Progression and Autophagic Flux in Colorectal Cancer via Suppressing the Activity of Rab7. Cell Death Dis (2021) 12(4):391. doi: 10.1038/s41419-021-03670-3
56. Xia Y, Zhao J, Yang C. Identification of Key Genes and Pathways for Melanoma in the TRIM Family. Cancer Med (2020) 9(23):8989–9005. doi: 10.1002/cam4.3545
57. Wu G, Xu Y, Li L, Li J, Ruan N, Dong J, et al. Tripartite-Motif Family Genes Associated With Cancer Stem Cells Affect Tumor Progression and can Assist in the Clinical Prognosis of Kidney Renal Clear Cell Carcinoma. Int J Med Sci (2020) 17(18):2905–16. doi: 10.7150/ijms.51260
58. Chen Y, Li L, Qian X, Ge Y, Xu G. High Expression of TRIM11 Correlates With Poor Prognosis in Patients With Hepatocellular Carcinoma. Clin Res Hepatol Gastroenterol (2017) 41(2):190–6. doi: 10.1016/j.clinre.2016.09.010
59. Chao J, Zhang XF, Pan QZ, Zhao JJ, Jiang SS, Wang Y, et al. Decreased Expression of TRIM3 is Associated With Poor Prognosis in Patients With Primary Hepatocellular Carcinoma. Med Oncol (2014) 31(8):102. doi: 10.1007/s12032-014-0102-9
60. Huang XQ, Zhang XF, Xia JH, Chao J, Pan QZ, Zhao JJ, et al. Tripartite Motif-Containing 3 (TRIM3) Inhibits Tumor Growth and Metastasis of Liver Cancer. Chin J Cancer (2017) 36(1):77. doi: 10.1186/s40880-017-0240-5
61. Mandell MA, Kimura T, Jain A, Johansen T, Deretic V. TRIM Proteins Regulate Autophagy: TRIM5 is a Selective Autophagy Receptor Mediating HIV-1 Restriction. Autophagy (2014) 10(12):2387–8. doi: 10.4161/15548627.2014.984278
62. Wang JJ, Wang H, Zhu BL, Wang X, Qian YH, Xie L, et al. Development of a Prognostic Model of Glioma Based on Immune-Related Genes. Oncol Lett (2021) 21(2):116. doi: 10.3892/ol.2020.12377
63. Zhang L, Li J, Lv X, Guo T, Li W, Zhang J. MID1-PP2A Complex Functions as New Insights in Human Lung Adenocarcinoma. J Cancer Res Clin Oncol (2018) 144(5):855–64. doi: 10.1007/s00432-018-2601-0
64. Kohler A, Demir U, Kickstein E, Krauss S, Aigner J, Aranda-Orgilles B, et al. A Hormone-Dependent Feedback-Loop Controls Androgen Receptor Levels by Limiting MID1, a Novel Translation Enhancer and Promoter of Oncogenic Signaling. Mol Cancer (2014) 13:146. doi: 10.1186/1476-4598-13-146
65. Alomari M. TRIM21 - A Potential Novel Therapeutic Target in Cancer. Pharmacol Res (2021) 165:105443. doi: 10.1016/j.phrs.2021.105443
66. Wang F, Zhang Y, Shen J, Yang B, Dai W, Yan J, et al. The Ubiquitin E3 Ligase TRIM21 Promotes Hepatocarcinogenesis by Suppressing the P62-Keap1-Nrf2 Antioxidant Pathway. Cell Mol Gastroenterol Hepatol (2021) 11(5):1369–85. doi: 10.1016/j.jcmgh.2021.01.007
67. Ding Q, He D, He K, Zhang Q, Tang M, Dai J, et al. Downregulation of TRIM21 Contributes to Hepatocellular Carcinoma Carcinogenesis and Indicates Poor Prognosis of Cancers. Tumour Biol (2015) 36(11):8761–72. doi: 10.1007/s13277-015-3572-2
68. Takahashi M, Ritz J, Cooper GM. Activation of a Novel Human Transforming Gene, Ret, by DNA Rearrangement. Cell (1985) 42(2):581–8. doi: 10.1016/0092-8674(85)90115-1
69. Gao D, Zhou Z, Huang H. miR-30b-3p Inhibits Proliferation and Invasion of Hepatocellular Carcinoma Cells via Suppressing PI3K/Akt Pathway. Front Genet (2019) 10:1274. doi: 10.3389/fgene.2019.01274
70. Albor A, El-Hizawi S, Horn EJ, Laederich M, Frosk P, Wrogemann K, et al. The Interaction of Piasy With Trim32, an E3-Ubiquitin Ligase Mutated in Limb-Girdle Muscular Dystrophy Type 2H, Promotes Piasy Degradation and Regulates UVB-Induced Keratinocyte Apoptosis Through NFkappaB. J Biol Chem (2006) 281(35):25850–66. doi: 10.1074/jbc.M601655200
71. Kano S, Miyajima N, Fukuda S, Hatakeyama S. Tripartite Motif Protein 32 Facilitates Cell Growth and Migration via Degradation of Abl-Interactor 2. Cancer Res (2008) 68(14):5572–80. doi: 10.1158/0008-5472.CAN-07-6231
72. Cui X, Lin Z, Chen Y, Mao X, Ni W, Liu J, et al. Upregulated TRIM32 Correlates With Enhanced Cell Proliferation and Poor Prognosis in Hepatocellular Carcinoma. Mol Cell Biochem (2016) 421(1-2):127–37. doi: 10.1007/s11010-016-2793-z
73. Kashimoto K, Komatsu S, Ichikawa D, Arita T, Konishi H, Nagata H, et al. Overexpression of TRIM44 Contributes to Malignant Outcome in Gastric Carcinoma. Cancer Sci (2012) 103(11):2021–6. doi: 10.1111/j.1349-7006.2012.02407.x
74. Zhu X, Wu Y, Miao X, Li C, Yin H, Yang S, et al. High Expression of TRIM44 is Associated With Enhanced Cell Proliferation, Migration, Invasion, and Resistance to Doxorubicin in Hepatocellular Carcinoma. Tumour Biol (2016) 37(11):14615–28. doi: 10.1007/s13277-016-5316-3
75. Chen JX, Xu D, Cao JW, Zuo L, Han ZT, Tian YJ, et al. TRIM47 Promotes Malignant Progression of Renal Cell Carcinoma by Degrading P53 Through Ubiquitination. Cancer Cell Int (2021) 21(1):129. doi: 10.1186/s12935-021-01831-0
76. Li L, Yu Y, Zhang Z, Guo Y, Yin T, Wu H, et al. TRIM47 Accelerates Aerobic Glycolysis and Tumor Progression Through Regulating Ubiquitination of FBP1 in Pancreatic Cancer. Pharmacol Res (2021) 166:105429. doi: 10.1016/j.phrs.2021.105429
77. Fernandez-Acenero MJ, Cruz M, Sastre-Varela J, Casal JI, Nieto MAC, Del Puerto-Nevado L, et al. TRIM72 Immunohistochemical Expression Can Predict Relapse in Colorectal Carcinoma. Pathol Oncol Res (2020) 26(2):861–5. doi: 10.1007/s12253-019-00629-w
Keywords: hepatocellular carcinoma, TRIM family, signature, prognosis, LASSO
Citation: Dai W, Wang J, Wang Z, Xiao Y, Li J, Hong L, Pei M, Zhang J, Yang P, Wu X, Tang W, Jiang X, Jiang P, Xiang L, Li A, Lin J, Liu S and Wang J (2021) Comprehensive Analysis of the Prognostic Values of the TRIM Family in Hepatocellular Carcinoma. Front. Oncol. 11:767644. doi: 10.3389/fonc.2021.767644
Received: 01 September 2021; Accepted: 30 November 2021;
Published: 23 December 2021.
Edited by:
Bin Lu, Wenzhou Medical University, ChinaCopyright © 2021 Dai, Wang, Wang, Xiao, Li, Hong, Pei, Zhang, Yang, Wu, Tang, Jiang, Jiang, Xiang, Li, Lin, Liu and Wang. This is an open-access article distributed under the terms of the Creative Commons Attribution License (CC BY). The use, distribution or reproduction in other forums is permitted, provided the original author(s) and the copyright owner(s) are credited and that the original publication in this journal is cited, in accordance with accepted academic practice. No use, distribution or reproduction is permitted which does not comply with these terms.
*Correspondence: Jide Wang, amlkZXdhbmc1NUAxNjMuY29t; Side Liu, bGl1c2lkZTIwMTFAMTYzLmNvbQ==; Jianjiao Lin, bGluamVhbmFAMTI2LmNvbQ==; Aimin Li, bGFtMDcyNUAxNjMuY29t