 Ming-zhe Xin1,2†
 Ying-ying Shi3,4†
 Chun-shen Li1,2
 Li-hua Zuo3,4
 Na Li5
 Li-wei Liu3,4
 He-xin Ma1,2
 Qiu-zheng Du3,4
 Peng Xue6
 Zhi Sun3,4*
 Hong-yu Zhao1,2*
- 1Department of Oral Emergency, The First Affiliated Hospital of Zhengzhou University· Stomatological Hospital of Henan Province, Zhengzhou, China
- 2School and Hospital of Stomatology of Zhengzhou University, Zhengzhou, China
- 3Department of Pharmacy, The First Affiliated Hospital of Zhengzhou University, Zhengzhou, China
- 4Henan Engineering Research Center of Clinical Mass Spectrometry for Precision Medicine, Zhengzhou, China
- 5Department of Prosthodontics, The First Affiliated Hospital of Zhengzhou University· Stomatological Hospital of Henan Province, Zhengzhou, China
- 6Health Management Center, The First Affiliated Hospital of Zhengzhou University· Stomatological Hospital of Henan Province, Zhengzhou, China
Objective: To explore metabolic biomarkers related to erosive and reticulated oral lichen planus (OLP) by non-targeted metabolomics methods and correlate metabolites with gene expression, and to investigate the pathological network pathways of OLP from the perspective of metabolism.
Methods: A total of 153 individuals were enrolled in this study, including 50 patients with erosive oral lichen planus (EOLP), 51 patients with reticulated oral lichen planus (ROLP), and 52 healthy controls (HC). The ultra-high-performance liquid chromatography quadrupole-Orbitrap high-resolution accurate mass spectrometry (UHPLC/Q-Orbitrap HRMS) was used to analyze the metabolites of 40 EOLP, 40 ROLP, and 40 HC samples, and the differential metabolic biomarkers were screened and identified. The regulatory genes were further screened through the shared metabolites between EOLP and ROLP, and cross-correlated with the OLP-related differential genes in the network database. A “gene-metabolite” network was constructed after finding the key differential genes. Finally, the diagnostic efficiency of the biomarkers was verified in the validation set and a diagnostic model was constructed.
Result: Compared with HC group, a total of 19 and 25 differential metabolites were identified in the EOLP group and the ROLP group, respectively. A total of 14 different metabolites were identified between EOLP and ROLP. Two diagnostic models were constructed based on these differential metabolites. There are 14 differential metabolites shared by EOLP and ROLP. The transcriptomics data showed 756 differentially expressed genes, and the final crossover network showed that 19 differential genes were associated with 12 metabolites. Enrichment analysis showed that alanine, aspartate and glutamate metabolism were closely associated with the pathogenesis of OLP.
Conclusion: The metabolic change of different types of OLP were clarified. The potential gene perturbation of OLP was provided. This study provided a strong support for further exploration of the pathogenic mechanism of OLP.
Introduction
Oral lichen planus (OLP) is one of the most common autoimmune inflammatory diseases (1). The latest research showed that OLP affects 1-2% of the world’s population (2). The clinical manifestations of OLP are diverse (3). The most common type of OLP was the reticulated type (ROLP), followed by the erosion type (EOLP). OLP is a potential malignant disease that can transform into oral squamous cell carcinoma (OSCC) (4, 5). Compared with other types of OLP, erosive OLP is more prone to malignant changes, with a malignant transformation rate of 1.4% (4, 5). Therefore, the early detection and treatment of OLP have great significance in the prevention of oral cancer development. At present, there is a lack of early, minimally invasive and objective screening method for OLP in clinical practice. The treatment of different types of OLP often uses the same strategy, and to a certain extent, the curative effect is poor. In recent years, accumulating evidence indicates the metabolic homeostatic changes in patients with OLP. By understanding the metabolism of different types of OLP, it will help us recognize different types of metabolic targets and open up new avenues for diagnosis and treatment of OLP.
Metabolomics methods have been widely used to characterize the metabolic change and identify the abnormal metabolism in patients with OLP. Yang et al. (6–8) identified multiple metabolic pathways affected by metabolite disorders in serum, urine and tissue samples of reticulated OLP, and constructed a reticulated OLP pathological network based on their findings. Cruz et al. (9)performed metabolomics analysis on erosive and reticulated OLP tissue samples, and found the capability of this technology to distinguish OLP tissue typing. Wang et al. (10) used large sample data to identify the serum metabolites of OLP, and established an OLP biomarker diagnostic model composed of glutamic acid, LysoPE(18:0) and taurine. However, there is no report on the use of liquid chromatography-mass spectrometry technology to comprehensively analyze the difference and connection of serum metabolites between EOLP, ROLP and healthy controls, and there is no correlation between OLP metabolism information and genetic data. The internal gene metabolism network pathway of OLP is not yet clear.
In this study, we select patients with EOLP and ROLP as the research subjects. We conduct an in-depth analysis of the metabolic characteristics of their serum samples using the UHPLC/Q-Orbitrap HRMS technology. We identify metabolic biomarkers that are highly correlated with EOLP and ROLP, and clarify the metabolic characteristics of different types of OLP. The common metabolites of EOLP and ROLP were further screened. The transcriptomics data was used to find out common metabolite-related genes and disease related genes. The key genes were used to construct an OLP “metabolite-gene” network to reveal the metabolic characteristics of OLP genes (Figure 1). This study will provide a basis for further exploration of the molecular mechanism of oral lichen planus.
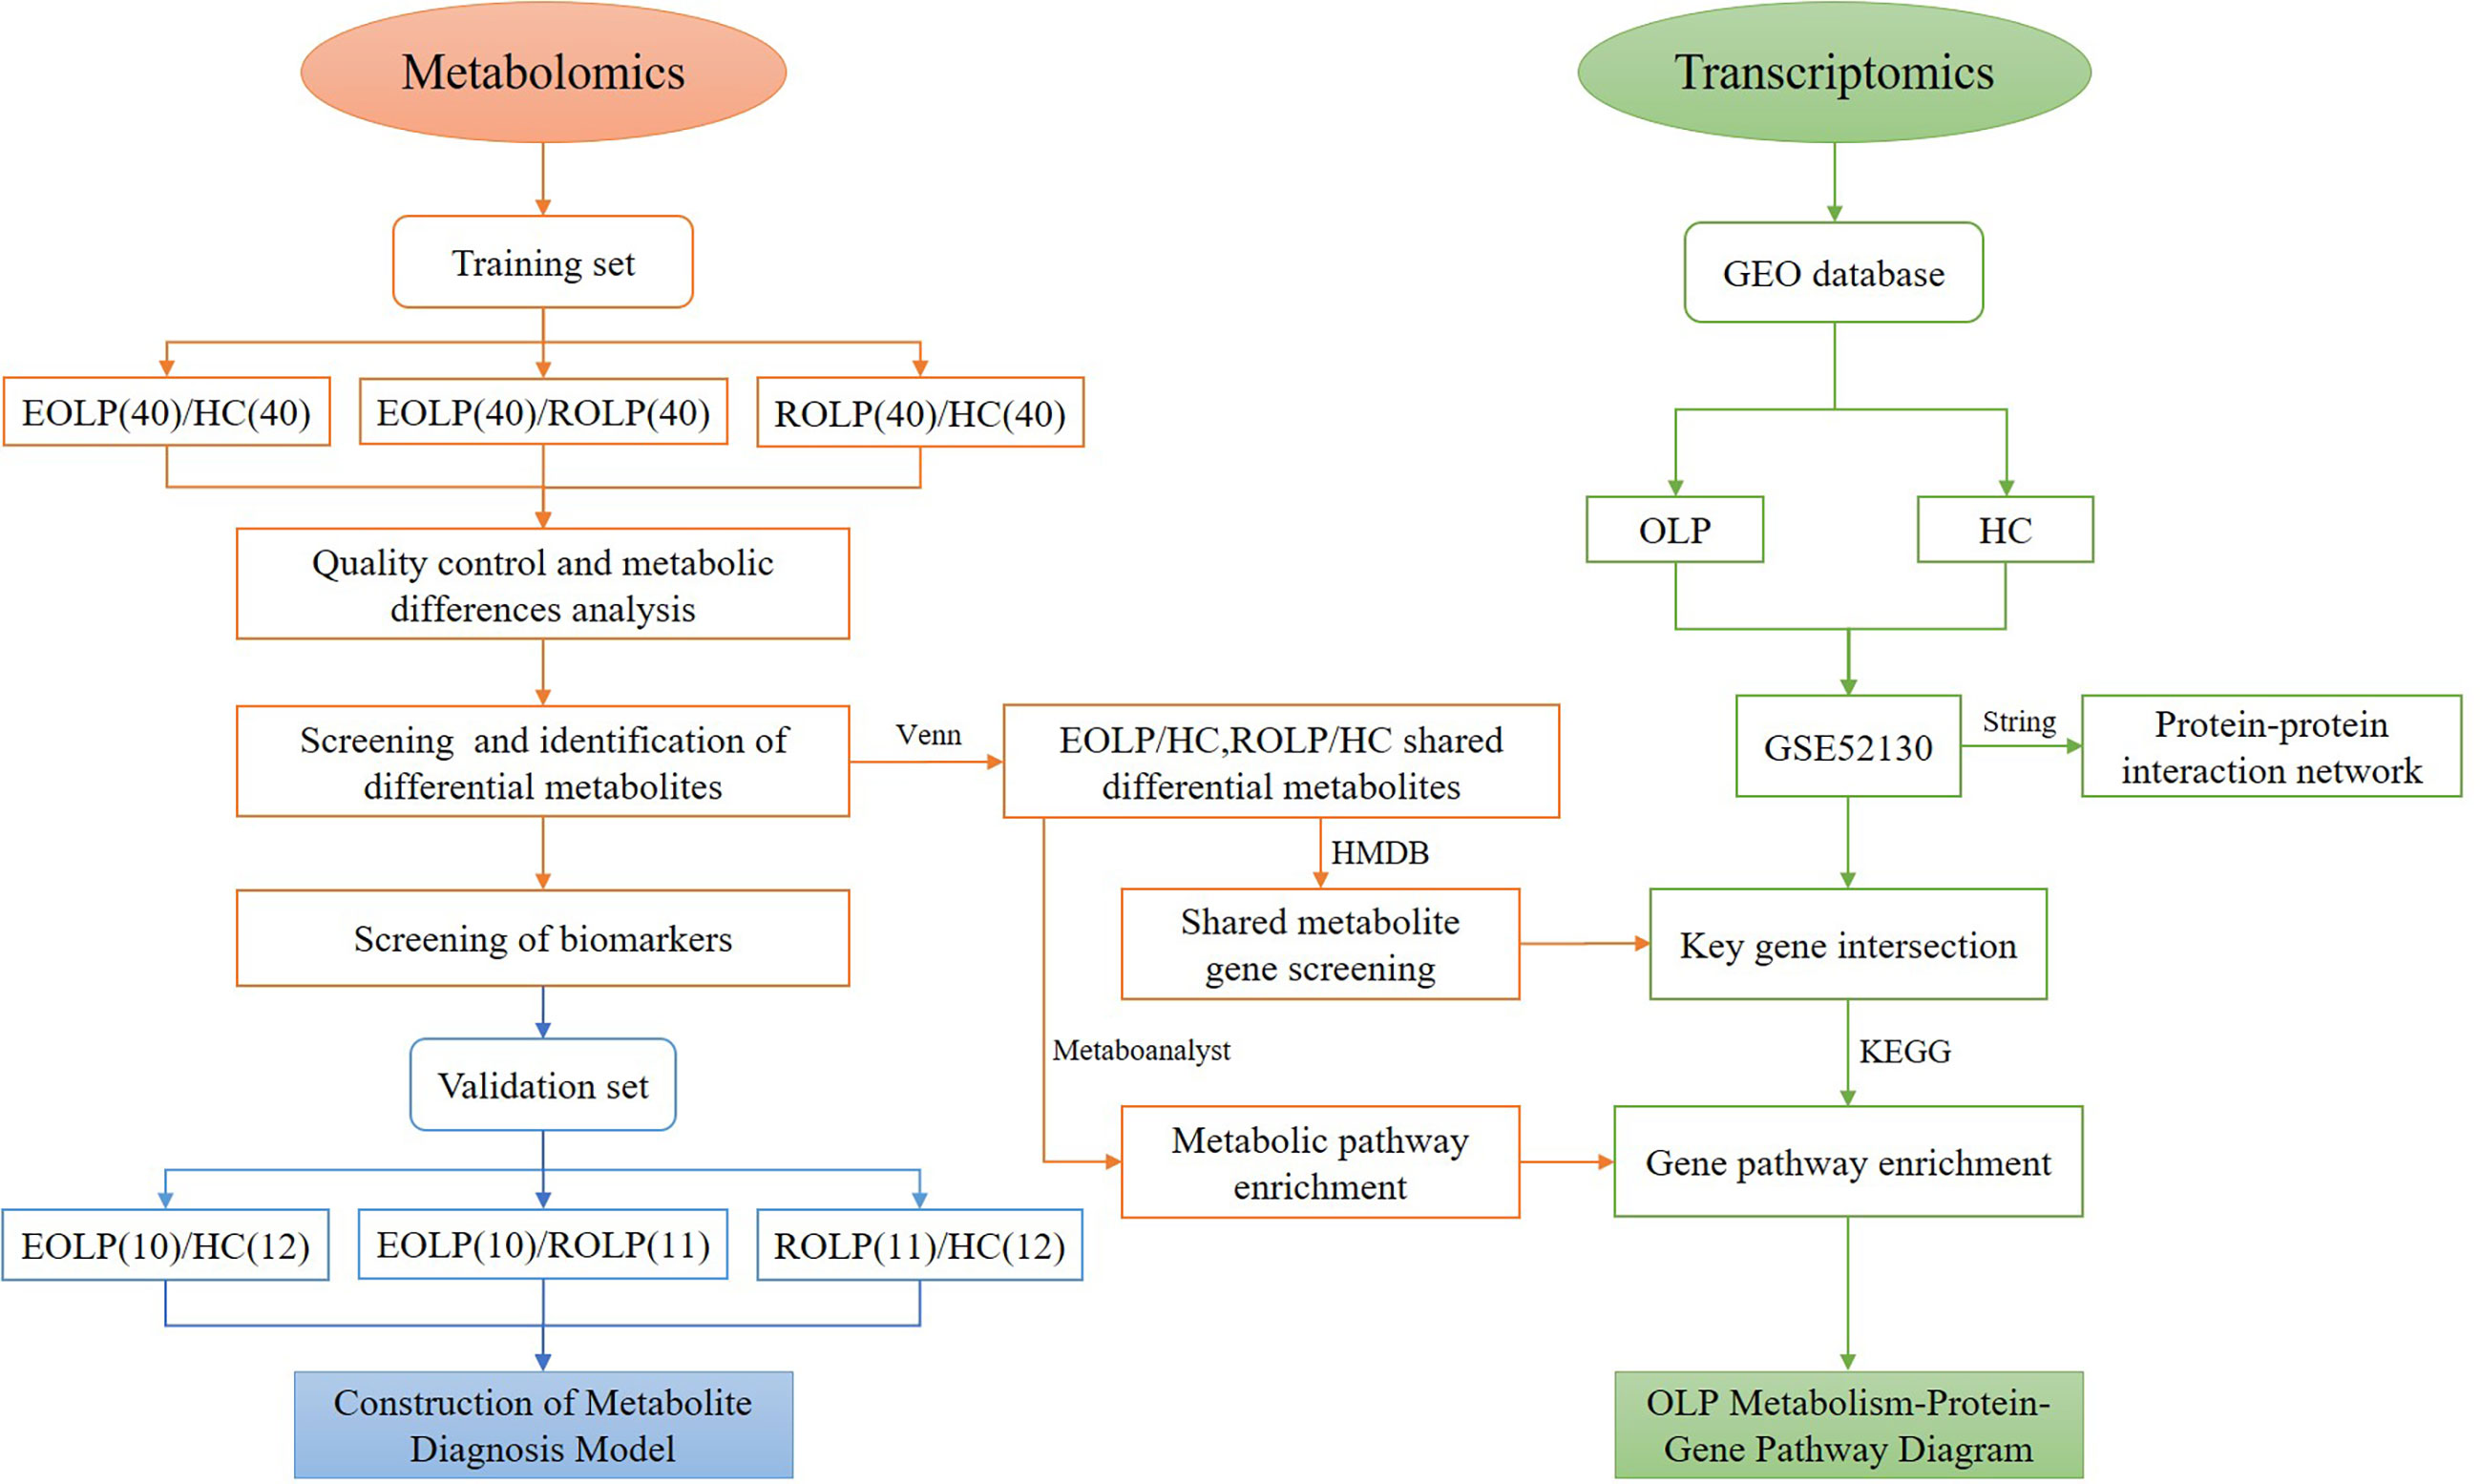
Figure 1 Research flow chart.
Materials and Methods
Experimental Materials
Experimental Instrument
UHPLC/Q-Orbitrap system: Thermo Fisher Scientific’s Ultra 3000 UHPLC (USA), Thermo Fisher Scientific’s Q Exactive high-resolution mass spectrometer (USA). BX7200HP desktop ultrasonic cleaner from Shanghai Xinmiao Medical Equipment Manufacturing Co., Ltd.; AL104 balance (with an accuracy of 0.0001) from Mettler Toledo Shanghai Co., Ltd., Switzerland; VORTEX-GENIE 2 vortex oscillator from SITM (USA); Hitachi’s CF16RN Centrifuge (Japan); Heraeus Fresco 17 high-speed refrigerated centrifuge from Thermo Fisher Scientific (USA); Ultrapure water meter from MilliPore (USA).
Experimental Reagents
Chromatographic grade acetonitrile and methanol were provided by Fisher Company of the United States; Chromatographic grade formic acid was provided by Shanghai Aladdin Biotechnology Co., Ltd.; L-2-chlorophenylalanine was from China Bailingwei Technology Co., Ltd.; Ketoprofen was from Sigma Company of the United States; All solutions were used after being filtered in a 0.22 µm pore filter.
Experimental Method
Participants
A total of 50 EOLP patients and 51 ROLP patients were selected from their first visit to the Department of Stomatology of the First Affiliated Hospital of Zhengzhou University. Patients were diagnosed by clinical and pathological findings. Another 52 healthy individuals (Healthy control, HC) with matching gender and age were selected from the physical examination center of the First Affiliated Hospital of Zhengzhou University. A total of 153 subjects were randomly classified into the training set(n=120) and the validation set(n=33). All patients did not receive any other treatment, such as drug therapy, radiotherapy, chemotherapy, et al. before admission. All subjects had no other oral mucosal diseases, and no basic systemic diseases, such as diabetes, hypertension, and cardiovascular and cerebrovascular diseases. This study was reviewed and approved by the Ethics Committee of the First Affiliated Hospital of Zhengzhou University (serial number: 2019-KY-26/2021-KY-0444), and all subjects signed their informed consents.
Sample Collection and Processing
The blood samples were collected from all subjects in the morning after an overnight fasting. The blood samples were collected into a vacuum blood collection tube containing a coagulant and immediately placed in a thermostat with ice cubes. After transfer to the laboratory, blood samples were kept for 30 minutes and centrifuged for 10 minutes at 4°C and 3000 rpm. The supernatant was collected into a new eppendorf tube for aliquoting, and stored in a refrigerator at -80 °C for later use.
Sample Pretreatment
Serum samples were thawed on ice. 100 µL of serum was precisely aspirated and placed in a 1.5 mL centrifuge tube, and 300 µL of methanol solution containing internal standard (0.05 μg/mL L-2-chlorophenylalanine and 0.5 μg/mL ketoprofen) was added. Samples were vortexed vigorously for 1 min, and centrifuge at 4°C and 13000 rpm for 10 min. The supernatant was pipetting into the sample injection vial for mass spectrometry analysis. 10 µL samples were separately drawn into 1.5 mL centrifuge tubes as quality control (QC) samples. QC samples were inserted in the process of metabolomics data collection for all samples to ensure the reliability of the experimental results. Before sample analysis, 6 QC samples were first detected, and the stability of the instrument was evaluated by monitoring the pressure changes before and after each injection and the deviation of the retention time of the main peaks in the total ion current graph. After the instrument was stable, the analysis was started. After every 10 samples tested, one QC sample was interspersed. In order to avoid cross-contamination, a blank sample containing only solvent was inserted after each QC sample.
System Conditions
The UHPLC system was used to analyze the metabolites in the serum samples. Under the condition of 40°C, 5 µL of liquid was drawn from each sample and injected into the ACQUITY UHPLCBEH C18 column (100×2.1 mm, 1.7 µm) for gradient elution. Acetonitrile +0.1% formic acid aqueous solution (A+B) was used as the mobile phase, the flow rate was as follows: 0.2 mL/min: 0~0.5 min, 5%A; 0.5~1.0 min, 5%~60% A; 1.0~7.0 min, 60%~80% A; 7.0~9.0 min, 80~100% A; 9.0~11.0 min, 100%A; 11.0~11.2 min, 100% A-5%A; 11.2~13.0 min, 5%A. The electrospray ionization source (ESI) was used to connect the high-resolution mass spectrometer in series to the UHPLC system. The temperature and flow of the auxiliary gas are 300°C, 10μL/min; the ion source temperature is 350°C; the capillary temperature is 320°C. The scanning range is 80.00~1200.00 m/z. In the Full Mass/ddms 2 scan mode, the detection is performed in the positive and the negative ion mode with a secondary mass spectrum resolution of 17500. The gradient collision energy is 20 eV, 40 eV and 60 eV. The spray voltage and sheath gas flow rate are 3.50 kV and 40 μL/min in the positive ion mode, and 2.80 kV and 38 μL/min in the negative ion mode. The order of injection of all samples is carried out randomly.
Identification of Potential Genes Related to Oral Lichen Planus
The oral lichen planus transcriptome data was obtained from the public data platform GEO database (https://www.ncbi.nlm.nih.gov/geo/). 18 samples from the GSE52130 data set were selected, including 10 normal control samples and 8 OLP patient samples. According to the conditions of P<0.05, |Log2(fold change (FC))|>0.6, the differentially expressed genes (DEGs) between OLP and healthy control epithelial tissues were screened. The STRING database (https://www.string-db.org/) was used to make a protein-protein interaction (PPI) network, and the Cytoscape 3.8.2 software was used to visualize the network graphics. The crossed genes were tested using a Venn diagram.
Statistical Analysis
The mass spectrometry data is analyzed by the Thermo Xcalibur™ software. Compound Discoverer software 3.0 was used for peak calibration, peak matching and peak alignment information extraction. The SIMCA 14.1 (Umetrics, Sweden) software was used to perform multivariate statistical analysis on all samples, including principal component analysis (PCA), orthogonal projection to latent structure discriminant analysis (OPLS-DA). Simultaneously, 200 permutation tests were performed to evaluate the overfitting of the analysis. The result of the OPLS-DA is the estimated value of the variable importance in the projection (VIP). The metabolites were screened according to the conditions of P<0.05, FC>2 and VIP>1, and the screened metabolites were compared with the Human Metabolome Database (HMDB) (https://hmdb.ca/), the mzCloud (https://www.mzcloud.org/), and the PubChem database (https://pubchem.ncbi.nlm.nih.gov/). The laboratory’s self-built database mzVault was used to compare various information, including molecular formula, molecular weight, retention time, secondary fragment structure information. The MetaboAnalyst (https://www.metaboanalyst.ca/) was used to produce metabolite volcano maps, heat maps, receiver operating characteristic curve (ROC), and calculate the area under the curve (AUC). SPSS 25.0 (IBM, USA) software was used to calculate the visual correlation coefficient, and Cytoscape software 3.8.2 was used for visualization. The Kyoto Encyclopedia of Genes and Genomes (KEGG) (http://www.genome.jp/kegg/) was used to enrich the metabolic pathways. Transcriptomics data is integrated through MetaboAnalyst.
Results
Analysis of Population Baseline Characteristics
A total of 120 participants were selected in in the training set, including 40 EOLPs, 40 ROLPs, and 40 healthy control individuals. The validation set selected a total of participants, including 10 EOLPs, 11 ROLPs, and 12 healthy control individuals. There was no significant difference in the baseline characteristics between the diseased group and the healthy control group (P>0.05) (Table 1).
Table 1 The baseline characteristics of participants.
Quality Control and Metabolic Difference
A total of 5450 ion peaks were detected in the serum samples in the negative ion mode. Principal component analysis (PCA) showed that the QC samples are tightly gathered in the negative ion mode, which indicates that the instrument is working normal and the detection data is stable and reliable. The results of the EOLP group, ROLP group, and HC group were well separated (Figures 2A, B), indicating that there are significant differences among the three groups. The results of OPLS-DA showed the metabolic differences between two groups (Figures 2C, D). The results of 200 permutation tests of the OPLS-DA showed that both the R2 and Q2 values were good, suggesting that the OPLS-DA did not have over-fitting phenomenon (Figures 2E, F), and the OPLS-DA results have high credibility. A similar separation result was also shown in the positive ion mode (Supplementary Figure 1).
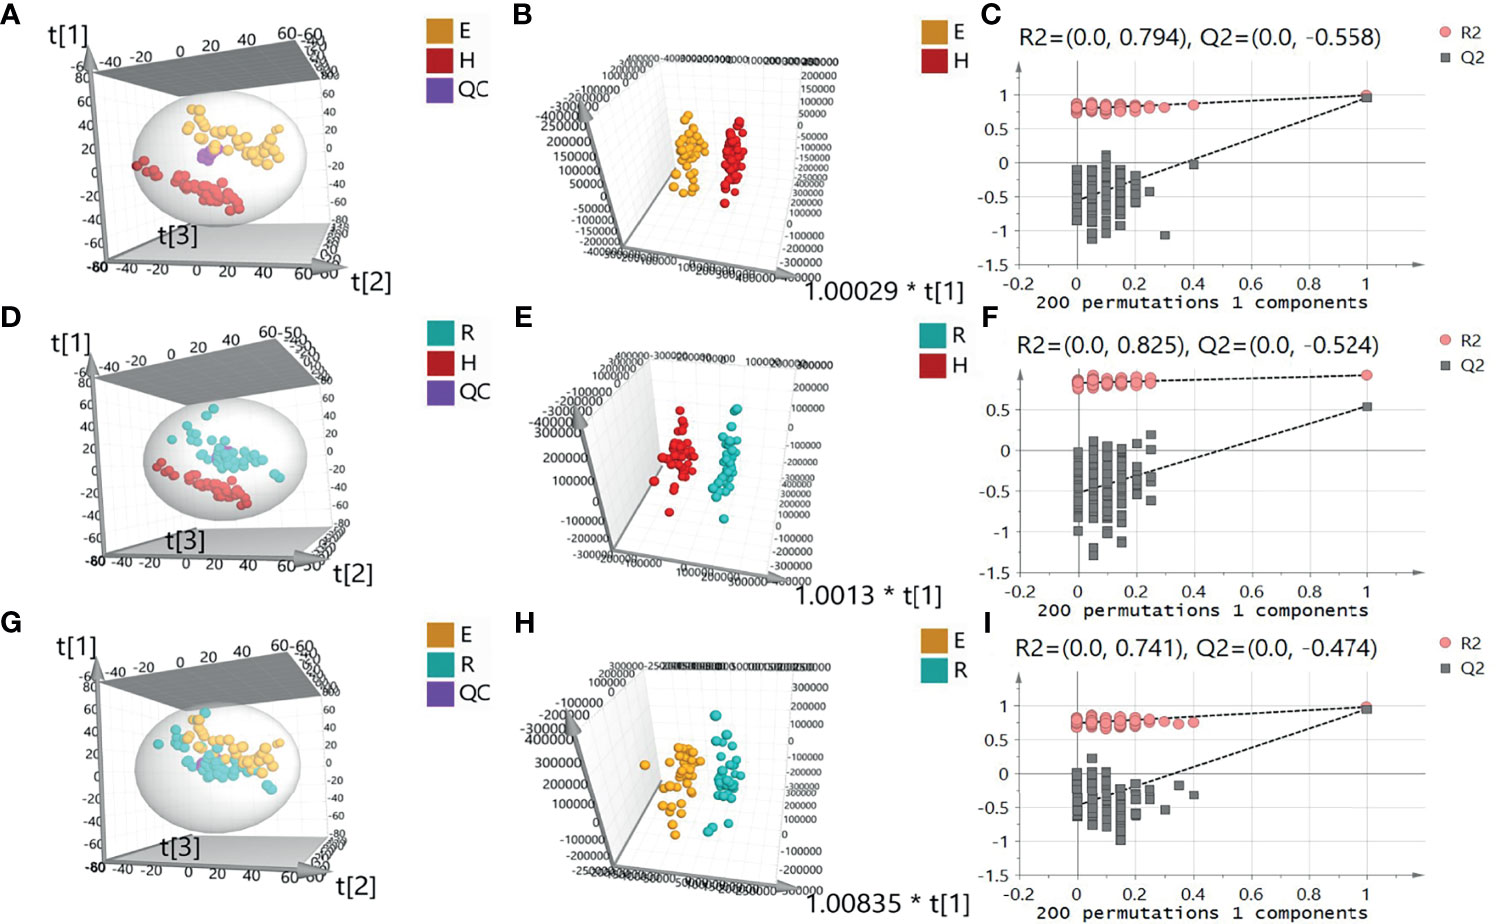
Figure 2 Principal component analysis (PCA) diagram of serum samples of EOLP group and HC group (A), ROLP group and HC group (D), EOLP group and ROLP group (G) in the negative ion mode, OPLS-DA score diagram (B, E, H) and 200 permutation test (C, F, I) of EOLP group and HC group, ROLP group and HC group, EOLP group and ROLP group in the negative ion mode. E: EOLP; R: ROLP; H: HC.
Screening and Identification of Differential Metabolites
Screening of Differential Metabolites
Preliminary screening of differential metabolites by P value (P <0.05) and FC value (FC >2.0) was performed and a volcano plot was drawn (Figure 3). The results showed that among the effective metabolites screened, 186 were down-regulated and 380 were up-regulated in the EOLP group compared with the HC group in the negative ion mode (Figure 3A); 107 were down-regulated and 271 were up-regulated in the ROLP group compared with the HC group (Figure 3B); 79 were down-regulated and 63 were up-regulated in the EOLP group compared with the ROLP group (Figure 3C) In the positive ion mode, there were 270 down-regulated metabolites and 504 up-regulated metabolites in the EOLP group, (Figure 3D); 156 down-regulated metabolites and 390 up-regulated metabolites in the ROLP group compared with the HC group (Figure 3E); 124 down-regulated metabolites and 55 up-regulated metabolites in the EOLP group compared with the ROLP group (Figure 3F). The above-mentioned differential metabolites were further screened based on the VIP>1 condition.
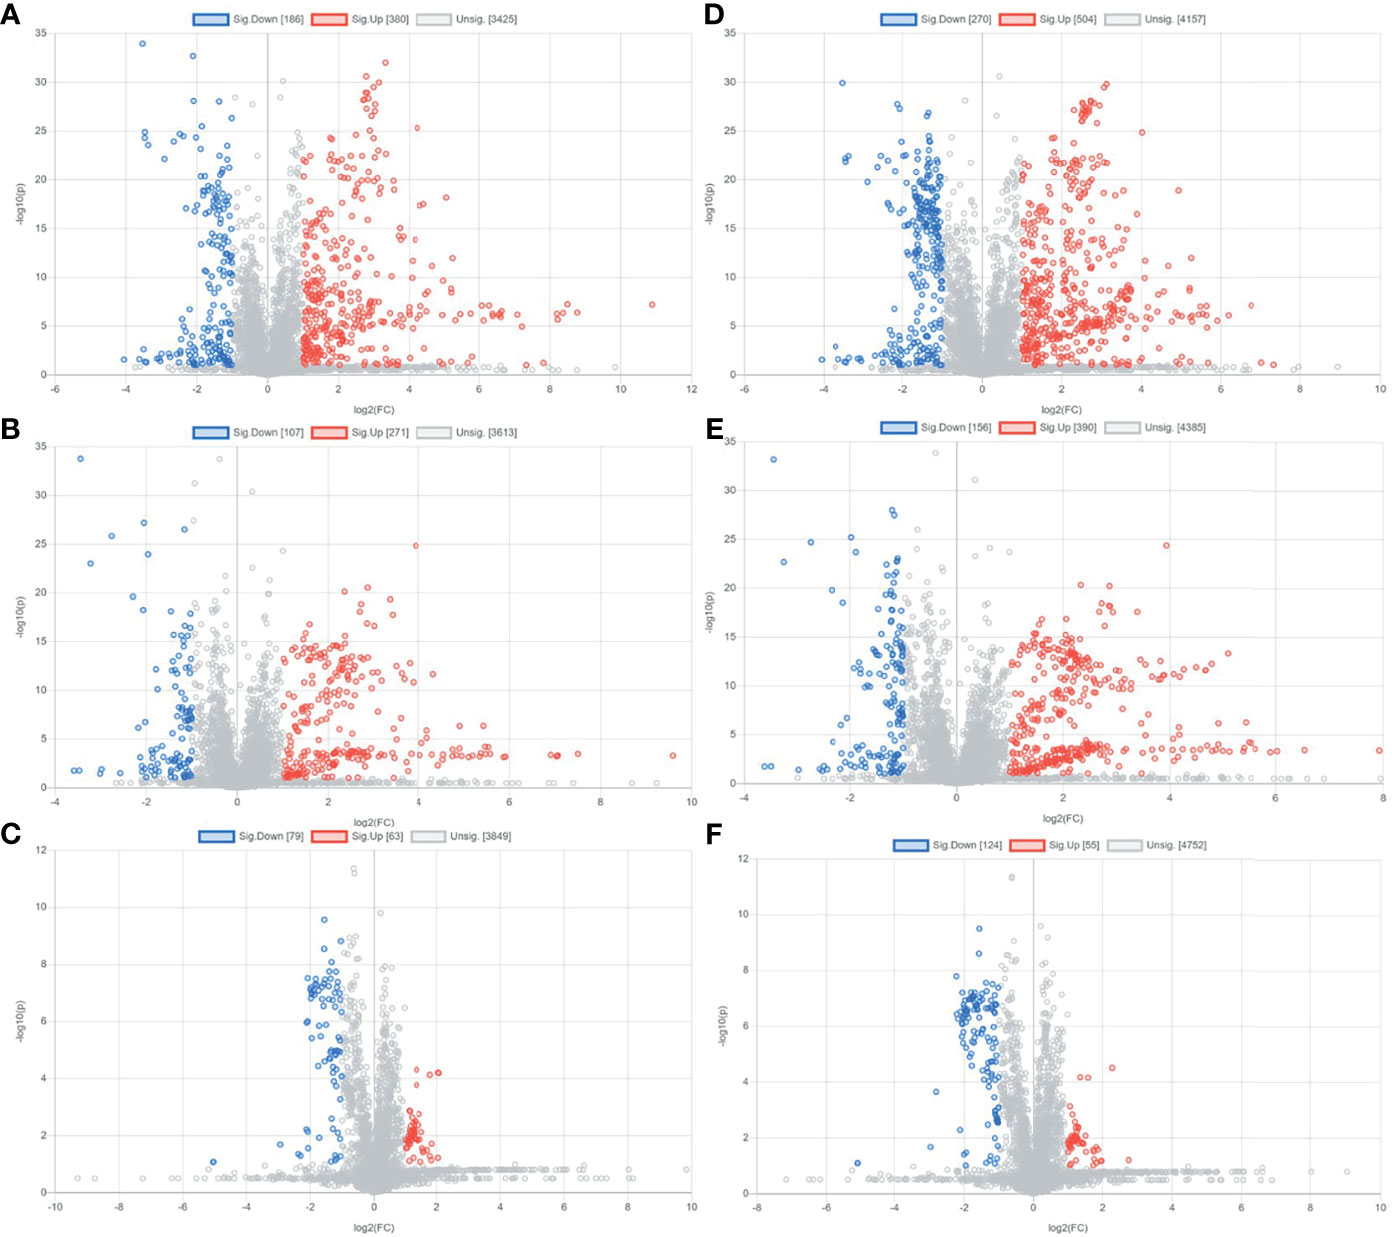
Figure 3 Metabolite volcano analysis diagram of EOLP group and HC group (A), ROLP group and HC group (B), EOLP group and ROLP group (C) in the negative ion mode; and EOLP group and HC group (D), ROLP group and HC group (E), EOLP group and ROLP group (F) in the positive ion mode.
Identification of Differential Metabolites
The molecular formula, molecular weight and secondary structure of the selected candidate metabolites were compared with the data in the database. After excluding unqualified metabolites, 19 endogenous compounds were finally identified in the EOLP and HC groups (Table 2), and 25 endogenous compounds were finally identified in the ROLP and HC groups (Table 3), and 14 endogenous compounds were finally identified in the EOLP and ROLP groups (Table 4). The types of metabolites include amino acids, fatty acids, sphingolipids and other small molecule compounds (Figure 4A). The heat map analysis of the different metabolites showed that each metabolite was significantly different in the two sets of samples (Figure 4B). Spearman correlation analysis was used to further explore the correlation between the differentially expressed metabolites. The results showed that there is a strong correlation between the differential metabolites and the EOLP group and the ROLP group (Supplementary Figure 2).
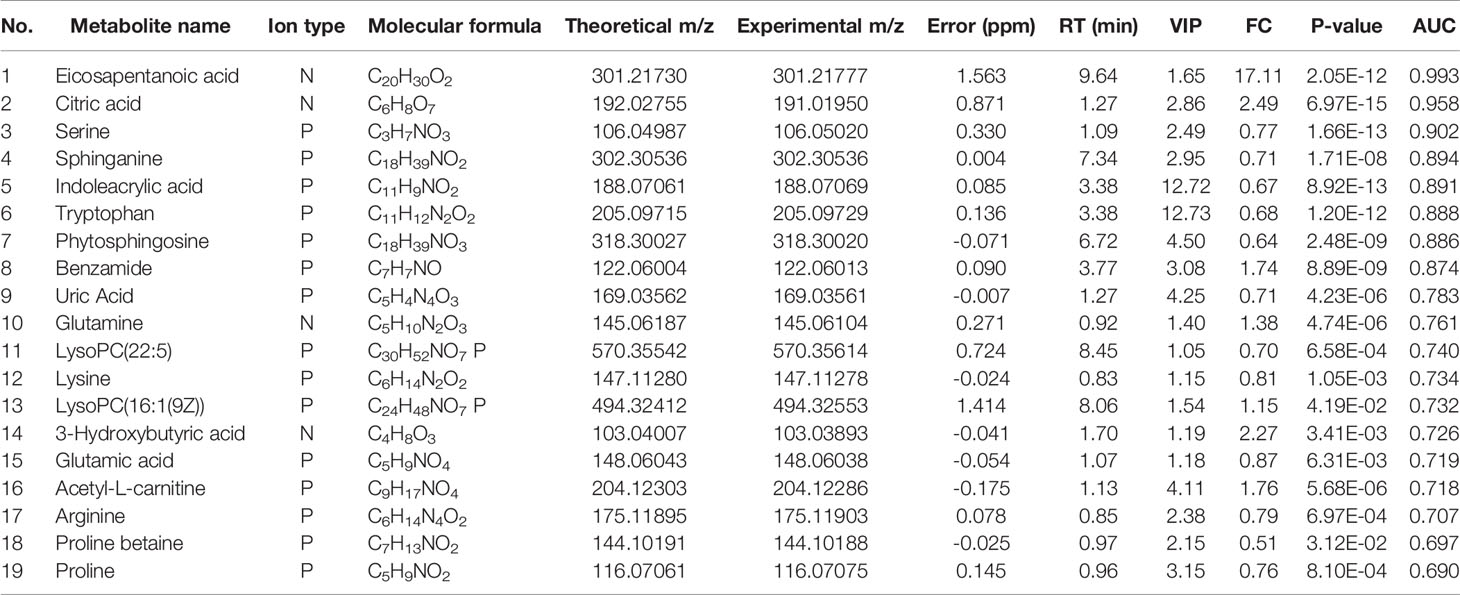
Table 2 Differential metabolites between EOLP group and healthy group.
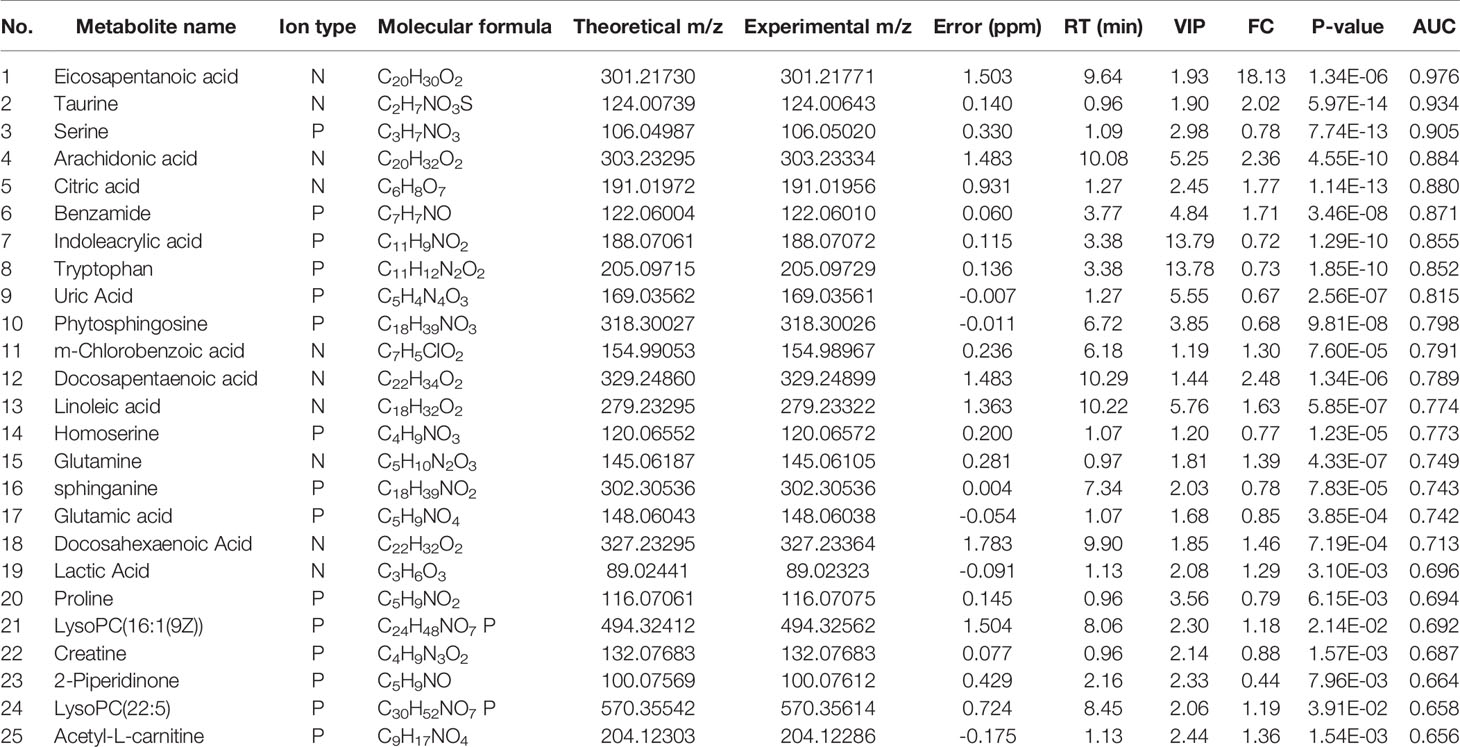
Table 3 Differential metabolites between ROLP group and healthy group.
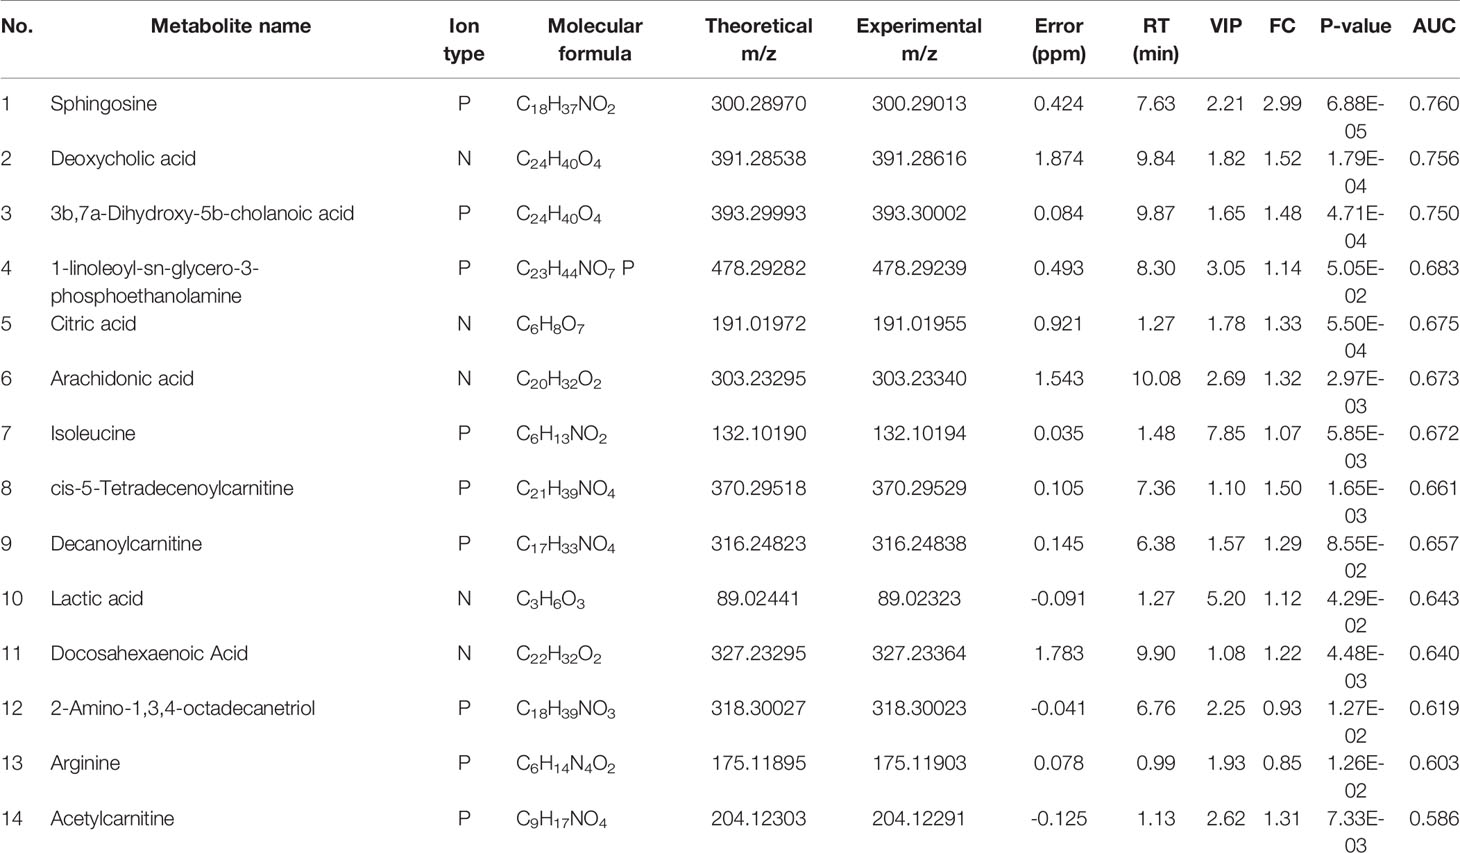
Table 4 Differential metabolite identification results between EOLP group and ROLP group.
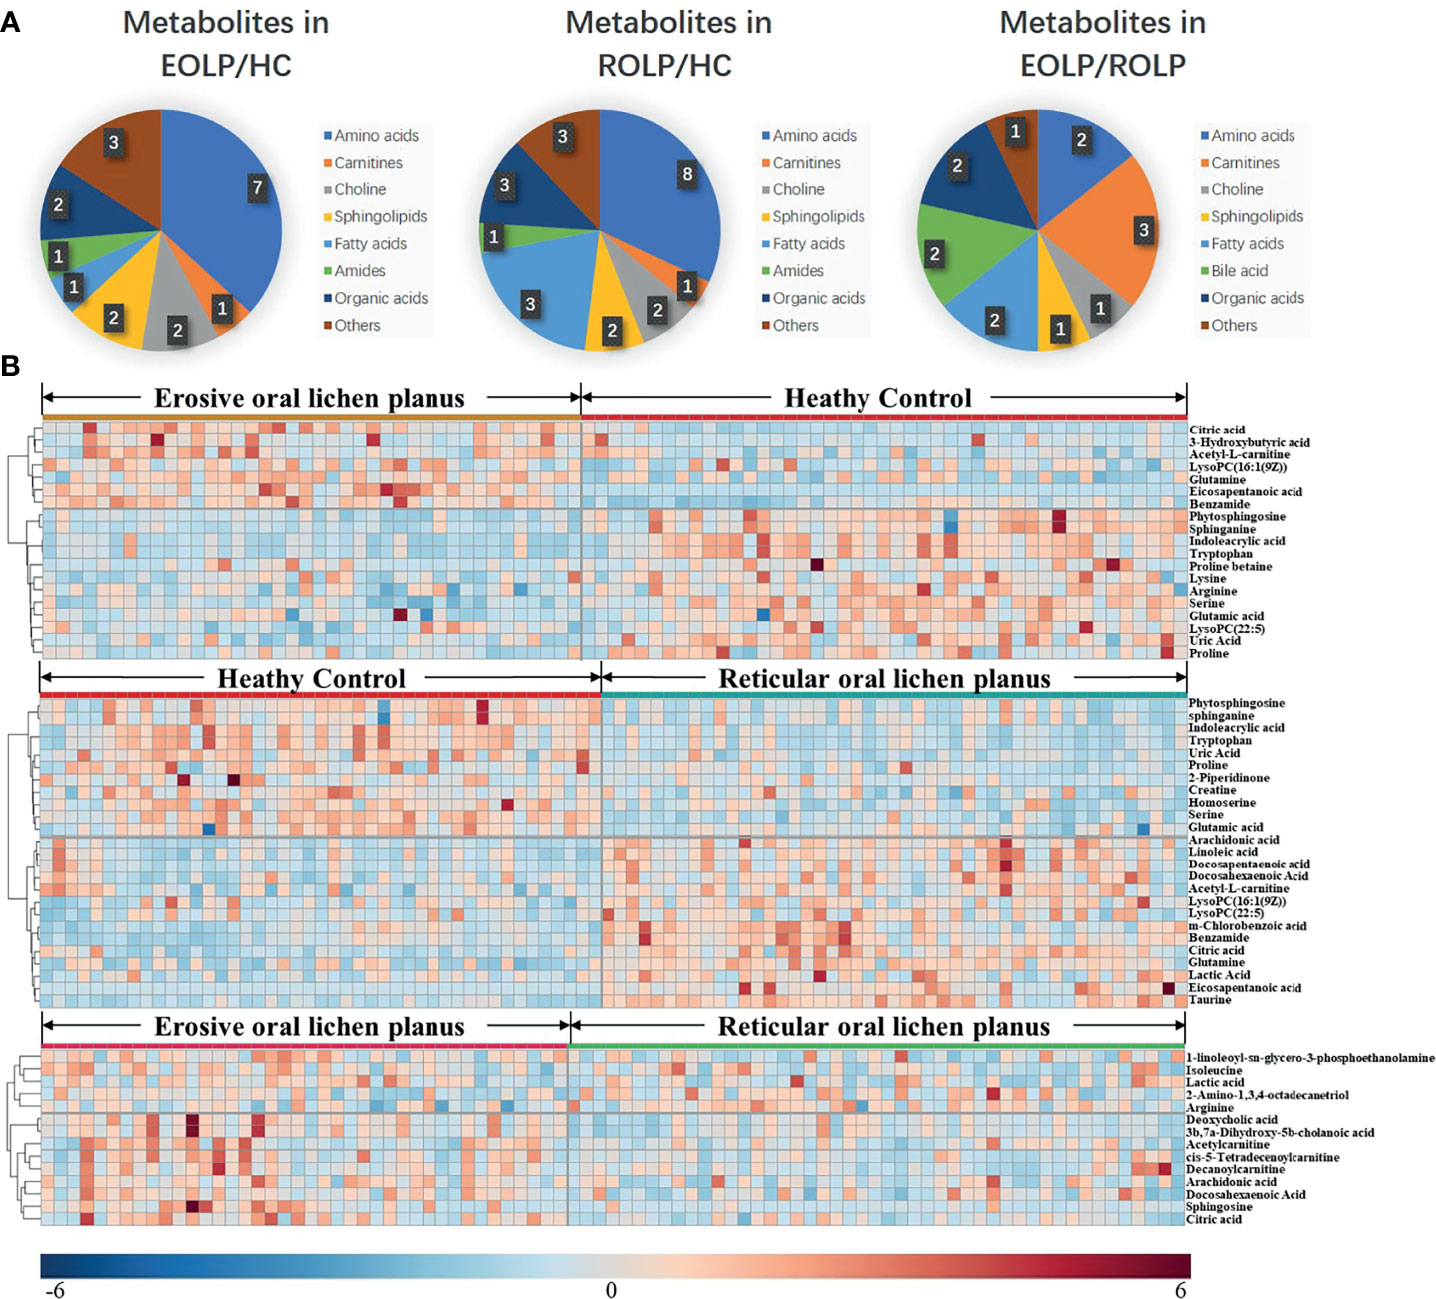
Figure 4 The pie chart shows the distribution of different metabolites (A). The heat map analysis of endogenous metabolites in the EOLP group and healthy group, ROLP and HC group, EOLP group and ROLP group (B).
Correlation of Important Metabolites in EOLP and ROLP
A total of 14 key metabolites with differential expression in EOLP and ROLP were found, including glutamic acid, tryptophan, indoleacrylic acid and other metabolites (Figures 5A, B). The eicosapentanoic acid, citric acid, and benzamide were positively correlated in the EOLP and ROLP groups (Figure 5B). In order to explore the connection of different metabolites, Spearman correlation coefficient was used to analyze the correlation of these 14 metabolites (Supplementary Figure 3). The metabolic pathways of shared metabolites were identified and six important metabolic pathways were identified, including: D-glutamine and D-glutamate metabolism, sphingolipid metabolism; alanine, aspartate and glutamate metabolism; arginine and proline metabolism; glyoxylate and dicarboxylate metabolism; nitrogen metabolism (Figure 5C). It can be seen that the metabolic changes were closely associated with abnormal amino acid metabolism in patients with OLP.
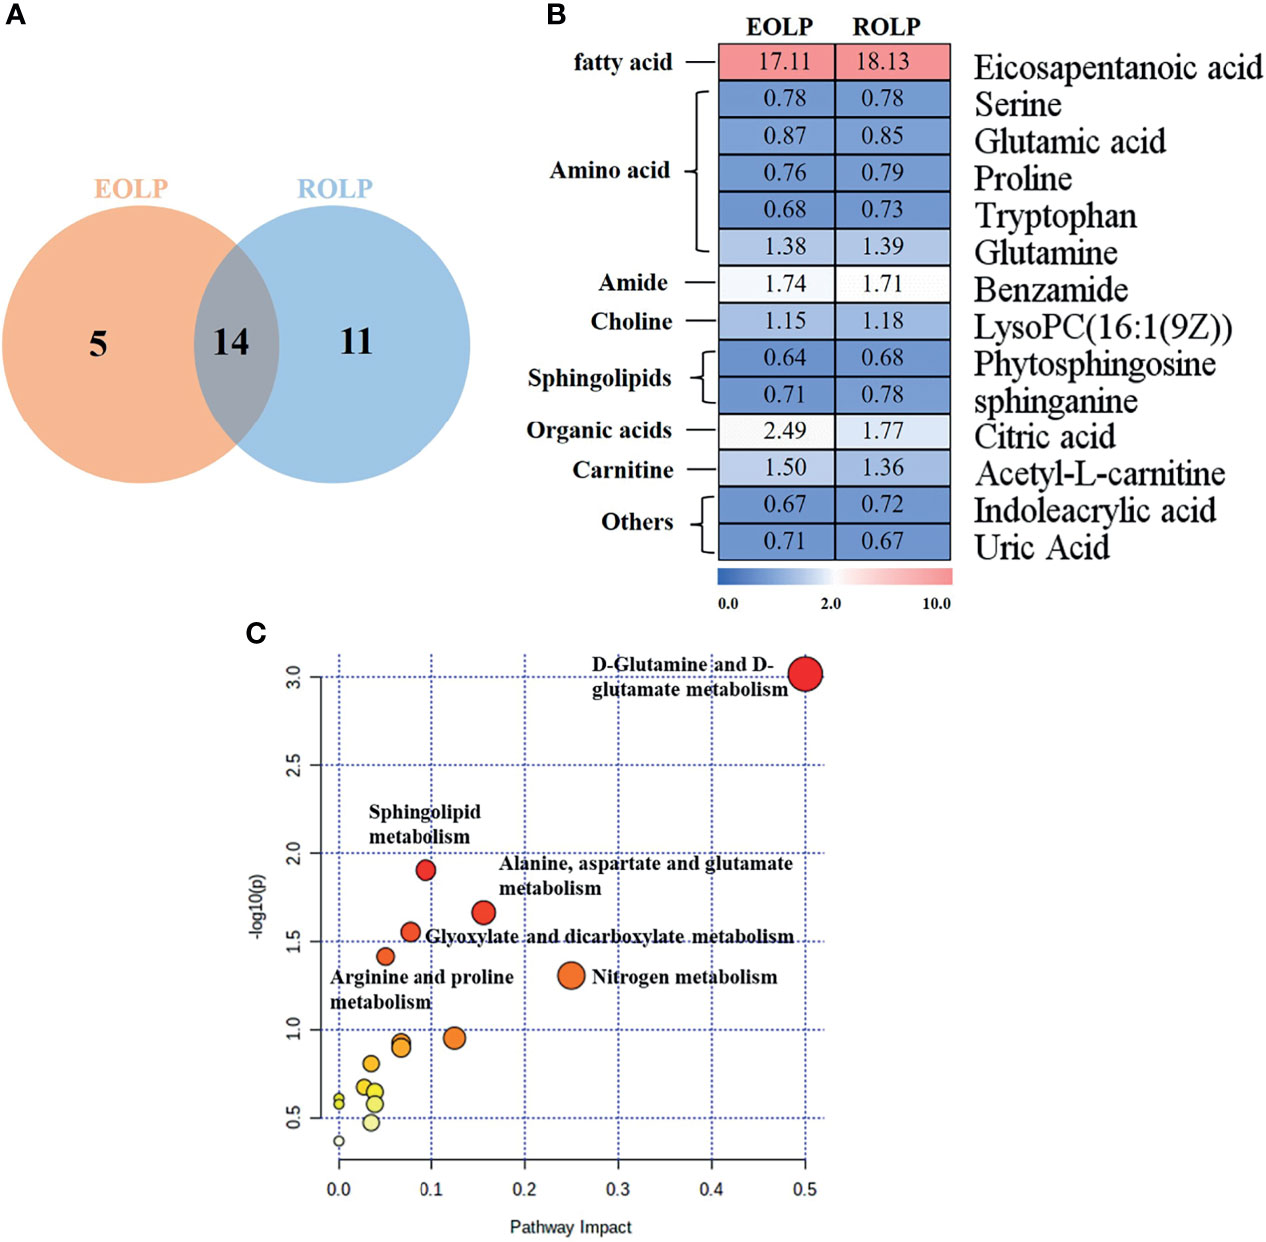
Figure 5 Venn diagram of EOLP and ROLP metabolites overlapped (A), Fold change analysis (red, up-regulated; blue, down-regulated) (B), Metabolism pathway diagram of common metabolites in EOLP and ROLP groups (C).
Construction of a Genetic Biological Network Related to Differential Metabolites
The GSE52130 dataset was selected from the GEO database and successfully screened out 2013 different genes between the OLP and HC groups (adjusted P value<0.05). Among them, 782 genes were up-regulated and 1231 genes were down-regulated (Figure 6). The 1227 DEGs with |Log2FC|>0.6 were selected to construct a PPI network using the STRING database (Supplementary Figure 4). HMDB and KEGG databases were used and 223 genes were found to be closely related to 14 common differential metabolites. Among them, the relevant gene information of benzamide and indoleacrylic acid was not found. The Cytoscape software was used to construct a “metabolite-gene” network (Figure 7). CERS6, SPTLC3, PIGQ and 19 other genes were highlighted by crossing the GSE52130 data set and the metabolite genes network (Table 5). The results showed that a total of 3 pathways in OLP received significant interference (Table 6). Gene pathway and metabolic pathway jointly participate in the processes of alanine, aspartate and glutamate metabolism and sphingolipid metabolism. The relationship between genes and metabolism was explored by searching the KEGG and HMDB online databases, and the relevant metabolites and key genes were displayed in the network diagram (Figure 8).
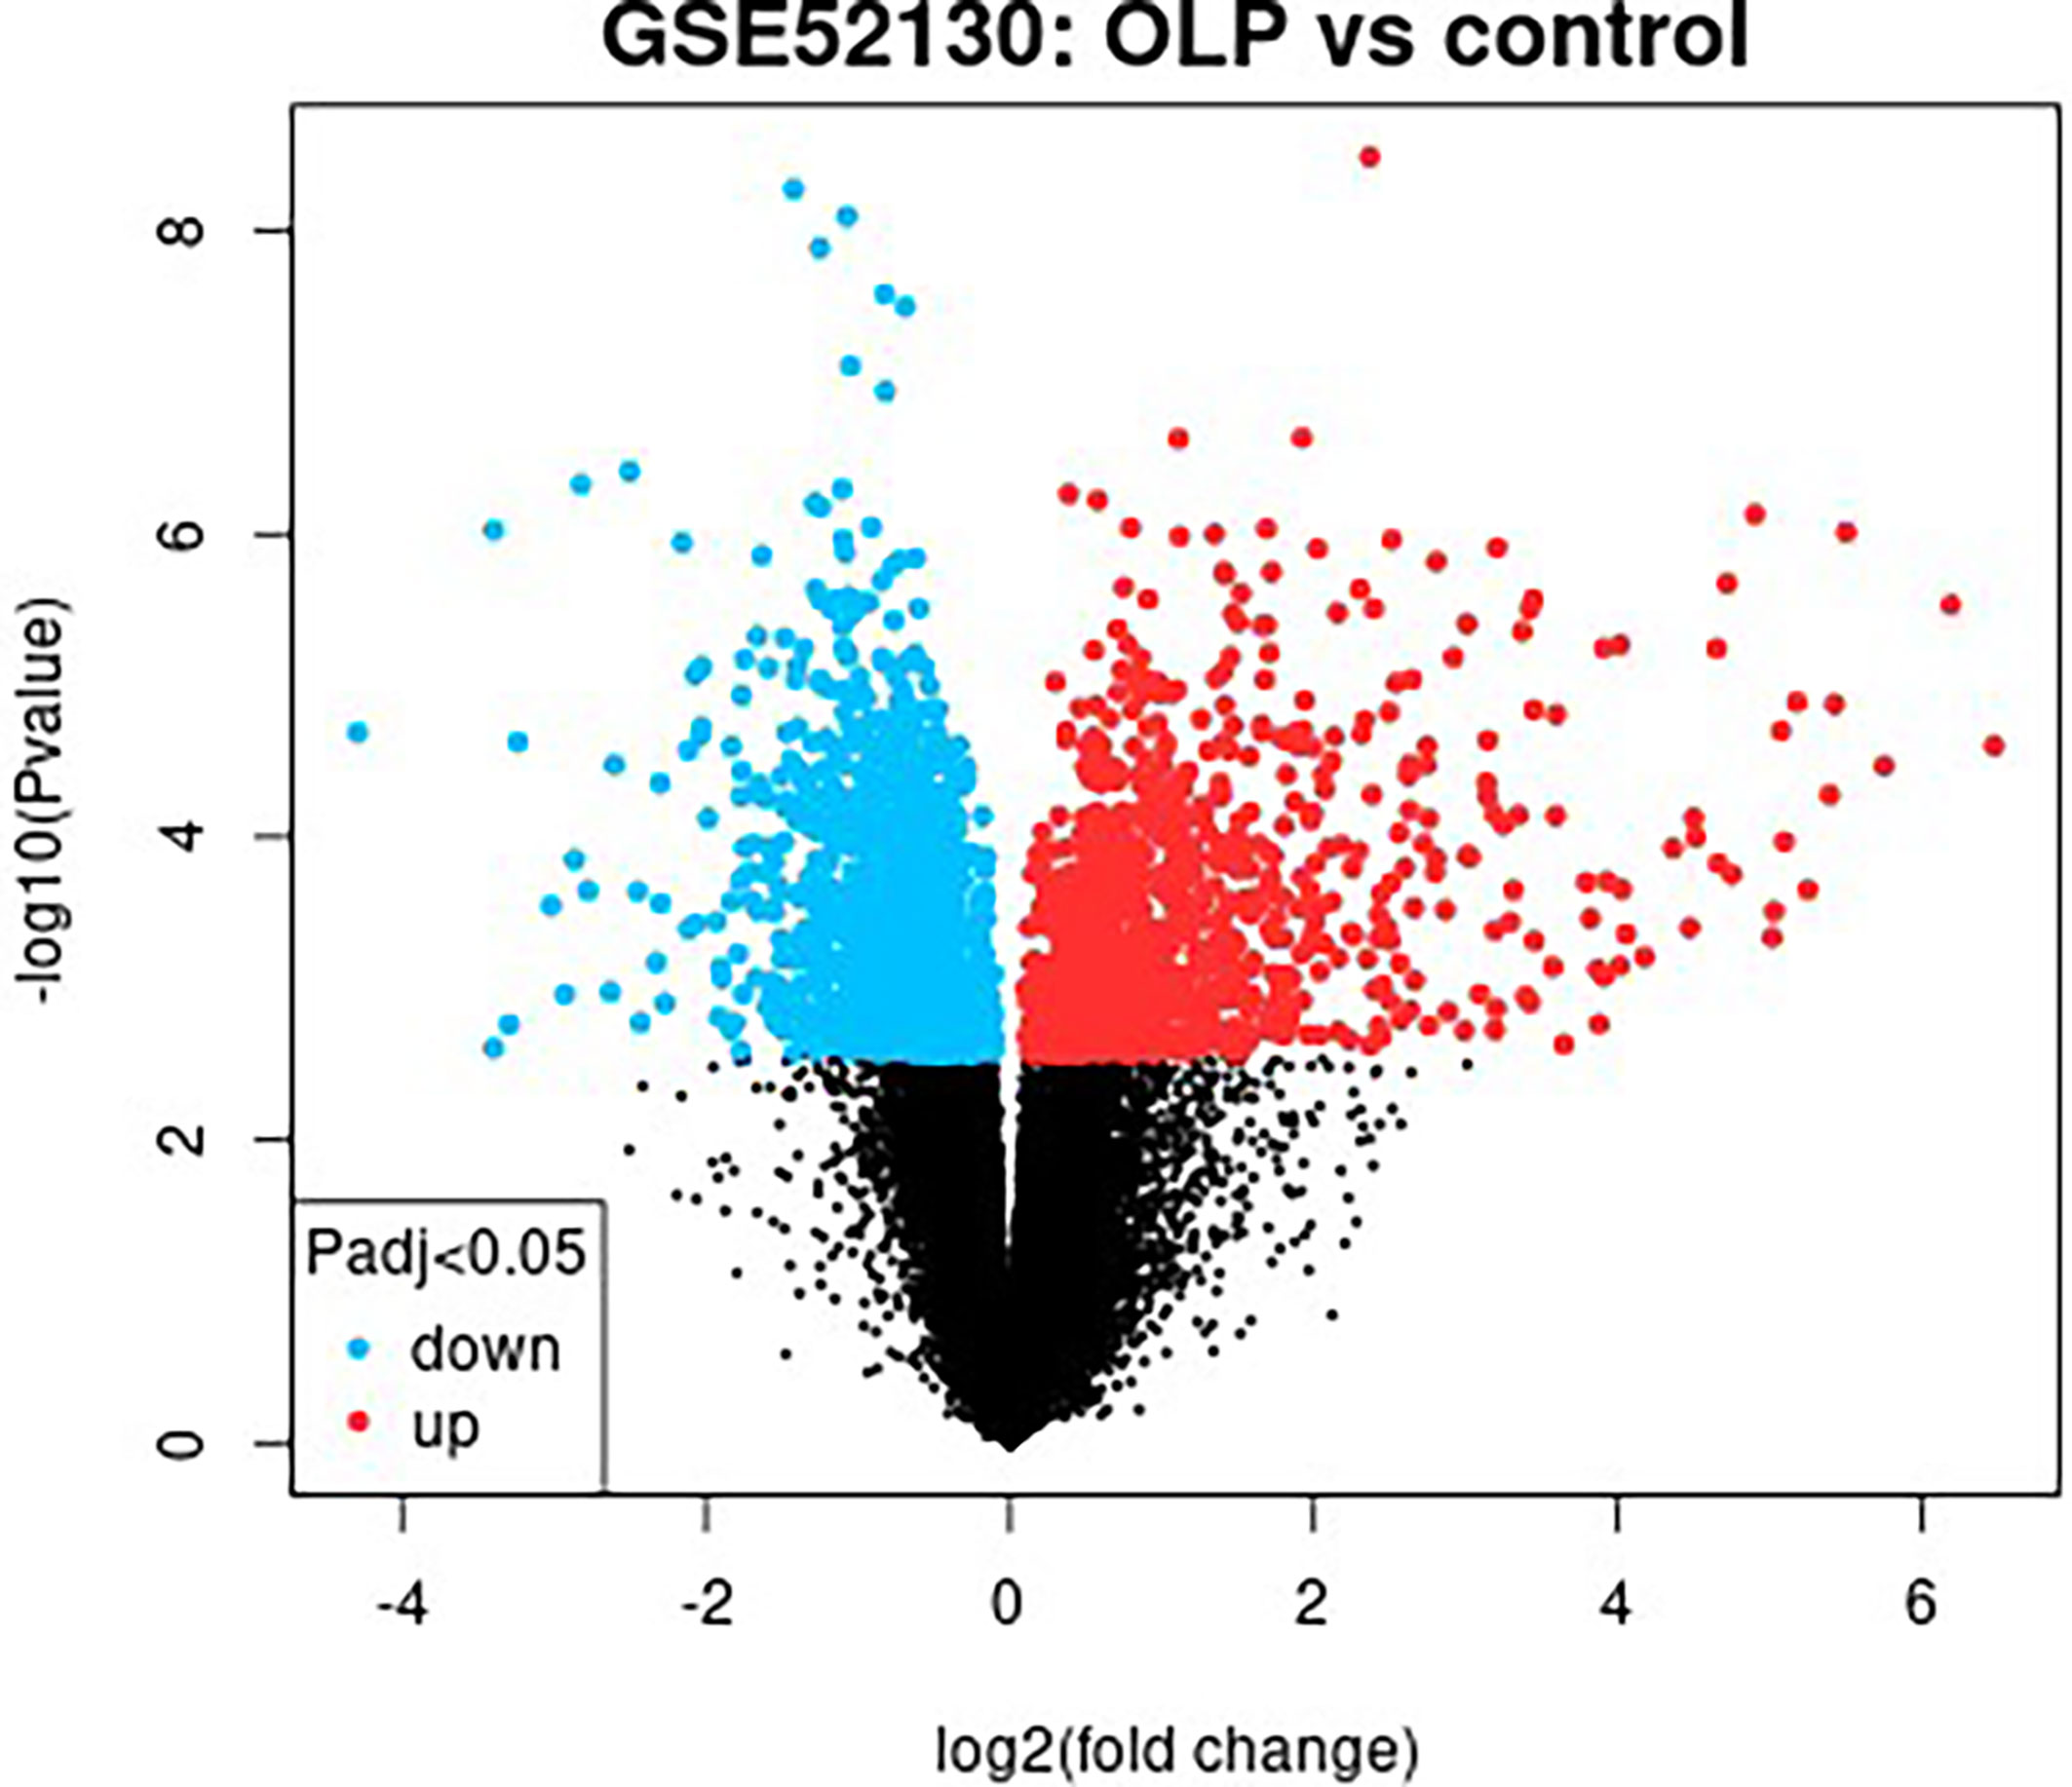
Figure 6 Differential gene screening results of the OLP and HC groups in the GSE52130 data set.
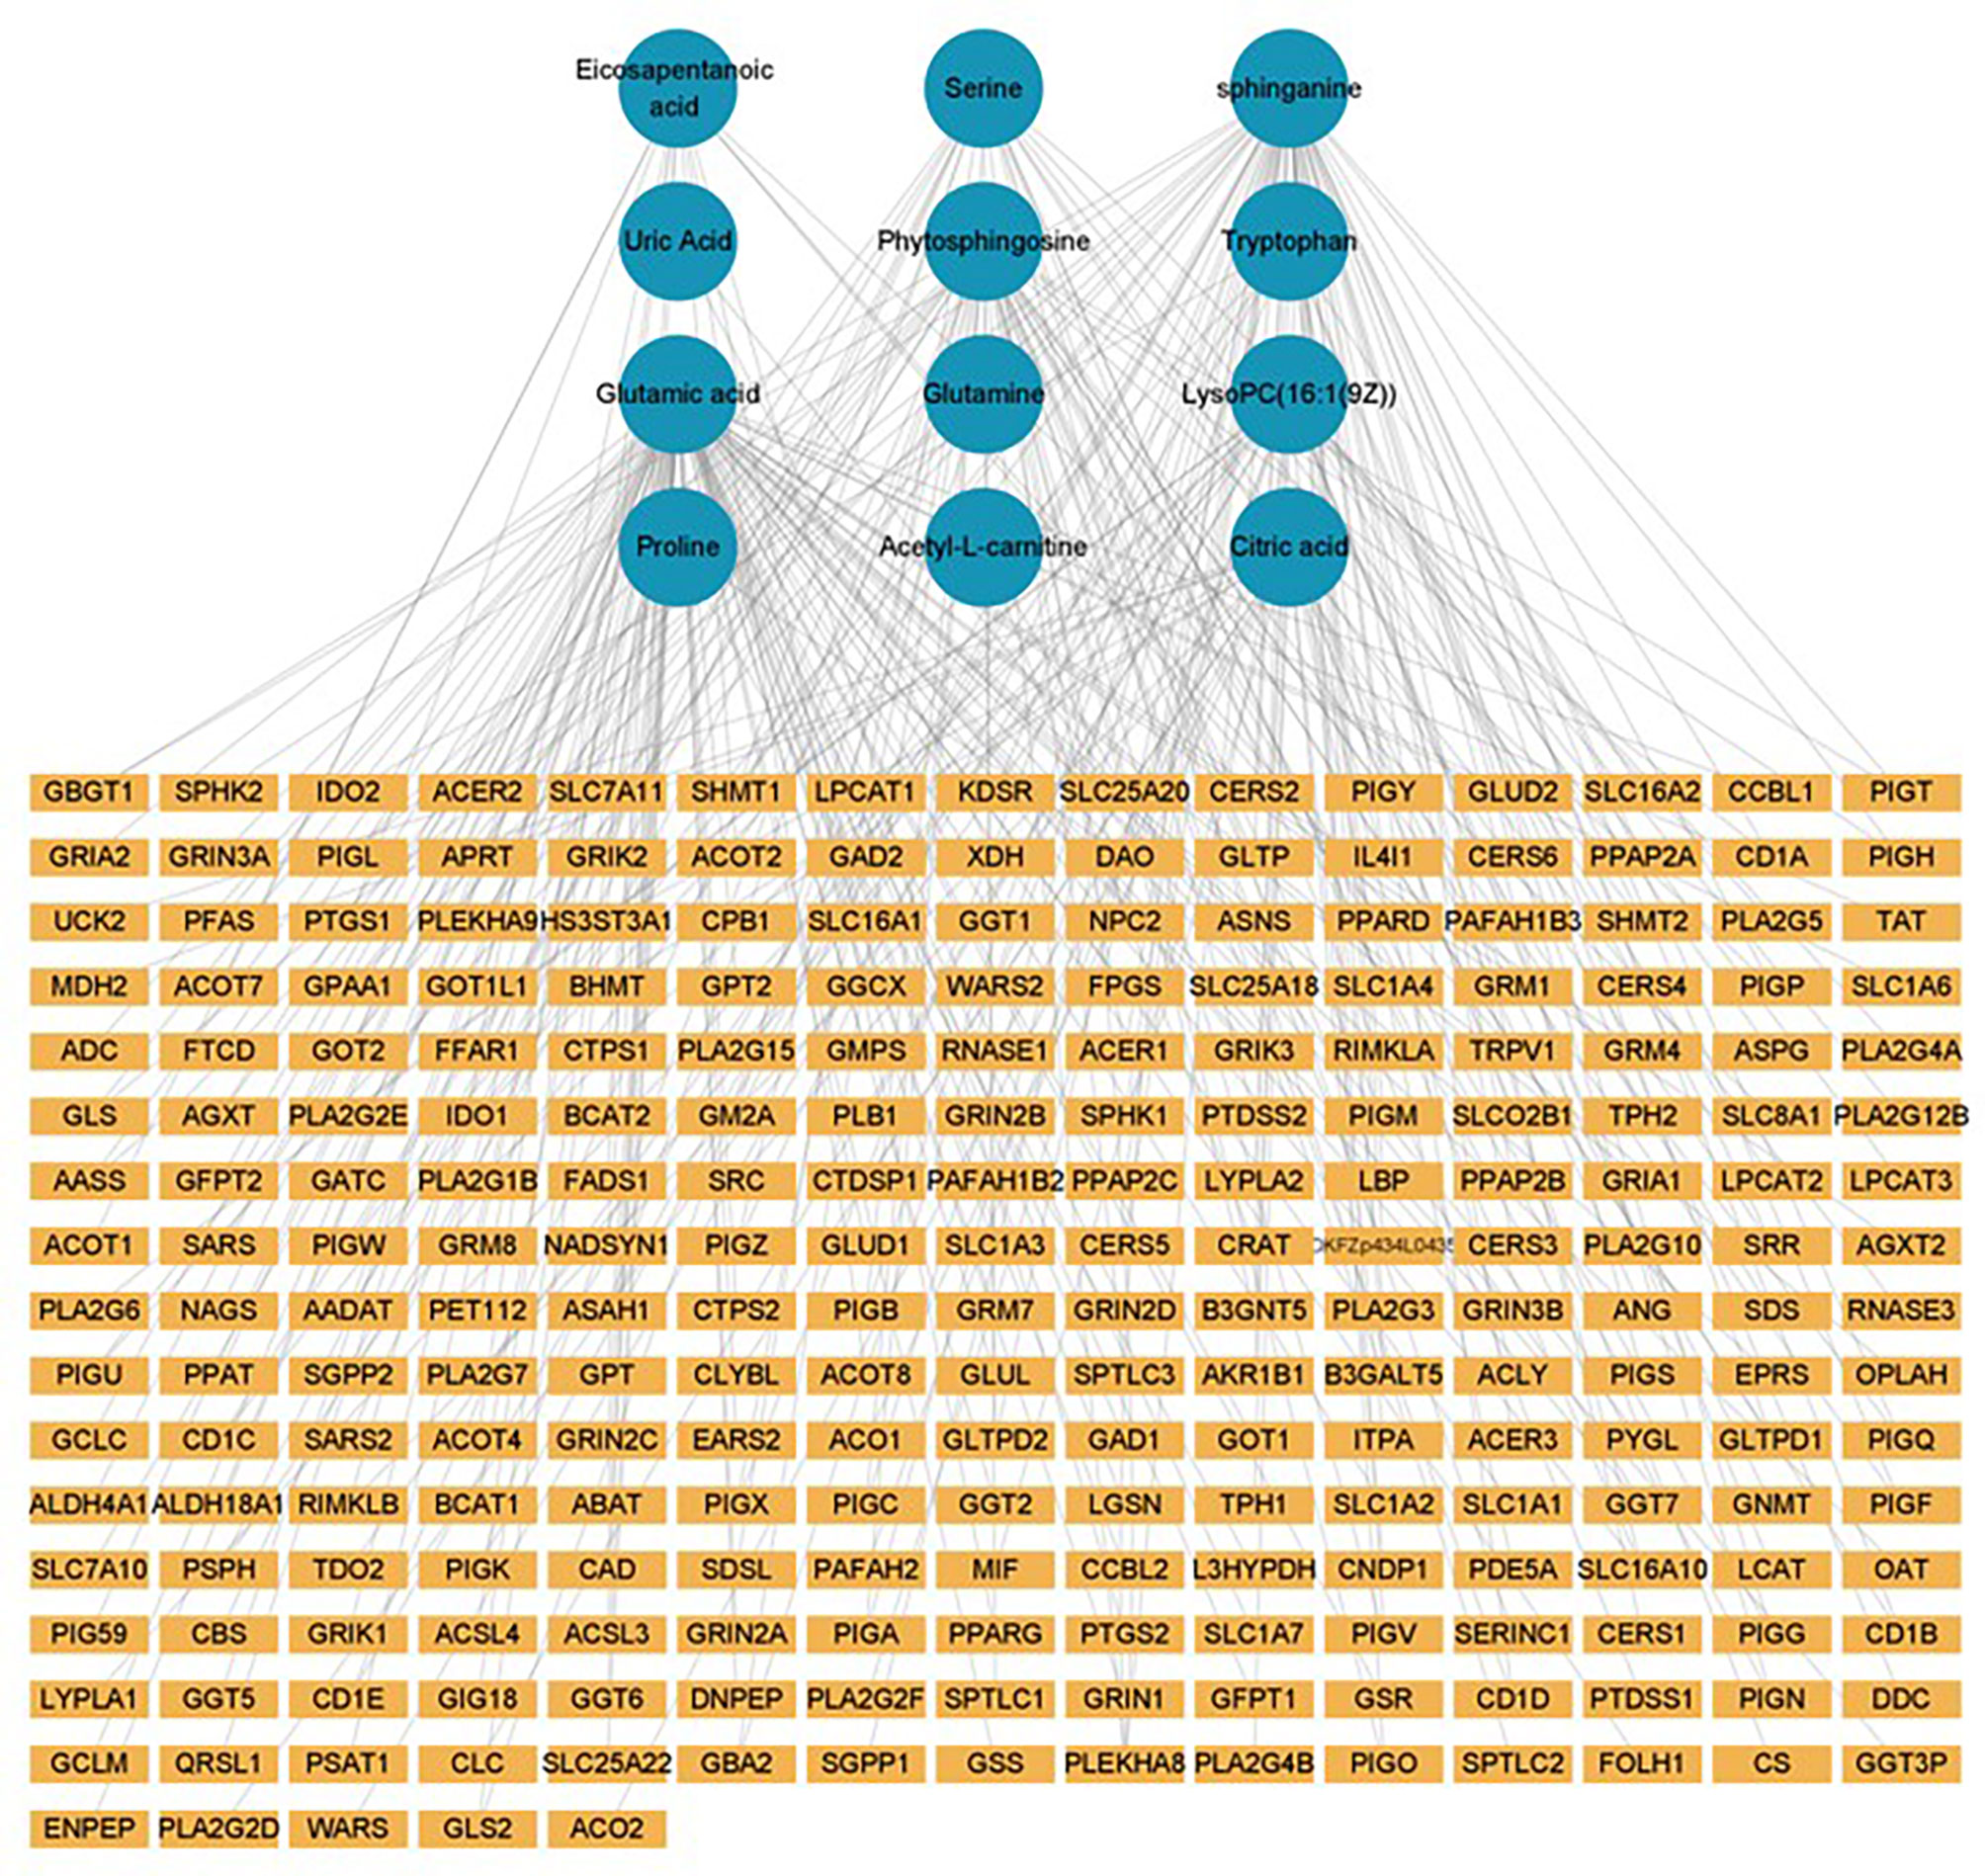
Figure 7 Metabolite-gene network (green circle: metabolite, yellow rectangle: gene).
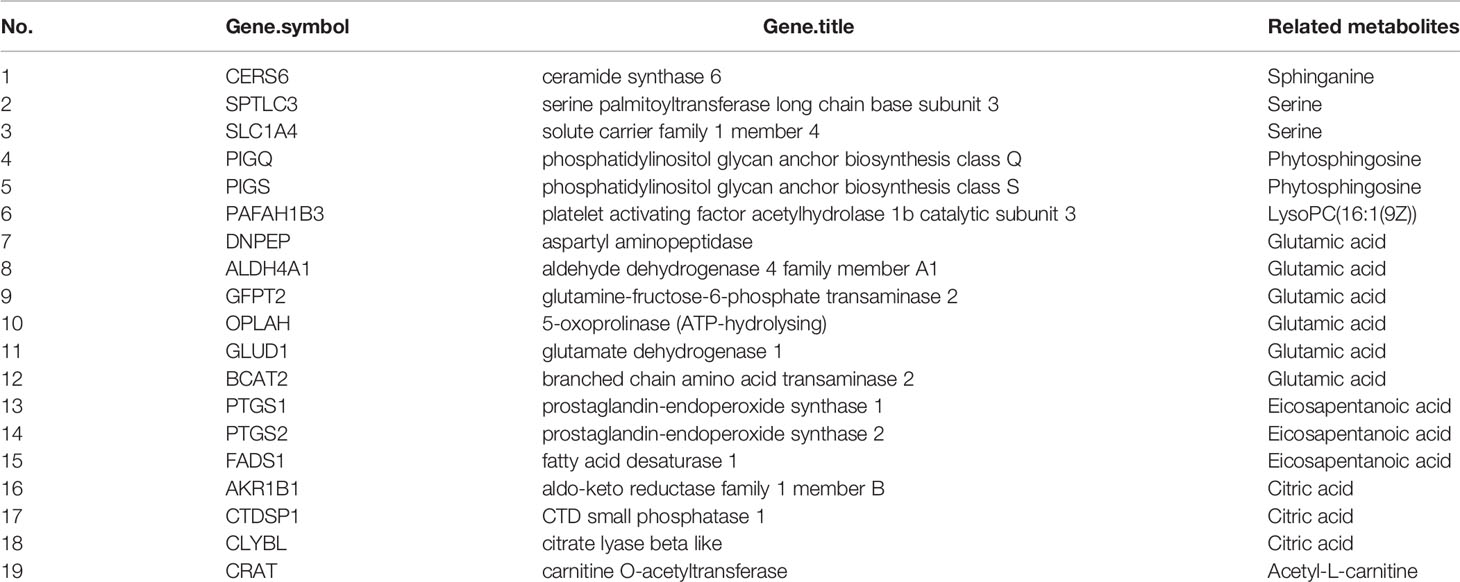
Table 5 The key targets identified by integration analysis of metabolomic and transcriptomic data.
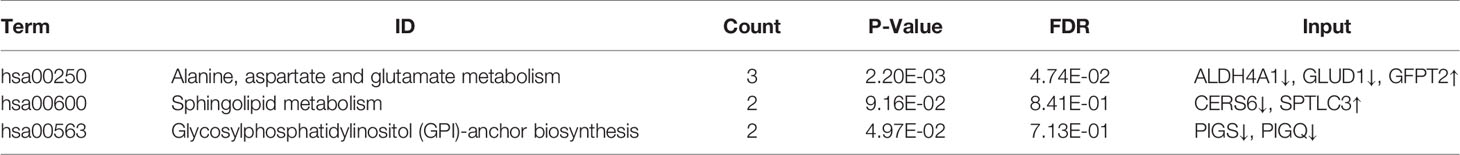
Table 6 KEGG enrichment pathway of genes.
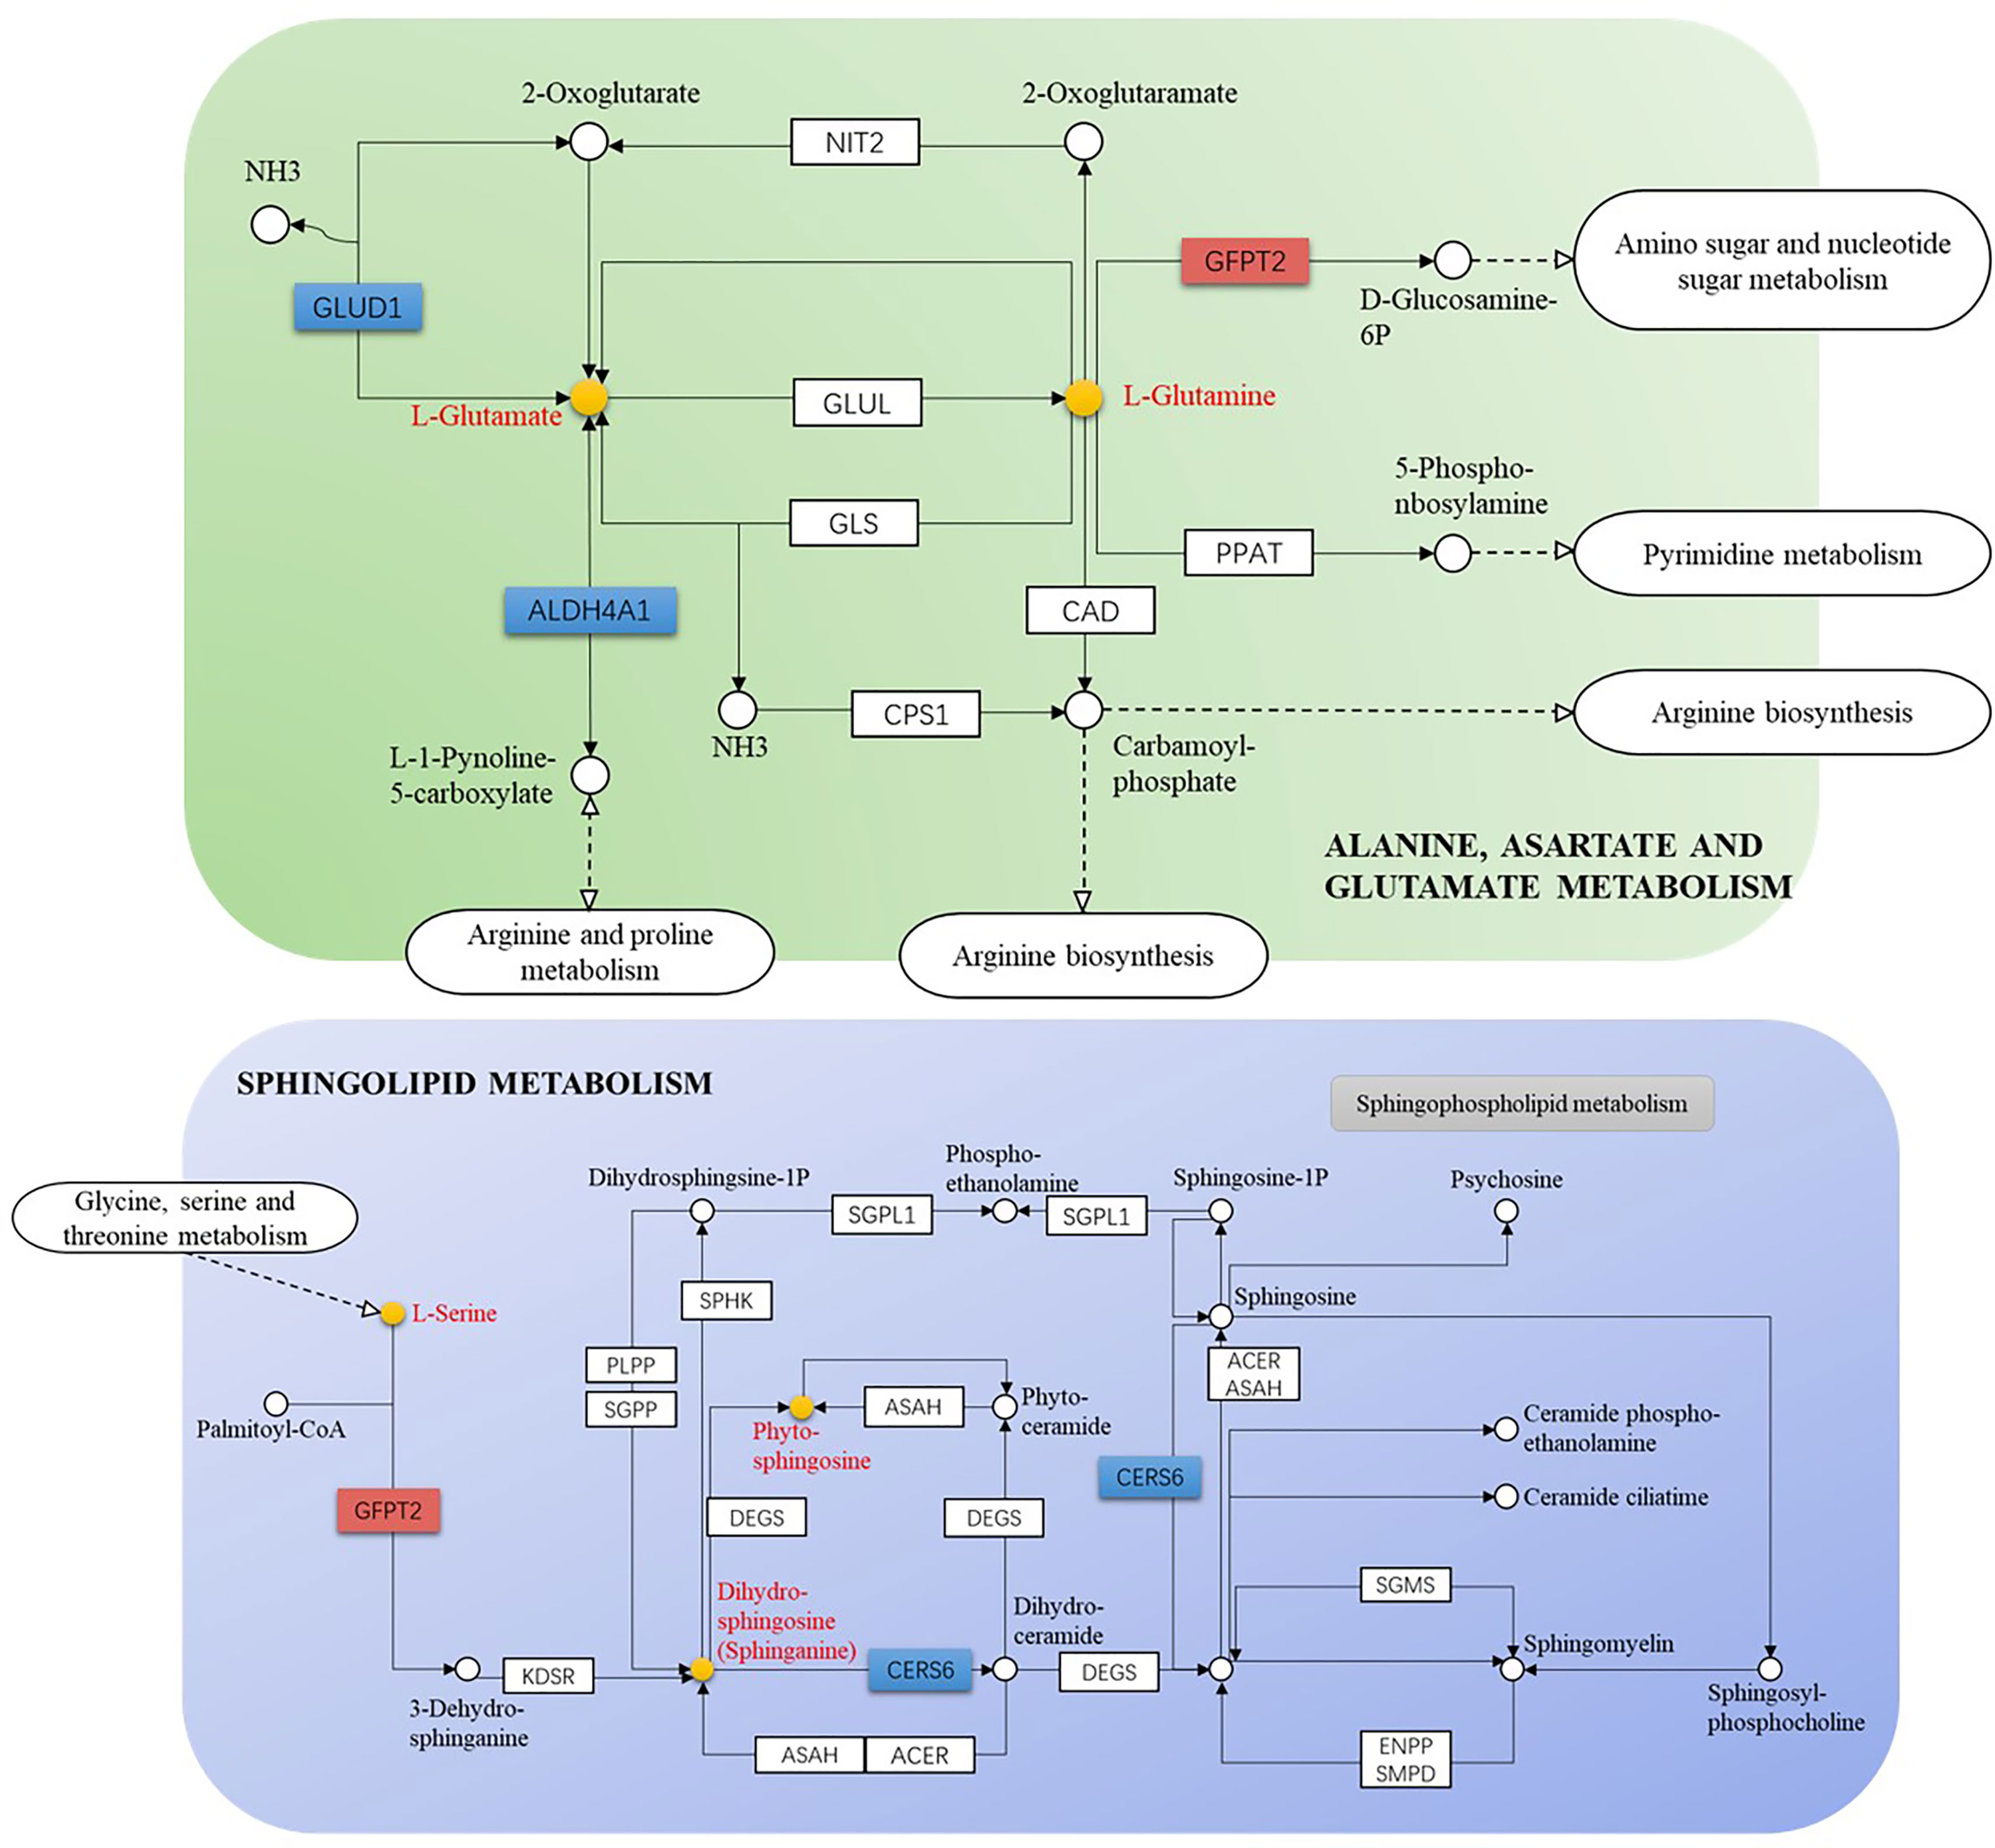
Figure 8 Gene-metabolite connection network diagram (yellow circle: key metabolite, blue rectangle: key protein level decreased, orange rectangle: key protein level increased).
Construction of Metabolite Diagnostic Model
The AUC of the EOLP and ROLP metabolites were calculated, and the results were shown in Tables 2, 3, and 4, respectively. According to the ranking of the AUC value combined with the VIP value, eicosapentanoic acid, citric acid, and serine were finally selected as the biomarkers between EOLP and HC (Figures 9A–C). Eicosapentanoic acid, taurine, and serine are the biomarkers between ROLP and HC (Figures 9D–F). Sphingosine, deoxycholic acid, and 3b,7a-Dihydroxy-5b-cholanoic acid are the biomarkers between EOLP and ROLP (Figures 9G–I). The binary Logistic regression is used to evaluate the diagnostic efficacy of the model in the validation group. According to the predictive sensitivity and specificity of the model, the test variable value with the highest Youden index (EOLP/HC=0.500, ROLP/HC=0.500, EOLP/ROLP=0.512) is selected as the best diagnostic cut-off value, EOLP and HC group. The diagnostic accuracy of ROLP and HC groups reached 100%, and the diagnostic accuracy of EOLP and ROLP reached 92.68% (Figure 9J).
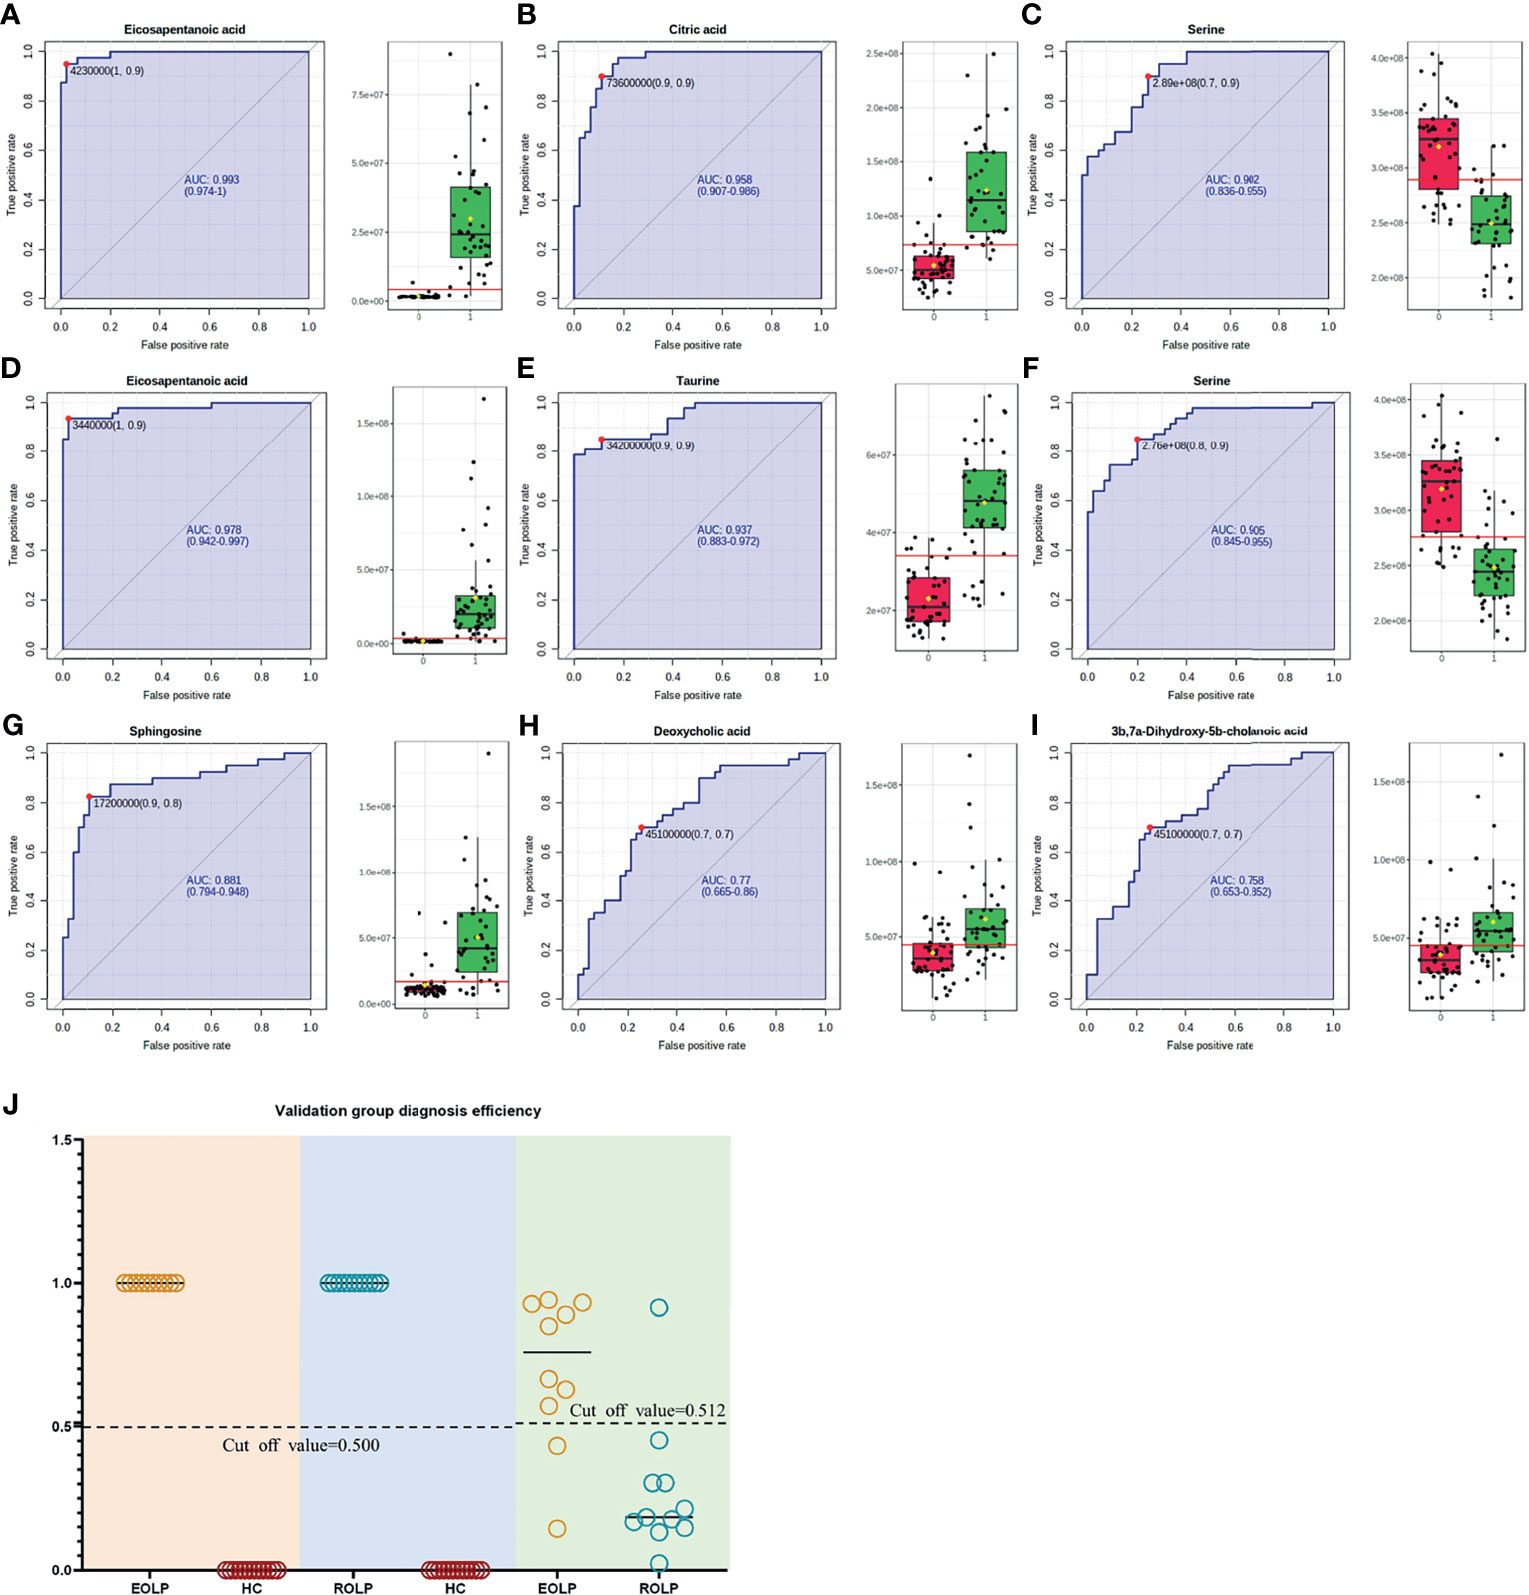
Figure 9 ROC curves of Eicosapentanoic acid (A), Citric acid (B), and Serine (C) in the EOLP group and HC group; Eicosapentanoic acid (D), Taurine (E), and Serine (F) in the ROLP group and HC group; Sphingosine (G), deoxycholic acid (H), and 3b,7a-Dihydroxy-5b-cholanoic acid (I) in the EOLP group and ROLP group. Validation group diagnosis efficiency (J).
Discussion
The metabolic data of serum samples from EOLP, ROLP, and healthy controls were comprehensively analyzed based on the UHPLC/Q-Orbitrap HRMS technology. The metabolic phenotype changes of the two types of OLP were clarified, and the ideal diagnostic models of EOLP and ROLP were constructed respectively. We used transcriptomics data to identify key genes that share differentially expressed metabolites, and found the key signaling pathways and metabolic pathways involved in OLP. This study not only reveals the regulatory characteristics of different types of OLP metabolic networks, but also explores the key the related pathological processes of OLP, and elucidates the gene metabolism network of OLP.
Among many different metabolites, we found that eicosapentanoic acid (EPA) is the most variable biomarker in EOLP and ROLP. It was known that the pathogenesis of OLP is closely related to changes in immune function and inflammation (11, 12). Chronic inflammation is one of the reasons of tumorigenesis (13, 14). Studies have shown that EPA can improve human immune function and has anti-inflammatory effects (15). This study found that the content of EPA in the diseased group was significantly higher than that in the healthy control group (FC<1), which may be related to the increased inflammation and immune dysfunction of OLP. In addition, EPA can inhibit the production of inflammatory cytokines, such as tumor necrosis factor (TNF-α), and in turn affect its downstream activities, including the inhibition of NF-κB (16). NF-κB plays a key role in the process of cellular inflammation and immune response (17). The mis-regulation of NF-κB can cause autoimmune diseases, chronic inflammation and cancers (18–20). Studies have shown that TNF-α is overexpressed in OLP patients, and the metabolic changes of EPA may be related to the high expression of TNF-α and the activation of the NF-κB signaling pathway. Interestingly, EPA has a greater fold change in the EOLP group, so we speculate that the increase in EPA is likely to indicate the progression of the disease, which requires further research.
In this study, the content of glutamic acid decreased in the OLP group. Glutamic acid is believed to play a significant role in regulating the body’s oxidative stress (21). Oxidative stress accompanied by inflammation will aggravate the onset and progression of OLP (22). Abnormal metabolism of glutamate and hypoxanthine may induce oxidative stress in the body, leading to OLP. Previous studies suggest that most patients with OLP have emotional stress such as insomnia and anxiety, and mental factors can stimulate the occurrence and development of OLP (23). In this study, it was found that more people lacked of sleep in the OLP group. Tryptophan is the precursor of serotonin (5-HT) produced in the periphery and the central nervous system (24, 25). Serotonin has long been considered an important regulator of mood, especially in the pathophysiology of depression (26). A large number of studies have shown that 5-HT can reduce the level of tryptophan by reducing the availability of its precursor (27). In this study, it was found that tryptophan levels decreased to varying degrees in the EOLP and ROLP groups, and the level of decrease in EOLP was slightly higher than that in the ROLP group. We speculate that the level of tryptophan may indirectly affects the emotional status of OLP patients, thereby intervening the progression of the disease.
This study found that sphingolipids in OLP patients were lower than those in the healthy control group, and the sphingolipid metabolism pathway may be involved in the pathogenesis of OLP. Sphingolipids and their metabolites are not only important structural molecules that constitute cell membranes, but also participate in many important signal transduction processes such as the regulation of cell growth, differentiation, senescence and programmed cell death (28, 29). The decrease in the levels of sphinganine and phytosphingosine in OLP patients may be one of the important reasons for inducing cell destruction and apoptosis. Other studies have shown that many sphingolipid regulators (such as sphinganine) are closely related to the occurrence and development of cancers (30). OLP could progress to malignant disease, and the relationship between the reduction of sphingolipids and OLP carcinogenesis remains to be further explored.
In addition, several key regulatory genes were found after integrating the transcriptomics data, which provided evidence for the biosynthetic pathways and regulatory mechanisms of key metabolites. The canonical role of glutamate dehydrogenase 1 (GLUD1) is a consequence of the efficient transference by transaminases of the α-amino group of several amino acids to 2-OG forming glutamic acid (31). Therefore, the decrease in GLUD1 level may be one of the direct reasons for the decrease in glutamic acid content. The mRNA level of GFPT2 has been up-regulated in many cancers such as glioblastoma, lung adenocarcinoma and breast cancer (32, 33). This study found that the GFPT2 level was up-regulated in OLP patients, which may be the regulatory mechanism related to OLP malignant transformation.
This study provides a new perspective for the diagnosis and pathological mechanism of the two types of OLP, but it has some limitations. Although the diagnostic metabolites of EOLP and ROLP have been identified in this study, the sample size of the data is not large enough and comes from the same center. The extensiveness and specificity of diagnostic markers still need a larger sample size for further research. Also, the transcriptomics data in this article are derived from online database, and lack of experimental validation, which may impact final results. However, through the integration of transcriptomics and metabolomics data, this article provides certain information on the relationship between metabolites and DEGs, and comprehensively clarifies the metabolic characteristics of OLP.
In summary, compared with HC group, this study identified 19 and 25 differential metabolites in patients with EOLP and ROLP, respectively. A total of 14 different metabolites were identified between EOLP and ROLP. Two important metabolic pathways directly related to OLP have been found. A model of potential metabolic diagnostic markers of EOLP, ROLP and HC was constructed. These findings clarify the characteristics of OLP gene metabolism, and provide guidance for further analysis of OLP-related genes and metabolic information in the future.
Data Availability Statement
The original contributions presented in the study are included in the article/Supplementary Material. Further inquiries can be directed to the corresponding authors.
Ethics Statement
The studies involving human participants were reviewed and approved by Ethics Committee of the First Affiliated Hospital of Zhengzhou University. The patients/participants provided their written informed consent to participate in this study.
Author Contributions
M-zX and Y-yS conducted the study and drafted the original manuscript. H-yZ and ZS supervised the research. M-zX, Y-yS, C-sL, and H-xM performed the experiments. M-zX, Y-yS, C-sL, and NL analyzed data. L-hZ, L-wL, Q-zD, PX, ZS, and H-yZ revised the manuscript. All authors contributed to the article and approved the submitted version.
Funding
This study was supported by the Key Scientific Research Project of Henan Institution of Higher Education (21A320025), Henan Province Medical Science and Technology Research Plan (SBGJ202002116 and 212102310104).
Conflict of Interest
The authors declare that the research was conducted in the absence of any commercial or financial relationships that could be construed as a potential conflict of interest.
Publisher’s Note
All claims expressed in this article are solely those of the authors and do not necessarily represent those of their affiliated organizations, or those of the publisher, the editors and the reviewers. Any product that may be evaluated in this article, or claim that may be made by its manufacturer, is not guaranteed or endorsed by the publisher.
Acknowledgments
We would like to thank all the participants, as well as all volunteers who helped us collect samples.
Supplementary Material
The Supplementary Material for this article can be found online at: https://www.frontiersin.org/articles/10.3389/fonc.2021.769163/full#supplementary-material
References
1. Bonar-Alvarez P, Perez Sayans M, Garcia-Garcia A, Chamorro-Petronacci C, Gandara-Vila P, Luces-Gonzalez R, et al. Correlation Between Clinical and Pathological Features of Oral Lichen Planus: A Retrospective Observational Study. Medicine (Baltimore) (2019) 98:e14614. doi: 10.1097/MD.0000000000014614
2. Gonzalez-Moles MA, Warnakulasuriya S, Gonzalez-Ruiz I, Gonzalez-Ruiz L, Ayen A, Lenouvel D, et al. Worldwide Prevalence of Oral Lichen Planus: A Systematic Review and Meta-Analysis. Oral Dis (2021) 27:813–28. doi: 10.1111/odi.13323
3. Olson MA, Rogers RS 3rd, Bruce AJ. Oral lichen planus. Clin Dermatol (2016) 34:495–504. doi: 10.1016/j.clindermatol.2016.02.023
4. Gonzalez-Moles MA, Ruiz-Avila I, Gonzalez-Ruiz L, Ayen A, Gil-Montoya JA, Ramos-Garcia P. Malignant Transformation Risk of Oral Lichen Planus: A Systematic Review and Comprehensive Meta-Analysis. Oral Oncol (2019) 96:121–30. doi: 10.1016/j.oraloncology.2019.07.012
5. Giuliani M, Troiano G, Cordaro M, Corsalini M, Gioco G, Lo Muzio L, et al. Rate of Malignant Transformation of Oral Lichen Planus: A Systematic Review. Oral Dis (2019) 25:693–709. doi: 10.1111/odi.12885
6. Yang XY, Li XZ, Zhang SN. Metabolomics Analysis of Oral Mucosa Reveals Profile Perturbation in Reticular Oral Lichen Planus. Clin Chim Acta (2018) 487:28–32. doi: 10.1016/j.cca.2018.09.021
7. Yang XY, Li XZ, Zhang SN. Urinary Metabolomic Signatures in Reticular Oral Lichen Planus. Heliyon (2020) 6:e04041. doi: 10.1016/j.heliyon.2020.e04041
8. Li XZ, Zhang SN, Yang XY. Serum-Based Metabolomics Characterization of Patients With Reticular Oral Lichen Planus. Arch Oral Biol (2019) 99:183–9. doi: 10.1016/j.archoralbio.2019.01.019
9. Cruz AF, Vitorio JG, Duarte-Andrade FF, Diniz MG, Canuto GAB, de Toledo JS, et al. Reticular and Erosive Oral Lichen Planus Have a Distinct Metabolomic Profile: A Preliminary Study Using Gas Chromatography-Mass Spectrometry. J Oral Pathol Med (2019) 48:400–5. doi: 10.1111/jop.12842
10. Wang XS, Sun Z, Liu LW, Du QZ, Liu ZS, Yang YJ, et al. Potential Metabolic Biomarkers for Early Detection of Oral Lichen Planus, a Precancerous Lesion. Front Pharmacol (2020) 11:603899. doi: 10.3389/fphar.2020.603899
11. Scully C, Carrozzo M. Oral Mucosal Disease: Lichen Planus. Br J Oral Maxillofac Surg (2008) 46:15–21. doi: 10.1016/j.bjoms.2007.07.199
12. Mignogna MD, Fedele S, Lo Russo L, Lo Muzio L, Bucci E. Immune Activation and Chronic Inflammation as the Cause of Malignancy in Oral Lichen Planus: Is There Any Evidence? Oral Oncol (2004) 40:120–30. doi: 10.1016/j.oraloncology.2003.08.001
13. O'Byrne KJ, Dalgleish AG. Chronic Immune Activation and Inflammation as the Cause of Malignancy. Br J Cancer (2001) 85(4):473–83. doi: 10.1054/bjoc.2001.1943
14. Clevers H. At the Crossroads of Inflammation and Cancer. Cell (2004) 118:671–4. doi: 10.1016/j.cell.2004.09.005
15. Gutierrez S, Svahn SL, Johansson ME. Effects of Omega-3 Fatty Acids on Immune Cells. Int J Mol Sci (2019) 20:5028. doi: 10.3390/ijms20205028
16. Zhao Y, Joshi-Barve S, Barve S, Chen LH. Eicosapentaenoic Acid Prevents LPS-Induced TNF-Alpha Expression by Preventing NF-kappaB Activation. J Am Coll Nutr (2004) 23:71–8. doi: 10.1080/07315724.2004.10719345
17. Pflug KM, Sitcheran R. Targeting NF-kappaB-Inducing Kinase (NIK) in Immunity, Inflammation, and Cancer. Int J Mol Sci (2020) 21:8470. doi: 10.3390/ijms21228470
18. Wang J, Zhai X, Guo J, Li Y, Yang Y, Wang L, et al. Long non-Coding RNA DQ786243 Modulates the Induction and Function of CD4(+) Treg Cells Through Foxp3-miR-146a-NF-kappaB Axis: Implications for Alleviating Oral Lichen Planus. Int Immunopharmacol (2019) 75:105761. doi: 10.1016/j.intimp.2019.105761
19. Liu J, Geng F, Sun H, Wang X, Zhang H, Yang Q, et al. Candida Albicans Induces TLR2/MyD88/NF-kappaB Signaling and Inflammation in Oral Lichen Planus-Derived Keratinocytes. J Infect Dev Ctries (2018) 12:780–6. doi: 10.3855/jidc.8062
20. Soleimani A, Rahmani F, Ferns GA, Ryzhikov M, Avan A, Hassanian SM. Role of the NF-kappaB Signaling Pathway in the Pathogenesis of Colorectal Cancer. Gene (2020) 726:144132. doi: 10.1016/j.gene.2019.144132
21. Tang W, Wu J, Jin S, He L, Lin Q, Luo F, et al. Glutamate and Aspartate Alleviate Testicular/Epididymal Oxidative Stress by Supporting Antioxidant Enzymes and Immune Defense Systems in Boars. Sci China Life Sci (2020) 63:116–24. doi: 10.1007/s11427-018-9492-8
22. Banerjee S, Mukherjee S, Mitra S, Singhal P. Comparative Evaluation of Mitochondrial Antioxidants in Oral Potentially Malignant Disorders. Kurume Med J (2020) 66:15–27. doi: 10.2739/kurumemedj.MS661009
23. Liao H, Luo Y, Long L, Peng J, Qiu X, Yuan P, et al. Anxiety and Oral Lichen Planus. Oral Dis (2021) 27:506–14. doi: 10.1111/odi.13569
24. Riedel WJ, Sobczak S, Schmitt JA. Tryptophan Modulation and Cognition. Adv Exp Med Biol (2003) 527:207–13. doi: 10.1007/978-1-4615-0135-0_24
25. Richard DM, Dawes MA, Mathias CW, Acheson A, Hill-Kapturczak N, Dougherty DM. L-Tryptophan: Basic Metabolic Functions, Behavioral Research and Therapeutic Indications. Int J Tryptophan Res (2009) 2:45–60. doi: 10.4137/ijtr.s2129
26. Pennanen L, van der Hart M, Yu L, Tecott LH. Impact of Serotonin (5-HT)2C Receptors on Executive Control Processes. Neuropsychopharmacology (2013) 38:957–67. doi: 10.1038/npp.2012.258
27. Cowen PJ, Browning M. What has Serotonin to do With Depression? World Psychiatry (2015) 14(2):158–60. doi: 10.1002/wps.20229
28. Laychock SG, Tian Y, Sessanna SM. Endothelial Differentiation Gene Receptors in Pancreatic Islets and INS-1 Cells. Diabetes (2003) 52:1986–93. doi: 10.2337/diabetes.52.8.1986
29. Spiegel S, Kolesnick R. Sphingosine 1-Phosphate as a Therapeutic Agent. Leukemia (2002) 16:1596–602. doi: 10.1038/sj.leu.2402611
30. Bieberich E. Ceramide Signaling in Cancer and Stem Cells. Future Lipidol (2008) 3:273–300. doi: 10.2217/17460875.3.3.273
31. Moreno-Sanchez R, Marin-Hernandez A, Gallardo-Perez JC, Pacheco-Velazquez SC, Robledo-Cadena DX, Padilla-Flores JA, et al. Physiological Role of Glutamate Dehydrogenase in Cancer Cells. Front Oncol (2020) 10:429. doi: 10.3389/fonc.2020.00429
32. Zhang W, Bouchard G, Yu A, Shafiq M, Jamali M, Shrager JB, et al. GFPT2-Expressing Cancer-Associated Fibroblasts Mediate Metabolic Reprogramming in Human Lung Adenocarcinoma. Cancer Res (2018) 78:3445–57. doi: 10.1158/0008-5472.CAN-17-2928
Keywords: oral lichen planus, biomarkers, metabolomics, transcriptomics, pathogenesis
Citation: Xin M-z, Shi Y-y, Li C-s, Zuo L-h, Li N, Liu L-w, Ma H-x, Du Q-z, Xue P, Sun Z and Zhao H-y (2021) Metabolomics and Transcriptomics Analysis on Metabolic Characteristics of Oral Lichen Planus. Front. Oncol. 11:769163. doi: 10.3389/fonc.2021.769163
Received: 01 September 2021; Accepted: 04 October 2021;
Published: 19 October 2021.
Edited by:
Zhe-Sheng Chen, St. John’s University, United StatesReviewed by:
Dechao Bu, Institute of Computing Technology (CAS), ChinaZhi Wang, Sun Yat-sen University, China
Copyright © 2021 Xin, Shi, Li, Zuo, Li, Liu, Ma, Du, Xue, Sun and Zhao. This is an open-access article distributed under the terms of the Creative Commons Attribution License (CC BY). The use, distribution or reproduction in other forums is permitted, provided the original author(s) and the copyright owner(s) are credited and that the original publication in this journal is cited, in accordance with accepted academic practice. No use, distribution or reproduction is permitted which does not comply with these terms.
*Correspondence: Hong-yu Zhao, emhvbmd5dTkzQDE2My5jb20=; Zhi Sun, c3VuemhpMjAxM0AxNjMuY29t
†These authors have contributed equally to this work and share first authorship