 Gedmante Radziuviene1,2*
 Allan Rasmusson1,3Renaldas Augulis1,3Ruta Barbora Grineviciute1
 Dovile Zilenaite1,3Aida Laurinaviciene1,3Valerijus Ostapenko4Arvydas Laurinavicius1,3
- 1National Center of Pathology, Affiliate of Vilnius University Hospital Santaros Clinics, Vilnius, Lithuania
- 2Institute of Biosciences, Life Sciences Center, Vilnius University, Vilnius, Lithuania
- 3Faculty of Medicine, Institute of Biomedical Sciences, Vilnius University, Vilnius, Lithuania
- 4Department of Breast Surgery and Oncology, National Cancer Institute, Vilnius, Lithuania
Breast cancer (BC) categorized as human epidermal growth factor receptor 2 (HER2) borderline [2+ by immunohistochemistry (IHC 2+)] presents challenges for the testing, frequently obscured by intratumoral heterogeneity (ITH). This leads to difficulties in therapy decisions. We aimed to establish prognostic models of overall survival (OS) of these patients, which take into account spatial aspects of ITH and tumor microenvironment by using hexagonal tiling analytics of digital image analysis (DIA). In particular, we assessed the prognostic value of Immunogradient indicators at the tumor–stroma interface zone (IZ) as a feature of antitumor immune response. Surgical excision samples stained for estrogen receptor (ER), progesterone receptor (PR), Ki67, HER2, and CD8 from 275 patients with HER2 IHC 2+ invasive ductal BC were used in the study. DIA outputs were subsampled by HexT for ITH quantification and tumor microenvironment extraction for Immunogradient indicators. Multiple Cox regression revealed HER2 membrane completeness (HER2 MC) (HR: 0.18, p = 0.0007), its spatial entropy (HR: 0.37, p = 0.0341), and ER contrast (HR: 0.21, p = 0.0449) as independent predictors of better OS, with worse OS predicted by pT status (HR: 6.04, p = 0.0014) in the HER2 non-amplified patients. In the HER2-amplified patients, HER2 MC contrast (HR: 0.35, p = 0.0367) and CEP17 copy number (HR: 0.19, p = 0.0035) were independent predictors of better OS along with worse OS predicted by pN status (HR: 4.75, p = 0.0018). In the non-amplified tumors, three Immunogradient indicators provided the independent prognostic value: CD8 density in the tumor aspect of the IZ and CD8 center of mass were associated with better OS (HR: 0.23, p = 0.0079 and 0.14, p = 0.0014, respectively), and CD8 density variance along the tumor edge predicted worse OS (HR: 9.45, p = 0.0002). Combining these three computational indicators of the CD8 cell spatial distribution within the tumor microenvironment augmented prognostic stratification of the patients. In the HER2-amplified group, CD8 cell density in the tumor aspect of the IZ was the only independent immune response feature to predict better OS (HR: 0.22, p = 0.0047). In conclusion, we present novel prognostic models, based on computational ITH and Immunogradient indicators of the IHC biomarkers, in HER2 IHC 2+ BC patients.
Introduction
Breast cancer (BC) is a complex and diverse disease with distinct clinical, pathological, and molecular characteristics. The multifaceted nature of the disease leads to diverse clinical outcomes and therapeutic responses. BC has been classified into several biologically distinct subtypes: luminal A, luminal B, human epidermal growth factor receptor 2 (HER2)-enriched (HER2), basal-like, and normal-like by gene expression profiling analysis (1, 2), requiring different treatment strategies. This categorization of the BC subtypes has been adapted for clinical practice and is mainly based on immunohistochemistry (IHC) assessment of estrogen receptor (ER), progesterone receptor (PR), HER2, and Ki67 expression.
Routinely used predictive features, including clinicopathological parameters (age, tumor size, lymph node status, and histological grade) and biomarkers (ER, PR, and HER2) are insufficient for personalized clinical decisions in BC patients (3). Novel prognostic BC biomarkers have been intensively investigated as recently reviewed by Wu et al. (4). In particular, robust biomarkers are in demand for HER2-positive disease to improve selection of patients for current and emerging therapies of HER2-positive metastatic BC (5) as well as for prediction of resistance for anti-HER2 therapies, recurrence (6, 7), and particular consequences of the disease (8). Novel approaches based on pathology image analytics and machine learning methods open new perspectives for predictive modeling and clinical decision support (9, 10). Importantly, both molecular and image-based biomarkers can be explored and validated using The Cancer Genome Atlas (TCGA) Data Portal (11).
HER2 amplification and overexpression occur in approximately 15%–20% of invasive BC cases and are associated with worse patient survival as compared with non-amplified HER2 BC (12–15). A positive HER2 status predicts better effect of HER2-targeted therapies, and therefore, its accurate detection is essential for treatment decisions (16, 17).
While the majority of tumors can be categorized as either HER2-positive or HER2-negative by IHC and in situ hybridization (ISH) techniques, which are regarded as the standard methods to assess HER2 status in BC, borderline tumors do account for up to 18% of BCs (18, 19) and present challenges for patient assessment and therapy choices. In 2018, the American Society of Clinical Oncology (ASCO) and College of American Pathologists (CAP) updated the guidelines for HER2 testing with revised criteria for HER2 IHC borderline (IHC 2+) classification. This mainly focused on less common fluorescence ISH (FISH) patterns (ASCO/CAP groups 2, 3, and 4) and recommended to integrate them with a concomitant IHC review for a final HER2 result determination (20). The ambiguous FISH equivocal group (18), which poses therapeutic dilemmas, was removed, which resulted in an increased frequency of HER2-negative cases (21–24). Nevertheless, some studies report that HER2 equivocal tumors present similar clinical behaviors to the HER2-negative BC (25, 26), while others find differences in clinicopathological and prognostic aspects between these two categories (23). This suggests that the equivocal category represents an intermediate state between HER2-positive and HER2-negative tumors (27, 28).
Approximately 15%–30% of IHC 2+ cases are HER2-amplified (29), while the remaining IHC 2+ and IHC 1+ HER2 non-amplified tumors were recently designated as a relatively common “HER2-low” category, accounting for approximately 40%–55% of BC (30–32). This concept becomes important with the advent of a new generation of anti-HER2 agents. Specifically, ongoing clinical trials have demonstrated high efficacy of antibody–drug conjugates that are designed to target and deliver chemotherapy inside cancer cells in this particular subset of BC patients (33–35). The HER2-low BC group is not formally defined at present, but if treatment options will become available, the current dichotomous HER2 guidelines will have to be revised further to distinguish truly HER2-negative from HER2-low breast cancer (31).
The intratumoral heterogeneity (ITH) of HER2, at both protein expression and gene amplification levels, is a common feature of HER2-borderline tumors, which further complicates the assessment of HER2 status (36–40). In addition to the heterogeneous HER2 expression, the variable expression of hormone receptors (HRs) also contributes to the ITH and may further affect clinical outcomes and responses to treatment of BC (41, 42). Potential interactions between HR and HER2 signaling pathways, which could impact development of resistance to endocrine and anti-HER2 therapies, have been highlighted by several preclinical and clinical studies (43–48).
Current pathological IHC methods are based on the assessment of a proportion of HER2-positive tumor cells; however, ITH of HER2 expression may present a challenge in some tumors to be categorized with a single value (0, 1+, 2+, and 3+). Digital image analysis (DIA) has opened new opportunities in HER2 IHC assessment by providing biomarker quantification with increased accuracy, precision, reproducibility, and capacity (49–55). Studies have demonstrated that DIA can reliably distinguish HER2 IHC negative (0–1+) and positive (3+) cases and reduce the proportion of IHC 2+ cases (51–54). Importantly, continuous data and spatial aspects of IHC biomarker distribution can be revealed by DIA (56–58). Several diversity metrics (the Shannon entropy (59), the Simpson index (60), and Rao’s quadratic entropy (61) have been adapted for molecular, genetic, and microenvironmental heterogeneity assessments in BC) (62–65). Potts et al. examined HER2 expression ITH in BC by combining semiquantitative analysis with ecology diversity statistics (64). Both cell-level and tumor-level heterogeneities were evaluated, but the authors had doubts about the insufficient number of regions sampled to make an assessment of heterogeneity at a tumor level. Several recent studies (56–58) showed a successful assessment of ITH of IHC biomarkers in whole slide images (WSIs) based on hexagonal grid subsampling of DIA data; importantly, this methodology enabled retrieval of prognostically informative spatial heterogeneity indicators of tissue biomarker expression.
Although ITH may challenge the efficacy of therapy, it may be also associated with favorable prognostic effects, since a greater mutational load could lead to an increased tumor neo-antigen generation that attracts immune cells and stimulate antitumor immunity (66, 67). However, immunogenicity is different among BC subtypes, with generally higher mutational load, higher numbers of tumor-infiltrating lymphocytes (TILs), and higher programmed death-ligand 1 (PD-L1) expression in triple-negative and lower in HR-positive subtypes (68–71). These differences may impact the efficacy of therapy with immune checkpoint inhibitors with significant responses achieved only in patients with triple-negative BC so far (72–74).
TILs have been recognized as a potential biomarker of survival on BC patients (75, 76); however, their prognostic significance varies in BC types (70). A positive prognostic role of CD8 cells has been demonstrated in ER-negative and triple-negative BC (77–79), but its prognostic value in HR-positive BC remains unclear (70, 80). Recent studies have shown that the distance between immune cells and cancer cells is clinically and prognostically important in BC (81–84). The methods for assessing TILs and their spatial distributions have been the focus of many studies. Recently, Krijgsman et al. (85) first applied an automated deep learning approach that identifies the tumor boundary and detects CD8-positive cells in IHC images, and then they analyzed the spatial distribution of CD8 lymphocytes in ER-positive invasive BC. They found that only the SD of the CD8 density (but not the mean of CD8 density) distribution was significantly associated with better survival, hypothesizing that it reflects the contribution from local high-density areas. In another study (84), the immune scores of cell abundance and spatial heterogeneity were quantified using a combination of fully automated H&E-stained image analysis and spatial statistics. High immune spatial scores, but not the abundance scores, were associated with poor prognosis in ER positive BC. Rasmusson et al. proposed a hexagonal grid-based methodology to automatically detect the tumor–host interface zone (IZ) and compute the immune cell density profile across the interface. The computed Immunogradient indicators provided the independent prognostic value in HR-positive breast and colorectal cancer patients (86).
In our study, we investigated ITH and immune response properties of HER2 IHC 2+ borderline BC patients with regard to their prognostic value. We utilized image DIA of IHC for ER, PR, Ki67, HER2, and CD8, with subsequent hexagonal grid analytics to extract combined prognostic overall survival (OS) models in HER2 IHC 2+ FISH-negative and FISH-positive patients.
Materials and Methods
Patients and Samples
This retrospective study included 275 patients, selected from an initial set of 302 patients with invasive ductal breast carcinoma diagnosed as HER2 borderline by IHC (IHC 2+), treated at the National Cancer Institute of Lithuania and investigated at the National Center of Pathology, affiliate of the Vilnius University Hospital Santaros Klinikos, between September 2012 and March 2017. The selected patients met the following criteria: 1) patients diagnosed with invasive ductal carcinoma; and 2) HER2 IHC 2+ cases assessed by a pathologist, tested routinely by HER2 FISH and ER, PR, Ki67, and CD8 IHC slides available for DIA. The cases without paraffin blocks available for CD8 IHC staining and available follow-up data were excluded (15 and 12 cases, respectively). Clinical and pathology information was collected retrospectively from the medical records. The study was approved by the Lithuanian Bioethics Committee (reference number: 40, April 26, 2007, updated on March 18, 2013, and on July 4, 2016).
Immunohistochemistry
Formalin-fixed paraffin-embedded (FFPE) surgical excision samples tissue were cut at 3µm thickness and mounted on positively charged slides and for IHC staining by Roche Ventana BenchMark ULTRA automated slide stainer (Ventana Medical Systems, Tucson, AZ). IHC for ER, PR, and HER2 was performed using ready-to-use antibodies (SP1, 1E2, and 4B5, respectively, Ventana (Tucson, Arizona, USA); for Ki67 and CD8—MIB-1, Dako (Glostrup, Denmark; dilution 1:100) and C8/144B, Dako (Glostrup, Denmark; dilution 1:100) antibodies, respectively. Visualization of ER, PR, Ki67, HER2, and CD8 was performed with the ultraView Universal DAB Detection kit (Ventana Medical Systems, Tucson, Arizona, USA). Tissue sections were counterstained with Mayer’s hematoxylin.
HER2 expression was scored as 0 (no staining, or incomplete membrane staining that is faint or barely perceptible and within ≤10% of the invasive tumor cells); 1+ (incomplete membrane staining that is faint or barely perceptible and within >10% of the invasive tumor cells); 2+ (weak-to-moderate complete membrane staining observed in >10% of tumor cells); or 3+ (circumferential membrane staining that is complete, is intense, and in >10% of tumor cells) according to the 2018 ASCO/CAP guidelines (20). IHC 0 and IHC 1+ were defined as HER2 negative, IHC 2+ was categorized as HER2 borderline, and IHC 3+ was categorized as HER2 positive.
Fluorescence In Situ Hybridization
HER2 FISH was performed on FFPE sections using the PathVysion HER2 DNA probe kit and Paraffin pretreatment kit (Abbott-Vysis, Inc., Downers Grove, IL, USA) as described in detail previously (87). Briefly, 4 µm thick sections were mounted on positively charged slides and dried overnight at 56°C. Subsequently, deparaffinization, dehydration, and pretreatment procedures were performed. After the digestion with protease, the hybridization mixture containing two fluorescently labeled DNA probes recognizing the HER2 locus (17q11.2-q12) and the centromeric region of CEP17 (17p11.1-q11.1) was applied to the target tissue. Denaturation and hybridization were performed in a hybridizer (Dako Diagnostics, Glostrup, Denmark). Then slides were washed, counterstained with DAPI, and coverslipped (Invitrogen Corporation, Carlsbad, USA). The samples were analyzed using a fluorescence microscope (Zeiss, Axio Imager.Z2, Gottingen, Germany) equipped with single-pass filters for DAPI, HER2, and CEP17, under a 63× oil immersion objective. All tumors were tested routinely by dual-probe FISH assay for final HER2 classification according to the ASCO/CAP guidelines (20).
Digital Image Acquisition, Analysis, and Calculation of Indicators
For the analysis of ER, PR, Ki67, and HER2, sections were scanned using a ScanScope XT Slide Scanner (Leica Aperio Technologies, Vista, CA, USA) at ×20 objective magnification (0.5 μm per pixel); CD8 IHC slides were scanned using an Aperio AT2 Slide Scanner (Leica Biosystems, Buffalo Grove, IL, USA) at ×20 objective magnification (0.5 μm per pixel). The DIA was performed on the WSIs with HALO™ software (version 3.0311.174; Indica Labs, Corrales, NM, USA) by three operators (RG, RA, and GR). Initially, the tissue was classified into the tumor, stroma, and background (consisting of glass, necrosis, and artifacts) by HALO AI™ classifier. Subsequently, the HALO Multiplex IHC and Membrane algorithms (versions 1.2 and 1.4, respectively) were applied to obtain coordinates of the cells in the IHC WSI. For quality assurance, all image analysis results were approved by the breast pathologist (RG).
Positive cell percentages for ER, PR, and Ki67 and the percentages of HER2 2+ and 3+ cells along with the cell membrane completeness (MC) indicator were obtained by the HALO DIA. ITH indicators were computed by systematic subsampling of the HALO DIA data using hexagonal tiling arrays as described previously in (56). Briefly, the cells were assigned to 825-pixel-sized hexagons (hexagon side length 257 µm) according to their extracted coordinates. Hexagons containing fewer than 50 cells were regarded as insufficient sampling and were excluded from further analyses. Subsequently, the percentages of ER, PR, Ki67, and HER2-positive cells were calculated for each hexagon to be ranked into 10 intervals (0%–10%, >10%–20%, >20%–30%, >30%–40%, >40%–50%, >50%–60%, >60%–70%, >70%–80%, >80%–90%, and >90%–100%). Based on the ranks, a co-occurrence matrix was constructed to compute Haralick’s texture indicators (contrast, dissimilarity, entropy, energy, and homogeneity) (88). The intratumoral distributions of ER, PR, Ki67, and HER2 expression were assessed for bimodality by Ashman’s D indicator as described previously (57).
The automated extraction of the IZ and Immunogradient indicators is described in detail in (86). In our study, an IZ width of seven hexagon ranks (hexagon side length 65 μm) was used. CD8 cell density was calculated in both 1) the WSI stroma and tumor areas and 2) within the tumor–stroma IZ, which consists of stroma (S), tumor (T), and tumor edge (TE) aspects. Subsequently, Immunogradient indicators (center of mass (CM) and immunodrop) representing CD8 cell density profiles across the IZ were computed. The CM indicator reflects CD8 cell density increase towards the tumor within the IZ, while the immunodrop indicator reflects an abrupt decrease of CD8 cell density across the TE (IZ rank 0) from stroma (IZ rank −1) to tumor (IZ rank 1), represented by the CD8 cell density ratio between rank −1 and rank 1.
Statistical Analysis
All continuous variables were tested for normal distribution by Kolmogorov–Smirnov test and compared by two-tiled Student’s t-test (for normally distributed variables) or the Mann–Whitney U test (for non-normally distributed variables). A log-transformation was applied to normalize the asymmetric distributions of immune response variables and to meet the assumptions of parametric statistical tests; they were used in one-way ANOVA followed by Bonferroni’s post-hoc test for pairwise comparisons and a two-sided Welch’s t-test for homogeneity of variances. Fisher’s exact test was used to assess the differences in clinicopathological variables among the analyzed groups.
A factor analysis was performed using the factoring method based on principal component analysis; factors were retained based on the threshold of an eigenvalue of 1; lastly, a general orthogonal varimax rotation of the initial factors was applied.
The optimal cutoff value for each indicator was determined using Cutoff Finder (89) to test the predictions of OS. The Kaplan–Meier method was applied to estimate the OS distributions with the log-rank test to compare survival differences between the stratified groups. To assess the prognostic factors, univariate and multivariate analyses were performed using the Cox proportional-hazards models. The “best” subset of variables to be included in the multivariate Cox proportional-hazards models was identified by leave-one-out cross-validation (90). All p-values were considered significant at the <0.05 level. Statistical analyses were performed with SAS software (version 9.4; SAS Institute Inc., Cary, NC, USA); plots were generated by R (version 4.1.0).
Results
Clinicopathological and Follow-Up Characteristics
Clinicopathological and follow-up characteristics of the HER2 non-amplified and HER2-amplified groups are summarized in Table 1. The median follow-up period was 64 (range 2–102) and 52 months (range 0.7–100) in the non-amplified and amplified HER2 cohorts, respectively. Forty-two patients died during the follow-up, including 22 (13.7%) and 20 (17.1%) in the non-amplified and amplified tumor subsets, respectively.
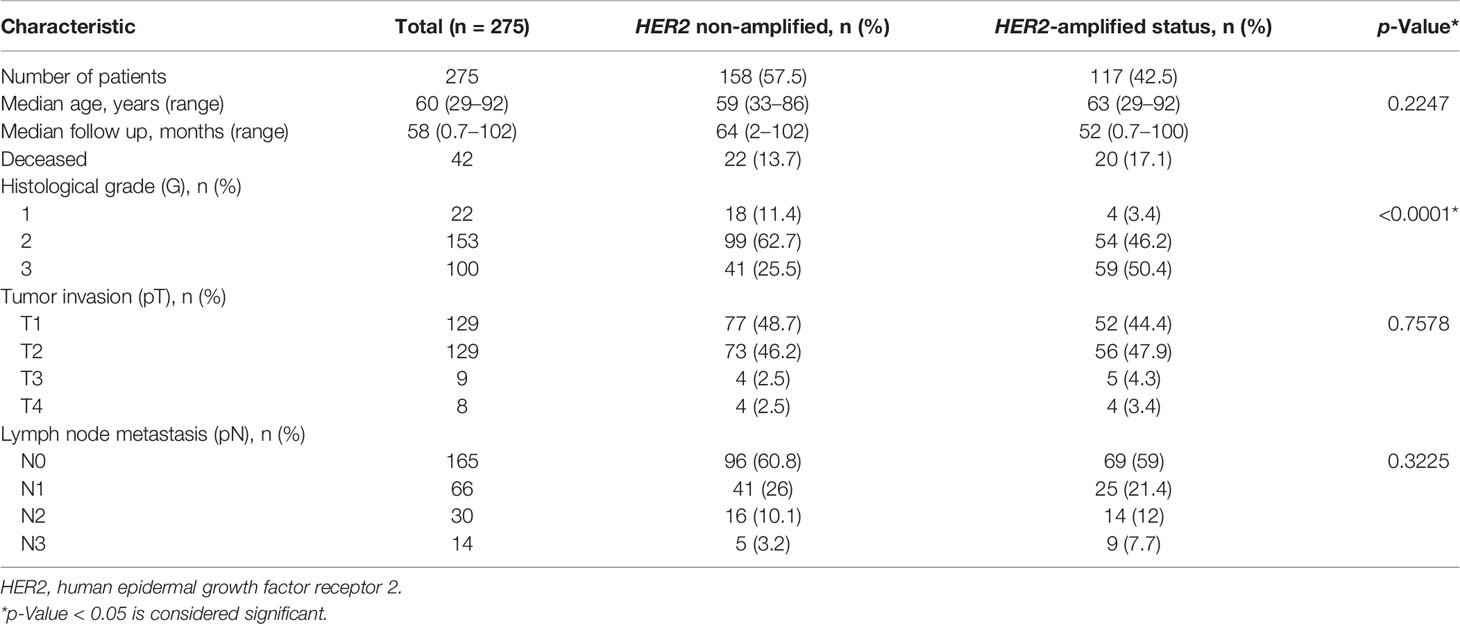
Table 1 Patient and tumor characteristics according to HER2 status.
Of the 275 IHC 2+ patients, 158 (57.5%) were diagnosed as HER2 non-amplified (HER2/CEP17 ratio <2.0; average HER2 copy number <4.0 signals per cell), while 117 (42.5%) were HER2-amplified (HER2/CEP17 ratio ≥2.0; average HER2 copy number ≥4.0 signals per cell) on the basis of the FISH results categorized according to 2018 ASCO/CAP guidelines (20). Fifty-nine (37.3%) FISH equivocal cases under the 2013 guidelines (18) were reclassified into HER2 non-amplified according to the 2018 guidelines (20).
The HER2-amplified group revealed significantly higher histological grade (p < 0.001) and higher frequency of increased CEP17 copy number (p = 0.0002) as compared with the HER2 non-amplified group (Table 1). Of note, 55 (34.8%) and 67 (57.3%) cases with CEP17 copy number ≥3 were detected in the HER2 non-amplified and HER2-amplified groups, respectively. No significant differences between the groups regarding the patient age, tumor stage, and node involvement were found.
Summary Statistics of Explored Indicators
Summary statistics of the variables in the HER2 non-amplified and HER2-amplified groups are presented in Supplementary Table 1; the variance plots of the significant differences are presented in Supplementary Figure 1.
In general, expression rates of ER and PR were higher, while Ki67 was lower in the HER2 non-amplified group. No significant difference in CD8 cell density distribution between tumor and stroma areas was observed in both the HER2 non-amplified (t = 1.72, p = 0.0867) and HER2-amplified (t = 1.07, p = 0.2841) groups. Also, the mean of CD8 density within the IZ was significantly higher in the S aspect than in the T aspect in both the HER2 non-amplified (t = 6.56, p < 0.001) and HER2-amplified (t = 6.17, p < 0.001) groups. The variance of CD8 cells was the highest in the S aspect, less in the TE aspect, and lowest in the T aspect of the IZ in both the HER2 non-amplified and HER2-amplified groups (p < 0.0001) (data not shown). No significant differences of CD8 cell densities neither in tumor nor stroma areas nor inside the IZ (T, TE, and S aspects) were found between the groups. ITH (higher contrast, dissimilarity, and entropy but lower energy and homogeneity) was higher only for Ki67 in the HER2-amplified group.
Factor Analysis of Immunohistochemistry, Fluorescence In Situ Hybridization, Immune Response, and Intratumoral Heterogeneity Indicators in HER2 Non-Amplified and HER2-Amplified Groups
A factor analysis was performed on the combined set of DIA IHC, FISH, immune response, and ITH data and six orthogonally independent factors in each patient group were extracted. The patterns of the factors are plotted in Supplementary Figures 2, 3, factor loadings obtained after varimax rotation are presented in Supplementary Tables 2, 3 for the HER2 non-amplified and HER2-amplified groups, respectively.
In the HER2 non-amplified BC cases, Factor 1 was characterized by positive loadings of the variables indicative of CD8 density within the IZ T, TE, and S aspects and was named CD8 density factor. Factor 2 showed positive loadings of HER2 FISH variables (HER2 copy number, HER2/CEP17 ratio, percentage of amplified cells calculated from HER2/CEP17 ratio, and percentage of amplified cells calculated by HER2 signals only) and was named the HER2 amplification factor. Factor 3 was characterized by increasing CD8 densities towards the T aspect of the IZ (strong positive loadings of the CD8 CM and its SD) and by moderate loading of CD8 density in the T aspect; therefore, it was named the CD8 density gradient. Factor 4 was represented by the Ki67% and Ki67 entropy indicators. Factor 5 was characterized by positive loadings of two Haralick’s texture indicators, namely, HER2 MC entropy and ER contrast, along with negative loading of ER%. This factor was interpreted as HER2&ER heterogeneity factor. Factor 6 was represented by PR% and PR entropy indicators.
Similarly, in HER2-amplified tumors, Factor 1 was the HER2 amplification factor, Factor 2 was the CD8 density factor, and Factor 3 (CD8 density gradient factor) was the main sources of variance. Factor 4 was characterized by strong positive loadings of Ki67% and Ki67 entropy indicators and by moderate negative loading of ER entropy. Factor 5 was represented by the percentage of both HRs along with the PR entropy. Factor 6 was characterized by strong positive loading of a single HER2 MC variable.
Prognostic Significance of Clinicopathological Parameters, Immunohistochemistry, Fluorescence In Situ Hybridization, Immune Response, and Intratumoral Heterogeneity Indicators in HER2 Non-Amplified and HER2-Amplified Patients
We explored the potential of the clinicopathological parameters, IHC, FISH, immune response, and ITH indicators for predicting OS of the patients by univariate survival analysis. Statistically significant indicators and their hazard ratios are presented in Table 2. For the HER2 non-amplified group, higher T stage, lymph node status (pN), CD8 density in the S aspect, SD of CD8 density in the S and TE aspects, immunodrop of CD8 density, and Haralick’s texture indicators reflecting homogeneity of HER2 and HER2 MC (energy, homogeneity) were associated with shorter OS. Meanwhile, higher HER2 expression, CD8 densities in the tumor area and T aspect within IZ along with its variance, CM for CD8 density and its variance, Haralick’s texture indicators reflecting heterogeneity of HER2 and HER2 MC (contrast, dissimilarity, and entropy), and ER contrast were associated with longer OS. In the HER2-amplified patients, worse OS was associated with higher T stage, pN, immunodrop of CD8 density, HER2 MC homogeneity, Ki67 entropy, and PR AshD (bimodality), while in the presence of higher CEP17 copy number, the remaining Immunogradient indicators, HER2 entropy, HER2 MC contrast, and dissimilarity were associated with better OS.
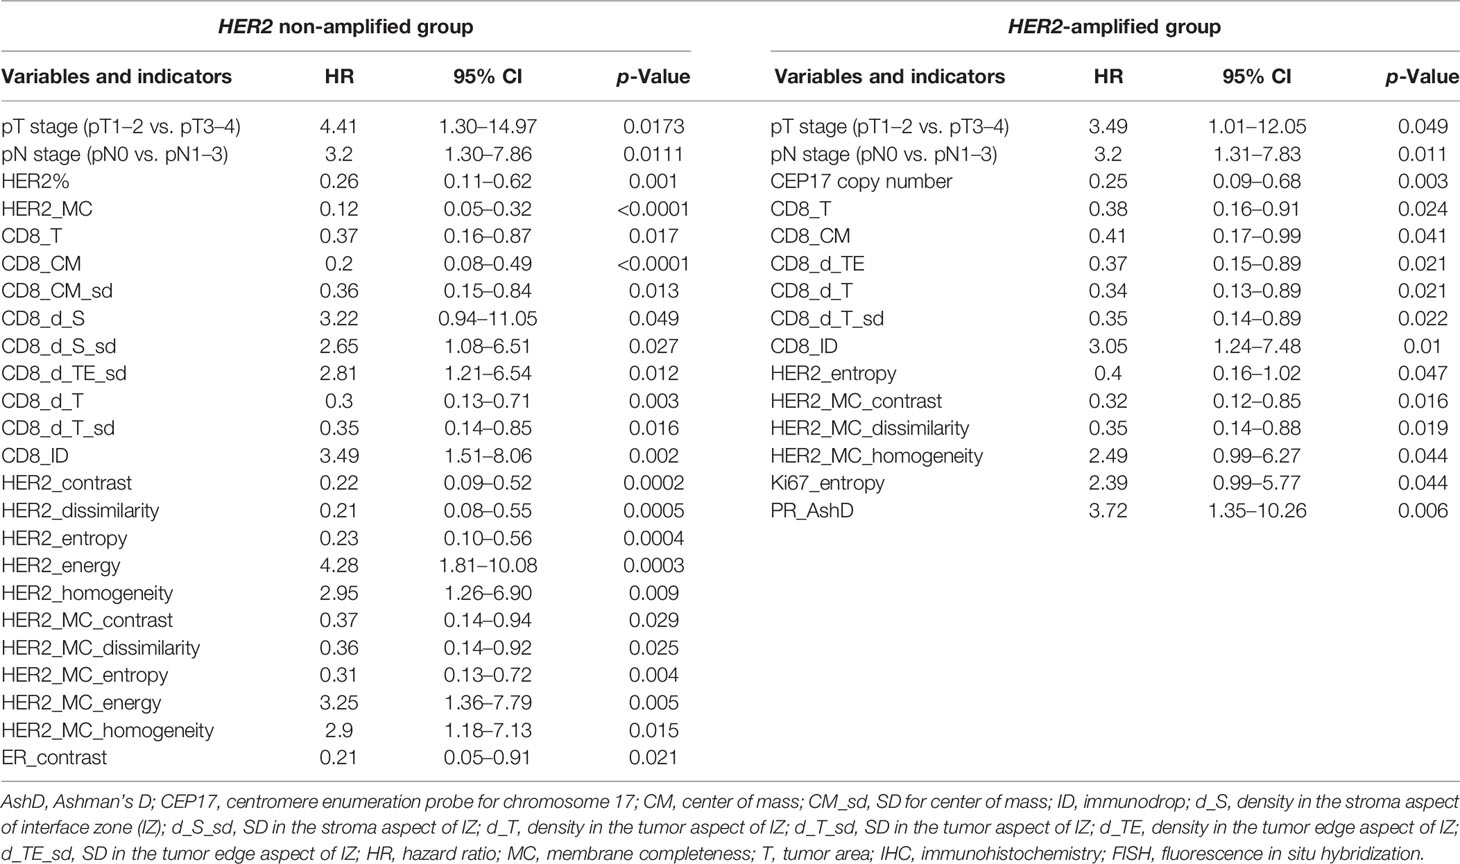
Table 2 Univariate analysis of the impact of clinicopathological parameters, Immunogradient, IHC, FISH, and intratumoral heterogeneity indicators in HER2 non-amplified and HER2-amplified patient groups on overall survival using the log-rank test.
All the variables significantly associated with outcome at a univariate analysis (p < 0.05, Table 2) were assessed for their independent prognostic value in the multivariate Cox regression models.
To investigate any added prognostic value of the indicators, three models in each group were generated from different variable sets (Table 3). Models 1 and 4 were obtained from the pathology and IHC data, including the ITH indicators; FISH indicators were additionally used in the HER2-amplified group. In models 2 and 5, the IHC CD8 density and Immunogradient indicators were added to the variables tested in models 1 and 4. Models 3 and 6 were obtained from the pathological and CD8 indicators, without inclusion of any ER, PR, Ki67, and HER2 variables.
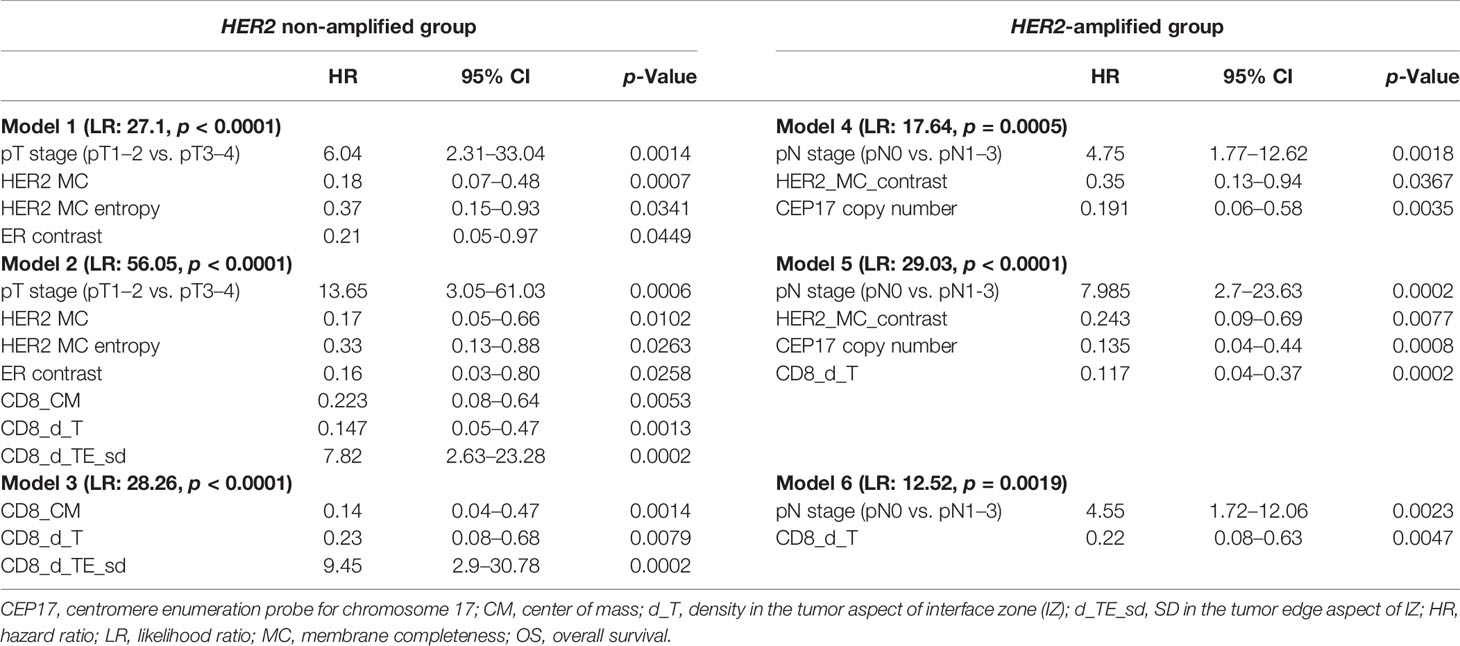
Table 3 Multivariate analysis of prognostic factors associated with OS in HER2 non-amplified (models 1, 2, and 3) and HER2-amplified (models 4, 5, and 6) patient groups.
In the HER2 non-amplified group, higher values of HER2 MC, HER2 MC entropy, and ER contrast indicators were independent features of better OS, while higher tumor stage was associated with worse OS (model 1). Model 2 revealed a marked increase of prognostic power contributed by the immune response indicators in the data set (model likelihood ratio 56.1 achieved in model 2 compared with that of 27.1 in model 1); better OS was associated with higher CD8_CM and CD8_d_T cell densities, and worse OS with higher CD8_d_TE_sd. Remarkably, models 2 and 3 included the same three immune response indicators as independent prognostic factors, reflecting different properties of the local CD8 densities within tumor microenvironment: CD8_d_T (absolute density in the tumor aspect of IZ) and CD8_CM (positive IZ density gradient towards the tumor) were both associated with longer OS, while CD8_d_TE_sd (variance of the CD8 cell density along the IZ) was a feature of worse prognosis.
For the HER2-amplified group, no significant prognostic IHC (ER, PR, HER2, and Ki67 global expression levels) indicators were found by the univariate analyses; therefore, only a set of ITH and FISH indicators along with the pathological variables were used in model 4. Models 5 and 6 were built with the same sets of variables as in the HER2 non-amplified group. In model 4, higher values of HER2 MC contrast and CEP17 copy number indicators predicted better OS, while pN was associated with worse OS. The prognostic power of model 5 was increased by adding immune response indicators (likelihood ratio 29.03 of model 5 compared with 17.64 of model 4), where higher CD8 density in the tumor aspect of IZ predicted better OS. The latter indicator was also an independent factor of better OS in the context of worse OS predicted by pN status in model 6.
The Kaplan–Meier survival probability plots demonstrating an association between the prognostic factors and OS are presented for the HER2 non-amplified and HER2-amplified groups in Figures 1, 2, respectively.
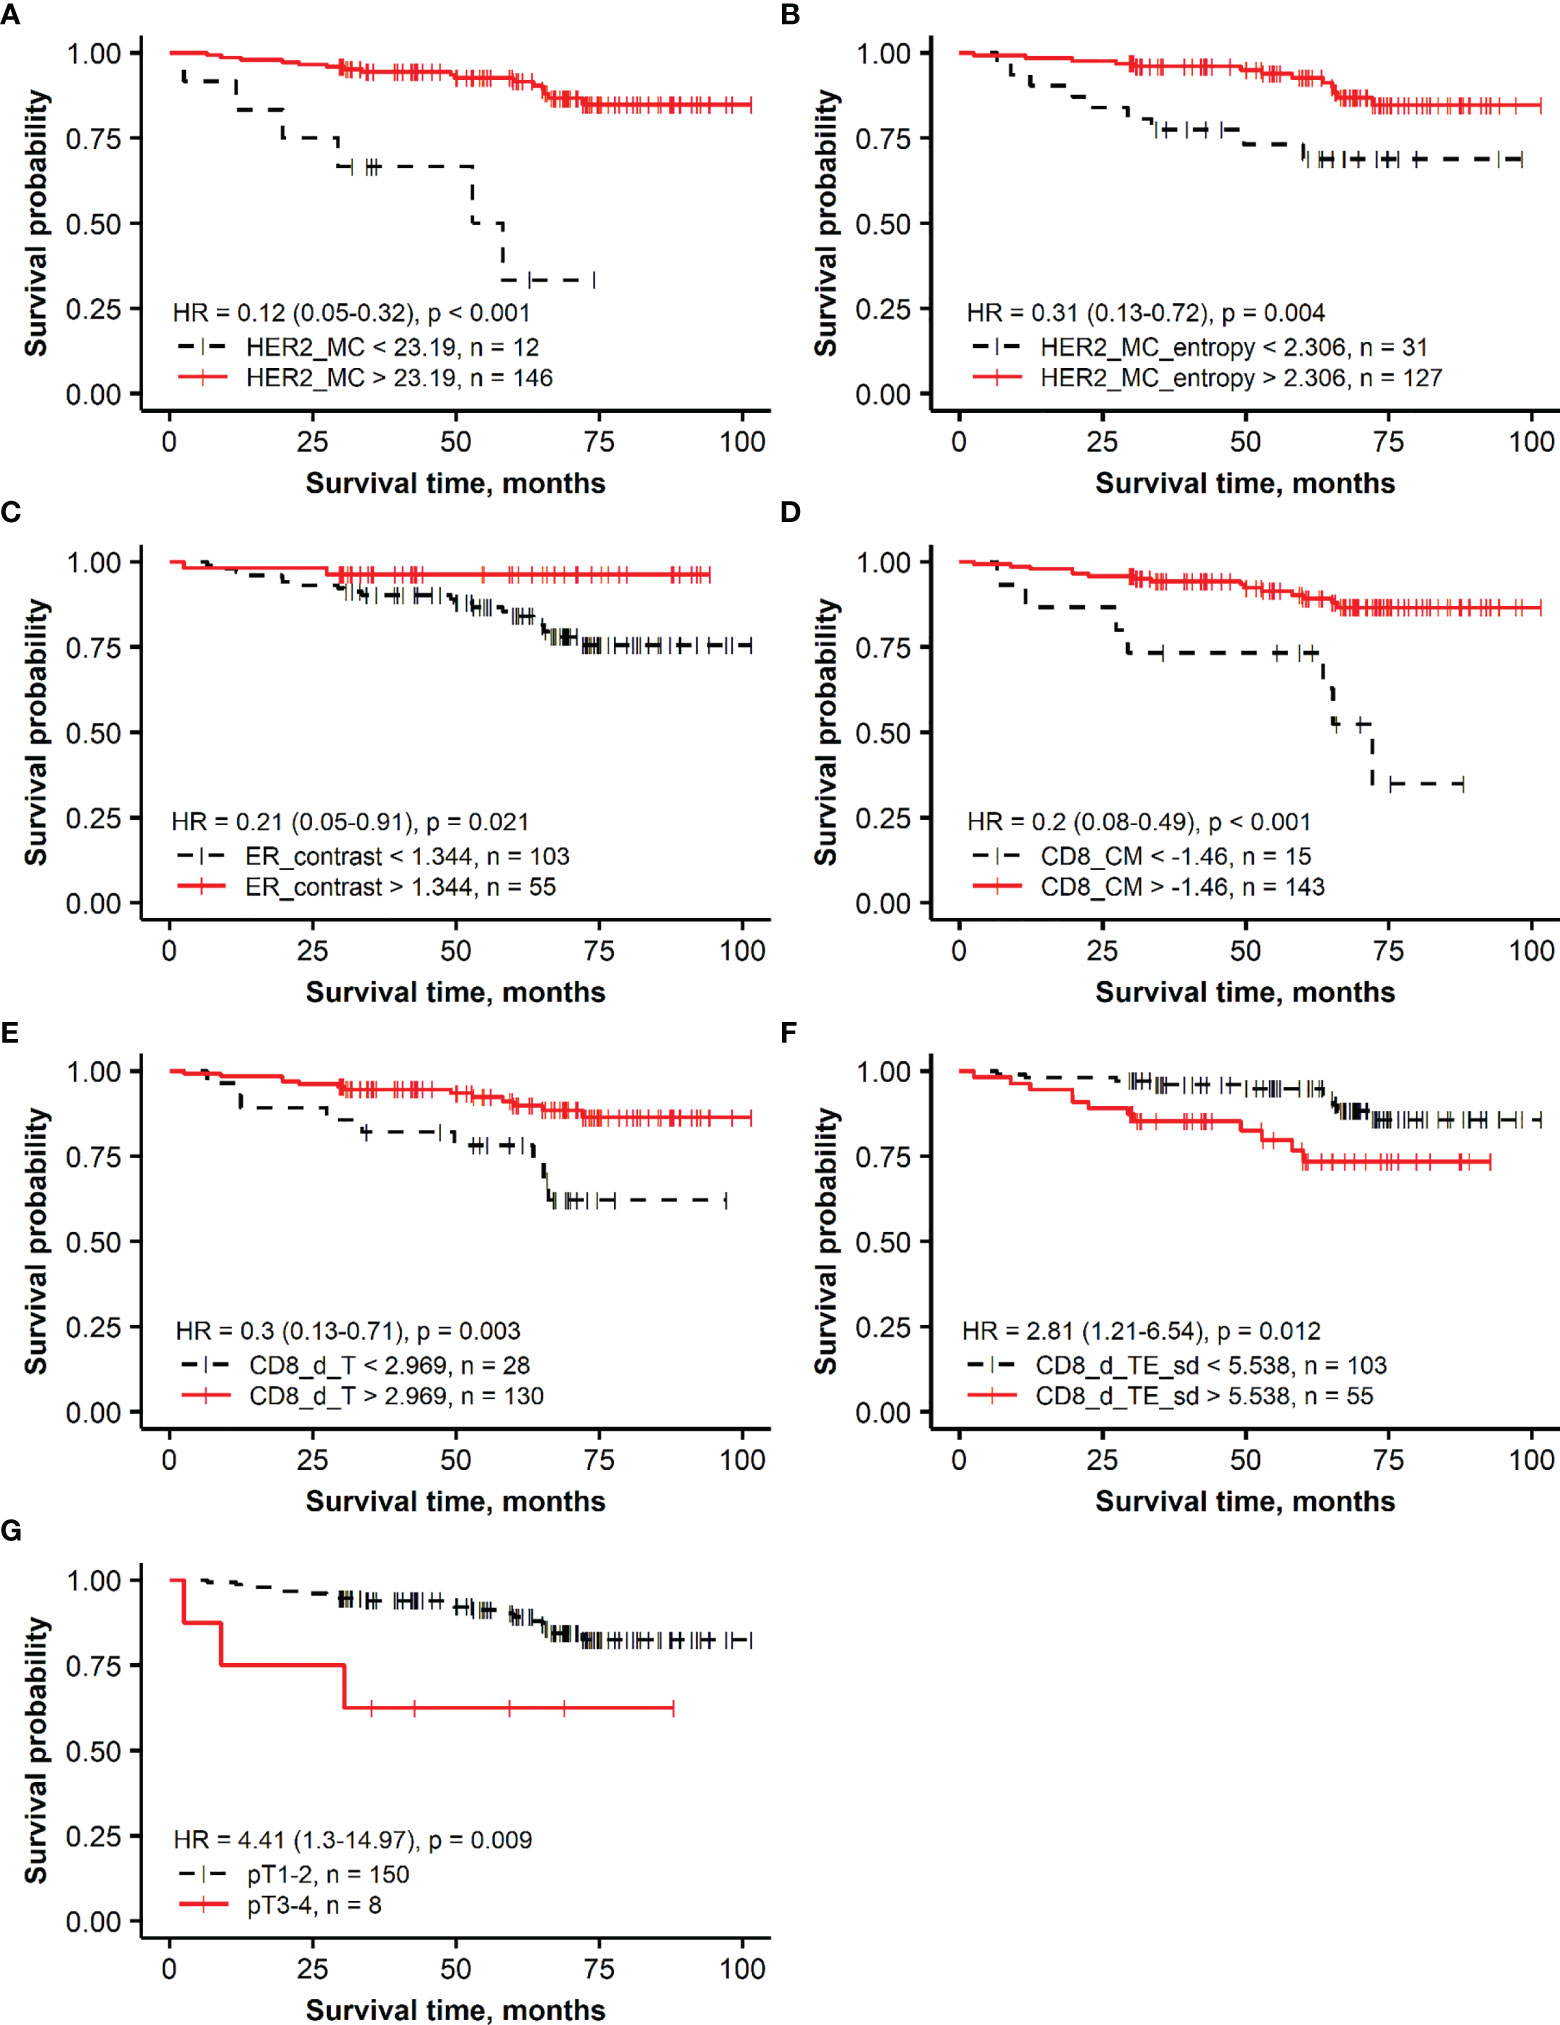
Figure 1 Kaplan–Meier survival plots representing the association of overall survival in the group of patients with HER2 non-amplified breast cancer with independent prognostic indicators identified by multiple Cox regression analysis: (A) membrane completeness (HER2 MC), (B) membrane completeness entropy (HER2 MC entropy), (C) ER contrast, (D) center of mass for CD8 density (CD8_CM), (E) mean CD8 density in the tumor aspect (CD8_d_T), (F) SD of CD8 density in the tumor edge aspect (CD8_d_TE_sd), and (G) tumor stage (T).
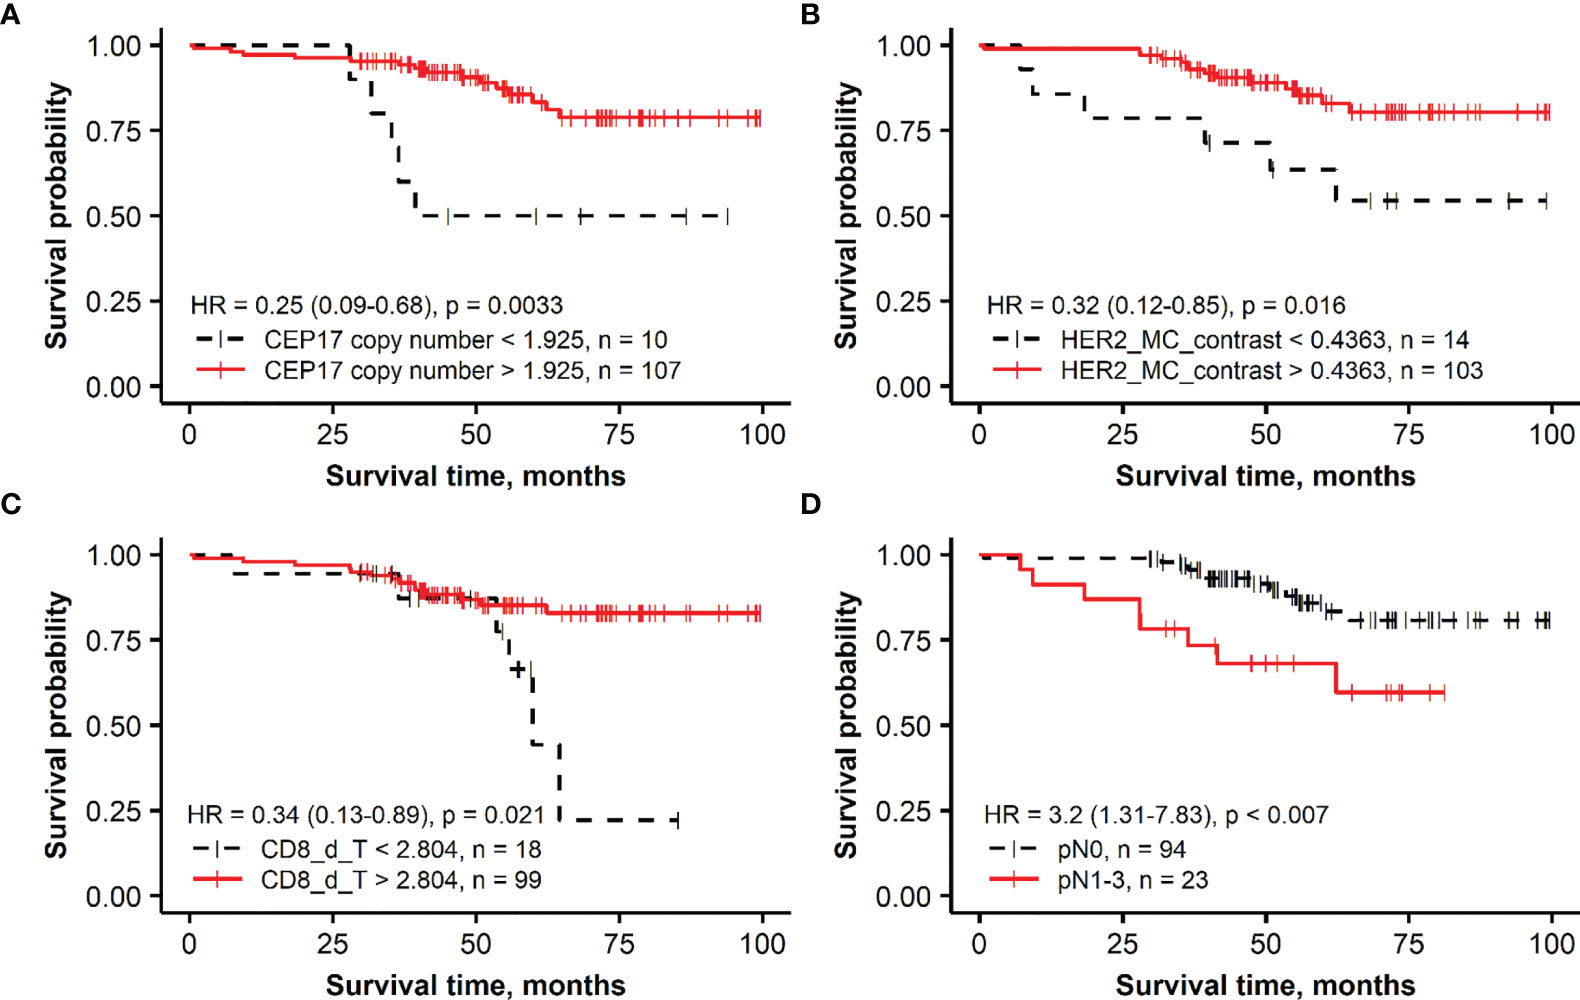
Figure 2 Kaplan–Meier survival plots representing the association of overall survival in the group of patients with HER2-amplified breast cancer with independent prognostic indicators identified by multiple Cox regression analysis: (A) CEP17 copy number, (B) membrane completeness contrast (HER2 MC contrast), (C) mean CD8 density in the tumor aspect (CD8_d_T), and (D) lymph node status (pN).
Combined CD8 Immunogradient Prognostic Score in HER2 Non-Amplified Patient Group
To further assess the added prognostic value of the independent immune response features revealed by the multivariate regression analysis in the HER2 non-amplified group, a combined CD8 Immunogradient prognostic score was calculated by summing corresponding scores (0/1) for each factor (CD8_CM, CD8_d_T, and CD8_d_TE_sd), assigning the score 1 for good or 0 for poor prognosis. The combined CD8 Immunogradient prognostic score allowed stratification of patients into three prognostic groups with 5-year OS probability of 98%, 80%, and 49% for the score of 3, 2, and 1, respectively (Figure 3). Of note, there were no patients with all three indicators assigned a score of 0.
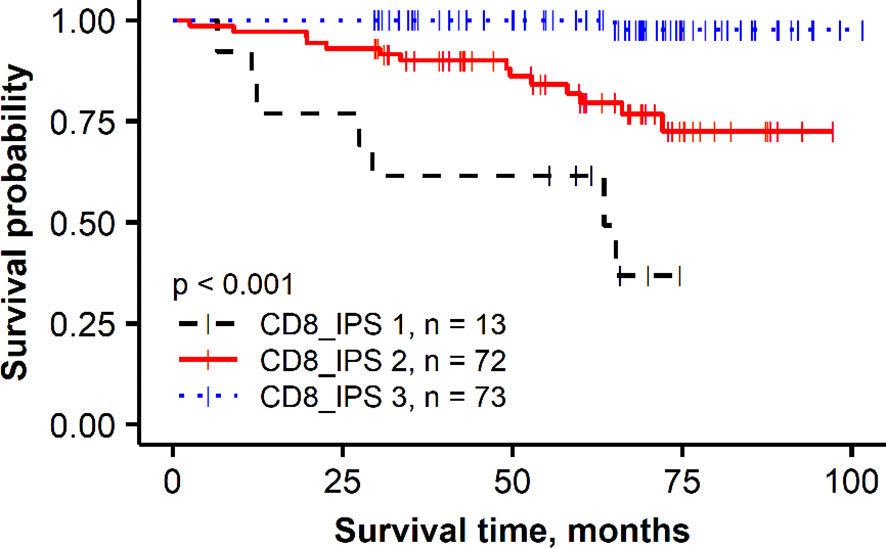
Figure 3 Kaplan–Meier plot for the overall survival of prognostic groups obtained by combined CD8 Immunogradient prognostic score (CD8_IPS) in HER2 non-amplified group.
Discussion
In this study, we present prognostic models for patients with HER2 IHC borderline (2+) BC patients, based on the expression levels of ER, PR, Ki67, HER2, and CD8 densities in the tumor tissue assessed by DIA. These biomarkers were augmented by a set of computational indicators that quantify spatial aspects of ITH and tumor microenvironment. Importantly, the CD8 (immune response) indicators markedly strengthened the models in both the HER2 non-amplified and HER2-amplified groups. Furthermore, these latter indicators outperformed pathological variables and enabled independent prognostic stratification of the HER2 non-amplified BC patients.
DIA enables extraction of IHC data and spatial aspects from WSI with high capacity, not available by conventional IHC scoring. Additional processing of the DIA-generated data by hexagonal tiling enabled extraction of Haralick’s texture measures of ITH of the biomarkers of the prognostic value, as reported previously. In this study, we found that, of the IHC variables explored in the HER2 non-amplified group, only HER2 expression percentage and HER2 MC were significantly associated with the patient outcome (HR = 0.25, p = 0.001 and HR = 0.12, p < 0.0001, respectively). Of note, HER2 MC was a stronger indicator than the proportion of HER2-positive tumor cells (as assessed by the HALO DIA) and served as an independent prognostic factor of better OS. Remarkably, two ITH indicators—HER2 MC entropy and ER contrast—showed an independent prognostic significance in the context of tumor stage status (Table 3, models 1 and 2). Similar findings of beneficial prognostic impact of higher HER2 MC were reported recently in early HR-positive BC patients, where better prognosis of higher HER2 expression was found in a univariate analysis (58). In another study, a trend of more favorable prognosis with respect to relapse-free survival has been shown for the ER-positive, HER2 non-amplified tumors with higher levels of HER2 RNA (91).
HER2 MC status shows the status of HER2 expression, as HER2 protein is localized on the cell membrane. This means that HER2 MC entropy, which is indicative of MC spatial heterogeneity, also reveals information about the ITH of the HER2 protein expression. We observed a non-linear relationship between the HER2 MC and its spatial heterogeneity in our study (Supplementary Figure 4), represented by high ITH values in the middle range of the MC and lower ITH in the low and high ends of the MC variance. Similar dependencies between PR and Ki67 and their ITH indicators were previously reported (56–58); importantly, these studies demonstrated that the ITH indicators of Ki67 and PR expression enabled higher prognostic power than the expression rates per se. Our study extends this evidence by showing a greater prognostic value of ER ITH indicator than by the rate of its expression. Interestingly, ER contrast was the only ITH indicator of HR that provided the prognostic value in a univariate analysis (Table 2, HR = 0.21, p = 0.021) and in the multiple Cox regression models (Table 3, HR = 0.21, p = 0.0449, model 1, HR = 0.16, p = 0.0258, model 2, respectively). Haralick’s contrast (88) measures the spatial distribution of tumor cell subpopulations with different properties in the image. The associations of ER contrast with HER2 MC entropy and their inverse relation to ER expression were revealed by factor analysis (Factor 5, Supplementary Figure 2 and Supplementary Table 2). This HER2&ER heterogeneity factor reflects the higher ITH of both HER2 and ER proteins in the tumors with decreased ER expression.
A majority of the patients with HER2-amplified tumors received adjuvant trastuzumab treatment (87, 74.4%). The OS of these patients is likely to have been impacted by the targeted therapy; therefore, the prognostic models obtained in this subgroup should be taken with caution. One can speculate that any potential effect of the targeted therapy could be related to our finding of ITH of HER2 expression, represented by the HER2 MC contrast indicator as independent predictor of better OS (Table 3, HR = 0.35, p = 0.0367, Model 4 and HR = 0.243, p = 0.0077, Model 5) but not by the HER2 MC indicator. The effect on better OS caused by a higher CEP17 copy number in this group is not clear, and it may be related to various treatment modalities applied in HER2-amplified BC patients. Several studies have reported an association between CEP17 copy number gain and responsiveness to anthracycline-based chemotherapy (92–94). Also, in addition to HER2, chromosome 17 includes other genes involved in BC pathogenesis and DNA repair, such as BRCA1, TOP2A, TP53, and RAD51C (95, 96); therefore, various abnormalities of chromosome 17 may affect prognosis and treatment response.
In this study, we tested the prognostic value of CD8 cell densities quantified by DIA in the tumor and stroma compartments and applied a recently proposed method, based on hexagonal grid analytics of the DIA data to compute CD8 local density profiles (Immunogradient) across automatically detected tumor–stroma IZ (86). This method actually tests if the immune cells reveal increasing densities towards the tumor at the tumor/host interface and therefore is expected to be more sensitive to capture “spatial behavior” of TILs. Indeed, higher CD8 cell densities in the tumor compartment were associated with better OS in univariate analyses in both patient subgroups (Table 2, HR = 0.37, p = 0.017 and HR = 0.38, p = 0.024 in the HER2 non-amplified and HER2-amplified groups, respectively); however, they did not provide the independent prognostic value in our models. In contrast, three Immunogradient indicators provided the independent prognostic value in the non-amplified tumors: CD8 density in the tumor aspect of IZ (CD8_d_T) and positive IZ CD8 density gradient towards the tumor (CD8_CM) were associated with better OS, while the variance (SD) of CD8 density (CD8_d_TE_sd) along the TE predicted worse OS. A strong prognostic stratification was achieved by aggregating these three independent spatial properties of the CD8 cell distribution in the tumor microenvironment into a combined CD8 Immunogradient prognostic score; this represents an instance of computational augmentation of a single IHC biomarker (Figure 3). Remarkably, these three indicators were sufficient to predict OS independently of any other variables (Table 3, model 3) with statistical power obtained from pathology and IHC data supplemented with ITH indicators (Table 3, model 1). Finally, the prognostic power was doubled by adding the immune response indicators to the model (Table 3, model 2). Our findings are similar to the results presented in the study of Rasmusson et al. (86), where both CD8 density in the tumor aspect of IZ and CM for CD8 cell density within the IZ indicators were independent predictors of better OS in early HR-positive BC. Although several studies have reported a higher density of CD8 cells to be associated with a favorable prognosis in node-negative BC (97), or in combination with CD163 (98), other studies have shown an adverse prognostic effect of increased CD8 lymphocytes in patients with HR-positive/HER2-negative tumors (77, 99, 100) or reported no significant association between CD8 cells and patient outcome (79). These contradictory results in HR-positive BC may be related to different methodologies applied, lacking precision in the assessment of spatial aspects of TIL distributions within the tissues (100, 101). Recently, Dieci et al. (102) highlighted the need of deeper insight into the mechanisms on which the interaction between HR-positive/HER2-negative BC tumor and immune cells relies, as various factors such as menopausal status, estrogen levels, and endocrine treatments may be involved in the modulation of the tumor microenvironment (102). Therefore, methods with appropriate discriminatory spatial precision are needed to expose the prognostic role of TILs in luminal-like BC.
We did not find significant differences in CD8 cell densities between the HER2-amplified and non-amplified groups, which could be explained by the fact that the HER2-amplified group was composed of both molecular subgroups showing HER2 positivity, namely, luminal B and HER2-enriched. Previous studies reported that HER2-enriched subtype is more immunogenic than the luminal B (103). In our study, the only immune response indicator—density of CD8 in the T aspect of IZ—provided an independent association with better OS in HER2-amplified BC patients (Table 3, models 5 and 6). Extensive TIL infiltration has been associated with better outcomes (pathological complete response, event-free survival, and disease-free survival) in HER2-positive BC (70, 104, 105). However, studies evaluating the prognostic significance of CD8 TILs reported conflicting results (77, 79, 100, 106, 107), suggesting that the association between CD8 cells and prognosis depends on lymphocyte types, their tissue location, analysis methods, and other factors. Indeed, the interaction between immune system and tumor as well as prognostic effects of TILs in HER2-positive BC is impacted by various combined therapy modalities, including anti-HER2 therapy, chemotherapy, and hormonal therapy (108). Trastuzumab therapy effect depends on immune response (109), it has both cytotoxic and immunological effects on tumor cells (110–112), and better therapeutic efficacy is achieved in tumors with high TILs (113–115). However, this was not confirmed by other studies (116, 117).
Our study has limitations, related to its retrospective and monocentric design and lack of well-structured information about applied therapies and responses achieved. In particular, it is relevant to the prognostic modeling in the HER2-positive patient cohort.
In conclusion, we present prognostic OS models based on computational ITH, tumor microenvironment, and immune response indicators of the IHC biomarkers in HER2 IHC 2+ borderline BC patients. The ITH indicators (HER2 MC entropy and ER contrast in FISH-negative and HER2 MC contrast in FISH-positive tumors) provided an independent contribution to predict better OS. In FISH-negative tumors, antitumor immune response, assessed by the CD8 IZ Immunogradient indicators, provided prognostic stratification independent and superior to other pathology and IHC variables.
Data Availability Statement
The raw data supporting the conclusions of this article will be made available by the authors, without undue reservation.
Ethics Statement
The studies involving human participants were reviewed and approved by Lithuanian Bioethics Committee. The patients/participants provided their written informed consent to participate in this study.
Author Contributions
GR, ArL, and AR designed the study. GR in collaboration with AiL collected the samples and participated in IHC slide staining. GR, RG, and RA performed digital image analyses. GR and RA performed statistical analyses. DZ participated in the statistical analysis of CD8. GR in collaboration with AR and ArL drafted essential parts of the manuscript. All authors reviewed the analysis results and read and approved the final manuscript.
Funding
This project had received funding from the European Social Fund, project No. 09.3.3-LMT-K-712-01-0139, under grant agreement with the Research Council of Lithuania.
Conflict of Interest
The authors declare that the research was conducted in the absence of any commercial or financial relationships that could be construed as a potential conflict of interest.
Publisher’s Note
All claims expressed in this article are solely those of the authors and do not necessarily represent those of their affiliated organizations, or those of the publisher, the editors and the reviewers. Any product that may be evaluated in this article, or claim that may be made by its manufacturer, is not guaranteed or endorsed by the publisher.
Acknowledgments
The authors would like to thank their colleagues from the National Center of Pathology for the valuable help in producing IHC slides and significantly contributing to the many other technical tasks that enabled the publication of these results.
Supplementary Material
The Supplementary Material for this article can be found online at: https://www.frontiersin.org/articles/10.3389/fonc.2021.774088/full#supplementary-material
References
1. Perou CM, Sorlie T, Eisen MB, van de Rijn M, Jeffrey SS, Rees CA, et al. Molecular Portraits of Human Breast Tumours. Nature (2000) 406(6797):747–52. doi: 10.1038/35021093
2. Sorlie T, Perou CM, Tibshirani R, Aas T, Geisler S, Johnsen H, et al. Gene Expression Patterns of Breast Carcinomas Distinguish Tumor Subclasses With Clinical Implications. Proc Natl Acad Sci USA (2001) 98(19):10869–74. doi: 10.1073/pnas.191367098
3. Rakha EA, Pareja FG. New Advances in Molecular Breast Cancer Pathology. Semin Cancer Biol (2021) 72:102–13. doi: 10.1016/j.semcancer.2020.03.014
4. Wu HJ, Chu PY. Recent Discoveries of Macromolecule- and Cell-Based Biomarkers and Therapeutic Implications in Breast Cancer. Int J Mol Sci (2021) 22(2):636. doi: 10.3390/ijms22020636
5. Dieci MV, Miglietta F, Griguolo G, Guarneri V. Biomarkers for HER2-Positive Metastatic Breast Cancer: Beyond Hormone Receptors. Cancer Treat Rev (2020) 88:102064. doi: 10.1016/j.ctrv.2020.102064
6. Klocker EV, Suppan C. Biomarkers in Her2- Positive Disease. Breast Care (Basel) (2020) 15(6):586–93. doi: 10.1159/000512283
7. Triulzi T, Bianchi GV, Tagliabue E. Predictive Biomarkers in the Treatment of HER2-Positive Breast Cancer: An Ongoing Challenge. Future Oncol (2016) 12(11):1413–28. doi: 10.2217/fon-2015-0025
8. Invernizzi M, Michelotti A, Noale M, Lopez G, Runza L, Giroda M, et al. Breast Cancer Systemic Treatments and Upper Limb Lymphedema: A Risk-Assessment Platform Encompassing Tumor-Specific Pathological Features Reveals the Potential Role of Trastuzumab. J Clin Med (2019) 8(2):138. doi: 10.3390/jcm8020138
9. Lancellotti C, Cancian P, Savevski V, Kotha SRR, Fraggetta F, Graziano P, et al. Artificial Intelligence & Tissue Biomarkers: Advantages, Risks and Perspectives for Pathology. Cells (2021) 10(4):787. doi: 10.3390/cells10040787
10. Laurinavicius A, Rasmusson A, Plancoulaine B, Shribak M, Levenson R. Machine-Learning-Based Evaluation of Intratumoral Heterogeneity and Tumor-Stroma Interface for Clinical Guidance. Am J Pathol (2021) 191(10):1724–31. doi: 10.1016/j.ajpath.2021.04.008
11. Das T, Andrieux G, Ahmed M, Chakraborty S. Integration of Online Omics-Data Resources for Cancer Research. Front Genet (2020) 11:578345. doi: 10.3389/fgene.2020.578345
12. Yarden Y. Biology of HER2 and its Importance in Breast Cancer. Oncology (2001) 61 Suppl 2:1–13. doi: 10.1159/000055396
13. Slamon DJ, Clark GM, Wong SG, Levin WJ, Ullrich A, McGuire WL. Human Breast Cancer: Correlation of Relapse and Survival With Amplification of the HER-2/Neu Oncogene. Science (1987) 235(4785):177–82. doi: 10.1126/science.3798106
14. Cronin KA, Harlan LC, Dodd KW, Abrams JS, Ballard-Barbash R. Population-Based Estimate of the Prevalence of HER-2 Positive Breast Cancer Tumors for Early Stage Patients in the US. Cancer Invest (2010) 28(9):963–8. doi: 10.3109/07357907.2010.496759
15. Lopez-Garcia MA, Carretero-Barrio I, Perez-Mies B, Chiva M, Castilla C, Vieites B, et al. Low Prevalence of HER2-Positive Breast Carcinomas Among Screening Detected Breast Cancers. Cancers (Basel) (2020) 12(6):1578. doi: 10.3390/cancers12061578
16. Dawood S, Broglio K, Buzdar AU, Hortobagyi GN, Giordano SH. Prognosis of Women With Metastatic Breast Cancer by HER2 Status and Trastuzumab Treatment: An Institutional-Based Review. J Clin Oncol (2010) 28(1):92–8. doi: 10.1200/JCO.2008.19.9844
17. Cobleigh MA, Vogel CL, Tripathy D, Robert NJ, Scholl S, Fehrenbacher L, et al. Multinational Study of the Efficacy and Safety of Humanized Anti-HER2 Monoclonal Antibody in Women Who Have HER2-Overexpressing Metastatic Breast Cancer That has Progressed After Chemotherapy for Metastatic Disease. J Clin Oncol (1999) 17(9):2639–48. doi: 10.1200/JCO.1999.17.9.2639
18. Wolff AC, Hammond ME, Hicks DG, Dowsett M, McShane LM, Allison KH, et al. Recommendations for Human Epidermal Growth Factor Receptor 2 Testing in Breast Cancer: American Society of Clinical Oncology/College of American Pathologists Clinical Practice Guideline Update. J Clin Oncol (2013) 31(31):3997–4013. doi: 10.1200/JCO.2013.50.9984
19. Sapino A, Maletta F, Verdun di Cantogno L, Macri L, Botta C, Gugliotta P, et al. Gene Status in HER2 Equivocal Breast Carcinomas: Impact of Distinct Recommendations and Contribution of a Polymerase Chain Reaction-Based Method. Oncologist (2014) 19(11):1118–26. doi: 10.1634/theoncologist.2014-0195
20. Wolff AC, Hammond MEH, Allison KH, Harvey BE, Mangu PB, Bartlett JMS, et al. Human Epidermal Growth Factor Receptor 2 Testing in Breast Cancer: American Society of Clinical Oncology/College of American Pathologists Clinical Practice Guideline Focused Update. J Clin Oncol (2018) 36(20):2105–22. doi: 10.1200/JCO.2018.77.8738
21. Liu ZH, Wang K, Lin DY, Xu J, Chen J, Long XY, et al. Impact of the Updated 2018 ASCO/CAP Guidelines on HER2 FISH Testing in Invasive Breast Cancer: A Retrospective Study of HER2 Fish Results of 2233 Cases. Breast Cancer Res Treat (2019) 175(1):51–7. doi: 10.1007/s10549-019-05148-5
22. Xu B, Shen J, Guo W, Zhao W, Zhuang Y, Wang L. Impact of the 2018 ASCO/CAP HER2 Guidelines Update for HER2 Testing by FISH in Breast Cancer. Pathol Res Pract (2019) 215(2):251–5. doi: 10.1016/j.prp.2018.10.035
23. Woo JW, Lee K, Chung YR, Jang MH, Ahn S, Park SY. The Updated 2018 American Society of Clinical Oncology/College of American Pathologists Guideline on Human Epidermal Growth Factor Receptor 2 Interpretation in Breast Cancer: Comparison With Previous Guidelines and Clinical Significance of the Proposed in Situ Hybridization Groups. Hum Pathol (2020) 98:10–21. doi: 10.1016/j.humpath.2020.01.003
24. Gordian-Arroyo AM, Zynger DL, Tozbikian GH. Impact of the 2018 ASCO/CAP HER2 Guideline Focused Update. Am J Clin Pathol (2019) 152(1):17–26. doi: 10.1093/ajcp/aqz012
25. Crespo J, Sun H, Wu J, Ding QQ, Tang G, Robinson MK, et al. Rate of Reclassification of HER2-Equivocal Breast Cancer Cases to HER2-Negative Per the 2018 ASCO/CAP Guidelines and Response of HER2-Equivocal Cases to Anti-HER2 Therapy. PloS One (2020) 15(11):e0241775. doi: 10.1371/journal.pone.0241775
26. Tong YW, Chen XS, Fei XC, Lin L, Wu JY, Huang O, et al. Can Breast Cancer Patients With HER2 Dual-Equivocal Tumours be Managed as HER2-Negative Disease? Eur J Cancer (2018) 89:9–18. doi: 10.1016/j.ejca.2017.10.033
27. Bethune GC, Veldhuijzen van Zanten D, MacIntosh RF, Rayson D, Younis T, Thompson K, et al. Impact of the 2013 American Society of Clinical Oncology/College of American Pathologists Guideline Recommendations for Human Epidermal Growth Factor Receptor 2 (HER2) Testing of Invasive Breast Carcinoma: A Focus on Tumours Assessed as ‘Equivocal’ for HER2 Gene Amplification by Fluorescence in-Situ Hybridization. Histopathology (2015) 67(6):880–7. doi: 10.1111/his.12723
28. Ballard M, Jalikis F, Krings G, Schmidt RA, Chen YY, Rendi MH, et al. ‘Non-Classical’ HER2 FISH Results in Breast Cancer: A Multi-Institutional Study. Mod Pathol (2017) 30(2):227–35. doi: 10.1038/modpathol.2016.175
29. Rakha EA, Miligy IM, Quinn CM, Provenzano E, Shaaban AM, Marchio C, et al. Retrospective Observational Study of HER2 Immunohistochemistry in Borderline Breast Cancer Patients Undergoing Neoadjuvant Therapy, With an Emphasis on Group 2 (HER2/CEP17 Ratio >/=2.0, HER2 Copy Number <4.0 Signals/Cell) Cases. Br J Cancer (2021) 124(11):1836–42. doi: 10.1038/s41416-021-01351-8
30. Tarantino P, Hamilton E, Tolaney SM, Cortes J, Morganti S, Ferraro E, et al. HER2-Low Breast Cancer: Pathological and Clinical Landscape. J Clin Oncol (2020) 38(17):1951–62. doi: 10.1200/JCO.19.02488
31. Marchio C, Annaratone L, Marques A, Casorzo L, Berrino E, Sapino A. Evolving Concepts in HER2 Evaluation in Breast Cancer: Heterogeneity, HER2-Low Carcinomas and Beyond. Semin Cancer Biol (2021) 72:123–35. doi: 10.1016/j.semcancer.2020.02.016
32. Eiger D, Agostinetto E, Saude-Conde R, de Azambuja E. The Exciting New Field of HER2-Low Breast Cancer Treatment. Cancers (Basel) (2021) 13(5):1015. doi: 10.3390/cancers13051015
33. Iwata H, Tamura K, Doi T, Tsurutani J, Modi S, Park H, et al. Trastuzumab Deruxtecan (DS-8201a) in Subjects With HER2-Expressing Solid Tumors: Long-Term Results of a Large Phase 1 Study With Multiple Expansion Cohorts. J Clin Oncol (2018) 36(15_suppl):2501–. doi: 10.1200/JCO.2018.36.15_suppl.2501
34. Rinnerthaler G, Gampenrieder SP, Greil R. HER2 Directed Antibody-Drug-Conjugates Beyond T-DM1 in Breast Cancer. Int J Mol Sci (2019) 20(5):1115. doi: 10.3390/ijms20051115
35. Modi S, Park H, Murthy RK, Iwata H, Tamura K, Tsurutani J, et al. Antitumor Activity and Safety of Trastuzumab Deruxtecan in Patients With HER2-Low-Expressing Advanced Breast Cancer: Results From a Phase Ib Study. J Clin Oncol (2020) 38(17):1887–96. doi: 10.1200/JCO.19.02318
36. Seol H, Lee HJ, Choi Y, Lee HE, Kim YJ, Kim JH, et al. Intratumoral Heterogeneity of HER2 Gene Amplification in Breast Cancer: Its Clinicopathological Significance. Mod Pathol (2012) 25(7):938–48. doi: 10.1038/modpathol.2012.36
37. Ohlschlegel C, Zahel K, Kradolfer D, Hell M, Jochum W. HER2 Genetic Heterogeneity in Breast Carcinoma. J Clin Pathol (2011) 64(12):1112–6. doi: 10.1136/jclinpath-2011-200265
38. Hou Y, Nitta H, Li Z. HER2 Gene Protein Assay Is Useful to Determine HER2 Status and Evaluate HER2 Heterogeneity in HER2 Equivocal Breast Cancer. Am J Clin Pathol (2017) 147(1):89–95. doi: 10.1093/ajcp/aqw211
39. Hou Y, Nitta H, Wei L, Banks PM, Portier B, Parwani AV, et al. HER2 Intratumoral Heterogeneity is Independently Associated With Incomplete Response to Anti-HER2 Neoadjuvant Chemotherapy in HER2-Positive Breast Carcinoma. Breast Cancer Res Treat (2017) 166(2):447–57. doi: 10.1007/s10549-017-4453-8
40. Hanna WM, Ruschoff J, Bilous M, Coudry RA, Dowsett M, Osamura RY, et al. HER2 in Situ Hybridization in Breast Cancer: Clinical Implications of Polysomy 17 and Genetic Heterogeneity. Mod Pathol (2014) 27(1):4–18. doi: 10.1038/modpathol.2013.103
41. Clarke R, Liu MC, Bouker KB, Gu Z, Lee RY, Zhu Y, et al. Antiestrogen Resistance in Breast Cancer and the Role of Estrogen Receptor Signaling. Oncogene (2003) 22(47):7316–39. doi: 10.1038/sj.onc.1206937
42. Brouckaert O, Paridaens R, Floris G, Rakha E, Osborne K, Neven P. A Critical Review Why Assessment of Steroid Hormone Receptors in Breast Cancer Should be Quantitative. Ann Oncol (2013) 24(1):47–53. doi: 10.1093/annonc/mds238
43. Massarweh S, Schiff R. Unraveling the Mechanisms of Endocrine Resistance in Breast Cancer: New Therapeutic Opportunities. Clin Cancer Res (2007) 13(7):1950–4. doi: 10.1158/1078-0432.CCR-06-2540
44. Arpino G, Wiechmann L, Osborne CK, Schiff R. Crosstalk Between the Estrogen Receptor and the HER Tyrosine Kinase Receptor Family: Molecular Mechanism and Clinical Implications for Endocrine Therapy Resistance. Endocr Rev (2008) 29(2):217–33. doi: 10.1210/er.2006-0045
45. Montemurro F, Di Cosimo S, Arpino G. Human Epidermal Growth Factor Receptor 2 (HER2)-Positive and Hormone Receptor-Positive Breast Cancer: New Insights Into Molecular Interactions and Clinical Implications. Ann Oncol (2013) 24(11):2715–24. doi: 10.1093/annonc/mdt287
46. Giuliano M, Trivedi MV, Schiff R. Bidirectional Crosstalk Between the Estrogen Receptor and Human Epidermal Growth Factor Receptor 2 Signaling Pathways in Breast Cancer: Molecular Basis and Clinical Implications. Breast Care (Basel) (2013) 8(4):256–62. doi: 10.1159/000354253
47. Schettini F, Buono G, Cardalesi C, Desideri I, De Placido S, Del Mastro L. Hormone Receptor/Human Epidermal Growth Factor Receptor 2-Positive Breast Cancer: Where We Are Now and Where We Are Going. Cancer Treat Rev (2016) 46:20–6. doi: 10.1016/j.ctrv.2016.03.012
48. Collins D, Jacob W, Cejalvo JM, Ceppi M, James I, Hasmann M, et al. Direct Estrogen Receptor (ER)/HER Family Crosstalk Mediating Sensitivity to Lumretuzumab and Pertuzumab in ER+ Breast Cancer. PloS One (2017) 12(5):e0177331. doi: 10.1371/journal.pone.0177331
49. Dobson L, Conway C, Hanley A, Johnson A, Costello S, O’Grady A, et al. Image Analysis as an Adjunct to Manual HER-2 Immunohistochemical Review: A Diagnostic Tool to Standardize Interpretation. Histopathology (2010) 57(1):27–38. doi: 10.1111/j.1365-2559.2010.03577.x
50. Laurinaviciene A, Dasevicius D, Ostapenko V, Jarmalaite S, Lazutka J, Laurinavicius A. Membrane Connectivity Estimated by Digital Image Analysis of HER2 Immunohistochemistry Is Concordant With Visual Scoring and Fluorescence in Situ Hybridization Results: Algorithm Evaluation on Breast Cancer Tissue Microarrays. Diagn Pathol (2011) 6:87. doi: 10.1186/1746-1596-6-87
51. Brugmann A, Eld M, Lelkaitis G, Nielsen S, Grunkin M, Hansen JD, et al. Digital Image Analysis of Membrane Connectivity Is a Robust Measure of HER2 Immunostains. Breast Cancer Res Treat (2012) 132(1):41–9. doi: 10.1007/s10549-011-1514-2
52. Holten-Rossing H, Moller Talman ML, Kristensson M, Vainer B. Optimizing HER2 Assessment in Breast Cancer: Application of Automated Image Analysis. Breast Cancer Res Treat (2015) 152(2):367–75. doi: 10.1007/s10549-015-3475-3
53. Helin HO, Tuominen VJ, Ylinen O, Helin HJ, Isola J. Free Digital Image Analysis Software Helps to Resolve Equivocal Scores in HER2 Immunohistochemistry. Virchows Arch (2016) 468(2):191–8. doi: 10.1007/s00428-015-1868-7
54. Jakobsen MR, Teerapakpinyo C, Shuangshoti S, Keelawat S. Comparison Between Digital Image Analysis and Visual Assessment of Immunohistochemical HER2 Expression in Breast Cancer. Pathol Res Pract (2018) 214(12):2087–92. doi: 10.1016/j.prp.2018.10.015
55. Skaland I, Ovestad I, Janssen EA, Klos J, Kjellevold KH, Helliesen T, et al. Digital Image Analysis Improves the Quality of Subjective HER-2 Expression Scoring in Breast Cancer. Appl Immunohistochem Mol Morphol (2008) 16(2):185–90. doi: 10.1097/PAI.0b013e318059c20c
56. Plancoulaine B, Laurinaviciene A, Herlin P, Besusparis J, Meskauskas R, Baltrusaityte I, et al. A Methodology for Comprehensive Breast Cancer Ki67 Labeling Index With Intra-Tumor Heterogeneity Appraisal Based on Hexagonal Tiling of Digital Image Analysis Data. Virchows Arch (2015) 467:711–22. doi: 10.1007/s00428-015-1865-x
57. Laurinavicius A, Plancoulaine B, Rasmusson A, Besusparis J, Augulis R, Meskauskas R, et al. Bimodality of Intratumor Ki67 Expression is an Independent Prognostic Factor of Overall Survival in Patients With Invasive Breast Carcinoma. Virchows Arch (2016) 468(4):493–502. doi: 10.1007/s00428-016-1907-z
58. Zilenaite D, Rasmusson A, Augulis R, Besusparis J, Laurinaviciene A, Plancoulaine B, et al. Independent Prognostic Value of Intratumoral Heterogeneity and Immune Response Features by Automated Digital Immunohistochemistry Analysis in Early Hormone Receptor-Positive Breast Carcinoma. Front Oncol (2020) 10:950. doi: 10.3389/fonc.2020.00950
61. Rao CR. Diversity and Dissimilarity Coefficients: A Unified Approach. Theor Population Biol (1982) 21(1):24–43. doi: 10.1016/0040-5809(82)90004-1
62. Park SY, Gonen M, Kim HJ, Michor F, Polyak K. Cellular and Genetic Diversity in the Progression of in Situ Human Breast Carcinomas to an Invasive Phenotype. J Clin Invest (2010) 120(2):636–44. doi: 10.1172/JCI40724
63. Almendro V, Cheng YK, Randles A, Itzkovitz S, Marusyk A, Ametller E, et al. Inference of Tumor Evolution During Chemotherapy by Computational Modeling and in Situ Analysis of Genetic and Phenotypic Cellular Diversity. Cell Rep (2014) 6(3):514–27. doi: 10.1016/j.celrep.2013.12.041
64. Potts SJ, Krueger JS, Landis ND, Eberhard DA, Young GD, Schmechel SC, et al. Evaluating Tumor Heterogeneity in Immunohistochemistry-Stained Breast Cancer Tissue. Lab Invest (2012) 92(9):1342–57. doi: 10.1038/labinvest.2012.91
65. Natrajan R, Sailem H, Mardakheh FK, Arias Garcia M, Tape CJ, Dowsett M, et al. Microenvironmental Heterogeneity Parallels Breast Cancer Progression: A Histology-Genomic Integration Analysis. PloS Med (2016) 13(2):e1001961. doi: 10.1371/journal.pmed.1001961
66. Jamal-Hanjani M, Quezada SA, Larkin J, Swanton C. Translational Implications of Tumor Heterogeneity. Clin Cancer Res (2015) 21(6):1258–66. doi: 10.1158/1078-0432.CCR-14-1429
67. Efremova M, Finotello F, Rieder D, Trajanoski Z. Neoantigens Generated by Individual Mutations and Their Role in Cancer Immunity and Immunotherapy. Front Immunol (2017) 8:1679. doi: 10.3389/fimmu.2017.01679
68. Luen S, Virassamy B, Savas P, Salgado R, Loi S. The Genomic Landscape of Breast Cancer and its Interaction With Host Immunity. Breast (2016) 29:241–50. doi: 10.1016/j.breast.2016.07.015
69. Narang P, Chen M, Sharma AA, Anderson KS, Wilson MA. The Neoepitope Landscape of Breast Cancer: Implications for Immunotherapy. BMC Cancer (2019) 19(1):200. doi: 10.1186/s12885-019-5402-1
70. Denkert C, von Minckwitz G, Darb-Esfahani S, Lederer B, Heppner BI, Weber KE, et al. Tumour-Infiltrating Lymphocytes and Prognosis in Different Subtypes of Breast Cancer: A Pooled Analysis of 3771 Patients Treated With Neoadjuvant Therapy. Lancet Oncol (2018) 19(1):40–50. doi: 10.1016/S1470-2045(17)30904-X
71. Mittendorf EA, Philips AV, Meric-Bernstam F, Qiao N, Wu Y, Harrington S, et al. PD-L1 Expression in Triple-Negative Breast Cancer. Cancer Immunol Res (2014) 2(4):361–70. doi: 10.1158/2326-6066.CIR-13-0127
72. Schmid P, Rugo HS, Adams S, Schneeweiss A, Barrios CH, Iwata H, et al. Atezolizumab Plus Nab-Paclitaxel as First-Line Treatment for Unresectable, Locally Advanced or Metastatic Triple-Negative Breast Cancer (IMpassion130): Updated Efficacy Results From a Randomised, Double-Blind, Placebo-Controlled, Phase 3 Trial. Lancet Oncol (2020) 21(1):44–59. doi: 10.1016/S1470-2045(19)30689-8
73. Schmid P, Adams S, Rugo HS, Schneeweiss A, Barrios CH, Iwata H, et al. Atezolizumab and Nab-Paclitaxel in Advanced Triple-Negative Breast Cancer. N Engl J Med (2018) 379(22):2108–21. doi: 10.1056/NEJMoa1809615
74. Cortes J, Cescon DW, Rugo HS, Nowecki Z, Im SA, Yusof MM, et al. Pembrolizumab Plus Chemotherapy Versus Placebo Plus Chemotherapy for Previously Untreated Locally Recurrent Inoperable or Metastatic Triple-Negative Breast Cancer (KEYNOTE-355): A Randomised, Placebo-Controlled, Double-Blind, Phase 3 Clinical Trial. Lancet (2020) 396(10265):1817–28. doi: 10.1016/S0140-6736(20)32531-9
75. Denkert C, Loibl S, Noske A, Roller M, Muller BM, Komor M, et al. Tumor-Associated Lymphocytes as an Independent Predictor of Response to Neoadjuvant Chemotherapy in Breast Cancer. J Clin Oncol (2010) 28(1):105–13. doi: 10.1200/JCO.2009.23.7370
76. Loi S, Sirtaine N, Piette F, Salgado R, Viale G, Van Eenoo F, et al. Prognostic and Predictive Value of Tumor-Infiltrating Lymphocytes in a Phase III Randomized Adjuvant Breast Cancer Trial in Node-Positive Breast Cancer Comparing the Addition of Docetaxel to Doxorubicin With Doxorubicin-Based Chemotherapy: BIG 02-98. J Clin Oncol (2013) 31(7):860–7. doi: 10.1200/JCO.2011.41.0902
77. Ali HR, Provenzano E, Dawson SJ, Blows FM, Liu B, Shah M, et al. Association Between CD8+ T-Cell Infiltration and Breast Cancer Survival in 12,439 Patients. Ann Oncol (2014) 25(8):1536–43. doi: 10.1093/annonc/mdu191
78. Bottai G, Raschioni C, Losurdo A, Di Tommaso L, Tinterri C, Torrisi R, et al. An Immune Stratification Reveals a Subset of PD-1/LAG-3 Double-Positive Triple-Negative Breast Cancers. Breast Cancer Res (2016) 18(1):121. doi: 10.1186/s13058-016-0783-4
79. Mahmoud SM, Paish EC, Powe DG, Macmillan RD, Grainge MJ, Lee AH, et al. Tumor-Infiltrating CD8+ Lymphocytes Predict Clinical Outcome in Breast Cancer. J Clin Oncol (2011) 29(15):1949–55. doi: 10.1200/JCO.2010.30.5037
80. Stanton SE, Disis ML. Clinical Significance of Tumor-Infiltrating Lymphocytes in Breast Cancer. J Immunother Cancer (2016) 4:59. doi: 10.1186/s40425-016-0165-6
81. Yuan Y. Modelling the Spatial Heterogeneity and Molecular Correlates of Lymphocytic Infiltration in Triple-Negative Breast Cancer. J R Soc Interface (2015) 12(103):20141153. doi: 10.1098/rsif.2014.1153
82. Maley CC, Koelble K, Natrajan R, Aktipis A, Yuan Y. An Ecological Measure of Immune-Cancer Colocalization as a Prognostic Factor for Breast Cancer. Breast Cancer Res (2015) 17(1):131. doi: 10.1186/s13058-015-0638-4
83. Nawaz S, Heindl A, Koelble K, Yuan Y. Beyond Immune Density: Critical Role of Spatial Heterogeneity in Estrogen Receptor-Negative Breast Cancer. Mod Pathol (2015) 28(12):1621. doi: 10.1038/modpathol.2015.37
84. Heindl A, Sestak I, Naidoo K, Cuzick J, Dowsett M, Yuan Y. Relevance of Spatial Heterogeneity of Immune Infiltration for Predicting Risk of Recurrence After Endocrine Therapy of ER+ Breast Cancer. J Natl Cancer Inst (2018) 110(2):10.1093/jnci/djx137. doi: 10.1093/jnci/djx137
85. Krijgsman D, van Leeuwen MB, van der Ven J, Almeida V, Vlutters R, Halter D, et al. Quantitative Whole Slide Assessment of Tumor-Infiltrating CD8-Positive Lymphocytes in ER-Positive Breast Cancer in Relation to Clinical Outcome. IEEE J BioMed Health Inform (2021) 25(2):381–92. doi: 10.1109/JBHI.2020.3003475
86. Rasmusson A, Zilenaite D, Nestarenkaite A, Augulis R, Laurinaviciene A, Ostapenko V, et al. Immunogradient Indicators for Antitumor Response Assessment by Automated Tumor-Stroma Interface Zone Detection. Am J Pathol (2020) 190(6):1309–22. doi: 10.1016/j.ajpath.2020.01.018
87. Radziuviene G, Rasmusson A, Augulis R, Lesciute-Krilaviciene D, Laurinaviciene A, Clim E, et al. Automated Image Analysis of HER2 Fluorescence In Situ Hybridization to Refine Definitions of Genetic Heterogeneity in Breast Cancer Tissue. BioMed Res Int (2017) 2017:2321916. doi: 10.1155/2017/2321916
88. Haralick R, Shanmugam K, Dinstein I. Textural Features for Image Classification. IEEE Trans Syst Man Cybern (1973) SMC-3:610–21. doi: 10.1109/TSMC.1973.4309314
89. Budczies J, Klauschen F, Sinn BV, Gyorffy B, Schmitt WD, Darb-Esfahani S, et al. Cutoff Finder: A Comprehensive and Straightforward Web Application Enabling Rapid Biomarker Cutoff Optimization. PloS One (2012) 7(12):e51862. doi: 10.1371/journal.pone.0051862
90. Rushing C, Bulusu A, Hurwitz HI, Nixon AB, Pang H. A Leave-One-Out Cross-Validation SAS Macro for the Identification of Markers Associated With Survival. Comput Biol Med (2015) 57:123–9. doi: 10.1016/j.compbiomed.2014.11.015
91. Pinhel I, Hills M, Drury S, Salter J, Sumo G, A’Hern R, et al. ER and HER2 Expression are Positively Correlated in HER2 Non-Overexpressing Breast Cancer. Breast Cancer Res (2012) 14(2):R46. doi: 10.1186/bcr3145
92. Bartlett JM, Munro AF, Dunn JA, McConkey C, Jordan S, Twelves CJ, et al. Predictive Markers of Anthracycline Benefit: A Prospectively Planned Analysis of the UK National Epirubicin Adjuvant Trial (NEAT/Br9601). Lancet Oncol (2010) 11(3):266–74. doi: 10.1016/S1470-2045(10)70006-1
93. Tibau A, Lopez-Vilaro L, Perez-Olabarria M, Vazquez T, Pons C, Gich I, et al. Chromosome 17 Centromere Duplication and Responsiveness to Anthracycline-Based Neoadjuvant Chemotherapy in Breast Cancer. Neoplasia (2014) 16(10):861–7. doi: 10.1016/j.neo.2014.08.012
94. Bartlett JM, McConkey CC, Munro AF, Desmedt C, Dunn JA, Larsimont DP, et al. Predicting Anthracycline Benefit: TOP2A and CEP17-Not Only But Also. J Clin Oncol (2015) 33(15):1680–7. doi: 10.1200/JCO.2013.54.7869
95. Reinholz MM, Bruzek AK, Visscher DW, Lingle WL, Schroeder MJ, Perez EA, et al. Breast Cancer and Aneusomy 17: Implications for Carcinogenesis and Therapeutic Response. Lancet Oncol (2009) 10(3):267–77. doi: 10.1016/S1470-2045(09)70063-4
96. Zody MC, Garber M, Adams DJ, Sharpe T, Harrow J, Lupski JR, et al. DNA Sequence of Human Chromosome 17 and Analysis of Rearrangement in the Human Lineage. Nature (2006) 440(7087):1045–9. doi: 10.1038/nature04689
97. Chen Z, Chen X, Zhou E, Chen G, Qian K, Wu X, et al. Intratumoral CD8(+) Cytotoxic Lymphocyte is a Favorable Prognostic Marker in Node-Negative Breast Cancer. PloS One (2014) 9(4):e95475. doi: 10.1371/journal.pone.0095475
98. Fortis SP, Sofopoulos M, Sotiriadou NN, Haritos C, Vaxevanis CK, Anastasopoulou EA, et al. Differential Intratumoral Distributions of CD8 and CD163 Immune Cells as Prognostic Biomarkers in Breast Cancer. J Immunother Cancer (2017) 5:39. doi: 10.1186/s40425-017-0240-7
99. Sobral-Leite M, Salomon I, Opdam M, Kruger DT, Beelen KJ, van der Noort V, et al. Cancer-Immune Interactions in ER-Positive Breast Cancers: PI3K Pathway Alterations and Tumor-Infiltrating Lymphocytes. Breast Cancer Res (2019) 21(1):90. doi: 10.1186/s13058-019-1176-2
100. Baker K, Lachapelle J, Zlobec I, Bismar TA, Terracciano L, Foulkes WD. Prognostic Significance of CD8+ T Lymphocytes in Breast Cancer Depends Upon Both Oestrogen Receptor Status and Histological Grade. Histopathology (2011) 58(7):1107–16. doi: 10.1111/j.1365-2559.2011.03846.x
101. Verma R, Hanby AM, Horgan K, Verghese ET, Volpato M, Carter CR, et al. Levels of Different Subtypes of Tumour-Infiltrating Lymphocytes Correlate With Each Other, With Matched Circulating Lymphocytes, and With Survival in Breast Cancer. Breast Cancer Res Treat (2020) 183(1):49–59. doi: 10.1007/s10549-020-05757-5
102. Dieci MV, Griguolo G, Miglietta F, Guarneri V. The Immune System and Hormone-Receptor Positive Breast Cancer: Is it Really a Dead End? Cancer Treat Rev (2016) 46:9–19. doi: 10.1016/j.ctrv.2016.03.011
103. Nuciforo P, Pascual T, Cortes J, Llombart-Cussac A, Fasani R, Pare L, et al. A Predictive Model of Pathologic Response Based on Tumor Cellularity and Tumor-Infiltrating Lymphocytes (CelTIL) in HER2-Positive Breast Cancer Treated With Chemo-Free Dual HER2 Blockade. Ann Oncol (2018) 29(1):170–7. doi: 10.1093/annonc/mdx647
104. Solinas C, Ceppi M, Lambertini M, Scartozzi M, Buisseret L, Garaud S, et al. Tumor-Infiltrating Lymphocytes in Patients With HER2-Positive Breast Cancer Treated With Neoadjuvant Chemotherapy Plus Trastuzumab, Lapatinib or Their Combination: A Meta-Analysis of Randomized Controlled Trials. Cancer Treat Rev (2017) 57:8–15. doi: 10.1016/j.ctrv.2017.04.005
105. Salgado R, Denkert C, Campbell C, Savas P, Nuciforo P, Aura C, et al. Tumor-Infiltrating Lymphocytes and Associations With Pathological Complete Response and Event-Free Survival in HER2-Positive Early-Stage Breast Cancer Treated With Lapatinib and Trastuzumab: A Secondary Analysis of the NeoALTTO Trial. JAMA Oncol (2015) 1(4):448–54. doi: 10.1001/jamaoncol.2015.0830
106. Liu S, Lachapelle J, Leung S, Gao D, Foulkes WD, Nielsen TO. CD8+ Lymphocyte Infiltration is an Independent Favorable Prognostic Indicator in Basal-Like Breast Cancer. Breast Cancer Res (2012) 14(2):R48. doi: 10.1186/bcr3148
107. Mao Y, Qu Q, Chen X, Huang O, Wu J, Shen K. The Prognostic Value of Tumor-Infiltrating Lymphocytes in Breast Cancer: A Systematic Review and Meta-Analysis. PloS One (2016) 11(4):e0152500. doi: 10.1371/journal.pone.0152500
108. Griguolo G, Pascual T, Dieci MV, Guarneri V, Prat A. Interaction of Host Immunity With HER2-Targeted Treatment and Tumor Heterogeneity in HER2-Positive Breast Cancer. J Immunother Cancer (2019) 7(1):90. doi: 10.1186/s40425-019-0548-6
109. Bianchini G, Gianni L. The Immune System and Response to HER2-Targeted Treatment in Breast Cancer. Lancet Oncol (2014) 15(2):e58–68. doi: 10.1016/S1470-2045(13)70477-7
110. Park S, Jiang Z, Mortenson ED, Deng L, Radkevich-Brown O, Yang X, et al. The Therapeutic Effect of Anti-HER2/neu Antibody Depends on Both Innate and Adaptive Immunity. Cancer Cell (2010) 18(2):160–70. doi: 10.1016/j.ccr.2010.06.014
111. Stagg J, Loi S, Divisekera U, Ngiow SF, Duret H, Yagita H, et al. Anti-ErbB-2 mAb Therapy Requires Type I and II Interferons and Synergizes With Anti-PD-1 or Anti-CD137 mAb Therapy. Proc Natl Acad Sci USA (2011) 108(17):7142–7. doi: 10.1073/pnas.1016569108
112. Wang Q, Li SH, Wang H, Xiao Y, Sahin O, Brady SW, et al. Concomitant Targeting of Tumor Cells and Induction of T-Cell Response Synergizes to Effectively Inhibit Trastuzumab-Resistant Breast Cancer. Cancer Res (2012) 72(17):4417–28. doi: 10.1158/0008-5472.CAN-12-1339-T
113. Loi S, Michiels S, Salgado R, Sirtaine N, Jose V, Fumagalli D, et al. Tumor Infiltrating Lymphocytes Are Prognostic in Triple Negative Breast Cancer and Predictive for Trastuzumab Benefit in Early Breast Cancer: Results From the FinHER Trial. Ann Oncol (2014) 25(8):1544–50. doi: 10.1093/annonc/mdu112
114. Perez EA, Thompson EA, Ballman KV, Anderson SK, Asmann YW, Kalari KR, et al. Genomic Analysis Reveals That Immune Function Genes Are Strongly Linked to Clinical Outcome in the North Central Cancer Treatment Group N9831 Adjuvant Trastuzumab Trial. J Clin Oncol (2015) 33(7):701–8. doi: 10.1200/JCO.2014.57.6298
115. Lee HJ, Kim JY, Park IA, Song IH, Yu JH, Ahn JH, et al. Prognostic Significance of Tumor-Infiltrating Lymphocytes and the Tertiary Lymphoid Structures in HER2-Positive Breast Cancer Treated With Adjuvant Trastuzumab. Am J Clin Pathol (2015) 144(2):278–88. doi: 10.1309/AJCPIXUYDVZ0RZ3G
116. Perez EA, Ballman KV, Tenner KS, Thompson EA, Badve SS, Bailey H, et al. Association of Stromal Tumor-Infiltrating Lymphocytes With Recurrence-Free Survival in the N9831 Adjuvant Trial in Patients With Early-Stage HER2-Positive Breast Cancer. JAMA Oncol (2016) 2(1):56–64. doi: 10.1001/jamaoncol.2015.3239
Keywords: HER2, breast cancer, intratumoral heterogeneity, CD8, immune response, tumor microenvironment, digital pathology
Citation: Radziuviene G, Rasmusson A, Augulis R, Grineviciute RB, Zilenaite D, Laurinaviciene A, Ostapenko V and Laurinavicius A (2021) Intratumoral Heterogeneity and Immune Response Indicators to Predict Overall Survival in a Retrospective Study of HER2-Borderline (IHC 2+) Breast Cancer Patients. Front. Oncol. 11:774088. doi: 10.3389/fonc.2021.774088
Received: 10 September 2021; Accepted: 22 October 2021;
Published: 11 November 2021.
Edited by:
Elena Provenzano, Cambridge Biomedical Research Centre (NIHR), United KingdomReviewed by:
Edward Stack, Jounce Therapeutics, Inc., United StatesMarco Invernizzi, University of Eastern Piedmont, Italy
Copyright © 2021 Radziuviene, Rasmusson, Augulis, Grineviciute, Zilenaite, Laurinaviciene, Ostapenko and Laurinavicius. This is an open-access article distributed under the terms of the Creative Commons Attribution License (CC BY). The use, distribution or reproduction in other forums is permitted, provided the original author(s) and the copyright owner(s) are credited and that the original publication in this journal is cited, in accordance with accepted academic practice. No use, distribution or reproduction is permitted which does not comply with these terms.
*Correspondence: Gedmante Radziuviene, Z2VkbWFudGUucmFkeml1dmllbmVAdnBjLmx0