 Shreya Mehta1,2
 Nazim Bhimani3
 Anthony J. Gill1,2,4,5,6
 Jaswinder S. Samra1,3,5
 Sumit Sahni1,2,5*†Anubhav Mittal1,3,5*†
- 1Northern Clinical School, Faculty of Medicine and Health, University of Sydney, Sydney, NSW, Australia
- 2Kolling Institute of Medical Research, University of Sydney, Sydney, NSW, Australia
- 3Upper Gastro Intestinal (GI) Surgical Unit, Royal North Shore Hospital and North Shore Private Hospital, Sydney, NSW, Australia
- 4Cancer Diagnosis and Pathology Group, Kolling Institute of Medical Research, Royal North Shore Hospital, St Leonards, NSW, Australia
- 5Australian Pancreatic Centre, Sydney, NSW, Australia
- 6NSW Health Pathology, Department of Anatomical Pathology, Royal North Shore Hospital, St Leonards, NSW, Australia
A Corrigendum on
Serum Biomarker Panel for Diagnosis and Prognosis of Pancreatic Ductal Adenocarcinomas
by Mehta S., Bhimani N., Gill A.J., Samra J.S., Sahni S. and Mittal A. (2021) Front. Oncol., 11: 708963 doi: 10.3389/fonc.2021.708963
In the original article, there was a mistake in Figures 2, 3, Supplementary Figure 1 and Table 1. There was an error in the survival data for some patients which has slightly modified curves. The corrected Figures 2, 3, Supplementary Figure 1 and Table 1 appears below.
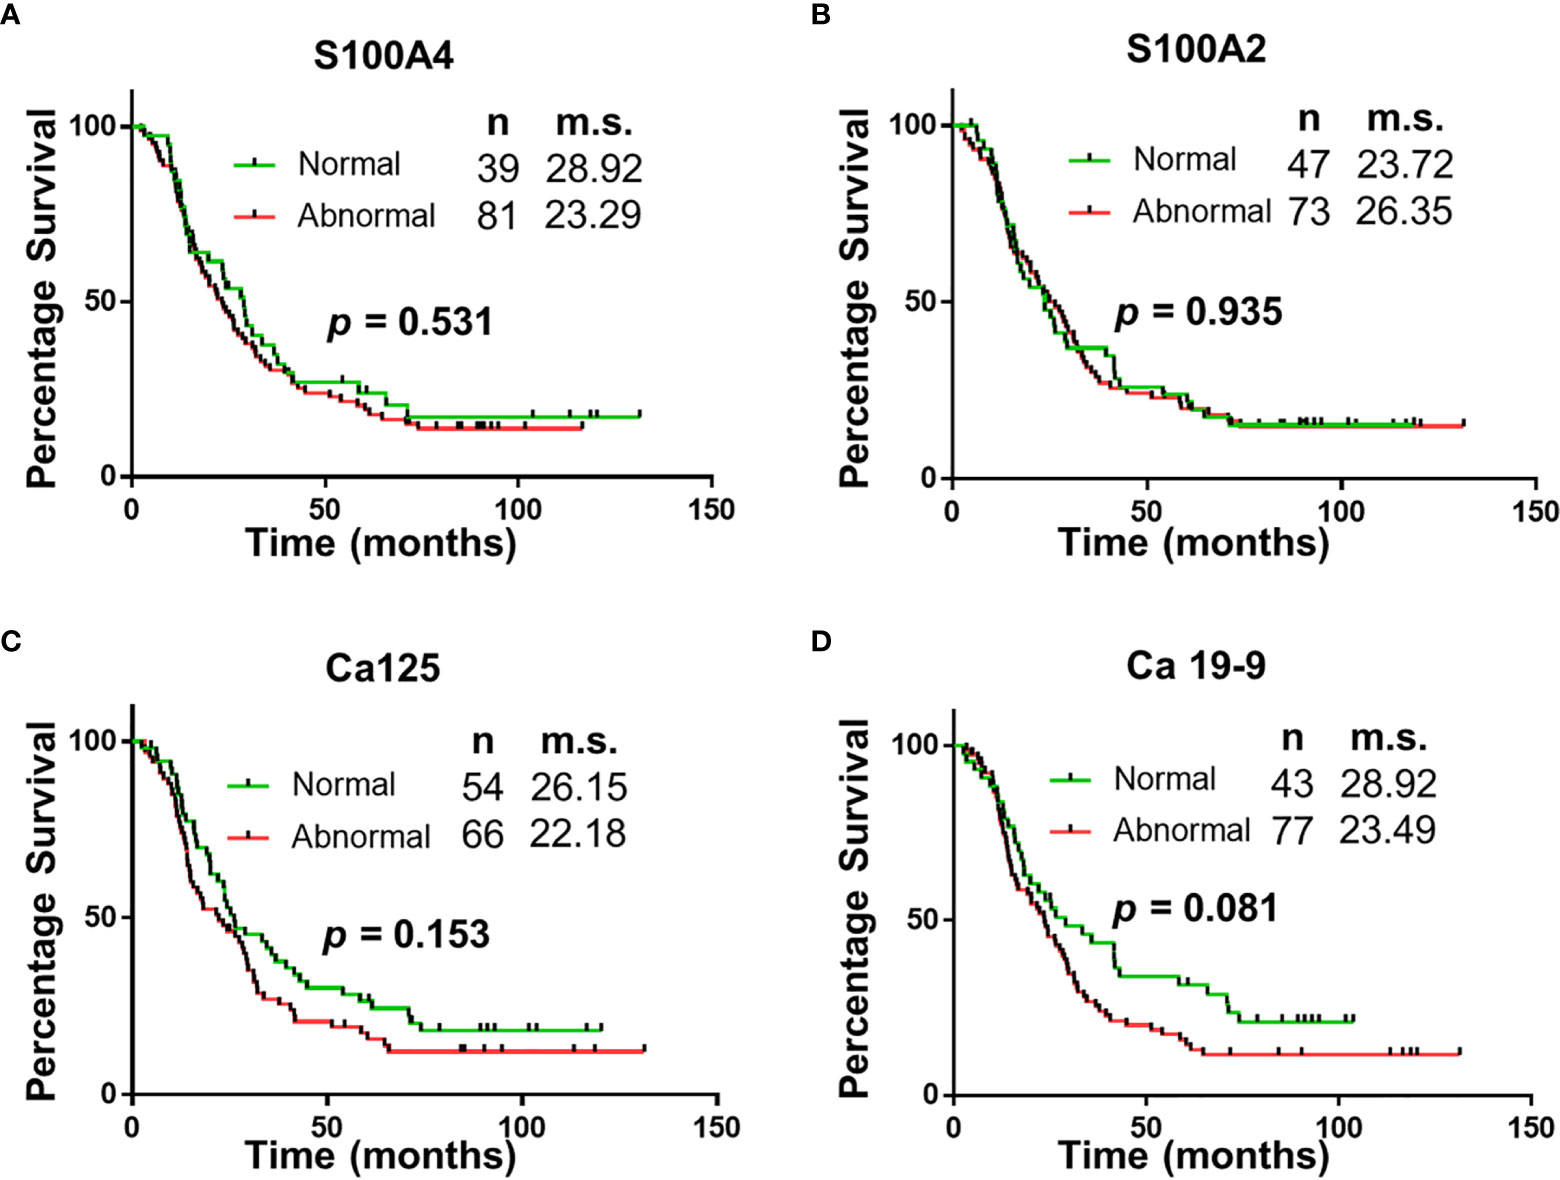
Figure 2 Univariable Survival Analysis of Individual Biomarkers. (A–D) Kaplan Meier survival curves for individual biomarkers were generated using prognostic cut-offs (Supplementary Table 3). n, number of patients; m.s., median survival in months.
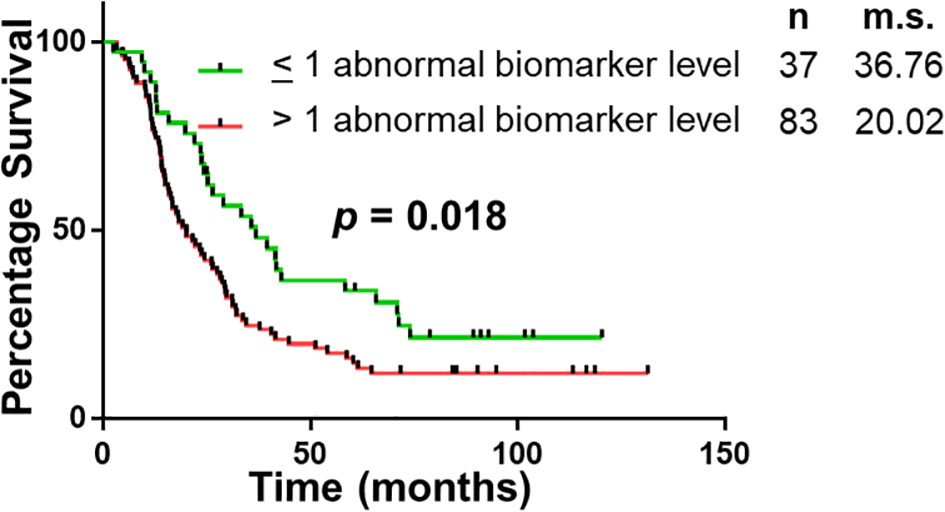
Figure 3 Univariable Survival Analysis of Biomarker Panel. Kaplan Meier survival curves comparing patients with abnormal biomarker levels of one or less biomarker and patients with abnormal biomarker levels of two or more biomarkers. n, number of patients; m.s., median survival in months.
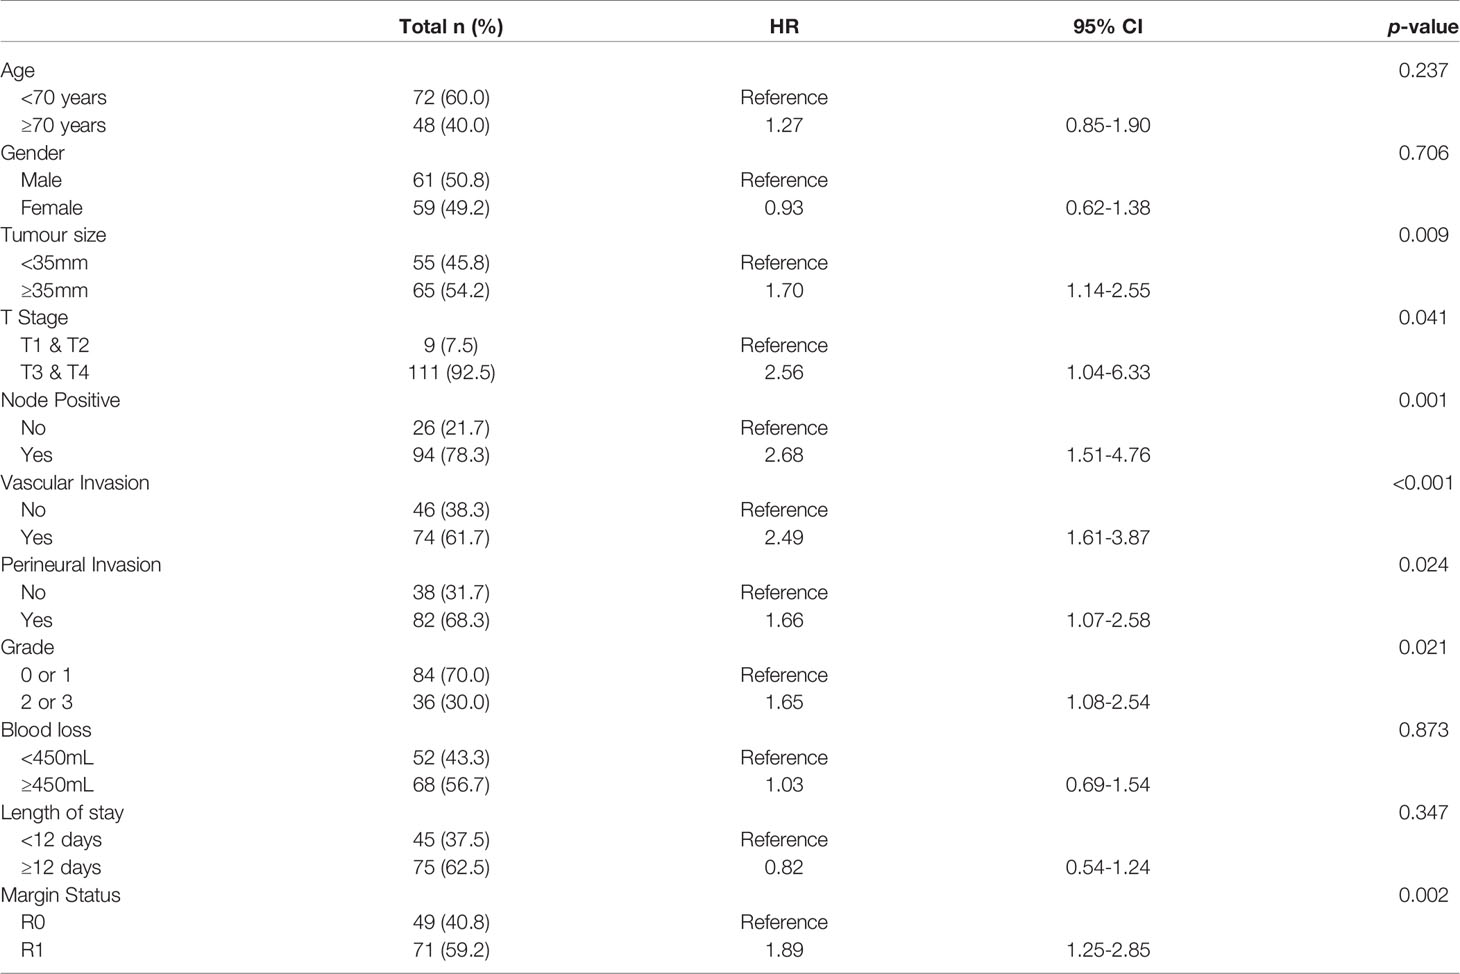
Table 1 Patient and tumour characteristics and correlation with survival status.
In the original article, there was an error. The stated median survival and p value of survival analysis were incorrect. A correction has been made to Results, Survival Analysis Based on Serum Biomarker Levels paragraph 1 and 2:
“Survival correlation with abnormal serum biomarker levels were determined using Kaplan Meier curves. Abnormal serum levels of S100A4 (median survival (m.s.): 28.92 vs 23.29 months; Figure 2), Ca-125 (m.s.: 26.15 vs 22.18 months; Figure 2) and Ca19-9 (m.s.: 28.92 vs 23.49 months; Figure 2) led to reduction in the median overall survival time. In contrast, abnormal serum levels of S100A2 resulted in increased median survival time (m.s.: 23.72 vs 26.35 months; Figure 2). However, none of the biomarkers individually corresponded with overall survival.
The panel of S100A4, Ca-125 and Ca 19-9 was further analysed to determine its ability to stratify patients based on their overall survival. Initially, patients were divided into four groups: (1) none of the biomarkers with abnormal levels (n = 6); (2) one biomarker with abnormal levels (n = 31); (3) two biomarkers with abnormal levels (n = 56); (4) three biomarkers with abnormal levels (n = 27). Multiple comparison Kaplan Meier curve analysis did not achieve statistical significance (p = 0.121; Supplementary Figure 1), potentially due to very small number of patients in some categories. The combination of first two and last two categories was able to stratify patients based on their overall survival (Figure 3). The patients with abnormal levels of one or less of the biomarker (n = 37) had significantly improved survival outcomes, compared to those with abnormal levels of two or more biomarkers (n = 83; m.s.: 36.76 vs 20.02 months, p = 0.018; Figure 3). Patient distribution based on tumour characteristics was also analysed (Supplementary Table 4), which showed uniform distribution in both biomarker groups”.
In the original article, there was an error. The stated median survival was incorrect. A correction has been made to Discussion, paragraph 1:
“The study demonstrates that of the select group of biomarkers included in this study, a panel of four (S100A4, S100A2, Ca-125 and Ca 19-9) have superior diagnostic potential compared to the current biomarker used in clinical practice, Ca 19-9 alone. Additionally, the abnormal expression of two or more biomarkers correlated with worse survival (median survival: 36.76 vs 20.02 months; p < 0.05). The utility of this biomarker panel in the accurate diagnosis of PDAC and implications of biomarker expression on prognosis may assist with personalization of treatment and improved survival outcomes”.
The authors apologize for these errors and state that this does not change the scientific conclusions of the article in any way. The original article has been updated.
Publisher’s Note
All claims expressed in this article are solely those of the authors and do not necessarily represent those of their affiliated organizations, or those of the publisher, the editors and the reviewers. Any product that may be evaluated in this article, or claim that may be made by its manufacturer, is not guaranteed or endorsed by the publisher.
Supplementary Material
The Supplementary Material for this article can be found online at: https://www.frontiersin.org/articles/10.3389/fonc.2021.774861/full#supplementary-material
Keywords: pancreatic ductal adenocarcinoma, diagnostic biomarkers, prognostic biomarkers, S100A4, Ca-125 and Ca 19-9, survival analysis
Citation: Mehta S, Bhimani N, Gill AJ, Samra JS, Sahni S and Mittal A (2021) Corrigendum: Serum Biomarker Panel for Diagnosis and Prognosis of Pancreatic Ductal Adenocarcinomas. Front. Oncol. 11:774861. doi: 10.3389/fonc.2021.774861
Received: 13 September 2021; Accepted: 14 September 2021;
Published: 06 October 2021.
Edited and reviewed by:
Brendan Jenkins, Hudson Institute of Medical Research, AustraliaCopyright © 2021 Mehta, Bhimani, Gill, Samra, Sahni and Mittal. This is an open-access article distributed under the terms of the Creative Commons Attribution License (CC BY). The use, distribution or reproduction in other forums is permitted, provided the original author(s) and the copyright owner(s) are credited and that the original publication in this journal is cited, in accordance with accepted academic practice. No use, distribution or reproduction is permitted which does not comply with these terms.
*Correspondence: Anubhav Mittal, YW51Ymhhdi5taXR0YWxAc3lkbmV5LmVkdS5hdQ==; Sumit Sahni, c3VtaXQuc2FobmlAc3lkbmV5LmVkdS5hdQ==
†These authors share senior authorship