 Thomas C. Booth1,2*
 Evita C. Wiegers3
 Esther A. H. Warnert4
 Kathleen M. Schmainda5
 Frank Riemer6Ruben E. Nechifor7
 Vera C. Keil8
 Gilbert Hangel9
 Patrícia Figueiredo10
 Maria Del Mar Álvarez-Torres11Otto M. Henriksen12 on behalf of the European Cooperation in Science Technology (COST) Glioma MR Imaging 2.0 (GliMR) initiative
- 1School of Biomedical Engineering and Imaging Sciences, King’s College London, St. Thomas’ Hospital, London, United Kingdom
- 2Department of Neuroradiology, King’s College Hospital NHS Foundation Trust, London, United Kingdom
- 3Department of Radiology, University Medical Center Utrecht, Utrecht, Netherlands
- 4Department of Radiology & Nuclear Medicine, Erasmus MC, Rotterdam, Netherlands
- 5Department of Biophysics, Medical College of Wisconsin, Milwaukee, WI, United States
- 6Mohn Medical Imaging and Visualization Centre (MMIV), Department of Radiology, Haukeland University Hospital, Bergen, Norway
- 7Department of Clinical Psychology and Psychotherapy International Institute for the Advanced Studies of Psychotherapy and Applied Mental Health, Babes-Bolyai University, Cluj-Napoca, Romania
- 8Department of Radiology and Nuclear Medicine, Amsterdam UMC, location VUmc, Amsterdam, Netherlands
- 9Department of Neurosurgery & High-Field MR Centre, Department of Biomedical Imaging and Image-Guided Therapy, Medical University Vienna, Vienna, Austria
- 10Department of Bioengineering and Institute for Systems and Robotics - Lisboa, Instituto Superior Técnico, Universidade de Lisboa, Lisbon, Portugal
- 11Biomedical Data Science Laboratory, ITACA, Universitat Politècnica de València, Valencia, Spain
- 12Department of Clinical Physiology, Nuclear medicine and PET, Copenhagen University Hospital Rigshospitalet, Copenhagen, Denmark
Objective: To summarize evidence for use of advanced MRI techniques as monitoring biomarkers in the clinic, and to highlight the latest bench-to-bedside developments.
Methods: The current evidence regarding the potential for monitoring biomarkers was reviewed and individual modalities of metabolism and/or chemical composition imaging discussed. Perfusion, permeability, and microstructure imaging were similarly analyzed in Part 1 of this two-part review article and are valuable reading as background to this article. We appraise the clinic readiness of all the individual modalities and consider methodologies involving machine learning (radiomics) and the combination of MRI approaches (multiparametric imaging).
Results: The biochemical composition of high-grade gliomas is markedly different from healthy brain tissue. Magnetic resonance spectroscopy allows the simultaneous acquisition of an array of metabolic alterations, with choline-based ratios appearing to be consistently discriminatory in treatment response assessment, although challenges remain despite this being a mature technique. Promising directions relate to ultra-high field strengths, 2-hydroxyglutarate analysis, and the use of non-proton nuclei. Labile protons on endogenous proteins can be selectively targeted with chemical exchange saturation transfer to give high resolution images. The body of evidence for clinical application of amide proton transfer imaging has been building for a decade, but more evidence is required to confirm chemical exchange saturation transfer use as a monitoring biomarker. Multiparametric methodologies, including the incorporation of nuclear medicine techniques, combine probes measuring different tumor properties. Although potentially synergistic, the limitations of each individual modality also can be compounded, particularly in the absence of standardization. Machine learning requires large datasets with high-quality annotation; there is currently low-level evidence for monitoring biomarker clinical application.
Conclusion: Advanced MRI techniques show huge promise in treatment response assessment. The clinical readiness analysis highlights that most monitoring biomarkers require standardized international consensus guidelines, with more facilitation regarding technique implementation and reporting in the clinic.
1 Introduction
Contemporaneous, accurate, and reliable monitoring biomarkers are required for high-grade glioma treatment response assessment as important challenges limit the use of conventional structural MRI protocols. The current evidence regarding the potential for monitoring biomarkers based on advanced MRI techniques shows that the methodology has developed considerably. Although some techniques have evolved and matured over three decades, several new state-of-the-art methods are poised to contribute to the imaging armamentarium. However, limitations for all techniques remain. High level evidence (level 1 or 2) (1) of clinical diagnostic accuracy typically is lacking. Clinical implementation of standardized tools generally remains challenging, and some recent techniques are in their infancy. Many of these findings were shown following review of the modalities of perfusion, permeability, and microstructure imaging, described in Part 1 (High-Grade Glioma Treatment Response Monitoring Biomarkers: A Position Statement on the Evidence Supporting the Use of Advanced MRI Techniques in the Clinic, and the Latest Bench-to-Bedside Developments. Part 1: Perfusion and Diffusion Techniques) of this two-part review article.
The challenges limiting the use of conventional structural MRI protocols as monitoring biomarkers and the need for novel monitoring biomarkers are also described in Part 1. To complete a summary of the evidence for the use of advanced MRI techniques as monitoring biomarkers in the clinic, and to finish highlighting the latest bench-to-bedside developments, we now focus on the individual modalities of metabolism and/or chemical composition imaging. We also appraise the clinic readiness of all the individual modalities. Furthermore, we consider post-processing methodologies involving the combination of MRI approaches (multiparametric imaging) or machine learning (radiomics).
2 Materials and Methods
The review method is described fully in Part 1. Briefly, experts in advanced MRI techniques applied to high-grade glioma treatment response assessment, convened through a European framework. The consensus decision was to focus on monitoring biomarkers that can reliably differentiate post-treatment-related effects (PTRE) from true tumor progression during (or before) the point when contrast enhancement on longitudinal relaxation time T1-weighted MRI images first increases.
Advanced imaging technique analyses were compiled by subject matter experts and incorporated into a manuscript and circulated to the working group members.
To determine clinical diagnostic accuracy, we performed MEDLINE (including PubMed), Embase and Cochrane Register searches for recent systematic reviews and meta-analyses, favoring those which followed Preferred Reporting Items for Systematic Reviews and Meta-Analysis: Diagnostic Test Accuracy (PRISMA-DTA) methodology (2). We also performed searches to analyze individual clinical studies related to each advanced imaging technique since the time of the included systematic review; if a systematic review was published before 2015, we confined our searches to 2015–2021.
3 Results
3.1 Advanced MRI Techniques
3.1.1 Spectroscopy-Based Techniques
3.1.1.1 Methodology
Proton magnetic resonance spectroscopy (1H MRS) is a technique that enables noninvasive characterization of certain biochemicals that are intermediates or end products of cellular metabolism, referred to as metabolites, within tissues based on the chemical shift of molecule resonances in relation to water. The area under a metabolite peak in a magnetic resonance (MR) spectrum is directly proportional to the tissue concentration of this metabolite. The major peaks in the brain include resonances of N-acetyl-aspartate (NAA), choline (Cho), creatine (Cre), and glutamate (Glu), but the total number of quantifiable metabolites depends mainly on the pulse sequence used, sequence parameters (e.g., echo time), and static magnetic field strength (3).
It is well known that spectra acquired from brain tumors are markedly different from spectra acquired from healthy brain tissue (4). An elevated Cho concentration and reduced NAA concentration can often be identified in tumors. A decrease in NAA is often interpreted as a loss or dysfunction of neural tissue, while increased Cho levels are thought to reflect the increased cell membrane turnover in tumors. Additional commonly used markers for tumor proliferation and tumor metabolism include increased lactate, myo-inositol, and lipid levels. In normal brain tissue, lactate is present in a barely MRS-detectable concentration. Elevated lactate levels may be the result of anaerobic glycolysis (i.e., the Warburg effect), necrosis, or ischemia. The exact role of myo-inositol is not fully elucidated, but studies have shown that it may reflect the number of viable glial cells in brain tumors (5). Lipid levels correlate with a breakdown of cell membranes through necrosis and, as such, are a marker for high-grade tumors (6). Because the direct estimation of biochemical concentrations in tumor tissue with in vivo MRS remains challenging, clinical and research outputs are normally described as ratios to NAA or Cr.
1H MRS data can be acquired either as single voxel spectroscopy (SVS, Figure 1) or from multiple voxels by spectroscopic imaging [2D or 3D magnetic resonance spectroscopic imaging (MRSI), Figure 2]. SVS is easy to implement and less time consuming than MRSI. However, the acquisition of a single, rather large, voxel may result in either incomplete sampling of the tumor or the inclusion of peritumoral regions in the sample, which may confound the analysis of heterogeneous tumor tissue.
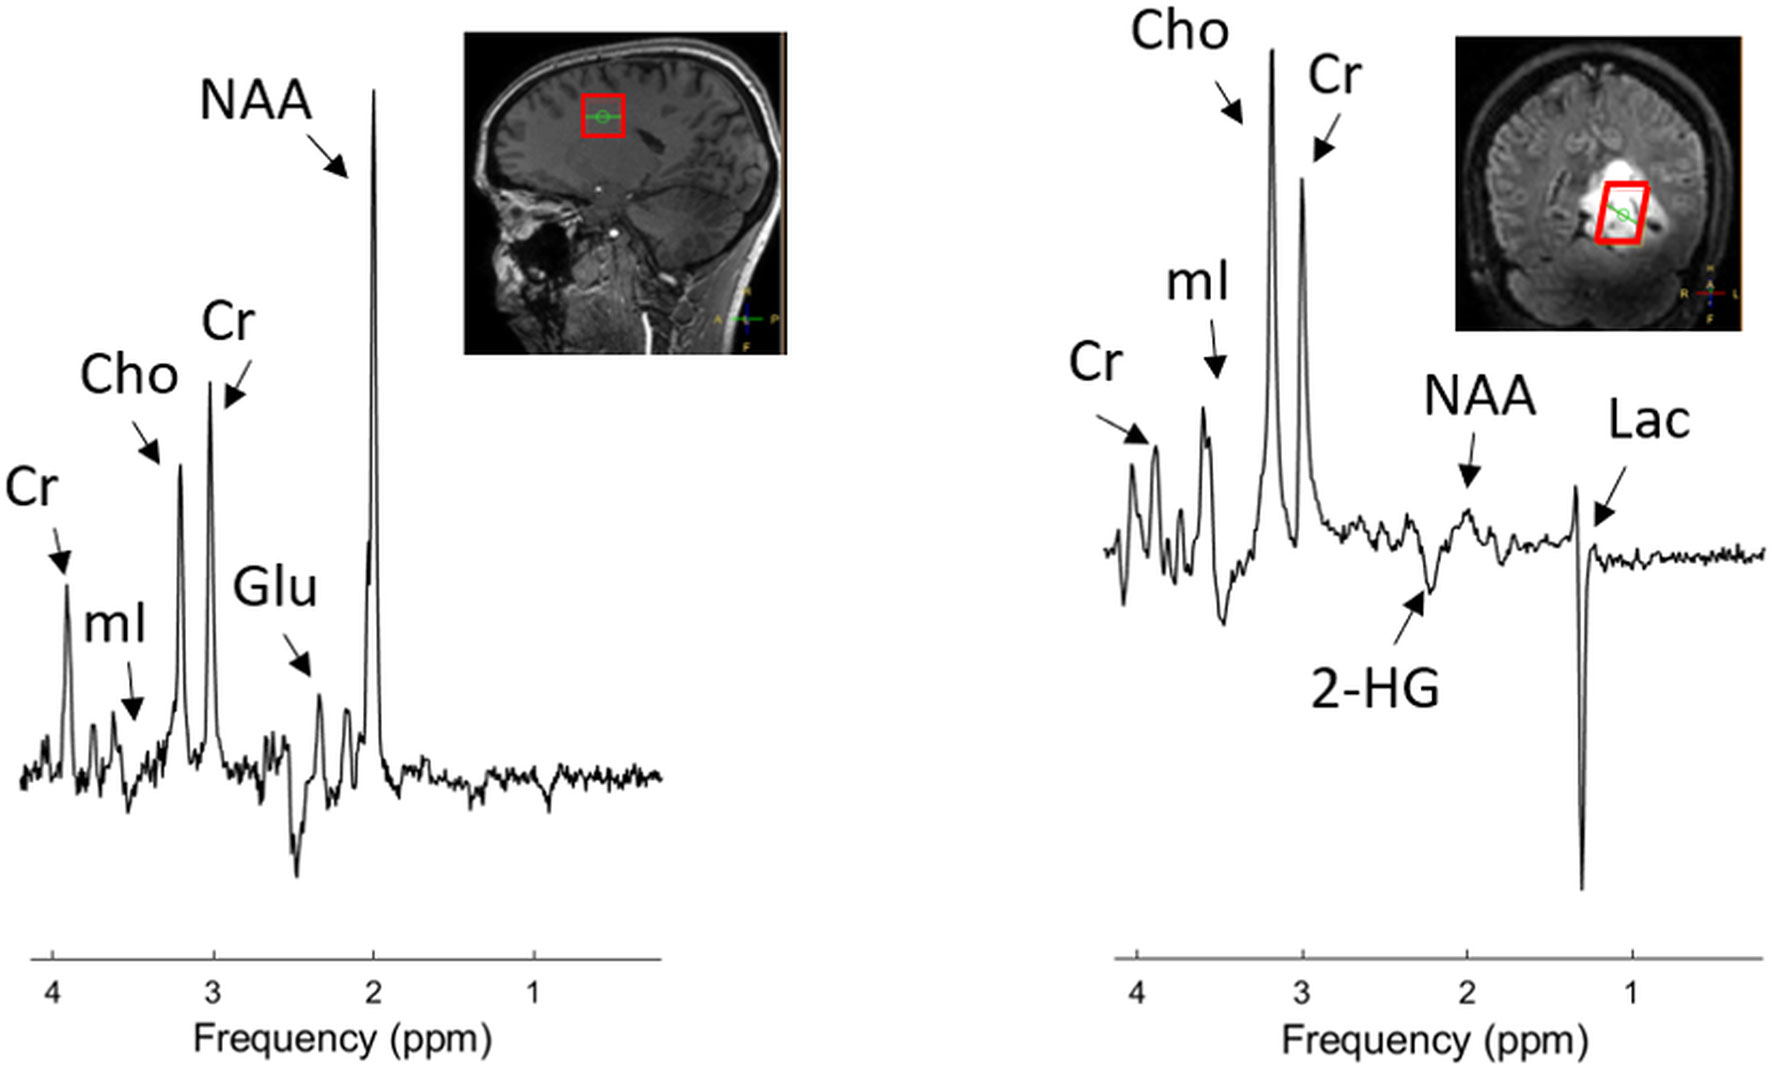
Figure 1 Example of single-voxel 1H MRS data acquired in a healthy volunteer (left) and a patient with diffuse astrocytoma with IDH-mutation, WHO grade 2. Data were acquired with a sLASER sequence at 7 T (TE 110 ms, TR 5000 ms) dedicated for detection of 2HG. The location of the MRS voxel is indicated by the red box in the structural images. An elevated Cho and Lac level and reduced NAA level are clearly visible in the tumor. Choline (Cho), Creatine (Cre), N-acetyl-aspartate (NAA), lactate (Lac), myo-Inositol (mI), glutamate (Glu). For illustrative purposes, a low-grade glioma is used.
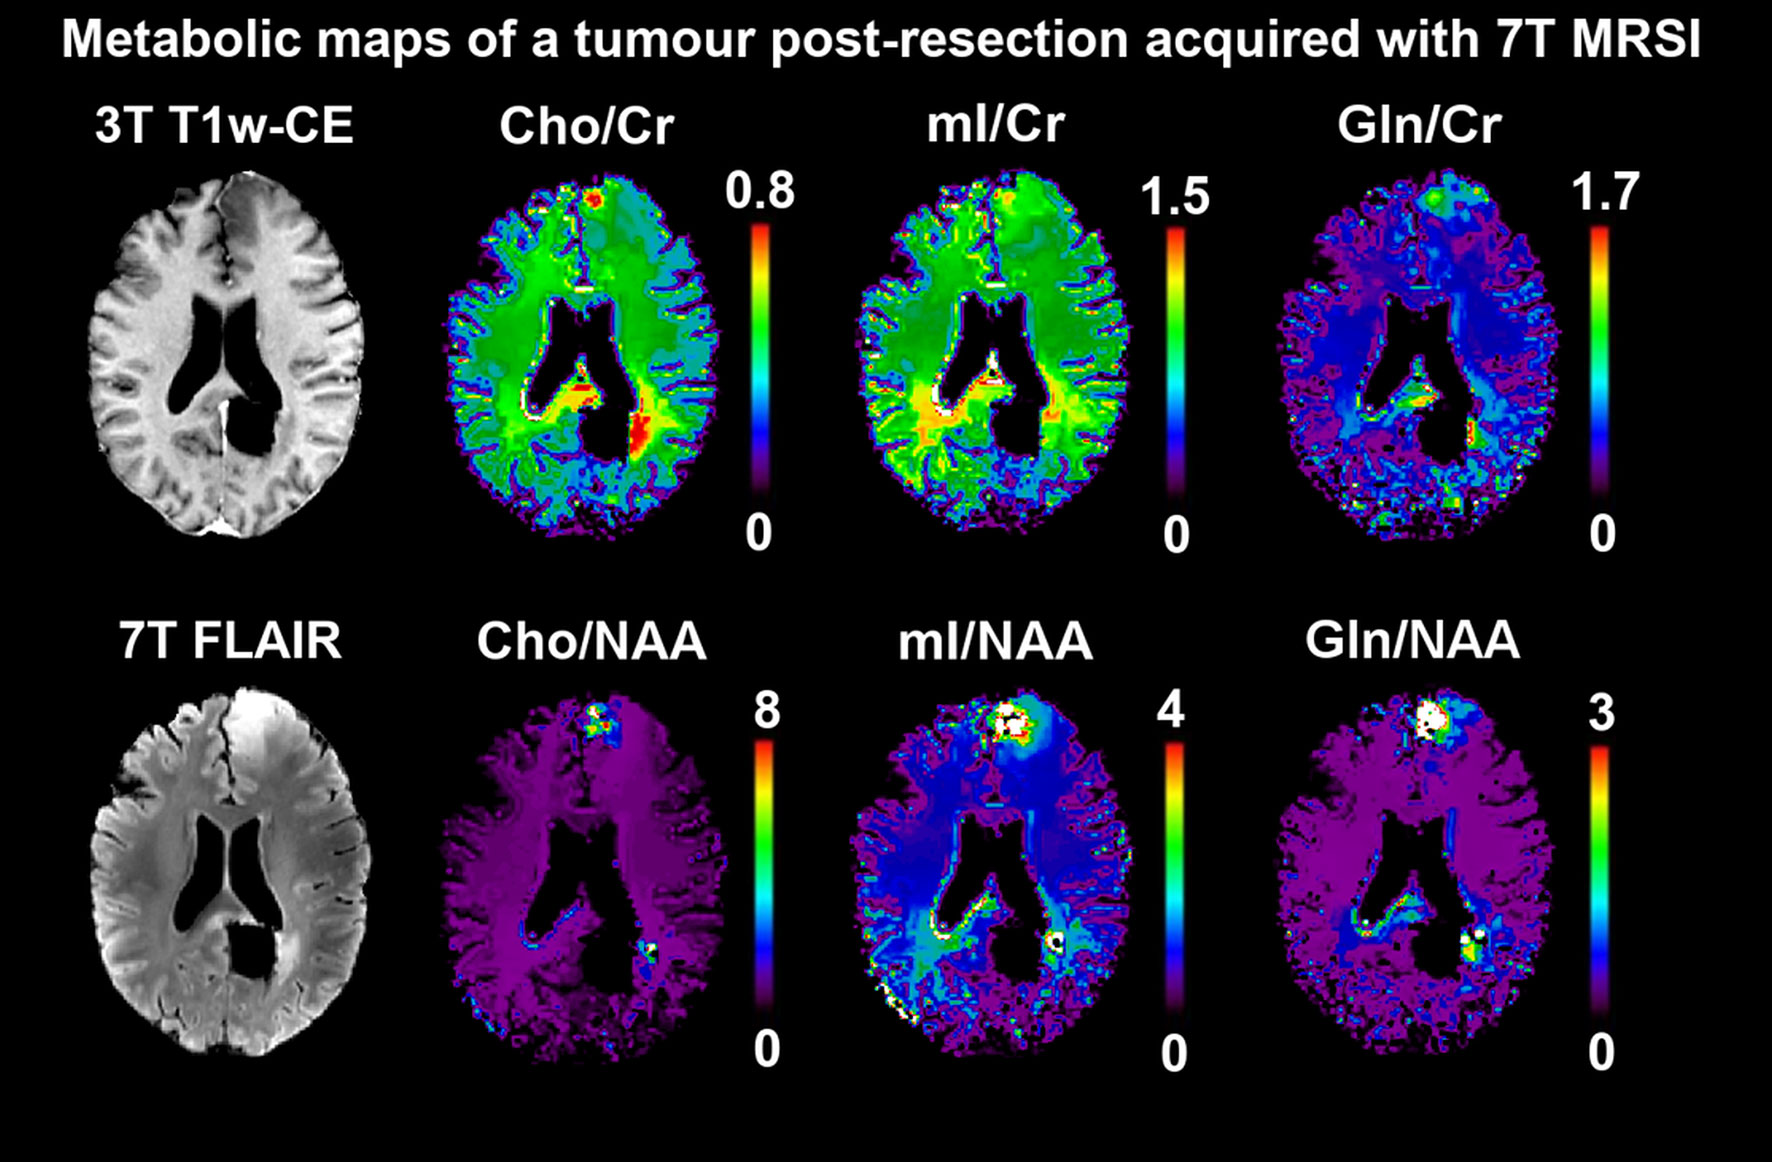
Figure 2 Postsurgical 7 T MRSI scan of a patient with oligodendroglioma, IDH-mutant, 1p/19q deleted, grade 3. Free induction decay-acquisition and patch-based super-resolution, 3.4 × 3.4 × 8 mm³ nominal resolution (7). The ratios of three metabolites (Cho, mI, Gln) to Cr and NAA as common references are mapped. Both in a left frontal second focus as well as around the primary focus resection cavity posterior to the splenium, increased ratios for all six are clearly discernible and relate to morphological findings. Specifically, for the Gln ratios, changes between normal-appearing brain tissues and suspected neoplastic growth are in the range of over a magnitude, making it an attractive potential biomarker, but will require ultra-high-field systems for quantification. Similar techniques could be applied for the spatial identification of neoplastic activity during therapy. Choline (Cho), Creatine (Cr), N-acetyl-aspartate (NAA), myo-Inositol (mI), glutamine (Gln).
Recently, the MRS community has tried to move forward and reach a standard consensus regarding MRS methodology developments of the last decade (8–11), but reproducibility studies have not been able to adequately reflect these recent discussions. In particular, multicenter reproducibility studies remain limited to only a few MRS applications (12, 13).
3.1.1.2 Evidence From Clinical Studies
The utility of MRS to distinguish recurrent tumors from radiation necrosis has been evaluated in two meta-analyses to date (Table 1). The first meta-analysis (23), comprising 13 studies, evaluated the diagnostic effectiveness of 1H MRS (both SVS and MRSI) in differentiating recurrent tumor from radiation necrosis. This study showed that the Cho/Cr and Cho/NAA ratios are higher in tumor recurrence compared with radiation necrosis (pooled difference: 0.77, 95% CI = 0.57 to 0.98 for Cho/Cr; pooled difference: 1.02, 95% CI = 0.03 to 2.0 for Cho/NAA). In another meta-analysis of 18 studies (20), the pooled sensitivity and specificity of Cho/Cr and Cho/NAA in discriminating recurrent glioma and radiation necrosis are reported to be between 80–90%. Therefore, the authors recommended using MRS as an add-on to the structural MRI.
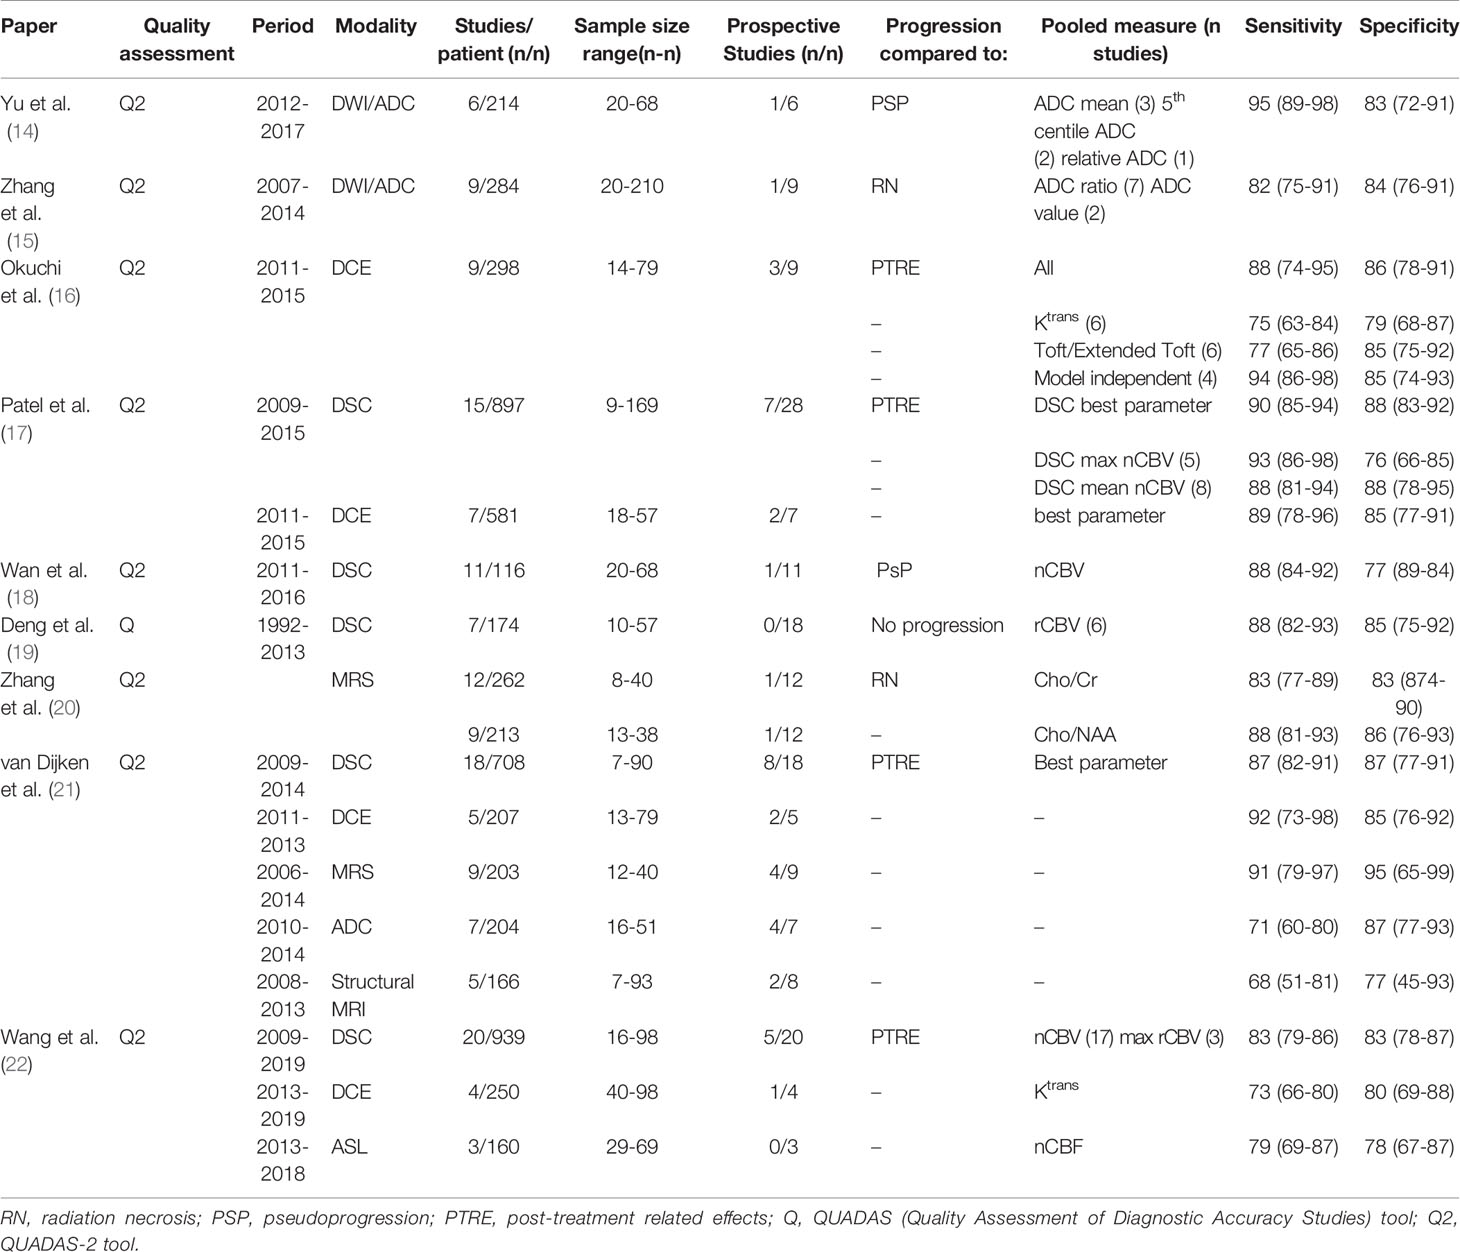
Table 1 Meta-analyses of advanced MRI treatment response monitoring biomarkers. Post-processing methodology meta-analyses are not included here, and are described in the relevant sections below.
In a meta-analysis comparing the diagnostic accuracy of anatomical and advanced MRI [i.e., apparent diffusion coefficient (ADC), dynamic susceptibility contrast-enhanced (DSC), dynamic contrast enhanced (DCE), arterial spin labeling (ASL), and 1H MRS (SVS and MRSI)] for treatment response assessment in high-grade gliomas, 1H MRS was found to have the highest diagnostic accuracy, with a sensitivity of 91% and specificity of 95%, among all the advanced MRI techniques (21). Various metabolite ratios were used in the MRS studies included in this meta-analysis, but in the majority of the studies Cho/Cr turned out to be the best predictor to differentiate true tumor progression from PTRE. It is noteworthy that in all of the studies above, no explicit description was given as to which part of the tumor (e.g. contrast-enhancing, T2-weighted hyperintense, or necrotic component) was assessed.
The utility of MRS to differentiate pseudoprogression from tumor recurrence is less well studied, but a few studies show its effectiveness. The potential of 3D MRSI was illustrated in a recent study using 3D echo planar spectroscopic imaging in glioblastoma patients (24). Here, Cho/NAA and Cho/Cr maps were co-registered to anatomical images and mapped on different regions of the neoplasm. Higher Cho/NAA and Cho/Cr ratios specifically in the contrast-enhancing part of the tumor were found in patients with tumor progression compared with patients with pseudoprogression, with a discriminatory accuracy of 94%. Similar results were found in another MRSI study where a threshold of Cho/NAA ≥ 1.3 in the contrast-enhancing part of the tumor was proposed to determine tumor recurrence (25).
3.1.1.3 Strengths and Weaknesses
The main strength of MRS techniques for in vivo tumor assessment is the ability to acquire an array of metabolic alterations in one measurement and the flexibility to optimize methods for specific targets of interest. The main limitations of SVS and, to a lesser extent MRSI, are the relatively large voxel size and poor spatial coverage (3). This can lead to partial volume effects between active tumor, treatment-induced changes, and necrosis, as well as the omission of potentially neoplastic tissues. Furthermore, scan time is typically long, artifacts from transcranial lipids or susceptibility differences reduce spectral fitting reliability, and extensive offline processing is usually required. Advanced acquisition techniques can address most of these limitations but require expert operators and tools, and have led to a multitude of published methodologies lacking direct comparability. Therefore, MRS often is not included in routine clinical protocols. Recent initiatives for consensus on MRS methodology and applications are expected to lead to a more “even playing field” and standardized approaches that will make future studies more comparable (9, 26, 27).
3.1.1.4 Future Developments
In most studies on PTRE, only the most prominent MRS peaks (i.e., NAA, Cho, and Cr) have been evaluated as these produce the most signal and are least affected by J-coupling under long echo times. The use of ultra-high field 1H MRS (i.e., ≥ 7 Tesla [T]) results in an increased signal-to-noise ratio and an improved ability to separate overlapping peaks (28). Applying 3D MRSI may overcome the barrier of incomplete tumor sampling in SVS, and this has motivated the development of fast and high-resolution spectroscopic imaging sequences (29). With this, additional markers for tumor proliferation and tumor metabolism, including glycine (Gly), Glu, and glutamine (Gln), can be evaluated unambiguously (30). Recently, it was shown in preoperative patients that metabolic differences between tumor regions and peritumoral tissue, beyond decreased NAA levels and elevated Cho levels, could be detected at 7 T (31). For example, high levels of Gln and Gly (which are difficult to separate from Glu and myo-inositol, respectively, at lower fields) were found within the tumor region, which may reflect cancer cell proliferation in the case of Gly and malignant metabolic changes for Gln. Whether these high-resolution 3D metabolite maps could aid in identifying PTRE is yet to be determined. There are high expectations for the application of machine-learning-driven classification of neoplastic tissues that could help to reach this goal (32).
A specific metabolite of interest is 2-hydroxyglutarate (2HG). 2HG is an oncometabolite, produced in glial tumor cells bearing an isocitrate dehydrogenase (IDH) gene mutation, either IDH1 or IDH2. The discovery that 2HG can be detected in vivo by dedicated MRS sequences has led to several successful studies showing the ability to determine IDH status noninvasively by MRS (33). Additionally, a potential role for 2HG MRS has been proposed in treatment response imaging. In patients with IDH-mutant tumors, 2HG levels decrease following adjuvant radiation and chemotherapy (34, 35) and increase in the case of tumor progression (35). Furthermore, monitoring 2HG levels could be of specific interest in evaluating the effects of IDH-inhibitors, as was shown in a phase 1 clinical trial (36).
Although 1H MRS gives insight into steady-state metabolite concentrations, protons are not the only nuclei with resonances of interest. Techniques using other nuclei can be used such as 31P MRS and MRSI (37), deuterium metabolic imaging (DMI), and (hyperpolarized) 13C MRS and MRSI, which enable the evaluation of tissue metabolism in vivo (Figure 3). For example, 31P-MRSI has been applied to the imaging of inter- and intracellular pH in gliomas, finding increased pH values both at 7 T (37) and 9.4 T (38) in proof-of-concept studies.
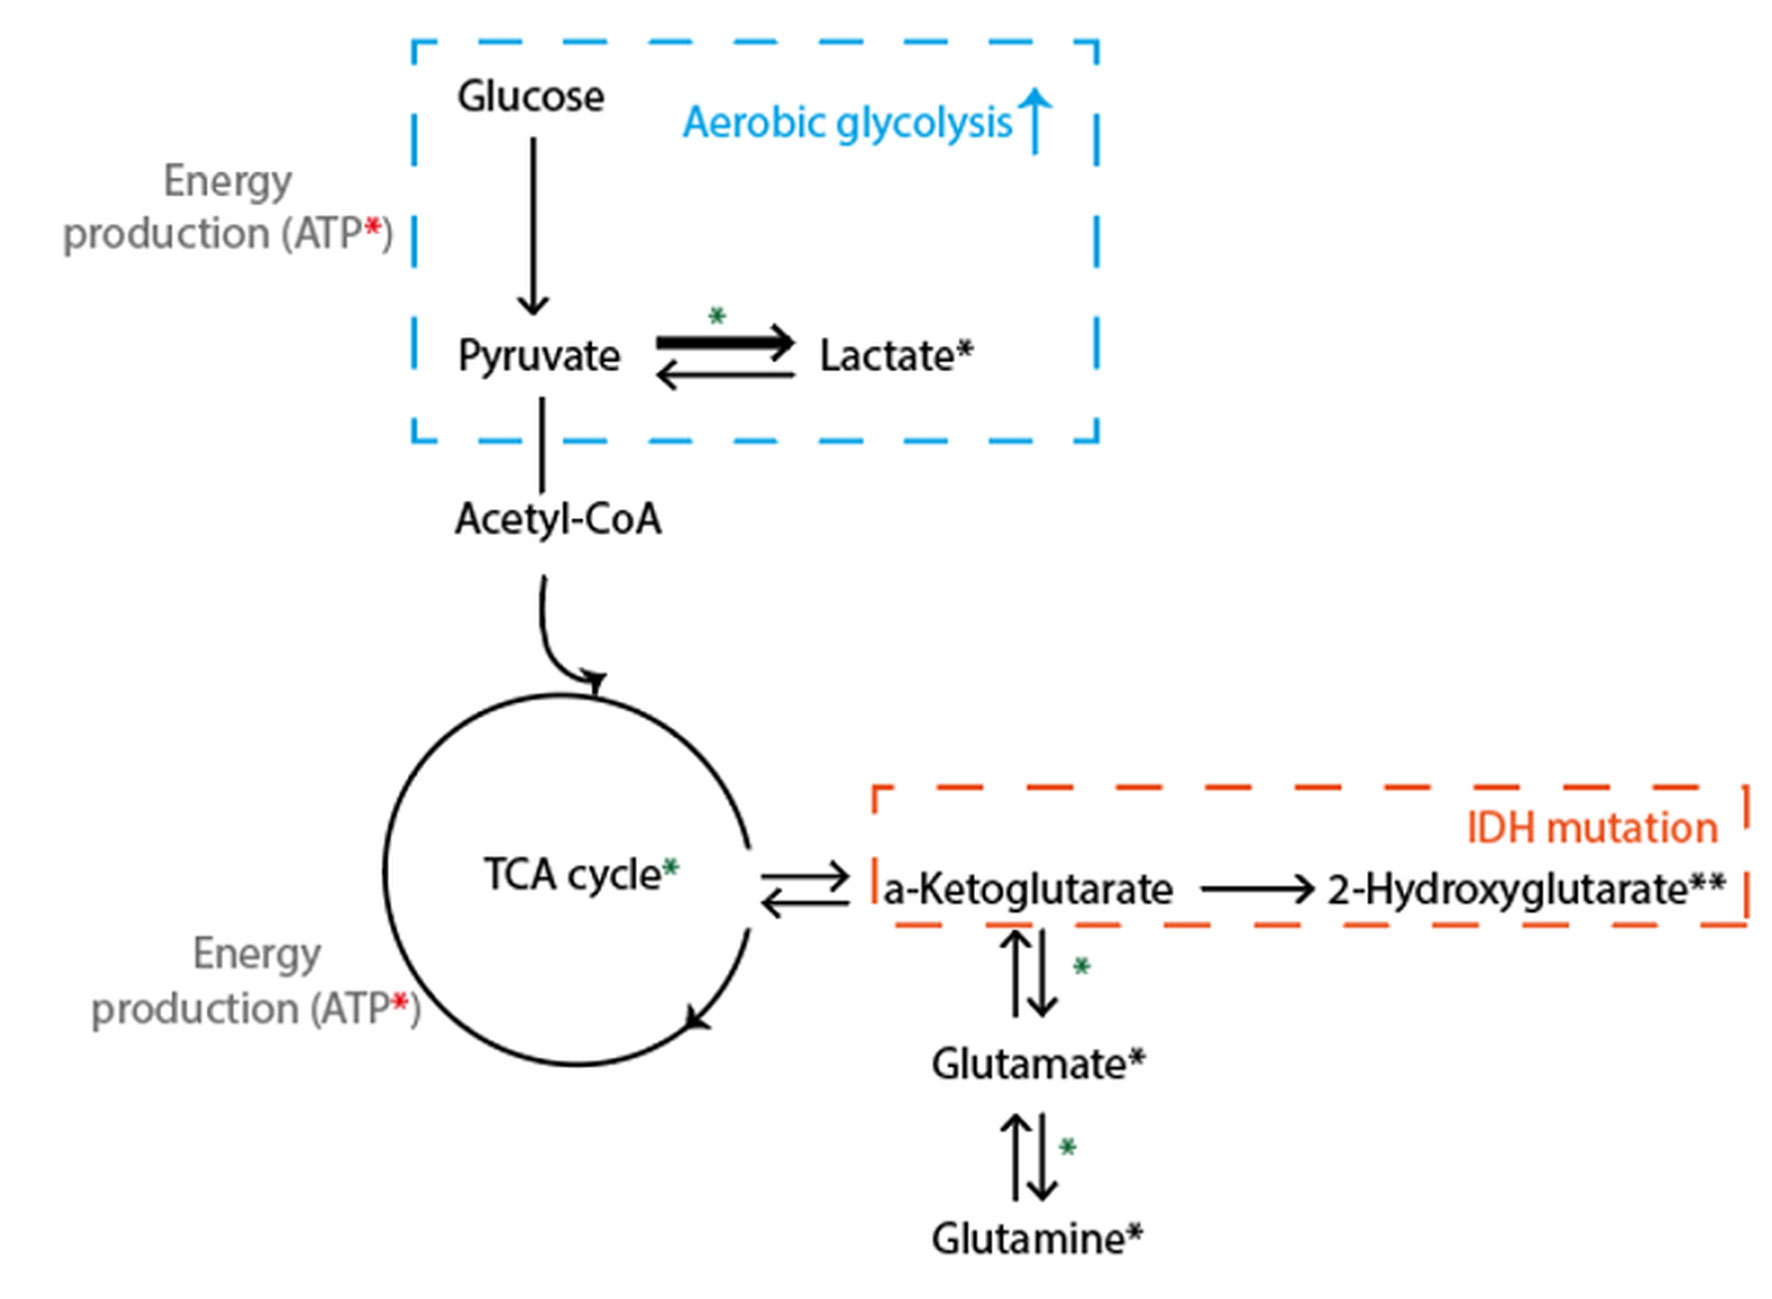
Figure 3 Simplified schematic illustration of key metabolic pathways probed with spectroscopy. Glu (from brain-feeding arteries) is taken up by tumor cells and converted into pyruvate, which enters the tricarboxylic acid cycle and undergoes oxidative metabolism, for the production of energy (ATP). 1H MRS visible metabolites are marked with a black *, where ** denotes that a dedicated MRS sequence is needed. Green *: includes pathways visible with 13C or DMI. Red *: visible with 31P MRS. Adenosine triphosphate (ATP), Glucose (Glu).
These techniques can be used to detect different sets of molecules important to tumor metabolism, such as glucose or ATP, and there is the potential for deriving enzyme activity or acidity. Currently, these techniques are used mainly in a research setting but are potentially promising for distinguishing PTRE, as metabolic reprogramming is one the hallmarks of cancer. For example, it was shown that DMI can be used to visualize tumor tissue metabolism beyond glucose uptake and, thus, map the Warburg effect, which is typically only seen in active tumor cells (39). As such, DMI may be potentially useful to differentiate between treatment-induced necrosis and tumor progression.
3.1.2 Chemical Exchange Saturation Transfer
3.1.2.1 Methodology
Chemical exchange saturation transfer (CEST) MRI is a technique in which labile protons on endogenous proteins can be selectively targeted to generate contrast (40). In a typical CEST examination in patient studies at 3 T, B1 saturation pulses are used with a range of off-resonance frequencies centered around on-resonance B1 saturation pulses to generate a Z-spectrum. Labile protons that are bound to mobile proteins are hereby saturated and will lead to saturation of the free water pool when exchanging with the free water protons, depending on their abundance and exchange rate. Endogenous CEST effects that can be targeted include saturation transfer of protons in amide (3.5 ppm), amine (3 ppm), total creatine (Cre) (2 ppm), and hydroxyl (0.9 ppm) bonds. Additional effects of application of off-resonance saturation pulses that will be present within Z-spectra include broad magnetization transfer (MT) effects in semisolid macromolecules, relayed nuclear Overhauser enhancement (NOE) in mobile macromolecules (−1 to −4 ppm) (41), and direct saturation of free water protons (i.e. spillover effect) (42). Note that, in particular at 3 T due to broad spectral linewidths, these effects are either close to or even overlapping with the endogenous CEST effects that are often the target of CEST studies. Several approaches exist to best isolate all of the above effects, such that the CEST effect of interest can be measured. For instance, increasing main magnetic field strength, e.g. using 7 T instead of 3 T systems, aids in separation of all of these effects because it leads to decreased spectral linewidths of the individual effects. Optimizing duration and power of B1 saturation pulses can be used to sensitize CEST experiments to protons exchanging with different rates. Analysis approaches include magnetization transfer ratio asymmetry (MTRasym) (43), in which signals with off-resonance frequencies with matching positive and negative shift around 0 ppm are subtracted from one another (Figure 4), and multiple pool fitting approaches of the Z-spectrum which are used to explicitly isolate individual contributions, such as the NOE, spillover and broad magnetization transfer effects (41, 44). Additionally, a range of methodologies accounts for changes in parameters that will affect the CEST contrast generated. These include additional acquisitions and/or analysis to correct for inhomogeneities in the main magnetic (B0) (45) and saturation (B1) (46) field, or a change in the T1 (47).
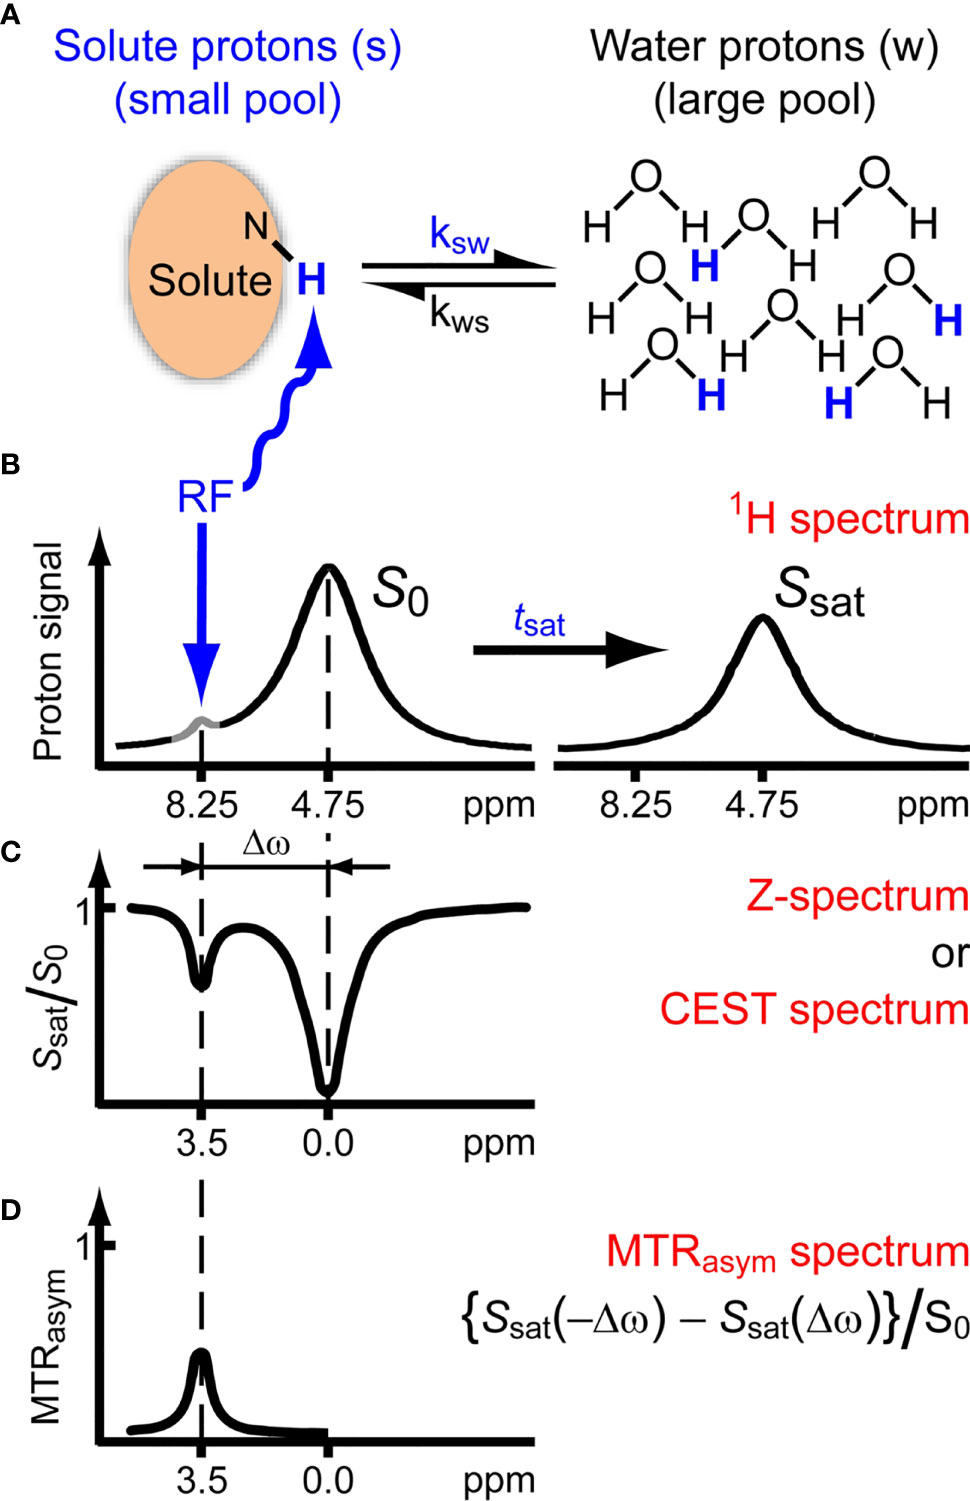
Figure 4 Chemical exchange saturation transfer. (A, B) Solute protons (blue) are saturated at their specific resonance frequency in the proton spectrum (here 8.25 ppm for amide protons). This saturation is transferred to water (4.75 ppm) with exchange rate ksw and non-saturated protons (black) return. After a saturation period (tsat), this effect becomes visible on the water signal (B, right). (C) The Z-spectrum, showing normalized water saturation (Ssat/S0) as a function of irradiation frequency. When irradiating the water protons at 4.75 ppm, the signal disappears due to direct (water) saturation. This frequency is assigned to 0 ppm in Z-spectra. At short saturation times, only this direct saturation is apparent. At longer tsat, the CEST effect becomes visible at the frequency of the low-concentration exchangeable solute protons, now visible at 8.25 – 4.75 = 3.5 ppm in the Z-spectrum. (D) Result of MTRasym analysis of the Z-spectrum with respect to the water frequency to remove the effect of direct saturation. Image adapted with permission from (42).
A full overview of CEST MRI acquisition and analysis approaches is beyond the scope of the current review and has been given previously (40). However, in using CEST MRI for brain tumor imaging some confounding factors do require explicit attention. For example, the T1 relaxation time of the free water pool and the broad MT effect both directly affect the measured signal in CEST studies. In brain tumors, the T1 relaxation time is often found to be increased compared to healthy white matter, which is generally attributed to increased tissue water content (48), while changes in macromolecular background in tumor tissue are thought to be the cause for commonly found decreases in MT in brain tumors (49–51). Additionally, B1 saturation powers mostly used in CEST brain tumor studies are relatively low (< 2 µT), giving rise to strong NOE effects (41). However, NOE is known to change in brain tumors as well (52). The above highlights the difficulty of isolating the individual components contributing to CEST contrast and that care should be taken when changes in CEST contrasts are attributed to underlying physiological processes. This is an important aspect to keep in mind when reviewing the latest research in applications of CEST MRI to find biomarkers of treatment response in high-grade glioma.
Currently, imaging guidelines are not available (although in preparation). Some technical validation has been performed in healthy subjects in 7 T systems (53).
3.1.2.2 Evidence From Clinical Studies
Amide proton transfer (APT)-weighted CEST is the most investigated CEST technique to derive biomarkers of treatment response. In 2011, it was first shown in preclinical models that the APT-weighted signal of lesions immediately decreases when radiation necrosis occurs (in five animals) (54) or after treatment with temozolomide (five controls, six treated) (55). Increased APT-weighted signal within the lesion after treatment was thought to be indicative of increased cell proliferation in tumor progression, a hypothesis supported by a positive correlation between APT-weighted CEST and Ki67, an immunohistochemical marker of cell proliferation. This correlation has since been reproduced in human gliomas (56) and has led to the first results of increased APT-weighted CEST contrast after treatment to be associated with tumor progression rather than PTRE. However, the application of CEST MRI to differentiate tumor progression from PTRE is a relatively recent development, which has led to only a handful of clinical studies on this topic (see Table S1). Two research groups (57, 58) have found that in small cohorts of patients diagnosed with glioblastoma and scanned after chemoradiotherapy or radiotherapy alone, APT-weighted CEST improved differentiation of tumor response from PTRE compared with conventional imaging alone (with a combination of perfusion-weighted and APT-weighted CEST giving the best differentiation). An example of this is presented in Figure 5. One of these research groups showed that in even smaller cohorts, APT-weighted CEST outperformed 1H MRS (59) and methionine positron emission tomography (PET) (60) at determining tumor progression. Retrospectively comparing APT-weighted CEST with diffusion and perfusion MRI biomarkers also indicated the added value of CEST to elucidate tumor progression in 36 glioblastoma patients treated with chemoradiotherapy or radiotherapy in a recent work (61). In another recent study where APT-weighted CEST was obtained in 32 patients within three months after treatment, increased APT-weighted CEST was seen in tumor progression with radiological confirmation after six months of follow-up (62). Moreover, in a previous, prospective study (50) 19 glioblastoma patients were systematically scanned before, during, and after chemoradiotherapy and an increase in APT-weighted CEST was shown to differentiate progressors from non-progressors as early as two weeks into treatment.
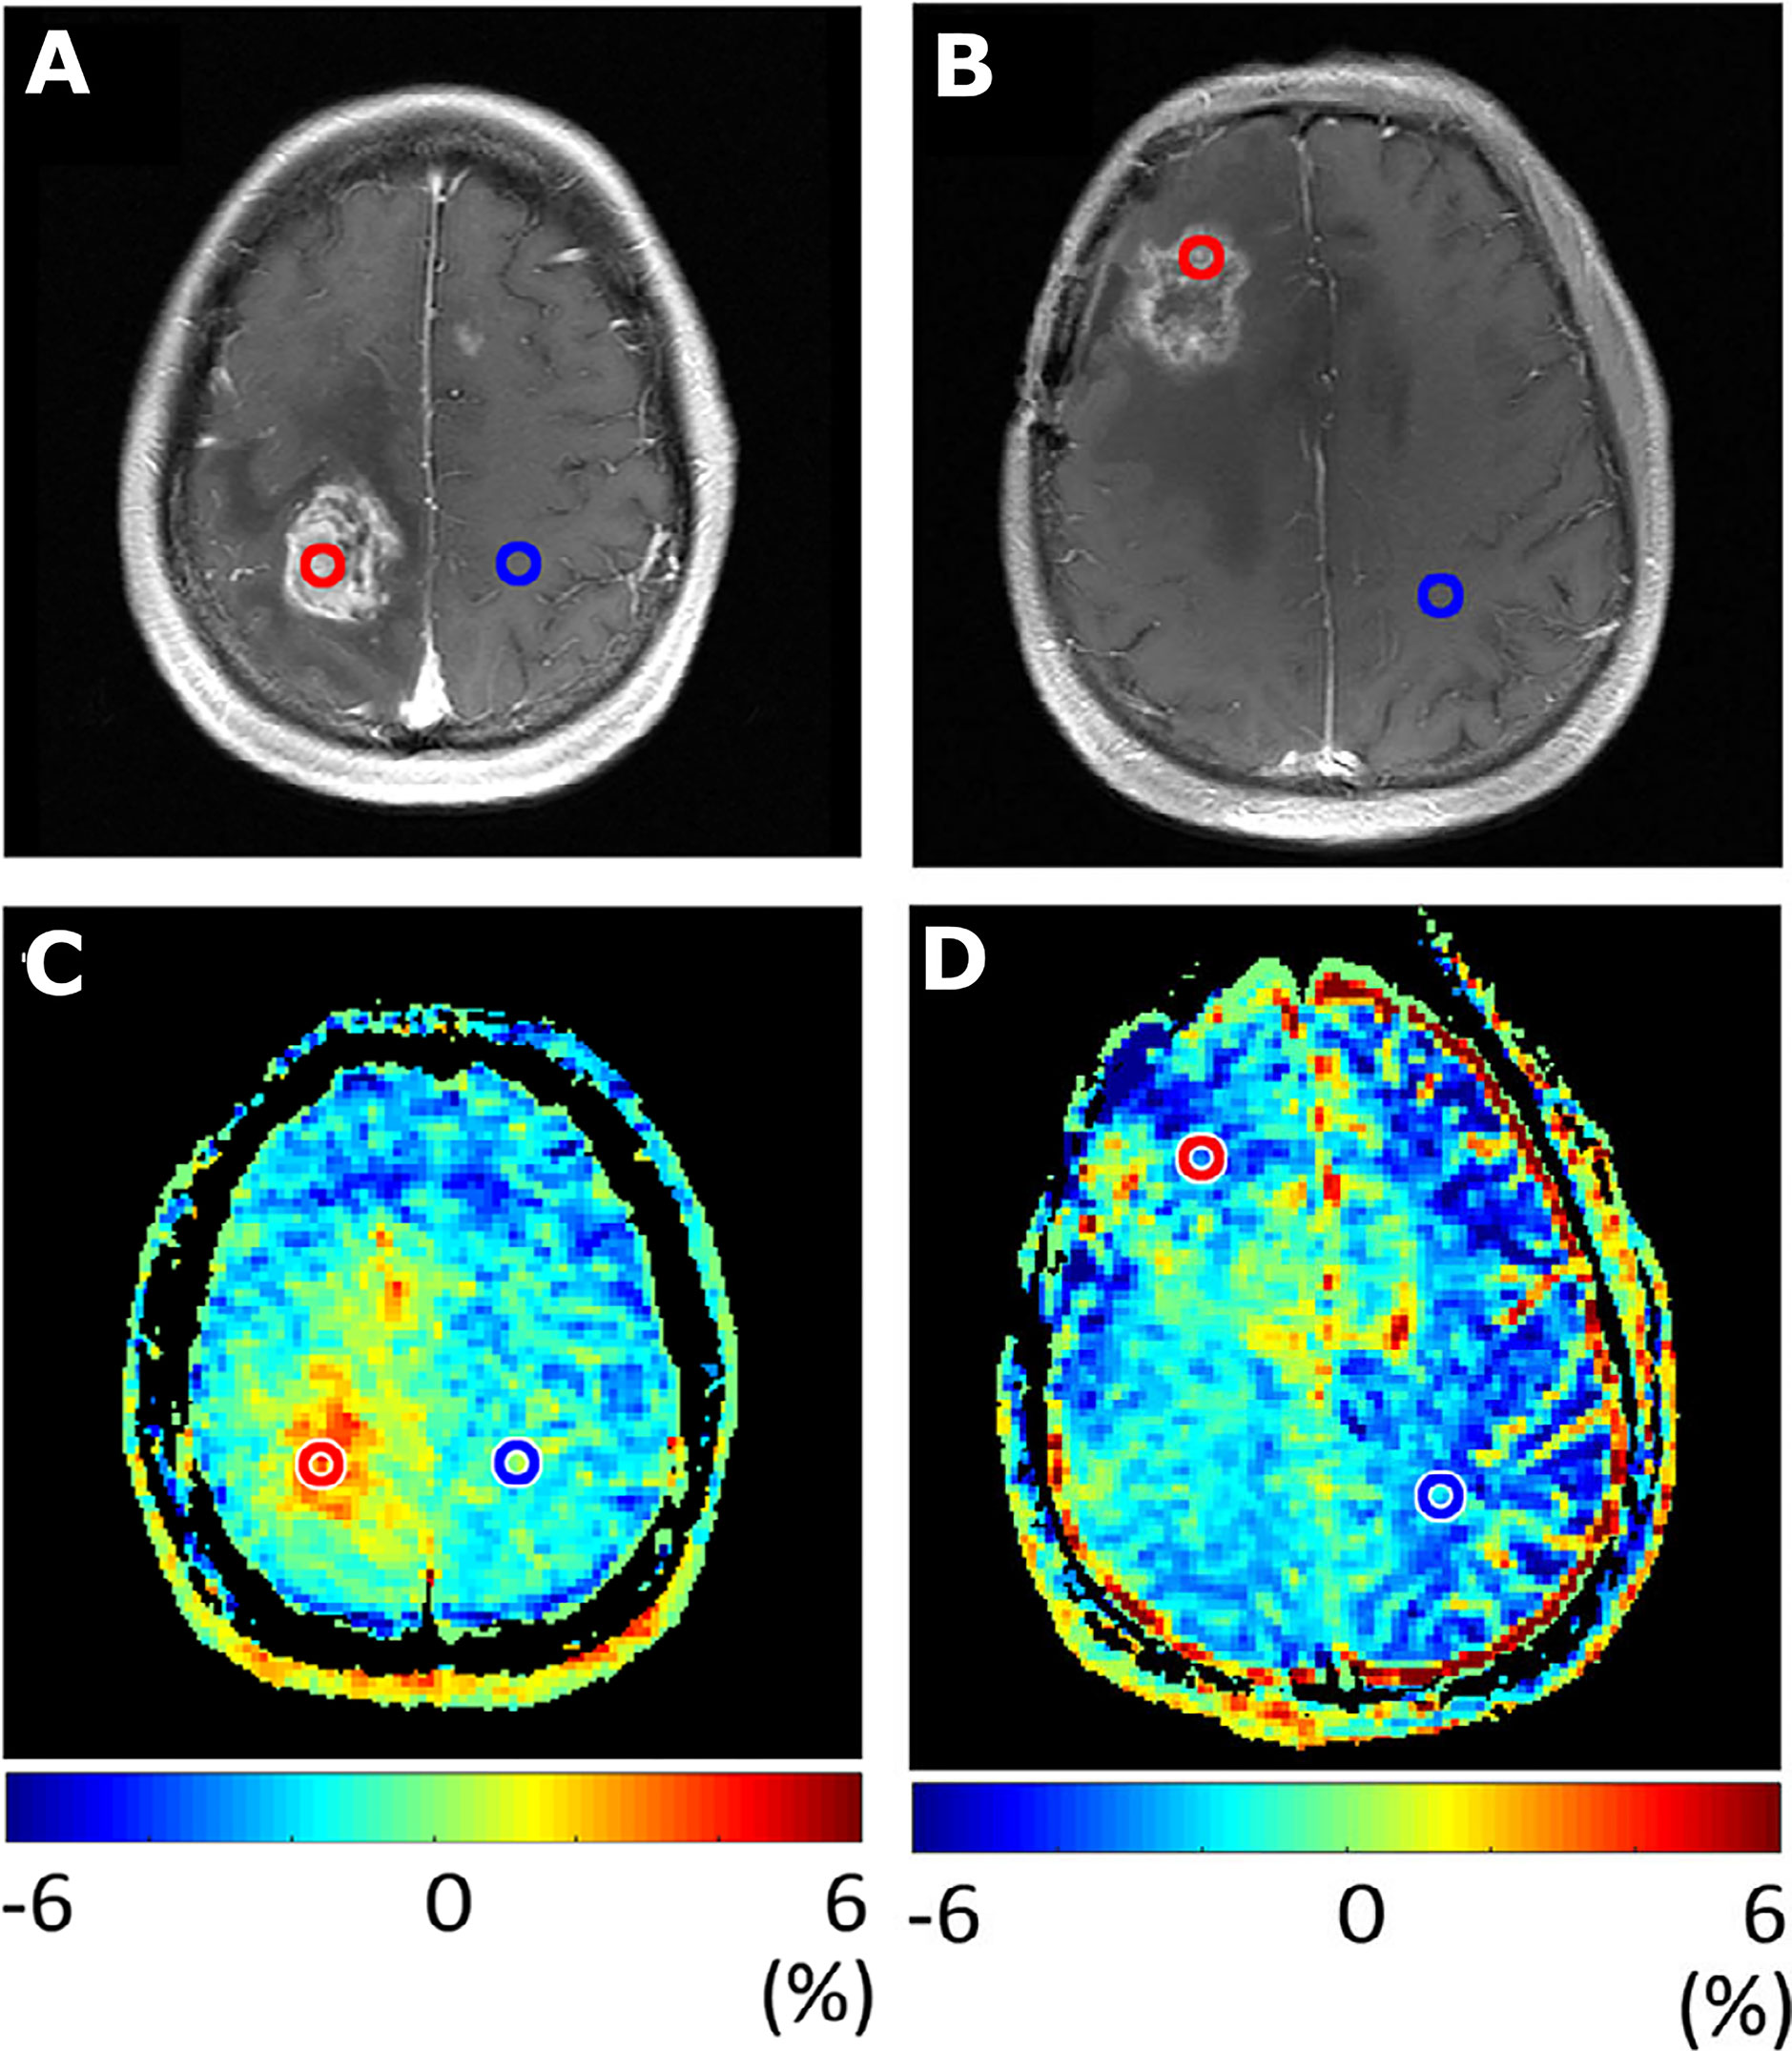
Figure 5 Images illustrating APT-weighted imaging (MTRasym at 3.5 ppm) in two patients after treatment with radiotherapy. Contrast enhancement on T1-weighted images was seen in patient 1, 62 months after radiotherapy treatment and resection for grade 2 astrocytoma (A). The additional increased MTRasym in the same patient (C) illustrates tumor recurrence, which was confirmed as grade 4 glioblastoma after repeat surgery. Contrast enhancement on T1-weighted images was seen in patient 2, 14 months after chemoradiotherapy of grade 3 astrocytoma, with regional anaplastic oligodendroglioma (B). The additional MTRasym in patient 2 (D) illustrates low values, indicating treatment effect, which was confirmed as radiation necrosis with histopathology after repeat surgery. Image adapted with permission from (58).
Although the above-referenced studies illustrate clinical findings of elevated APT-weighted CEST at 3 T by several research groups, recent work (63) did not find elevated APT-weighted CEST to be correlated to tumor progression in 12 glioblastoma patients scanned at 7 T. However, when these authors used a combination of image acquisition and analysis aimed at isolating the APT signal from the upfield relayed-nuclear Overhauser enhancement effects, they found that changes in the latter were able to differentiate tumor progression from PTRE. In line with this are the results of prospective studies (64, 65), where patients were scanned with CEST MRI at 7 T before treatment and APT was isolated from NOE effects. This showed that CEST contrasts before treatment are significantly correlated to overall and progression free survival (i.e., a prognostic biomarker). Taken together, these ultra-high field studies highlight the potential of CEST MRI to be used as a prognostic and monitoring biomarker candidate for treatment response assessment, although the different contrasts used indicate yet again that, although CEST contrasts can certainly differentiate active tumor tissue from PTRE, the exact mechanisms causing these contrasts remain to be elucidated.
Other studies optimize CEST image acquisition to be pH-weighted by including (66) or focusing on (67) amine proton exchange, which is thought to be more sensitive to pH changes than cell proliferation. Preclinical work (68) has shown that pH-weighted CEST contrast increases when intracellular pH decreases (i.e., becomes more acidic) in glioblastoma due to chemotherapy. Furthermore, clinical proof-of-concept of using pH-weighted CEST to assess treatment response has been demonstrated in patients after anti-angiogenic treatment (69) and patients treated with combined chemoradiotherapy (70).
3.1.2.3 Strengths and Weaknesses
A strength of CEST MRI for clinical diagnostics in tumor imaging is that those contrasts most explored for tumor imaging arise from endogenous markers and, therefore, no contrast agents are required. Additionally, the process of exchange inherently increases the signal-to-noise ratio of CEST imaging compared with MRS, which allows for a smaller voxel size to be used to probe heterogeneous tissues/pathologies, such as tumors. With these strengths, the potential of CEST MRI to improve differentiation of tumor progression from PTRE is clear. However, weaknesses include the multitude of options to acquire and analyze CEST MRI data, the variation in the timing of CEST MRI included during treatment, the retrospective nature of some of the current clinical studies investigating APT-weighted CEST for tumor treatment response, and the small number of patients in the above-referenced studies. These weaknesses currently prevent a definitive summary of this imaging technique for treatment response assessment, in terms of indications for when to measure and which threshold values to use to separate tumor progression from PTRE.
3.1.2.4 Future Developments
To develop the application of CEST MRI for differentiation of treatment effects and tumor progression, a consensus from all relevant stakeholders regarding image acquisition and analysis is required to enable multicenter and multi-vendor trials. This is an area of active research, where a working group of international CEST experts is working toward an open source consensus CEST acquisition and analysis protocol (71).
3.1.3 Emerging MRI Techniques
There are several emerging techniques that may be shown to be monitoring biomarkers in future proof-of-concept studies. Here, we focus on some studies where proof-of-concept has already been shown.
3.1.3.1 Vascular Architecture Mapping and Oxygenation Imaging
Vessel caliber imaging, or vessel architecture mapping, is based on the fact that when a contrast agent passes through the vasculature and perturbs the local magnetic field, MRI signal from a gradient echo readout is sensitive to large arteries and capillaries, while with a spin echo readout signal is mostly sensitive to capillaries (72). Vessel architecture imaging hereby refers to the modelling framework that aims to assess subvoxel microvascular parameters, such as vessel density and vessel diameter, where vasculature with diameters < 200 µm are targeted (73). This imaging approach is included in recent “tumor microenvironment mapping,” which combines vessel architecture imaging with oxygen metabolism imaging, i.e., measurement of the oxygen extraction fraction with quantitative blood oxygenation level dependent imaging. One study allowed five different tissue types within tumors to be identified (necrosis, hypoxia with/without neovascularization, oxidative phosphorylation, and glycolysis) (74). In 21 tumors scanned pre- and post-treatment, a change in the presence of these five metabolic profiles demonstrated recurrent glioblastoma. Although these results are still very preliminary, this proof-of-concept work shows the potential of this emerging technique to become a future monitoring biomarker.
3.1.3.2 Non-Proton MRI Techniques
Sodium (23Na) imaging has established itself in MRI research due to the diverse role of sodium ions in tissue homeostasis (75). Unlike other non-proton techniques such as 31P and 13C, the 23Na signal does not yield a metabolite spectrum, but only a single resonance in most environments such as human tissue (76). Therefore, imaging (as opposed to spectroscopy) is almost exclusively performed for 23Na.
Although 23Na MRI has been performed successfully in brain cancers since the late 1980s (77), more recent publications have shown its benefit in predicting IDH mutation status and tumor progression (78). Sodium concentration mapping has been performed in recurrent glioblastoma after radiotherapy (79) and also chemoradiotherapy (80). The authors of the former case report showed that the 23Na images provided similar information as those contained in [18F]fluoro-ethyl-tyrosine (FET) PET images and postulate that 23Na images may therefore be able to provide a substitute for PET in MRI-only examination settings (79). Similarly, the authors of the second study noted that the 23Na images were sensitive to “real-time” changes in treatment volume that could be used to alter the course of treatment early on (80). Most recently, a study investigated whether whole tumor (excluding necrosis) measured immediately after chemotherapy with a follow-up 6 weeks later could predict stable or progressive disease, but did not find any significant correlations either with treatment response or overall survival (81). As with the other emerging techniques, 23Na imaging is best considered as a proof-of-concept technique that may prove to be a future monitoring biomarker.
3.2 Advanced Handling of MRI Data
3.2.1 Multiparametric Imaging
3.2.1.1 Multiparametric Advanced MRI
The combination of multiple modalities may be of value for tissue characterization and help differentiate tumor from PTRE by providing complementary information of tumor biology and thus overcome limitations of individual techniques.
3.2.1.2 Evidence From Clinical Studies
A meta-analysis (82) of seven studies of multiparametric MRI (at least two of the following advanced MRI techniques: diffusion tensor imaging (DTI), diffusion-weighted imaging (DWI), DSC, DCE, ASL, and MRS) in patients with suspected pseudoprogression showed a pooled sensitivity and specificity of 84% and 95%, respectively, but the authors noted that the accuracy of multiparametric imaging was not different from that of monoparametric imaging determined in a meta-analysis of individual techniques (21). Table S2 shows results of studies reporting separate and combined diagnostic performance of ≥ 2 parameters (e.g., PET, DWI, DSC, or MRS). The studies generally showed improved diagnostic accuracy when combining modalities, although the added value may be marginal when compared with the best performing single modality. Combined sensitivity and specificity may even be lower when compared with the single modality that has the highest sensitivity or specificity.
3.2.1.3 Strengths and Weaknesses
The main advantage of multiparametric imaging is related to reducing both false positive and false negative results of single modalities, either by providing complementary information on biology (e.g., perfusion and metabolism) or compensating for technical limitations of one modality (e.g., limited coverage of DSC in the presence of susceptibility artifacts). Interpreting advanced multiparametric data routinely in the clinic, however, may be difficult and time consuming due to the amount and complexity of data processing and integration. Figure 6 illustrates the complexity of multiparametric imaging. Such a challenge may be particularly true for methods requiring longitudinal data such as relative cerebral blood volume and ADC parametric response maps combinations, which appear promising in determining treatment response (84). A further limitation is, as this review has shown, a paucity of high-level evidence for individual modalities especially relating to established frameworks for technical and clinical use as well as clear thresholds with understood confidence intervals to give a robust radiological outcome; therefore, combinations of individual modalities might compound error or lead to increased uncertainty of outcome.
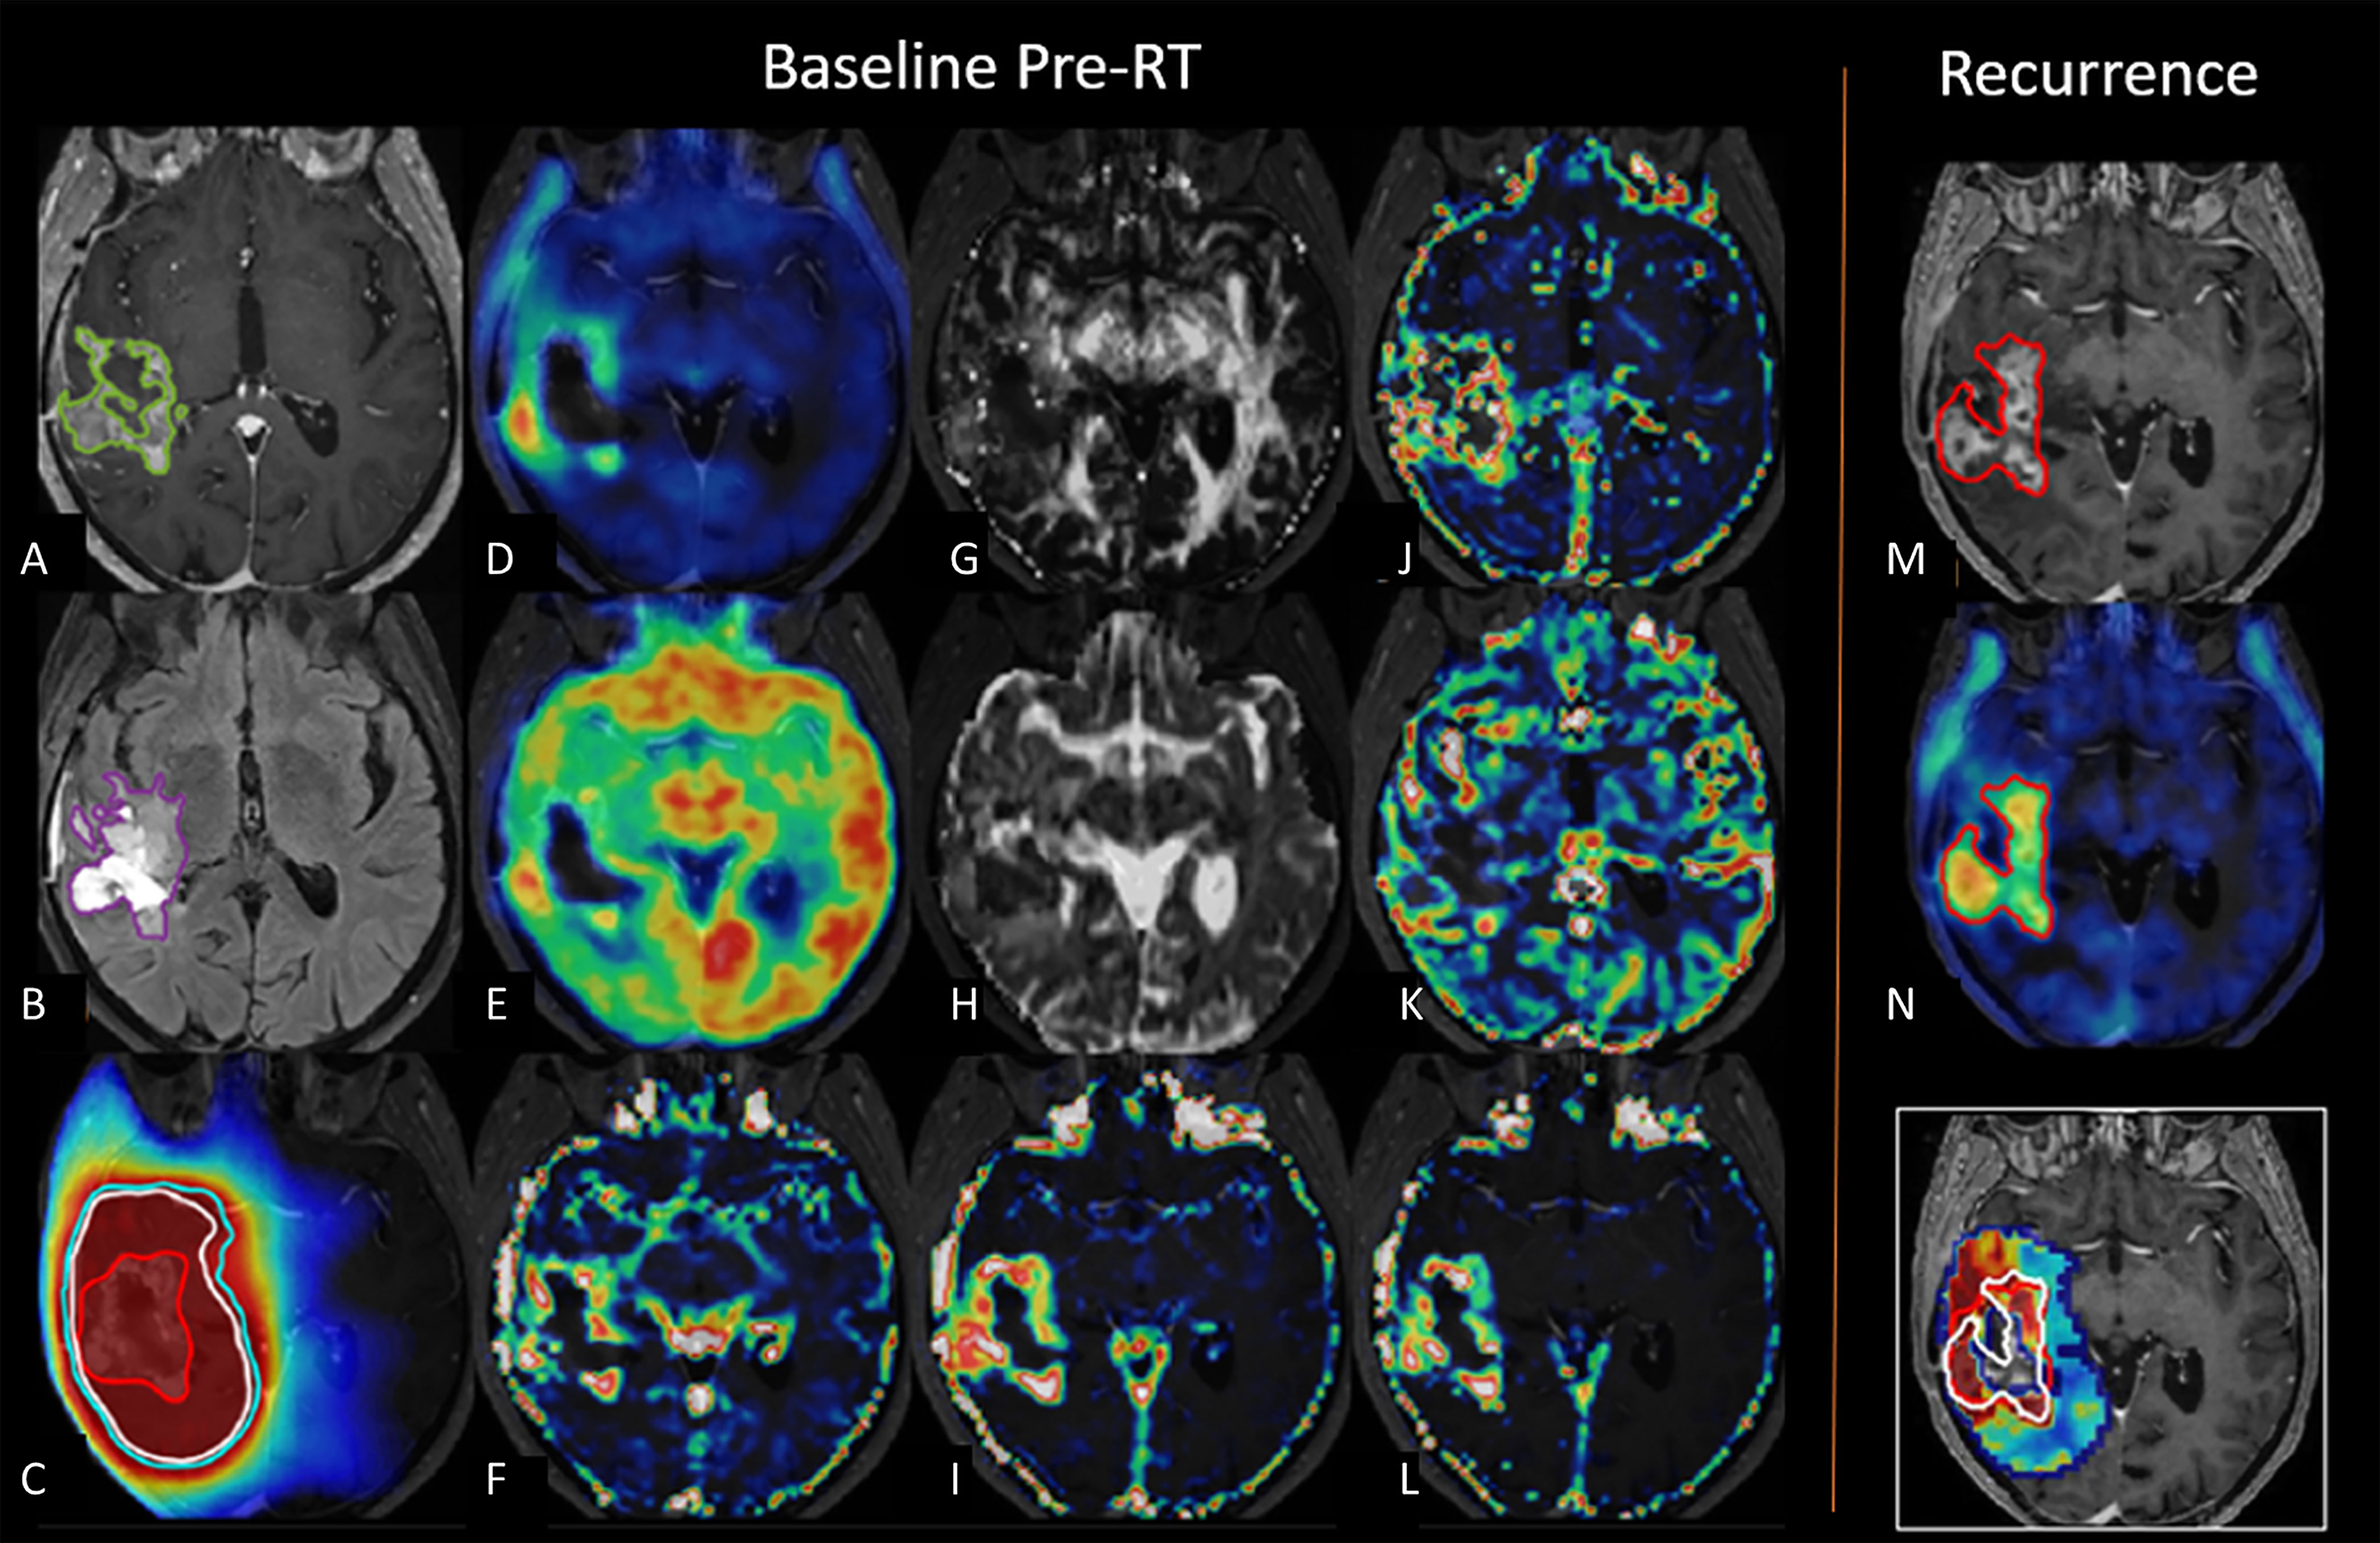
Figure 6 Multiparametric imaging. Example of multiparametric imaging for prediction of tumor recurrence. Baseline images prior to radiotherapy in a patient with glioblastoma show contrast-enhancing lesion (green) on (A) post-contrast T1-weighted images, (B) non-enhancing volumes (purple) on T2 fluid attenuated inversion recovery, (C) radiotherapy dose plan with gross tumor volume (red), clinical target volume (white), and planning target volume (cyan), (D) [18F]FET PET, (E) [18F]FDG PET, (F) DCE blood volume, (G) DTI fractional anisotropy, (H) DTI mean diffusivity, (I) DCE extravascular extra-cellular volume, (J) DCE mean transit time, (K) DCE blood flow, (L) DCE permeability. Follow-up imaging shows recurrent tumor in red on (M) post-contrast T1-weighted images and (N) [18F]FET PET imaging. Lower right image shows recurrence probability map superimposed on radiotherapy dose plan gross tumor volume (red) and actual recurrence boundary (white). Adapted with permission from (83).
3.2.1.4 Future Developments
One key area of development is to determine which modalities and parameters should be analyzed and integrated to give a clinically useful single diagnostic measure. One simple approach is to apply a scoring system, where each modality is rated as positive or negative, and the number of positive markers is added to a total score. One early study combining ASL, DCE, DSC, and MRS found that a score of ≥ 2 yielded a specificity of 94% as opposed to 77–84% for single modalities (85). To take into account lesion heterogeneity, one study of pseudoprgression compared to true progression applied scoring of different tumor components identified by automated voxel-based multiparametric clustering, resulting in final volume-weighted scores of the entire lesion. Applying this method in an independent test set, 87–89% of the lesions were correctly classified using the summed cluster score, compared with 76–83% using single modalities (86).
Others have applied machine learning approaches (described in more detail below) for automated voxel-wise classification of recurrence or pseudoprogression based on structural MRI, DSC, and ADC (87), or by providing maps predicting voxels where there will be downstream tumor progression (i.e., prognostic biomarkers) based on one-off multiparametric imaging prior to surgery (88) or radiotherapy (83), or through observing temporal changes in the images over time (89). A recent systematic review concluded that the integration of machine learning with multiparametric data was promising for visualization of diffusely infiltrating tumor cells before and after treatment. The review also concluded that because study cohorts are small, further studies are required to determine optimal methodology, and there is a need for larger cohorts to improve model performance (90). An advantage of machine learning is that wide data can be handled relatively easily (91) which might allow the wide spectrum of advanced imaging signatures to be captured together and thereby improve performance accuracy. However, to reiterate, a disadvantage when compared to a single modality approach is that combinations of outputs from individual modalities that are without frameworks for technical and clinical use, might compound inter-center variability and reduce generalizability considerably.
3.2.1.5 PET/MRI
PET is increasingly being used in the management of brain tumors as an adjunct to MRI. Table 2 provides an overview of the most frequently applied (or methodologically relevant) PET tracers in gliomas, grouped according to the mechanism of uptake. PET data is most frequently obtained on standalone PET/computed tomography systems and then fused to MRI, but hybrid PET/MRI systems have the advantage of allowing the simultaneous acquisition of PET and both advanced and conventional MRI within a single imaging session. Among the available tracers, only the amino acid tracers, such as [18F]fluoro-ethyl-tyrosine (FET), and the glucose analogue [18F]fluoro-deoxy-glucose (FDG) PET have been included in joint European Association of Nuclear Medicine/European Association of Neuro-Oncology (EANO) guidelines (98, 99). Amino acid tracers are generally preferred over FDG due to more specific tumor uptake (as illustrated in Figure 6). Repeatability of amino acid PET using [18F]FET has been investigated in animal models only (100). Because the main variability of PET imaging is related to the tracer and less so to the site or scanner, vendor-site-related differences are expected to be minor when consensus guidelines are followed, and PET tracers have been applied reliably in multicenter studies (101, 102).
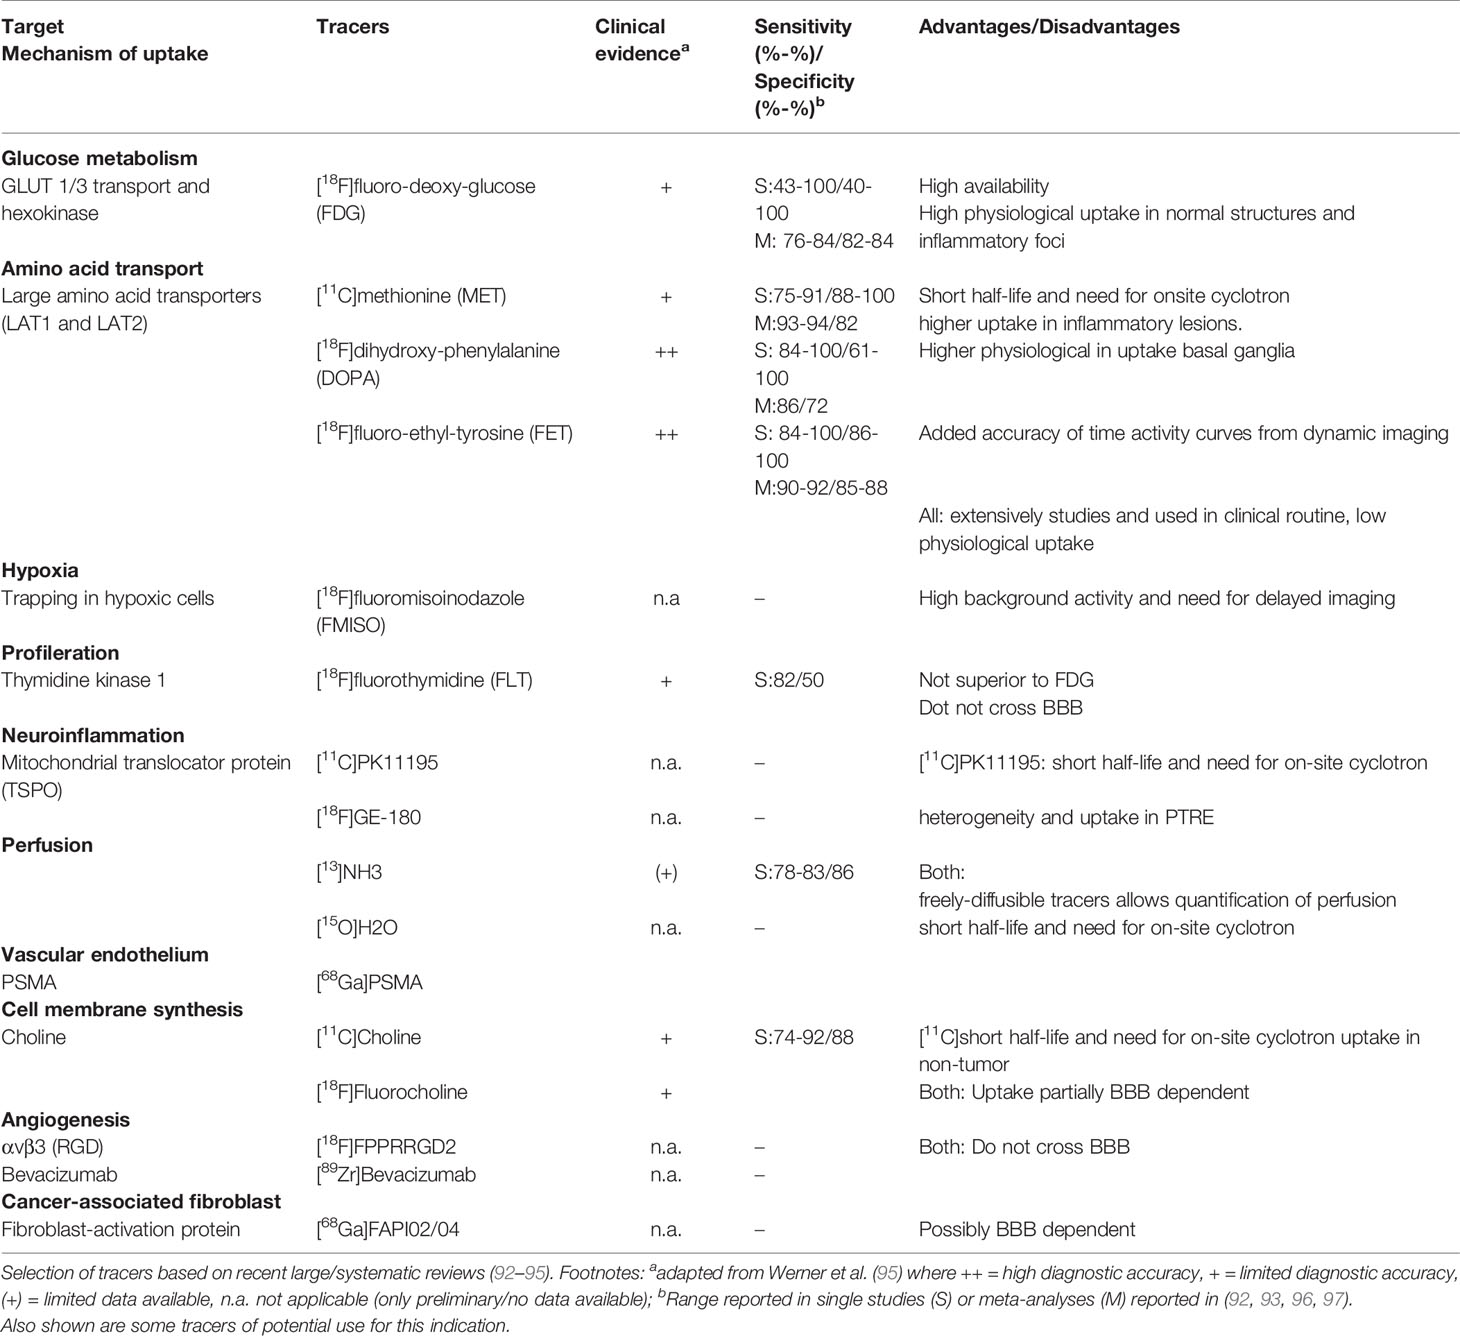
Table 2 Frequently studied PET tracers used to differentiate progression from post-treatment related effects.
Several reviews have highlighted the potential of combining PET acquired simultaneously with advanced MRI by using a hybrid PET/MRI system (Figure 7), but the number of studies actually investigating the value of multimodal approaches in distinguishing recurrent gliomas from PTRE is limited. Recent studies combining [18F]FDG (105) or amino acid tracers (106–109) with DSC, DWI, and/or MRS (see Table S2) suggest that such multimodal imaging may provide complementary and additive information, leading to an improved overall diagnostic accuracy, but the optimal combination of modalities is not clear.
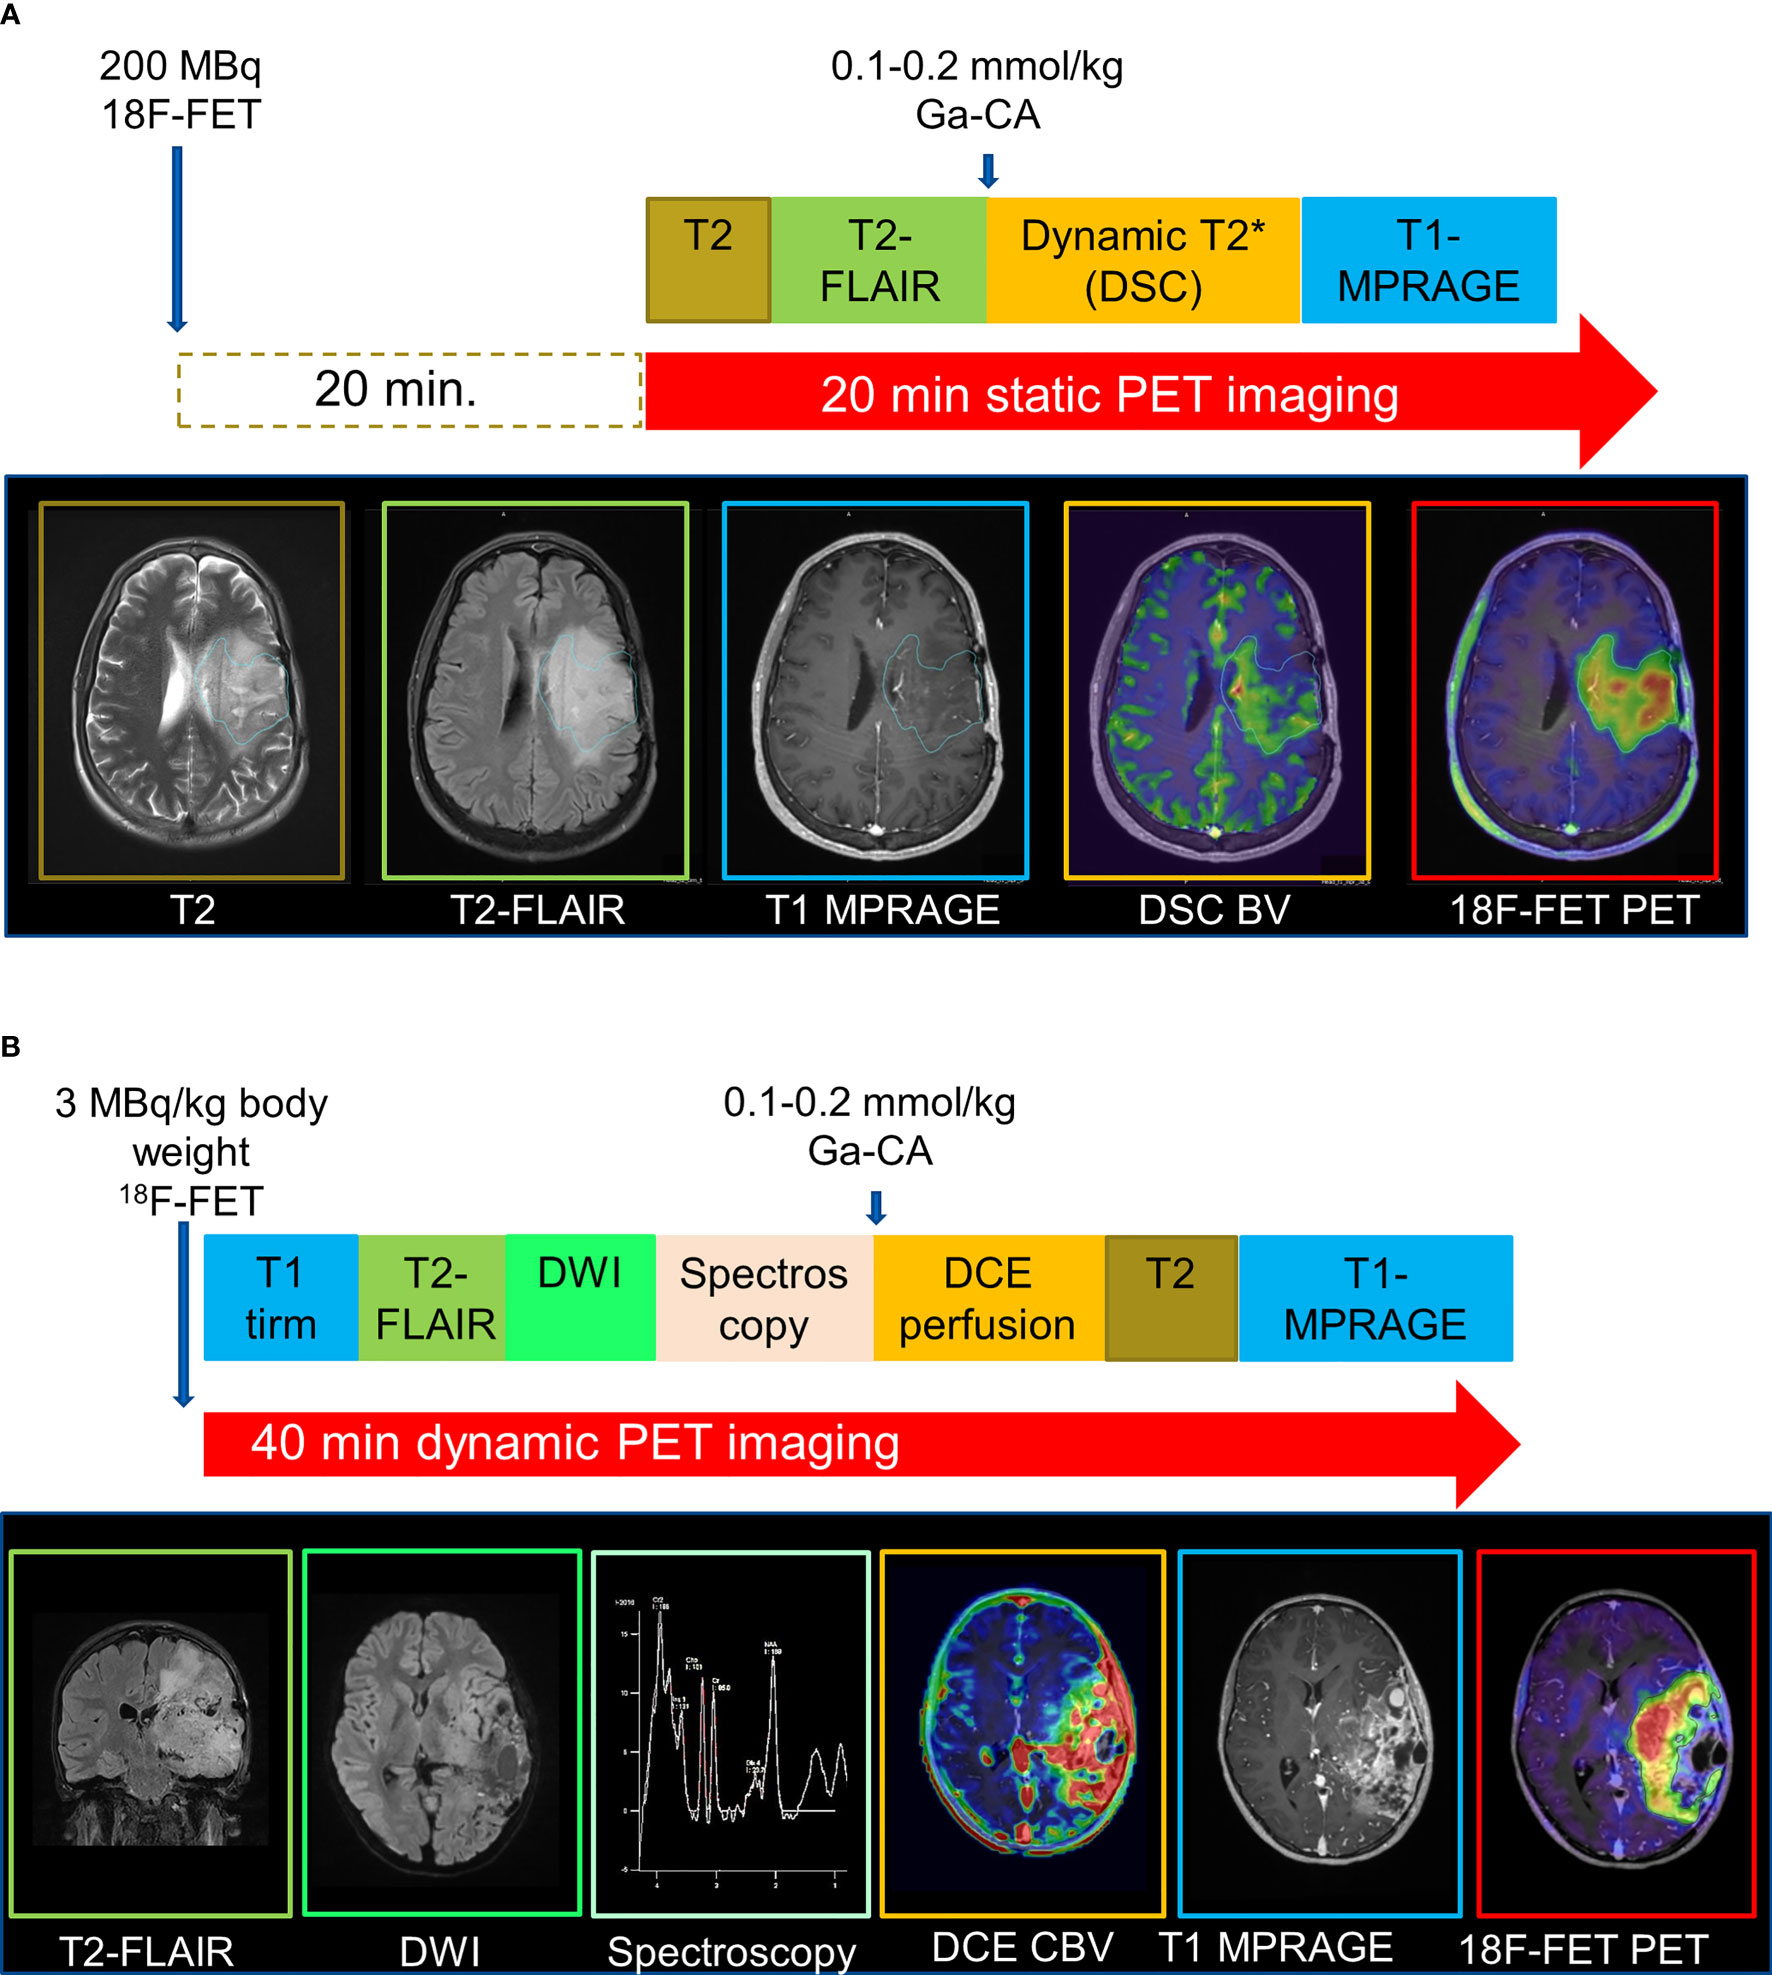
Figure 7 Examples of hybrid PET/MRI protocols. MRI data were acquired during acquisition of (A) static 20-minute or (B) dynamic 40-minute PET data. Adapted with permission from (103) and (104), respectively.
3.2.2 Machine Learning and Radiomics
3.2.2.1 Methodology
“Radiomics” (Figure 8) is the extraction of underlying quantitative information from the imaging dataset to develop biomarkers that may not be readily visible to individual human raters. Typically, radiomics consists of the following phases: preprocessing images, feature estimation (quantifying or characterizing the image), feature selection (dimensionality reduction to remove noise and random error in the underlying data, and, therefore, reduce overfitting), classification (decision or discriminant analysis), and evaluation (111). Evaluation in image analysis research initially consists of analytical validation, where the accuracy and reliability of the biomarker are assessed (112). Clinical validation is the subsequent clinical testing of biomarker performance, typically in a clinical trial.
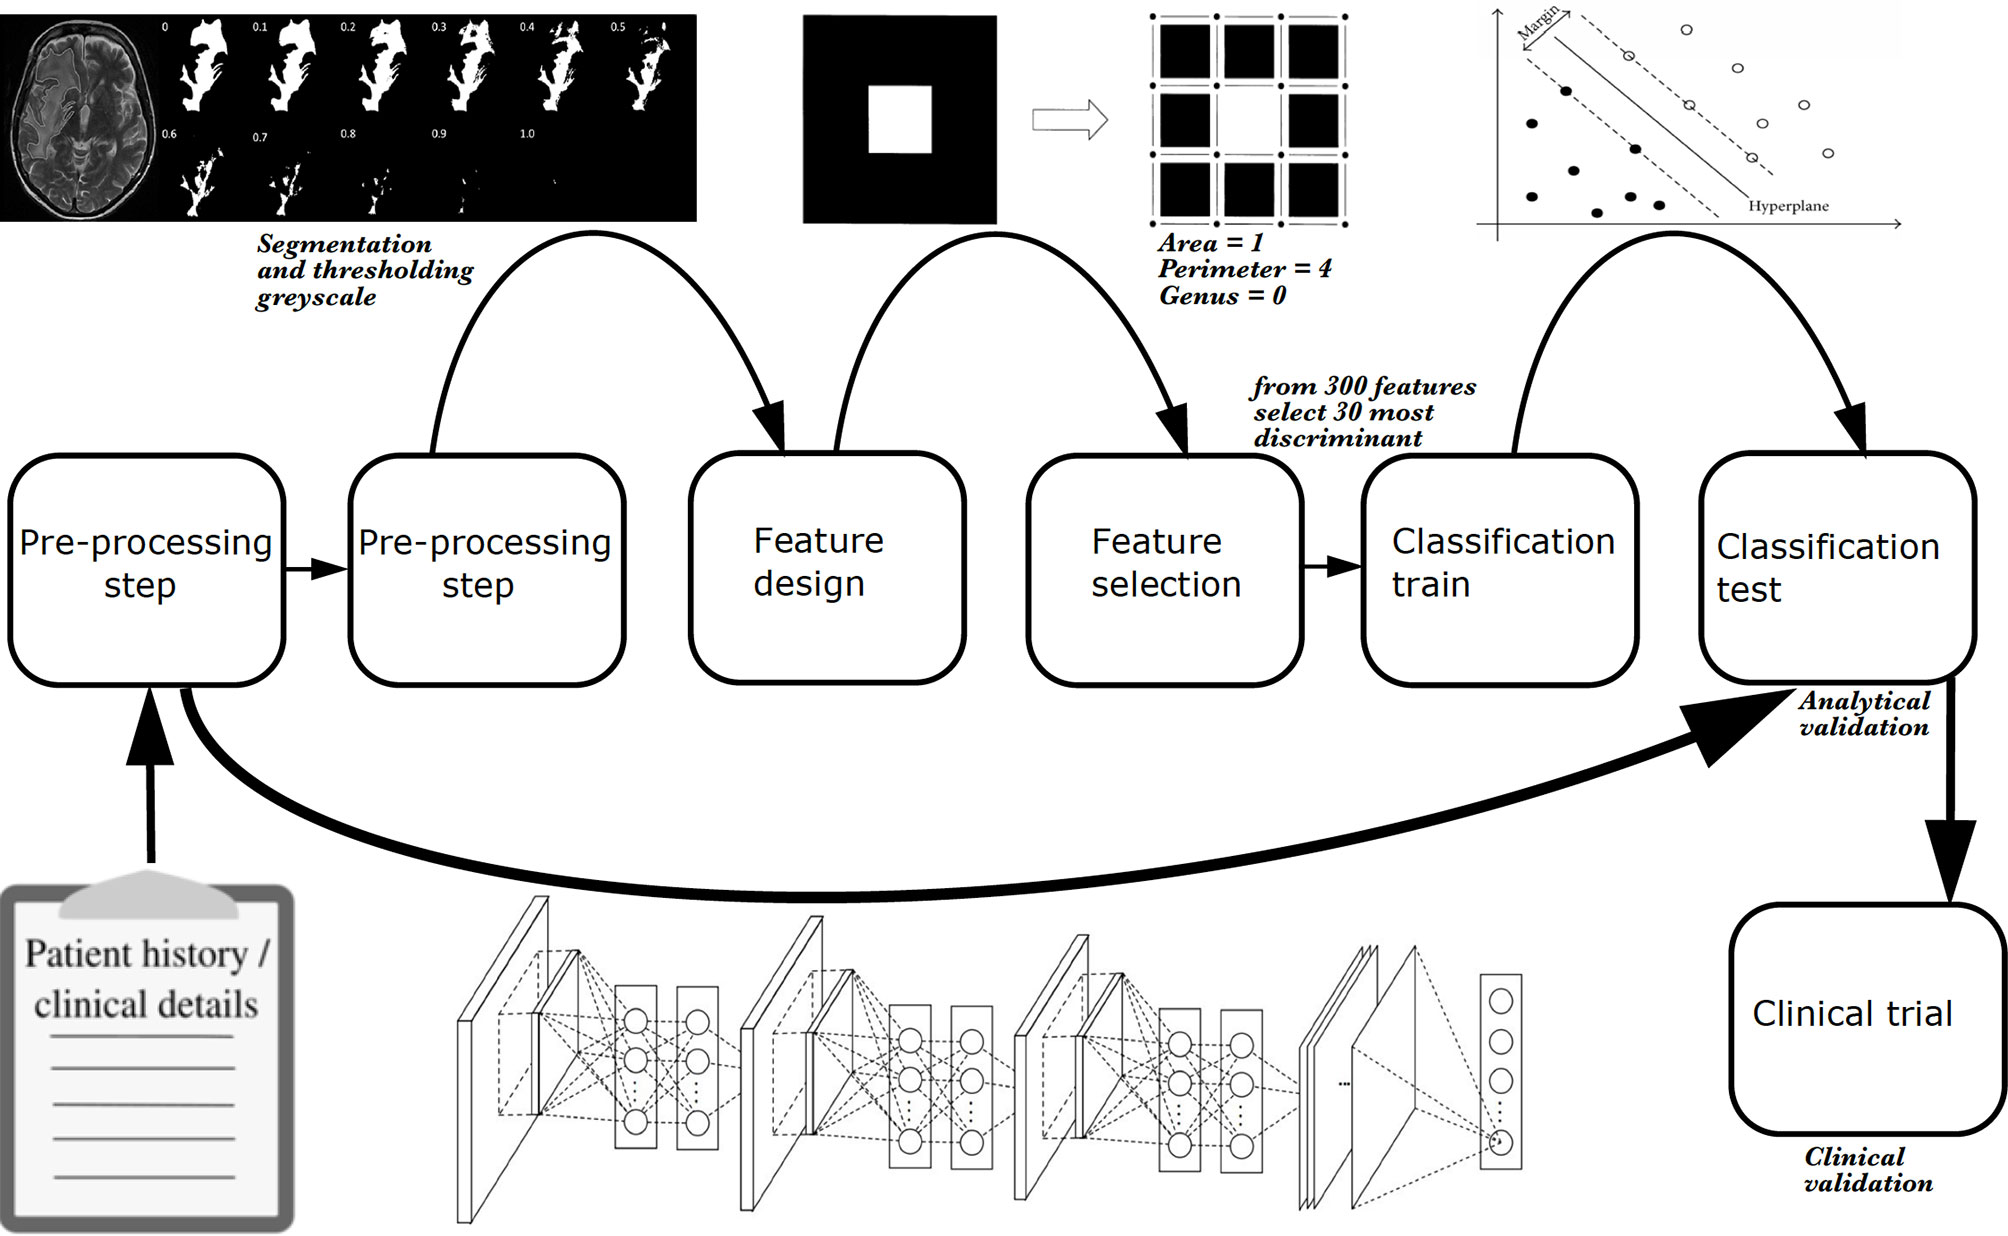
Figure 8 The phases of a radiomics study. Explicit feature engineering is represented by a series of boxes from left to right, starting off with pre-processing and finishing with classification of a hold-out test set. Implicit feature engineering (deep learning) is represented below these boxes by a neural network which incorporates many steps of explicit feature engineering. As with explicit feature engineering, to achieve analytical validation, classification of a hold-out test set must be performed. Once analytical validation is achieved, ideally a clinical trial tests the model to achieve clinical validation in the same way a new therapeutic agent or surgical intervention is subject to a trial. Radiomics is image based, however, additional information can be incorporated such as clinical or demographic information. All studies require some pre-processing, whether that is data cleaning or converting file format from DICOM to NIfTI, for example. With explicit feature engineering, additional pre-processing is typically required such as image segmentation. In the example shown here, hyperintense voxels associated with a grade 4 glioblastoma in a T2-weighted image are segmented as a region of interest for radiomic analysis. The mask is extracted using 11 different grey-scale thresholds to give binary combinations of black and white pixels. Thereafter, carefully designed image analysis features (or “estimated features”) can be applied to the pixels. In the example shown, these are topological descriptors of image heterogeneity (white pixel area = 1; white pixel perimeter = 4; rings subtracted from holes, i.e., genus = 0) (110). The most discriminant features can be selected using statistical or machine learning techniques, and undergo classification using a machine learning algorithm. In the example shown, a support vector machine is used (the machine learning algorithm is described as “classical” to distinguish it and other similar algorithms from deep learning algorithms), and progression (solid black dots) and pseudoprogression (empty black dots) cases are determined.
Some studies have used applied statistical models, some have employed machine learning models, and many have leveraged both. The basic difference between them is that statistics draws population inferences from a sample, and machine learning finds generalizable predictive patterns (113). Recent work has made use of developments in technology to allow the use of much more complex supervised, unsupervised, and reinforcement machine learning, including the use of deep (multiple layered) neural networks, which allows automation of both feature estimation and selection steps (91).
3.2.2.2 Strengths and Weaknesses
Several barriers exist in translating machine learning high-grade glioma monitoring biomarkers to the clinic (114). These predominantly relate to the requirement of large datasets that have been accurately labeled to train models. However, machine learning has some additional weaknesses. Accuracy-driven performance metrics have led to a trend towards increasingly opaque models (115), although recent developments in interpretability and explainability may help to mitigate this to some extent (116). Furthermore, linking the empirical data to a categorical analysis neglects an intrinsic ambiguity in the observed phenomena (117), which might adversely affect the intended performance (118). Also, algorithms may be unreliable due to several technical constraints: domain adaptation is currently limited, and more solutions are required to help algorithms extrapolate well to new centers. This is particularly true of advanced imaging where the lack of established frameworks for technical acquisition and clinical handling leads to spatial heterogeneity of data across hospital sites. Multi-parametric combinations of advanced imaging exacerbates the heterogeneity further and increases the challenge of model generalizability further. Robustness to unintended data, such as artifacts, is also a technical constraint that needs to be overcome. Finally, the presence of more than one pathology (e.g., abscess associated with a tumor following treatment) can also confound algorithms as these cases are scarce and often unlabeled.
Nonetheless, machine learning models have several key advantages. They require less formal statistical training given the huge developments in software (119), and the programming expertise for researchers has now been transformatively reduced, enabled by standardized implementations of open source software (120, 121). Machine learning models also have the ability to determine implicitly any complex nonlinear relationship between independent and dependent variables (119), and have the ability to determine all possible interactions between predictor variables (115).
3.2.2.3 Evidence From Clinical Studies
As shown elsewhere, multiple studies have attempted to develop monitoring biomarkers to determine treatment response. Many incorporate machine learning as a central pillar of the process. A review of studies up to 2018 (91), a systematic review of studies from 2018 – 2020 (122) using PRISMA-DTA methodology and a meta-analysis from 2018–2021 (123) indicated that those taking advantage of enhanced computational processing power to build monitoring biomarker models (e.g., using deep learning methods such as convolutional neural networks) have yet to show an advantage in performance compared with machine learning techniques using explicit feature engineering and less computationally expensive classifiers (e.g., using “classical” machine learning methods support vector machine). It is also notable that studies applying machine learning to build monitoring biomarker models have yet to show an overall advantage over those using traditional statistical methods. There is good diagnostic performance of machine learning models that use MRI features to distinguish between progressive disease and diagnostic accuracy measures comprise recall = 0.61 – 1.00, specificity = 0.47 – 0.90, balanced accuracy = 0.54 – 0.83, precision = 0.58 – 0.88, F1 score = 0.59 – 0.94, and AUC = 0.65 – 0.85 (122, 123). The recent meta-analysis of ten studies showed a pooled true positive rate (sensitivity) = 0.769 (0.649 – 0.858), a false positive rate (1-specificity) = 0.352 (0.251 – 0.468) and a summary AUC-ROC = 0.765. Other pooled metrics showed derived measures of balanced accuracy = 0.706 (0.623–0.779); positive likelihood ratio = 2.220 (1.560–3.140); negative likelihood ratio = 0.366 (0.213–0.572); and diagnostic odds ratio = 6.670 (2.800–13.500) (123). It is noteworthy that the small numbers of patients included in these studies, the high-risk of bias and concerns of applicability in the study designs, and the low level of evidence given that the monitoring biomarker studies are retrospective, suggest that limited conclusions can be drawn from the data. The results show that glioblastoma treatment response monitoring biomarkers developed through machine learning are promising but are at an early phase of development and are not ready to be incorporated into clinical practice to distinguish tumor progression from PTRE. Furthermore, no practice guidelines exist for this specific application. All published studies would benefit from improvements in the methodology. Future studies would benefit from analytical validation using external hold-out tests, as well as from larger datasets to reduce overfitting.
3.2.2.4 Future Developments
Advances in brain tumor database curation will facilitate integration of imaging, clinical, demographic, and molecular marker information to create large databases which will allow machine learning models to be trained and tested at a greater scale to what has occurred previously (114). The capture of large volumes of data and the inclusion of a wider spectrum of imaging phenotypes typically results in improved diagnostic performance during machine learning or statistical tasks; the relative improvement of deep learning model performance is particularly marked (124–126). For deep learning, the dependency on very large datasets can be reduced by data augmentation and transfer learning; the latter, where an already-developed model for a task is reused as the starting point for a model on a second task, is especially advantageous for medical tasks, since these pretrained models not only obviate the need for very large datasets but are less computationally expensive (116, 127, 128). One- or few-shot learning is related to this and allows classifiers to be built from very small labeled training sets (129).
Once established, incoming data from large-scale live repositories will allow ongoing refinement and assessment of outcomes. Furthermore, distributed machine learning approaches, in particular federated learning, will enable training on a large body of decentralized data (130). Federated learning is one instance of the more general approach of bringing the code to the data, instead of the data to the code and mitigates the fundamental problems of privacy, ownership, and locality of data. Although this technique is at the early research stage, federated learning appears to be fit-for-purpose for privacy-preserving medical applications (131, 132), and for high-grade glioma monitoring biomarkers in particular. However, the potential privacy and performance trade-off is unknown. Once established, federated learning will likely speed up the validation of the proposed methods, since fewer administrative data access requirements will be required, yet the sample will continue to be expanded by new data arriving from several sites.
3.3 Acceptance
3.3.1 Endorsement in Guidelines
Although diagnostic accuracies of most modalities appear high enough for clinical application, and this should encourage their clinical use, acceptance in clinical guidelines is limited for a variety of reasons associated with clinical readiness, which is summarized in Table 3. In the recent EANO/Society for Neuro-Oncology guidelines for management of glioblastoma (144) and EANO guidelines for diffuse gliomas (145), only perfusion MRI and amino acid PET are suggested as being helpful, and they are only mentioned in the case of suspected pseudoprogression. In the 2017 modified Response Assessment in Neuro-Oncology (RANO) criteria (141), it is noted that advanced MRI techniques, such as DSC, DCE, and amino acid PET, “have shown promise but additional work is necessary to standardize these approaches and improve their sensitivity and specificity” and “issues of cost and accessibility will need to be addressed before they can be widely adopted in clinical trials.” Accordingly, the RANO criteria remain based on post-contrast T1-weighted images only (and the T2-weighted/fluid attenuated inversion recovery in 2010 RANO guidelines, albeit not quantified). In the proposed minimum imaging protocol from the Jumpstarting Brain Tumor Drug Development Coalition (143), designed to be widely applicable to a variety of MR scanners, only DWI (three b-values) is included in addition to these conventional structural sequences. DWI also has been included in the proposed minimum imaging protocol in the pediatric high-grade glioma RANO recommendations due to its widespread use and “potential benefit,” while perfusion MRI and MRS are considered experimental (149). A summary of a survey of national imaging guidelines conducted among GliMR-associated countries are included within Table 3 (methodology and results in Supplementary Material). Specifically, we determined whether there are guidelines for incorporation (routine or optional) of advanced MRI techniques in clinical practice for determining treatment response in high-grade gliomas.
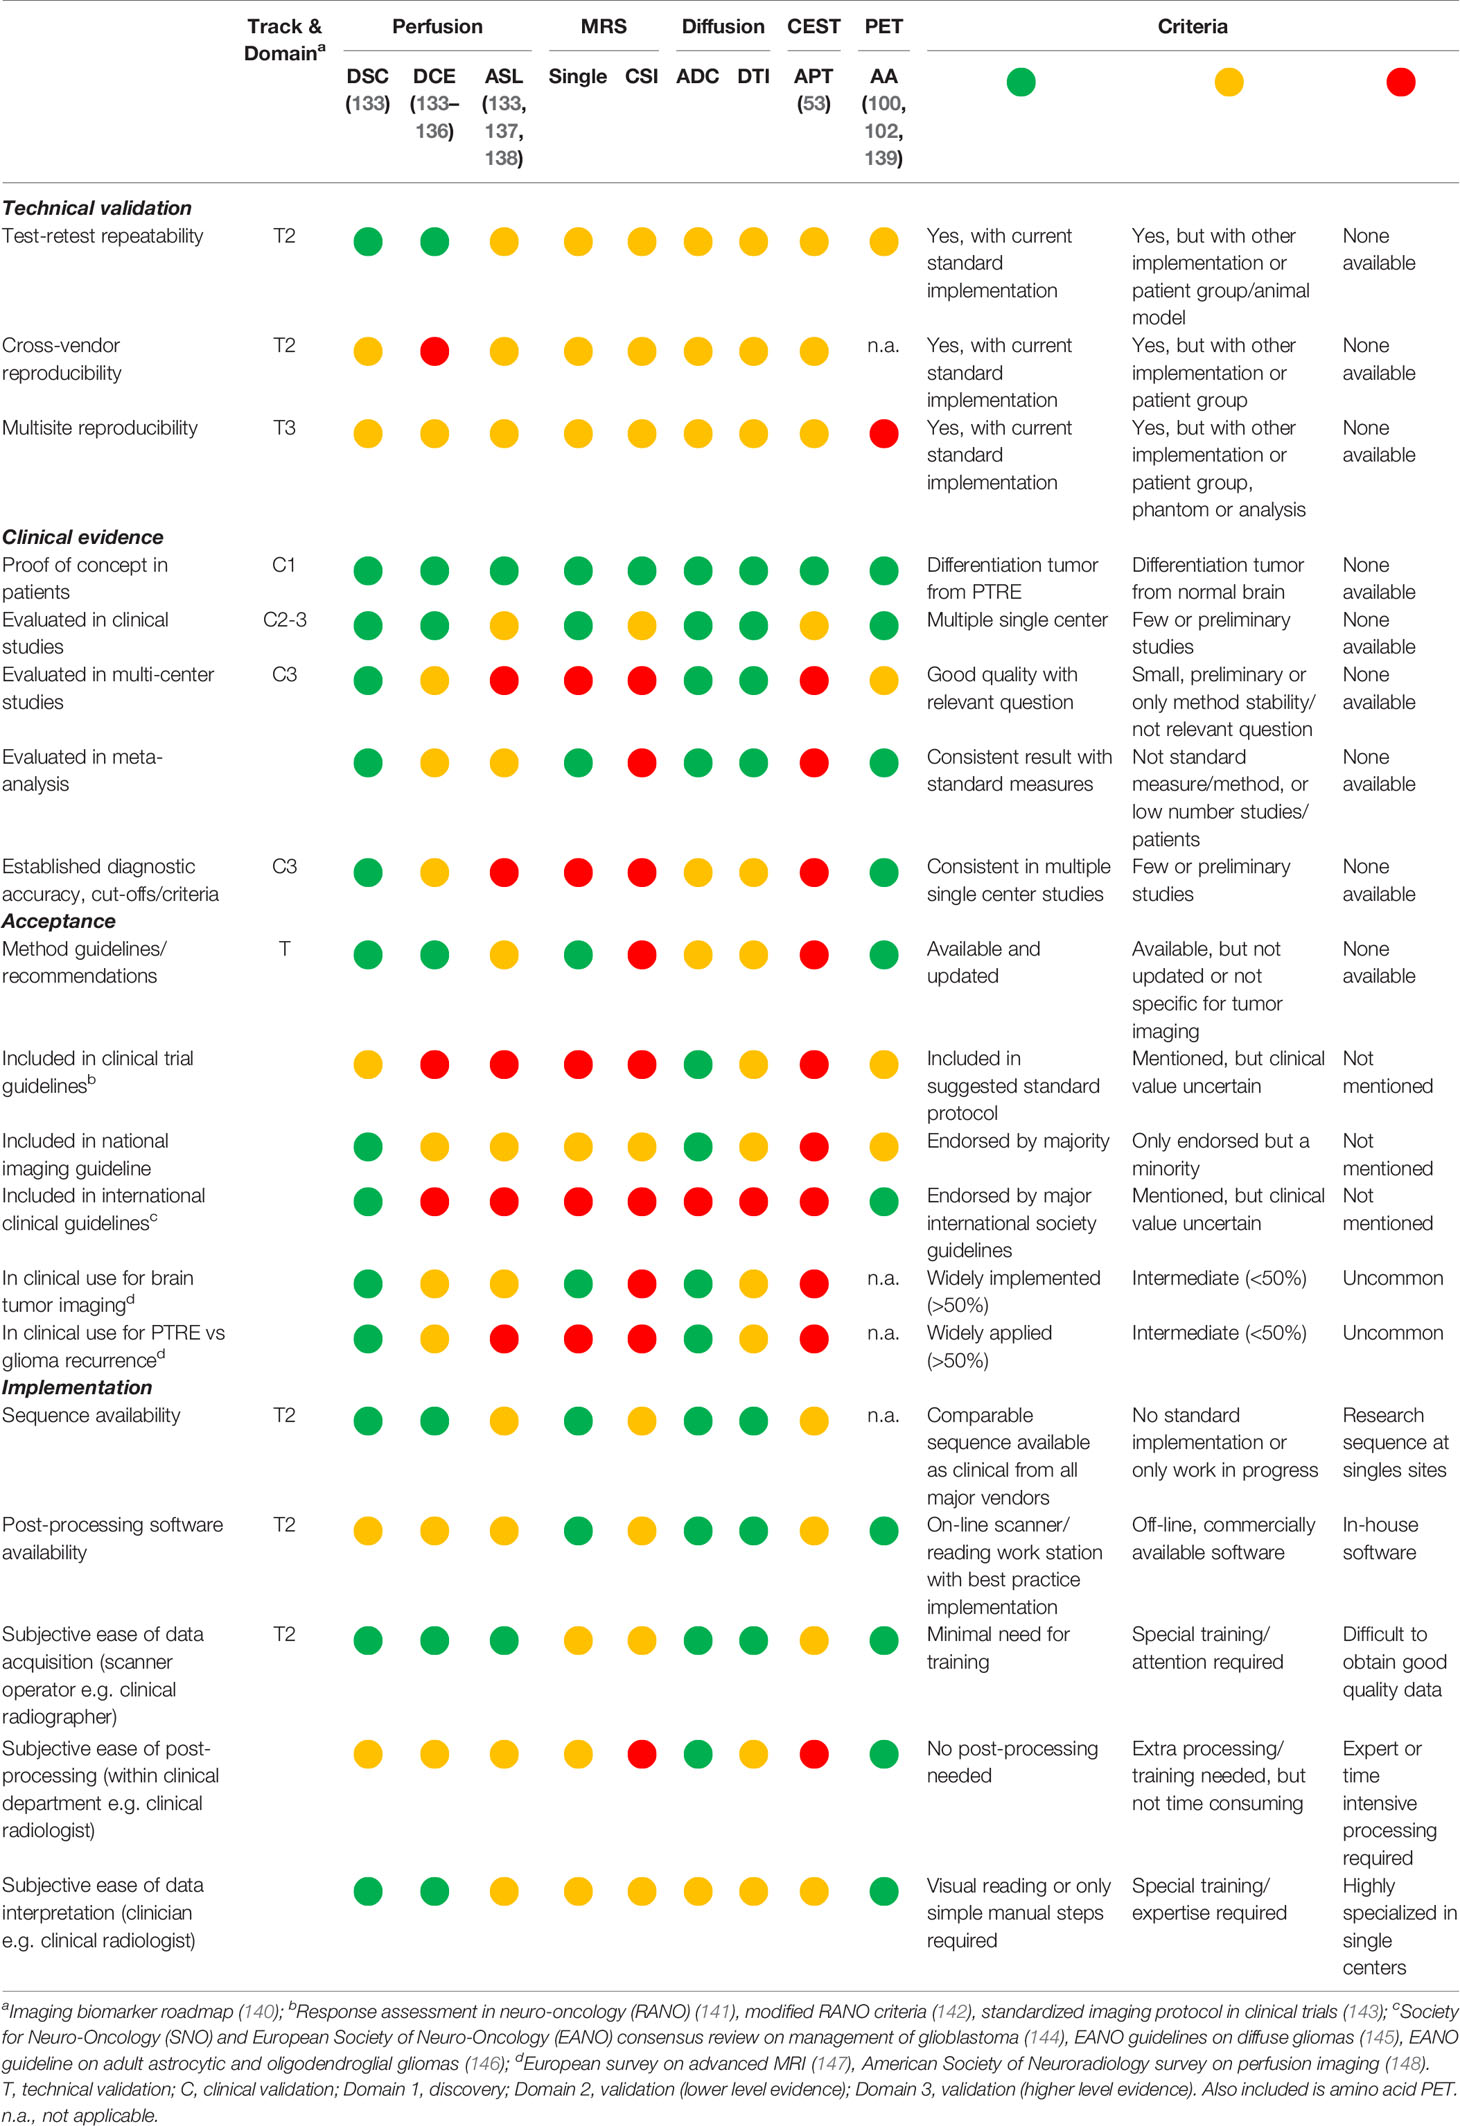
Table 3 State of development of advanced MRI techniques.
3.3.2 Clinical Use of Advanced MRI
Published evidence of the current use of advanced MRI in daily clinical practice is limited. European surveys have reported that advanced MRI techniques are widely available (150) and also applied to brain tumor imaging (147, 151, 152) with substantial national differences. A survey of 220 European centers (3% survey yield) showed that despite widespread availability of advanced MRI techniques, to differentiate radiation necrosis from progressive disease, perfusion imaging is used most commonly (56% of centers), whereas MRS and DWI are used rarely (6% and 5% of centers, respectively) (147). A predominantly US survey of perfusion MRI (5% survey yield) reported widespread availability for brain imaging (all indications) offered by 81% of centers, with DSC being the most frequently offered (87%) followed by DCE (41%) and ASL (35%) (148). Among those offering perfusion MRI, the most frequent indication was post-treatment evaluation of intra-axial brain tumors (87%), in particular differentiating progression from radiation necrosis (96%) or pseudoprogression (84%). The authors note that perfusion imaging is widely adopted despite the lack of reimbursement and the limited support for perfusion imaging in guidelines at the time of the survey, suggesting that both the radiologist and the referring physician find value in these techniques. However, although there appears to be a wide adoption of advanced MRI, the results of the US and European surveys may be confounded by unrepresentative samples with > 95% of non-responders. A UK survey of post-operative imaging of all neuro-oncology centers (100% survey yield) showed that most centers (> 80%) included DWI in the standard protocol, while other advanced MRI techniques (DSC, DCE, or MRS) were applied routinely by only 10% of centers during follow-up, and in selected cases where there was possible pseudoprogression by 35% (153). Of interest, neuroradiologists were the main advocates for the use of advanced imaging, while neuro-oncologists were more likely to suggest that further evidence is needed.
4 Conclusion
The biochemical composition of high-grade gliomas is markedly different from healthy brain tissue. MRS allows the simultaneous acquisition of an array of metabolic alterations with Cho-based ratios appearing to be consistently discriminatory in treatment response assessment, although challenges remain in this technique despite it being mature. Promising directions relate to ultra-high field strengths and high-resolution MRSI, 2HG analysis, and the use of non-proton nuclei. Labile protons on endogenous proteins can be selectively targeted with CEST to give high-resolution images. The body of evidence for clinical application of APT imaging has been building for a decade, but more evidence is required to confirm the use of CEST as a monitoring biomarker. Multiparametric methodologies, including the incorporation of nuclear medicine techniques, combine probes measuring different tumor properties. Although potentially synergistic, the limitations of each individual modality can also be compounded, particularly in the absence of standardization. Machine learning requires large datasets with high-quality annotation; currently, there is low-level evidence for monitoring biomarker clinical application.
In conclusion, advanced MRI techniques show huge promise in treatment response assessment. The clinical readiness analysis highlights that most monitoring biomarkers require standardized international consensus guidelines, with more facilitation regarding technique implementation and reporting in the clinic. The benefit of technique standardization will be multiplied in terms of multiparametric imaging and will also help leverage the enormous potential of machine learning tools.
Author Contributions
Authors TB and OH served as overall editors. The individual sections were drafted by: Introduction (TB), DSC-MRI (KS and MÁ-T), DCE-MRI (OH), ASL (PF and VK), diffusion techniques (RN, FR, and VK), spectroscopy (ECW and GH), CEST (EAHW), multiparametric imaging (OMH), clinical readiness (OH), radiomics (TB), discussion (TB). All authors have contributed to the conception of the two parts of the article, revised them critically and approved the submitted versions.
Funding
This publication is part of the COST Action CA18206 Glioma MR Imaging 2.0 (www.glimr.eu), supported by COST (European Cooperation in Science and Technology), www.cost.eu. GliMR provided travel and accommodation for members who had travelled to early networking meetings.
- KS: National Institute of Health/National Cancer Institute R01 CA255123, U01 CA176110, UG3 CA247606, Medical College of Wisconsin Cancer Center.
- GH: Austrian Science Fund grant KLI-646.
- ECW: The Dutch Research Council (NWO) Talent Programme Veni: 18144
- EAHW: The Dutch Research Council (NWO) Talent Programme Veni: 91619121
- PF: The Portuguese Foundation for Science and Technology (FCT) Grant UIDB/50009/2020.
- RN: Babes-Bolyai University, Grant GTC No. 35277/18.11.2020.
- TB: The Wellcome/EPSRC Centre for Medical Engineering [WT 203148/Z/16/Z].
- MÁ-T: The ALBATROSS project (National Plan for Scientific and Technical Research and Innovation 2017-2020 and DPI2016-80054-R (Programa Estatal de Promoción del Talento y su Empleabilidad en I+D+i).
Conflict of Interest
KS: Ownership interest in IQ-AI Ltd and financial interest in Imaging Biometrics LLC. TB speaker’s bureau for AbbVie and Siemens Healthineers.
The remaining authors declare that the research was conducted in the absence of any commercial or financial relationships that could be construed as a potential conflict of interest.
Publisher’s Note
All claims expressed in this article are solely those of the authors and do not necessarily represent those of their affiliated organizations, or those of the publisher, the editors and the reviewers. Any product that may be evaluated in this article, or claim that may be made by its manufacturer, is not guaranteed or endorsed by the publisher.
Acknowledgments
The authors would like to thank Melissa Prah for assistance with obtaining figures, and Andrei Roman and Lydia Washechek for help with manuscript preparation. We also thank the national representatives who helped complete the national guideline survey (names listed in the Supplementary Material).
Supplementary Material
The Supplementary Material for this article can be found online at: https://www.frontiersin.org/articles/10.3389/fonc.2021.811425/full#supplementary-material
References
1. Howick J, Chalmer I, Glasziou P, Greenhalgh T, Heneghan C, Liberati A. Oxford Centre for Evidence-Based Medicine The Oxford 2011 Levels of Evidence. Oxford (2016). Available at: http://www.cebm.net/index.aspx?o1/45653 (Accessed 1 August, 2018).
2. McInnes MDF, Moher D, Thombs BD, McGrath TA, Bossuyt PM, the PRISMA-DTA Group, et al. Preferred Reporting Items for a Systematic Review and Meta-Analysis of Diagnostic Test Accuracy Studies: The PRISMA-DTA Statement. JAMA (2018) 319:388–96. doi: 10.1001/jama.2017.19163
3. de Graaf RA. In Vivo NMR Spectroscopy. Chichester, UK: John Wiley & Sons, Ltd (2019). doi: 10.1002/9781119382461
4. Horská A, Barker PB. Imaging of Brain Tumors: MR Spectroscopy and Metabolic Imaging. Neuroimaging Clin N Am (2010) 20:293–310. doi: 10.1016/j.nic.2010.04.003
5. Castillo M, Smith JK, Kwock L. Correlation of Myo-Inositol Levels and Grading of Cerebral Astrocytomas. AJNR Am J Neuroradiol (2000) 21:1645–9.
6. Kuesel AC, Sutherland GR, Halliday W, Smith IC. 1h MRS of High Grade Astrocytomas: Mobile Lipid Accumulation in Necrotic Tissue. NMR BioMed (1994) 7:149–55. doi: 10.1002/nbm.1940070308
7. Hangel G, Jain S, Springer E, Hečková E, Strasser B, Považan M, et al. High-Resolution Metabolic Mapping of Gliomas via Patch-Based Super-Resolution Magnetic Resonance Spectroscopic Imaging at 7T. Neuroimage (2019) 191:587–95. doi: 10.1016/j.neuroimage.2019.02.023
8. Maudsley AA, Andronesi OC, Barker PB, Bizzi A, Bogner W, Henning A, et al. Advanced Magnetic Resonance Spectroscopic Neuroimaging: Experts’ Consensus Recommendations. NMR BioMed (2021) 34:e4309. doi: 10.1002/nbm.4309
9. Wilson M, Andronesi O, Barker PB, Bartha R, Bizzi A, Bolan PJ, et al. Methodological Consensus on Clinical Proton MRS of the Brain: Review and Recommendations. Magn Reson Med (2019) 82:527–50. doi: 10.1002/mrm.27742
10. Kreis R, Boer V, Choi I, Cudalbu C, Graaf RA, Gasparovic C, et al. Terminology and Concepts for the Characterization of In Vivo MR Spectroscopy Methods and MR Spectra: Background and Experts’ Consensus Recommendations. NMR BioMed (2021) 34:e4347. doi: 10.1002/nbm.4347
11. Near J, Harris AD, Juchem C, Kreis R, Marjańska M, Öz G, et al. Preprocessing, Analysis and Quantification in Single-Voxel Magnetic Resonance Spectroscopy: Experts’ Consensus Recommendations. NMR BioMed (2021) 34:e4257. doi: 10.1002/nbm.4257
12. Považan M, Mikkelsen M, Berrington A, Bhattacharyya PK, Brix MK, Buur PF, et al. Comparison of Multivendor Single-Voxel MR Spectroscopy Data Acquired in Healthy Brain at 26 Sites. Radiology (2020) 295:171–80. doi: 10.1148/radiol.2020191037
13. van de Bank BL, Emir UE, Boer VO, van Asten JJA, Maas MC, Wijnen JP, et al. Multi-Center Reproducibility of Neurochemical Profiles in the Human Brain at 7 T. NMR BioMed (2015) 28:306–16. doi: 10.1002/nbm.3252
14. Yu Y, Ma Y, Sun M, Jiang W, Yuan T, Tong D. Meta-Analysis of the Diagnostic Performance of Diffusion Magnetic Resonance Imaging With Apparent Diffusion Coefficient Measurements for Differentiating Glioma Recurrence From Pseudoprogression. Medicine (Baltimore) (2020) 99:e20270. doi: 10.1097/MD.0000000000020270
15. Zhang H, Ma L, Shu C, Wang Y, Dong L. Diagnostic Accuracy of Diffusion MRI With Quantitative ADC Measurements in Differentiating Glioma Recurrence From Radiation Necrosis. J Neurol Sci (2015) 351::65–71. doi: 10.1016/j.jns.2015.02.038
16. Okuchi S, Rojas-Garcia A, Ulyte A, Lopez I, Ušinskienė J, Lewis M, et al. Diagnostic Accuracy of Dynamic Contrast-Enhanced Perfusion MRI in Stratifying Gliomas: A Systematic Review and Meta-Analysis. Cancer Med (2019) 8:5564–73. doi: 10.1002/cam4.2369
17. Patel P, Baradaran H, Delgado D, Askin G, Christos P, John Tsiouris A, et al. MR Perfusion-Weighted Imaging in the Evaluation of High-Grade Gliomas After Treatment: A Systematic Review and Meta-Analysis. Neuro Oncol (2017) 19:118–27. doi: 10.1093/neuonc/now148
18. Wan B, Wang S, Tu M, Wu B, Han P, Xu H. The Diagnostic Performance of Perfusion MRI for Differentiating Glioma Recurrence From Pseudoprogression. Medicine (Baltimore) (2017) 96:e6333. doi: 10.1097/MD.0000000000006333
19. Deng S-M, Zhang B, Wu Y-W, Zhang W, Chen Y-Y. Detection of Glioma Recurrence by 11C-Methionine Positron Emission Tomography and Dynamic Susceptibility Contrast-Enhanced Magnetic Resonance Imaging. Nucl Med Commun (2013) 34:758–66. doi: 10.1097/MNM.0b013e328361f598
20. Zhang H, Ma L, Wang Q, Zheng X, Wu C, Xu B. Role of Magnetic Resonance Spectroscopy for the Differentiation of Recurrent Glioma From Radiation Necrosis: A Systematic Review and Meta-Analysis. Eur J Radiol (2014) 83:2181–9. doi: 10.1016/j.ejrad.2014.09.018
21. van Dijken BRJ, van Laar PJ, Holtman GA, van der Hoorn A. Diagnostic Accuracy of Magnetic Resonance Imaging Techniques for Treatment Response Evaluation in Patients With High-Grade Glioma, a Systematic Review and Meta-Analysis. Eur Radiol (2017) 27:4129–44. doi: 10.1007/s00330-017-4789-9
22. Wang L, Wei L, Wang J, Li N, Gao Y, Ma H, et al. Evaluation of Perfusion MRI Value for Tumor Progression Assessment After Glioma Radiotherapy. Medicine (Baltimore) (2020) 99:e23766. doi: 10.1097/MD.0000000000023766
23. Chuang M-T, Liu Y-S, Tsai Y-S, Chen Y-C, Wang C-K. Differentiating Radiation-Induced Necrosis From Recurrent Brain Tumor Using MR Perfusion and Spectroscopy: A Meta-Analysis. PloS One (2016) 11:e0141438. doi: 10.1371/journal.pone.0141438
24. Verma G, Chawla S, Mohan S, Wang S, Nasrallah M, Sheriff S, et al. Three-Dimensional Echo Planar Spectroscopic Imaging for Differentiation of True Progression From Pseudoprogression in Patients With Glioblastoma. NMR BioMed (2019) 32:e4042. doi: 10.1002/nbm.4042
25. Kazda T, Bulik M, Pospisil P, Lakomy R, Smrcka M, Slampa P, et al. Advanced MRI Increases the Diagnostic Accuracy of Recurrent Glioblastoma: Single Institution Thresholds and Validation of MR Spectroscopy and Diffusion Weighted MR Imaging. NeuroImage Clin (2016) 11:316–21. doi: 10.1016/j.nicl.2016.02.016
26. Öz G, Deelchand DK, Wijnen JP, Mlynárik V, Xin L, Mekle R, et al. Advanced Single Voxel 1 H Magnetic Resonance Spectroscopy Techniques in Humans: Experts’ Consensus Recommendations. NMR BioMed (2021) 34:e4236. doi: 10.1002/nbm.4236
27. Lin A, Andronesi O, Bogner W, Choi I, Coello E, Cudalbu C, et al. Minimum Reporting Standards for In Vivo Magnetic Resonance Spectroscopy (MRSinMRS): Experts’ Consensus Recommendations. NMR BioMed (2021) 34:e4484. doi: 10.1002/nbm.4484
28. Gruber S, Heckova E, Strasser B, Považan M, Hangel GJ, Minarikova L, et al. Mapping an Extended Neurochemical Profile at 3 and 7 T Using Accelerated High-Resolution Proton Magnetic Resonance Spectroscopic Imaging. Invest Radiol (2017) 52:631–9. doi: 10.1097/RLI.0000000000000379
29. Bogner W, Otazo R, Henning A. Accelerated MR Spectroscopic Imaging—A Review of Current and Emerging Techniques. NMR BioMed (2021) 34:e4314. doi: 10.1002/nbm.4314
30. Ladd ME, Bachert P, Meyerspeer M, Moser E, Nagel AM, Norris DG, et al. Pros and Cons of Ultra-High-Field MRI/MRS for Human Application. Prog Nucl Magn Reson Spectrosc (2018) 109:1–50. doi: 10.1016/j.pnmrs.2018.06.001
31. Hangel G, Cadrien C, Lazen P, Furtner J, Lipka A, Hečková E, et al. High-Resolution Metabolic Imaging of High-Grade Gliomas Using 7T-CRT-FID-MRSI. NeuroImage Clin (2020) 28:102433. doi: 10.1016/j.nicl.2020.102433
32. Pedrosa de Barros N, Meier R, Pletscher M, Stettler S, Knecht U, Reyes M, et al. Analysis of Metabolic Abnormalities in High-Grade Glioma Using MRSI and Convex NMF. NMR BioMed (2019) 32:e4109. doi: 10.1002/nbm.4109
33. Branzoli F, Marjańska M. Magnetic Resonance Spectroscopy of Isocitrate Dehydrogenase Mutated Gliomas: Current Knowledge on the Neurochemical Profile. Curr Opin Neurol (2020) 33:413–21. doi: 10.1097/WCO.0000000000000833
34. Andronesi OC, Loebel F, Bogner W, Marjańska M, Vander Heiden MG, Iafrate AJ, et al. Treatment Response Assessment in IDH-Mutant Glioma Patients by Noninvasive 3d Functional Spectroscopic Mapping of 2-Hydroxyglutarate. Clin Cancer Res (2016) 22:1632–41. doi: 10.1158/1078-0432.CCR-15-0656
35. Choi C, Raisanen JM, Ganji SK, Zhang S, McNeil SS, An Z, et al. Prospective Longitudinal Analysis of 2-Hydroxyglutarate Magnetic Resonance Spectroscopy Identifies Broad Clinical Utility for the Management of Patients With IDH -Mutant Glioma. J Clin Oncol (2016) 34:4030–9. doi: 10.1200/JCO.2016.67.1222
36. Andronesi OC, Arrillaga-Romany IC, Ly KI, Bogner W, Ratai EM, Reitz K, et al. Pharmacodynamics of Mutant-IDH1 Inhibitors in Glioma Patients Probed by In Vivo 3d MRS Imaging of 2-Hydroxyglutarate. Nat Commun (2018) 9:1474. doi: 10.1038/s41467-018-03905-6
37. Korzowski A, Weinfurtner N, Mueller S, Breitling J, Goerke S, Schlemmer H, et al. Volumetric Mapping of Intra- and Extracellular pH in the Human Brain Using 31 P MRSI at 7T. Magn Reson Med (2020) 84:1707–23. doi: 10.1002/mrm.28255
38. Mirkes C, Shajan G, Chadzynski G, Buckenmaier K, Bender B, Scheffler K. (31)P CSI of the Human Brain in Healthy Subjects and Tumor Patients at 9.4 T With a Three-Layered Multi-Nuclear Coil: Initial Results. MAGMA (2016) 29:579–89. doi: 10.1007/s10334-016-0524-9
39. De Feyter HM, Behar KL, Corbin ZA, Fulbright RK, Brown PB, McIntyre S, et al. Deuterium Metabolic Imaging (DMI) for MRI-Based 3D Mapping of Metabolism In Vivo. Sci Adv (2018) 4:eaat7314. doi: 10.1126/sciadv.aat7314
40. van Zijl PCM, Lam WW, Xu J, Knutsson L, Stanisz GJ. Magnetization Transfer Contrast and Chemical Exchange Saturation Transfer MRI. Features and Analysis of the Field-Dependent Saturation Spectrum. Neuroimage (2018) 168:222–41. doi: 10.1016/j.neuroimage.2017.04.045
41. Jones CK, Huang A, Xu J, Edden RAE, Schär M, Hua J, et al. Nuclear Overhauser Enhancement (NOE) Imaging in the Human Brain at 7T. Neuroimage (2013) 77:114–24. doi: 10.1016/j.neuroimage.2013.03.047
42. van Zijl PCM, Yadav NN. Chemical Exchange Saturation Transfer (CEST): What is in a Name and What Isn’t? Magn Reson Med (2011) 65:927–48. doi: 10.1002/mrm.22761
43. Zhou J. Amide Proton Transfer Imaging of the Human Brain. Methods Mol Biol (2011) 711:227–37. doi: 10.1007/978-1-61737-992-5_10
44. Windschuh J, Zaiss M, Meissner J-E, Paech D, Radbruch A, Ladd ME, et al. Correction of B 1-Inhomogeneities for Relaxation-Compensated CEST Imaging at 7 T. NMR BioMed (2015) 28:529–37. doi: 10.1002/nbm.3283
45. Kim M, Gillen J, Landman BA, Zhou J, van Zijl PCM. Water Saturation Shift Referencing (WASSR) for Chemical Exchange Saturation Transfer (CEST) Experiments. Magn Reson Med (2009) 61:1441–50. doi: 10.1002/mrm.21873
46. Schuenke P, Windschuh J, Roeloffs V, Ladd ME, Bachert P, Zaiss M. Simultaneous Mapping of Water Shift and B 1 (WASABI)—Application to Field-Inhomogeneity Correction of CEST MRI Data. Magn Reson Med (2017) 77:571–80. doi: 10.1002/mrm.26133
47. Zaiss M, Xu J, Goerke S, Khan IS, Singer RJ, Gore JC, et al. Inverse Z -Spectrum Analysis for Spillover-, MT-, and T1 -Corrected Steady-State Pulsed CEST-MRI - Application to pH-Weighted MRI of Acute Stroke. NMR BioMed (2014) 27:240–52. doi: 10.1002/nbm.3054
48. Englund E, Brun A, Larsson EM, Györffy-Wagner Z, Persson B. Tumours of the Central Nervous System. Proton Magnetic Resonance Relaxation Times T1 and T2 and Histopathologic Correlates. Acta Radiol Diagn (Stockh) (1986) 27:653–9. doi: 10.1177/028418518602700606
49. Xu J, Li K, Zu Z, Li X, Gochberg DF, Gore JC. Quantitative Magnetization Transfer Imaging of Rodent Glioma Using Selective Inversion Recovery. NMR BioMed (2014) 27:253–60. doi: 10.1002/NBM.3058
50. Mehrabian H, Myrehaug S, Soliman H, Sahgal A, Stanisz GJ. Evaluation of Glioblastoma Response to Therapy With Chemical Exchange Saturation Transfer. Int J Radiat Oncol Biol Phys (2018) 101:713–23. doi: 10.1016/j.ijrobp.2018.03.057
51. Deshmane A, Zaiss M, Lindig T, Herz K, Schuppert M, Gandhi C, et al. 3D Gradient Echo Snapshot CEST MRI With Low Power Saturation for Human Studies at 3T. Magn Reson Med (2019) 81:2412–23. doi: 10.1002/mrm.27569
52. Zaiss M, Windschuh J, Paech D, Meissner JE, Burth S, Schmitt B, et al. Relaxation-Compensated CEST-MRI of the Human Brain at 7T: Unbiased Insight Into NOE and Amide Signal Changes in Human Glioblastoma. Neuroimage (2015) 112:180–8. doi: 10.1016/J.NEUROIMAGE.2015.02.040
53. Voelker MN, Kraff O, Brenner D, Wollrab A, Weinberger O, Berger MC, et al. The Traveling Heads: Multicenter Brain Imaging at 7 Tesla. Magn Reson Mater Phys Biol Med (2016) 29:399–415. doi: 10.1007/s10334-016-0541-8
54. Zhou J, Tryggestad E, Wen Z, Lal B, Zhou T, Grossman R, et al. Differentiation Between Glioma and Radiation Necrosis Using Molecular Magnetic Resonance Imaging of Endogenous Proteins and Peptides. Nat Med (2011) 17:130–4. doi: 10.1038/nm.2268
55. Sagiyama K, Mashimo T, Togao O, Vemireddy V, Hatanpaa KJ, Maher EA, et al. In Vivo Chemical Exchange Saturation Transfer Imaging Allows Early Detection of a Therapeutic Response in Glioblastoma. Proc Natl Acad Sci (2014) 111:4542–7. doi: 10.1073/pnas.1323855111
56. Togao O, Yoshiura T, Keupp J, Hiwatashi A, Yamashita K, Kikuchi K, et al. Amide Proton Transfer Imaging of Adult Diffuse Gliomas: Correlation With Histopathological Grades. Neuro Oncol (2014) 16:441–8. doi: 10.1093/neuonc/not158
57. Park KJ, Kim HS, Park JE, Shim WH, Kim SJ, Smith SA. Added Value of Amide Proton Transfer Imaging to Conventional and Perfusion MR Imaging for Evaluating the Treatment Response of Newly Diagnosed Glioblastoma. Eur Radiol (2016) 26:4390–403. doi: 10.1007/s00330-016-4261-2
58. Liu J, Li C, Chen Y, Lv X, Lv Y, Zhou J, et al. Diagnostic Performance of Multiparametric MRI in the Evaluation of Treatment Response in Glioma Patients at 3T. J Magn Reson Imaging (2020) 51:1154–61. doi: 10.1002/jmri.26900
59. Park JE, Kim HS, Park KJ, Kim SJ, Kim JH, Smith SA. Pre- and Posttreatment Glioma: Comparison of Amide Proton Transfer Imaging With MR Spectroscopy for Biomarkers of Tumor Proliferation. Radiology (2016) 278:514–23. doi: 10.1148/radiol.2015142979
60. Park JE, Lee JY, Kim HS, Oh J-Y, Jung SC, Kim SJ, et al. Amide Proton Transfer Imaging Seems to Provide Higher Diagnostic Performance in Post-Treatment High-Grade Gliomas Than Methionine Positron Emission Tomography. Eur Radiol (2018) 28:3285–95. doi: 10.1007/s00330-018-5341-2
61. Park YW, Ahn SS, Kim EH, Kang S-G, Chang JH, Kim SH, et al. Differentiation of Recurrent Diffuse Glioma From Treatment-Induced Change Using Amide Proton Transfer Imaging: Incremental Value to Diffusion and Perfusion Parameters. Neuroradiology (2021) 63:363–72. doi: 10.1007/s00234-020-02542-5
62. Ma B, Blakeley JO, Hong X, Zhang H, Jiang S, Blair L, et al. Applying Amide Proton Transfer-Weighted MRI to Distinguish Pseudoprogression From True Progression in Malignant Gliomas. J Magn Reson Imaging (2016) 44:456–62. doi: 10.1002/jmri.25159
63. Meissner J, Korzowski A, Regnery S, Goerke S, Breitling J, Floca RO, et al. Early Response Assessment of Glioma Patients to Definitive Chemoradiotherapy Using Chemical Exchange Saturation Transfer Imaging at 7 T. J Magn Reson Imaging (2019) 50:1268–77. doi: 10.1002/jmri.26702
64. Paech D, Dreher C, Regnery S, Meissner JE, Goerke S, Windschuh J, et al. Relaxation-Compensated Amide Proton Transfer (APT) MRI Signal Intensity is Associated With Survival and Progression in High-Grade Glioma Patients. Eur Radiol (2019) 29:4957–67. doi: 10.1007/s00330-019-06066-2
65. Regnery S, Adeberg S, Dreher C, Oberhollenzer J, Meissner JE, Goerke S, et al. Chemical Exchange Saturation Transfer MRI Serves as Predictor of Early Progression in Glioblastoma Patients. Oncotarget (2018) 9:28772–83. doi: 10.18632/oncotarget.25594
66. McVicar N, Li AX, Gonçalves DF, Bellyou M, Meakin SO, Prado MA, et al. Quantitative Tissue Ph Measurement During Cerebral Ischemia Using Amine and Amide Concentration-Independent Detection (AACID) With MRI. J Cereb Blood Flow Metab (2014) 34:690–8. doi: 10.1038/jcbfm.2014.12
67. Harris RJ, Cloughesy TF, Liau LM, Nghiemphu PL, Lai A, Pope WB, et al. Simulation, Phantom Validation, and Clinical Evaluation of Fast pH-Weighted Molecular Imaging Using Amine Chemical Exchange Saturation Transfer Echo Planar Imaging (CEST-EPI) in Glioma at 3 T. NMR BioMed (2016) 29:1563–76. doi: 10.1002/nbm.3611
68. McVicar N, Li AX, Meakin SO, Bartha R. Imaging Chemical Exchange Saturation Transfer (CEST) Effects Following Tumor-Selective Acidification Using Lonidamine. NMR BioMed (2015) 28:566–75. doi: 10.1002/nbm.3287
69. Yao J, Tan CHP, Schlossman J, Chakhoyan A, Raymond C, Pope WB, et al. pH-Weighted Amine Chemical Exchange Saturation Transfer Echoplanar Imaging (CEST-EPI) as a Potential Early Biomarker for Bevacizumab Failure in Recurrent Glioblastoma. J Neurooncol (2019) 142:587–95. doi: 10.1007/s11060-019-03132-z
70. Harris RJ, Cloughesy TF, Liau LM, Prins RM, Antonios JP, Li D, et al. pH-Weighted Molecular Imaging of Gliomas Using Amine Chemical Exchange Saturation Transfer MRI. Neuro Oncol (2015) 17:1514–24. doi: 10.1093/neuonc/nov106
71. Herz K, Mueller S, Perlman O, Zaitsev M, Knutsson L, Sun PZ, et al. Pulseq-CEST: Towards Multi-Site Multi-Vendor Compatibility and Reproducibility of CEST Experiments Using an Open-Source Sequence Standard. Magn Reson Med (2021) 86:1845–58. doi: 10.1002/mrm.28825
72. Speck O, Chang L, DeSilva NM, Ernst T. Perfusion MRI of the Human Brain With Dynamic Susceptibility Contrast: Gradient-Echo Versus Spin-Echo Techniques. J Magn Reson Imaging (2000) 12:381–7. doi: 10.1002/1522-2586(200009)12:3<381::AID-JMRI2>3.0.CO;2-Y
73. Kiselev VG, Strecker R, Ziyeh S, Speck O, Hennig J. Vessel Size Imaging in Humans. Magn Reson Med (2005) 53:553–63. doi: 10.1002/MRM.20383
74. Stadlbauer A, Oberndorfer S, Zimmermann M, Renner B, Buchfelder M, Heinz G, et al. Physiologic MR Imaging of the Tumor Microenvironment Revealed Switching of Metabolic Phenotype Upon Recurrence of Glioblastoma in Humans. J Cereb Blood Flow Metab (2020) 40:528–38. doi: 10.1177/0271678X19827885
76. Ouwerkerk R. Sodium Magnetic Resonance Imaging: From Research to Clinical Use. J Am Coll Radiol (2007) 4:739–41. doi: 10.1016/j.jacr.2007.07.001
77. Feinberg DA, Crooks LA, Kaufman L, Brant-Zawadzki M, Posin JP, Arakawa M, et al. Magnetic Resonance Imaging Performance: A Comparison of Sodium and Hydrogen. Radiology (1985) 156:133–8. doi: 10.1148/radiology.156.1.4001399
78. Biller A, Badde S, Nagel A, Neumann J-O, Wick W, Hertenstein A, et al. Improved Brain Tumor Classification by Sodium MR Imaging: Prediction of IDH Mutation Status and Tumor Progression. AJNR Am J Neuroradiol (2016) 37:66–73. doi: 10.3174/ajnr.A4493
79. Haneder S, Giordano FA, Konstandin S, Brehmer S, Buesing KA, Schmiedek P, et al. 23Na-MRI of Recurrent Glioblastoma Multiforme After Intraoperative Radiotherapy: Technical Note. Neuroradiology (2015) 57:321–6. doi: 10.1007/s00234-014-1468-2
80. Thulborn KR, Lu A, Atkinson IC, Pauliah M, Beal K, Chan TA, et al. Residual Tumor Volume, Cell Volume Fraction, and Tumor Cell Kill During Fractionated Chemoradiation Therapy of Human Glioblastoma Using Quantitative Sodium MR Imaging. Clin Cancer Res (2019) 25:1226–32. doi: 10.1158/1078-0432.CCR-18-2079
81. Paech D, Regnery S, Platt T, Behl NGR, Weckesser N, Windisch P, et al. Assessment of Sodium MRI at 7 Tesla as Predictor of Therapy Response and Survival in Glioblastoma Patients. Front Neurosci (2021) 15:1649. doi: 10.3389/fnins.2021.782516
82. Suh CH, Kim HS, Jung SC, Choi CG, Kim SJ. Multiparametric MRI as a Potential Surrogate Endpoint for Decision-Making in Early Treatment Response Following Concurrent Chemoradiotherapy in Patients With Newly Diagnosed Glioblastoma: A Systematic Review and Meta-Analysis. Eur Radiol (2018) 28:2628–38. doi: 10.1007/s00330-017-5262-5
83. Lundemann M, Munck af Rosenschöld P, Muhic A, Larsen VA, Poulsen HS, Engelholm S-A, et al. Feasibility of Multi-Parametric PET and MRI for Prediction of Tumour Recurrence in Patients With Glioblastoma. Eur J Nucl Med Mol Imaging (2019) 46:603–13. doi: 10.1007/s00259-018-4180-3
84. Galbán CJ, Chenevert TL, Meyer CR, Tsien C, Lawrence TS, Hamstra DA, et al. Prospective Analysis of Parametric Response Map–Derived MRI Biomarkers: Identification of Early and Distinct Glioma Response Patterns Not Predicted by Standard Radiographic Assessment. Clin Cancer Res (2011) 17:4751–60. doi: 10.1158/1078-0432.CCR-10-2098
85. Seeger A, Braun C, Skardelly M, Paulsen F, Schittenhelm J, Ernemann U, et al. Comparison of Three Different MR Perfusion Techniques and MR Spectroscopy for Multiparametric Assessment in Distinguishing Recurrent High-Grade Gliomas From Stable Disease. Acad Radiol (2013) 20:1557–65. doi: 10.1016/j.acra.2013.09.003
86. Park JE, Kim HS, Goh MJ, Kim SJ, Kim JH. Pseudoprogression in Patients With Glioblastoma: Assessment by Using Volume-Weighted Voxel-Based Multiparametric Clustering of MR Imaging Data in an Independent Test Set. Radiology (2015) 275:792–802. doi: 10.1148/radiol.14141414
87. Hu X, Wong KK, Young GS, Guo L, Wong ST. Support Vector Machine Multiparametric MRI Identification of Pseudoprogression From Tumor Recurrence in Patients With Resected Glioblastoma. J Magn Reson Imaging (2011) 33:296–305. doi: 10.1002/jmri.22432
88. Yan J-L, Li C, van der Hoorn A, Boonzaier NR, Matys T, Price SJ. A Neural Network Approach to Identify the Peritumoral Invasive Areas in Glioblastoma Patients by Using MR Radiomics. Sci Rep (2020) 10:9748. doi: 10.1038/s41598-020-66691-6
89. Kim M, Park JE, Kim HS, Kim N, Park SY, Kim Y-H, et al. Spatiotemporal Habitats From Multiparametric Physiologic MRI Distinguish Tumor Progression From Treatment-Related Change in Post-Treatment Glioblastoma. Eur Radiol (2021) 31:6374–83. doi: 10.1007/s00330-021-07718-y
90. d’Este SH, Nielsen MB, Hansen AE. Visualizing Glioma Infiltration by the Combination of Multimodality Imaging and Artificial Intelligence, a Systematic Review of the Literature. Diagnostics (2021) 11:592. doi: 10.3390/diagnostics11040592
91. Booth TC, Williams M, Luis A, Cardoso J, Ashkan K, Shuaib H. Machine Learning and Glioma Imaging Biomarkers. Clin Radiol (2020) 75:20–32. doi: 10.1016/j.crad.2019.07.001
92. Laudicella R, Quartuccio N, Argiroffi G, Alongi P, Baratto L, Califaretti E, et al. Unconventional Non-Amino Acidic PET Radiotracers for Molecular Imaging in Gliomas. Eur J Nucl Med Mol Imaging (2021) 48:3925–39. doi: 10.1007/s00259-021-05352-w
93. Moreau A, Febvey O, Mognetti T, Frappaz D, Kryza D. Contribution of Different Positron Emission Tomography Tracers in Glioma Management: Focus on Glioblastoma. Front Oncol (2019) 9:1134. doi: 10.3389/fonc.2019.01134
94. Drake LR, Hillmer AT, Cai Z. Approaches to PET Imaging of Glioblastoma. Molecules (2020) 25:568. doi: 10.3390/molecules25030568
95. Werner J-M, Lohmann P, Fink GR, Langen K-J, Galldiks N. Current Landscape and Emerging Fields of PET Imaging in Patients With Brain Tumors. Molecules (2020) 25:1471. doi: 10.3390/molecules25061471
96. de Zwart PL, van Dijken BRJ, Holtman GA, Stormezand GN, Dierckx RAJO, Jan van Laar P, et al. Diagnostic Accuracy of PET Tracers for the Differentiation of Tumor Progression From Treatment-Related Changes in High-Grade Glioma: A Systematic Review and Metaanalysis. J Nucl Med (2020) 61:498–504. doi: 10.2967/jnumed.119.233809
97. Cui M, Zorrilla-Veloz RI, Hu J, Guan B, Ma X. Diagnostic Accuracy of PET for Differentiating True Glioma Progression From Post Treatment-Related Changes: A Systematic Review and Meta-Analysis. Front Neurol (2021) 12:671867. doi: 10.3389/fneur.2021.671867
98. Law I, Albert NL, Arbizu J, Boellaard R, Drzezga A, Galldiks N, et al. Joint EANM/EANO/RANO Practice Guidelines/SNMMI Procedure Standards for Imaging of Gliomas Using PET With Radiolabelled Amino Acids and [18F]FDG: Version 1.0. Eur J Nucl Med Mol Imaging (2019) 46:540–57. doi: 10.1007/s00259-018-4207-9
99. Albert NL, Weller M, Suchorska B, Galldiks N, Soffietti R, Kim MM, et al. Response Assessment in Neuro-Oncology Working Group and European Association for Neuro-Oncology Recommendations for the Clinical Use of PET Imaging in Gliomas. Neuro Oncol (2016) 18:1199–208. doi: 10.1093/neuonc/now058
100. Stegmayr C, Schöneck M, Oliveira D, Willuweit A, Filss C, Galldiks N, et al. Reproducibility of O-(2-18F-Fluoroethyl)-L-Tyrosine Uptake Kinetics in Brain Tumors and Influence of Corticoid Therapy: An Experimental Study in Rat Gliomas. Eur J Nucl Med Mol Imaging (2016) 43:1115–23. doi: 10.1007/s00259-015-3274-4
101. Suchorska B, Jansen NL, Linn J, Kretzschmar H, Janssen H, Eigenbrod S, et al. Biological Tumor Volume in 18FET-PET Before Radiochemotherapy Correlates With Survival in GBM. Neurology (2015) 84:710–9. doi: 10.1212/WNL.0000000000001262
102. Galldiks N, Dunkl V, Ceccon G, Tscherpel C, Stoffels G, Law I, et al. Early Treatment Response Evaluation Using FET PET Compared to MRI in Glioblastoma Patients at First Progression Treated With Bevacizumab Plus Lomustine. Eur J Nucl Med Mol Imaging (2018) 45:2377–86. doi: 10.1007/s00259-018-4082-4
103. Henriksen OM, Marner L, Law I. Clinical PET/MR Imaging in Dementia and Neuro-Oncology. PET Clin (2016) 11:441–52. doi: 10.1016/j.cpet.2016.05.003
104. Henriksen OM, Larsen VA, Muhic A, Hansen AE, Larsson HBW, Poulsen HS, et al. Simultaneous Evaluation of Brain Tumour Metabolism, Structure and Blood Volume Using [18F]-Fluoroethyltyrosine (FET) PET/MRI: Feasibility, Agreement and Initial Experience. Eur J Nucl Med Mol Imaging (2016) 43:103–12. doi: 10.1007/s00259-015-3183-6
105. Pyatigorskaya N, Sgard B, Bertaux M, Yahia-Cherif L, Kas A. Can FDG-PET/MR Help to Overcome Limitations of Sequential MRI and PET-FDG for Differential Diagnosis Between Recurrence/Progression and Radionecrosis of High-Grade Gliomas? J Neuroradiol (2021) 48:189–94. doi: 10.1016/j.neurad.2020.08.003
106. Pyka T, Hiob D, Preibisch C, Gempt J, Wiestler B, Schlegel J, et al. Diagnosis of Glioma Recurrence Using Multiparametric Dynamic 18F-Fluoroethyl-Tyrosine PET-MRI. Eur J Radiol (2018) 103:32–7. doi: 10.1016/j.ejrad.2018.04.003
107. Sogani S, Jena A, Taneja S, Gambhir A, Mishra A, D’Souza M, et al. Potential for Differentiation of Glioma Recurrence From Radionecrosis Using Integrated 18 F-Fluoroethyl-L-Tyrosine (FET) Positron Emission Tomography/Magnetic Resonance Imaging: A Prospective Evaluation. Neurol India (2017) 65:293–301. doi: 10.4103/neuroindia.NI_101_16
108. Jena A, Taneja S, Gambhir A, Mishra AK, D’souza MM, Verma SM, et al. Glioma Recurrence Versus Radiation Necrosis. Clin Nucl Med (2016) 41:e228–36. doi: 10.1097/RLU.0000000000001152
109. Panagiotaki E, Walker-Samuel S, Siow B, Johnson SP, Rajkumar V, Pedley RB, et al. Noninvasive Quantification of Solid Tumor Microstructure Using VERDICT MRI. Cancer Res (2014) 74:1902–12. doi: 10.1158/0008-5472.CAN-13-2511
110. Booth TC, Larkin TJ, Yuan Y, Kettunen MI, Dawson SN, Scoffings D, et al. Analysis of Heterogeneity in T2-Weighted MR Images can Differentiate Pseudoprogression From Progression in Glioblastoma. PloS One (2017) 12:e0176528. doi: 10.1371/journal.pone.0176528
111. Kassner A, Thornhill RE. Texture Analysis: A Review of Neurologic MR Imaging Applications. AJNR Am J Neuroradiol (2010) 31:809–16. doi: 10.3174/ajnr.A2061
112. Cagney DN, Sul J, Huang RY, Ligon KL, Wen PY, Alexander BM. The FDA NIH Biomarkers, EndpointS, and Other Tools (BEST) Resource in Neuro-Oncology. Neuro Oncol (2018) 20:1162–72. doi: 10.1093/neuonc/nox242
113. Bzdok D, Altman N, Krzywinski M. Statistics Versus Machine Learning. Nat Methods (2018) 15:233–4. doi: 10.1038/nmeth.4642
114. Booth TC, Thompson G, Bulbeck H, Boele F, Buckley C, Cardoso J, et al. A Position Statement on the Utility of Interval Imaging in Standard of Care Brain Tumour Management: Defining the Evidence Gap and Opportunities for Future Research. Front Oncol (2021) 11:620070. doi: 10.3389/fonc.2021.620070
115. Tu JV. Advantages and Disadvantages of Using Artificial Neural Networks Versus Logistic Regression for Predicting Medical Outcomes. J Clin Epidemiol (1996) 49:1225–31. doi: 10.1016/s0895-4356(96)00002-9
116. Reyes M, Meier R, Pereira S, Silva CA, Dahlweid F-M, von Tengg-Kobligk H, et al. On the Interpretability of Artificial Intelligence in Radiology: Challenges and Opportunities. Radiol Artif Intell (2020) 2:e190043. doi: 10.1148/ryai.2020190043
117. Dharmarajan K, Strait KM, Tinetti ME, Lagu T, Lindenauer PK, Lynn J, et al. Treatment for Multiple Acute Cardiopulmonary Conditions in Older Adults Hospitalized With Pneumonia, Chronic Obstructive Pulmonary Disease, or Heart Failure. J Am Geriatr Soc (2016) 64:1574–82. doi: 10.1111/jgs.14303
118. Cabitza F, Rasoini R, Gensini GF. Unintended Consequences of Machine Learning in Medicine. JAMA (2017) 318:517–8. doi: 10.1001/jama.2017.7797
119. White H. Learning in Artificial Neural Networks: A Statistical Perspective. Neural Comput (1989) 1:425–64. doi: 10.1162/neco.1989.1.4.425
120. Ratib O, Rosset A, Heuberger J. Open Source Software and Social Networks: Disruptive Alternatives for Medical Imaging. Eur J Radiol (2011) 78:259–65. doi: 10.1016/j.ejrad.2010.05.004
121. Medical Open Network for AI (MONAI). Available at: https://monai.io/ (Accessed 30 Dec 2020).
122. Booth TC, Akpinar B, Roman A, Shuaib H, Luis A, Chelliah A, et al. Machine Learning and Glioblastoma: Treatment Response Monitoring Biomarkers in 2021. In: Kia SM, et al. Machine Learning in Clinical Neuroimaging and Radiogenomics in Neuro-Oncology. MLCN 2020, RNO-AI 2020. Lecture Notes in Computer Science, vol 12449. Cham: Springer (2021). doi:10.1007/978-3-030-66843-3_21
123. Booth TC, Grzeda M, Chelliah A, Roman A, Al Busaidi A, Dragos C, et al. Imaging Biomarkers of Glioblastoma Treatment Response: A Systematic Review and Meta-Analysis of Recent Machine Learning Studies. Front Oncol (2022) 12:799662. doi: 10.3389/fonc.2022.799662
124. Hestness J, Narang S, Ardalani N, Diamos G, Jun H, Kianinejad H, et al. Deep Learning Scaling is Predictable, Empirically. arXiv (2017).
125. Sun C, Shrivastava A, Singh S, Gupta A. Revisiting Unreasonable Effectiveness of Data in Deep Learning Era. arXiv (2017).
126. Lei S, Zhang H, Wang K, Su Z. How Training Data Affect the Accuracy and Robustness of Neural Networks for Image Classification In: Proc 2019 Int Conf Learn Represent (ICLR-2019). New Orleans, USA (2019). Available at: https://openreview.net/pdf?id=HklKWhC5F7.
127. Rudie JD, Rauschecker AM, Bryan RN, Davatzikos C, Mohan S. Emerging Applications of Artificial Intelligence in Neuro-Oncology. Radiology (2019) 290:607–18. doi: 10.1148/radiol.2018181928
128. Sotoudeh H, Shafaat O, Bernstock JD, Brooks MD, Elsayed GA, Chen JA, et al. Artificial Intelligence in the Management of Glioma: Era of Personalized Medicine. Front Oncol (2019) 9:768. doi: 10.3389/fonc.2019.00768
129. Paul A, Tang Y-X, Summers RM. Fast Few-Shot Transfer Learning for Disease Identification From Chest X-Ray Images Using Autoencoder Ensemble. In: Hahn HK, Mazurowski MA, editors. Proc. SPIE Medical Imaging 2020: Computer-Aided Diagnosis. Houston, USA (2020). Available at: https://www.spiedigitallibrary.org/conference-proceedings-of-spie/11314/2549060/Fast-few-shot-transfer-learning-for-disease-identification-from-chest/10.1117/12.2549060.short?SSO=1 (Accessed 18 Apr 2021).
130. Bonawitz K, Eichner H, Grieskamp W, Huba D, Ingerman A, Ivanov V, et al. Towards Federated Learning at Scale: System Design. arXiv (2019).
131. Brisimi TS, Chen R, Mela T, Olshevsky A, Paschalidis IC, Shi W. Federated Learning of Predictive Models From Federated Electronic Health Records. Int J Med Inform (2018) 112:59–67. doi: 10.1016/j.ijmedinf.2018.01.007
132. Li W, Milletarì F, Xu D, Rieke N, Hancox J, Zhu W, et al. Privacy-Preserving Federated Brain Tumour Segmentation. In: Suk HI, Liu M, Yan P, Lian C, editors. Machine Learning in Medical Imaging. MLMI 2019. Lecture Notes in Computer Science. (2019). Cham: Springer. vol 11861. doi: 10.1007/978-3-030-32692-0_16
133. Artzi M, Liberman G, Blumenthal DT, Bokstein F, Aizenstein O, Ben Bashat D. Repeatability of Dynamic Contrast Enhanced Vp Parameter in Healthy Subjects and Patients With Brain Tumors. J Neurooncol (2018) 140:727–37. doi: 10.1007/s11060-018-03006-w
134. Anzalone N, Castellano A, Cadioli M, Conte GM, Cuccarini V, Bizzi A, et al. Brain Gliomas: Multicenter Standardized Assessment of Dynamic Contrast-Enhanced and Dynamic Susceptibility Contrast MR Images. Radiology (2018) 287:933–43. doi: 10.1148/radiol.2017170362
135. Schmainda KM, Prah MA, Marques H, Kim E, Barboriak DP, Boxerman JL. Value of Dynamic Contrast Perfusion MRI to Predict Early Response to Bevacizumab in Newly Diagnosed Glioblastoma: Results From ACRIN 6686 Multicenter Trial. Neuro Oncol (2021) 23:314–23. doi: 10.1093/neuonc/noaa167
136. Quantitative Imaging Biomarkers Alliance. QIBA Profile: 4 DCE-MRI Quantification (DCEMRI-Q) (2017). Available at: http://qibawiki.rsna.org/index.php/Profiles (Accessed 30 July 2021).
137. Almeida JRC, Greenberg T, Lu H, Chase HW, Fournier J, Cooper CM, et al. Test-Retest Reliability of Cerebral Blood Flow in Healthy Individuals Using Arterial Spin Labeling: Findings From the EMBARC Study. Magn Reson Imaging (2018) 45:26–33. doi: 10.1016/j.mri.2017.09.004
138. Mutsaerts HJMM, van Osch MJP, Zelaya FO, Wang DJJ, Nordhøy W, Wang Y, et al. Multi-Vendor Reliability of Arterial Spin Labeling Perfusion MRI Using a Near-Identical Sequence: Implications for Multi-Center Studies. Neuroimage (2015) 113:143–52. doi: 10.1016/j.neuroimage.2015.03.043
139. Yamaguchi S, Hirata K, Okamoto M, Shimosegawa E, Hatazawa J, Hirayama R, et al. Determination of Brain Tumor Recurrence Using 11 C-Methionine Positron Emission Tomography After Radiotherapy. Cancer Sci (2021) 112:4246–56. doi: 10.1111/cas.15001
140. O’Connor JPB, Aboagye EO, Adams JE, Aerts HJWL, Barrington SF, Beer AJ, et al. Imaging Biomarker Roadmap for Cancer Studies. Nat Rev Clin Oncol (2017) 14:169–86. doi: 10.1038/nrclinonc.2016.162
141. Wen PY, Macdonald DR, Reardon DA, Cloughesy TF, Sorensen AG, Galanis E, et al. Updated Response Assessment Criteria for High-Grade Gliomas: Response Assessment in Neuro-Oncology Working Group. J Clin Oncol (2010) 28:1963–72. doi: 10.1200/JCO.2009.26.3541
142. Ellingson BM, Wen PY, Cloughesy TF. Modified Criteria for Radiographic Response Assessment in Glioblastoma Clinical Trials. Neurotherapeutics (2017) 14:307–20. doi: 10.1007/s13311-016-0507-6
143. Ellingson BM, Bendszus M, Boxerman J, Barboriak D, Erickson BJ, Smits M, et al. Consensus Recommendations for a Standardized Brain Tumor Imaging Protocol in Clinical Trials. Neuro Oncol (2015) 17:1188–98. doi: 10.1093/neuonc/nov095
144. Wen PY, Weller M, Lee EQ, Alexander BM, Barnholtz-Sloan JS, Barthel FP, et al. Glioblastoma in Adults: A Society for Neuro-Oncology (SNO) and European Society of Neuro-Oncology (EANO) Consensus Review on Current Management and Future Directions. Neuro Oncol (2020) 22:1073–113. doi: 10.1093/neuonc/noaa106
145. Weller M, van den Bent M, Preusser M, Le Rhun E, Tonn JC, Minniti G, et al. EANO Guidelines on the Diagnosis and Treatment of Diffuse Gliomas of Adulthood. Nat Rev Clin Oncol (2021) 18:170–86. doi: 10.1038/s41571-020-00447-z
146. Weller M, van den Bent M, Tonn JC, Stupp R, Preusser M, Cohen-Jonathan-Moyal E, et al. European Association for Neuro-Oncology (EANO) Guideline on the Diagnosis and Treatment of Adult Astrocytic and Oligodendroglial Gliomas. Lancet Oncol (2017) 18:e315–29. doi: 10.1016/S1470-2045(17)30194-8
147. Thust SC, Heiland S, Falini A, Jäger HR, Waldman AD, Sundgren PC, et al. Glioma Imaging in Europe: A Survey of 220 Centres and Recommendations for Best Clinical Practice. Eur Radiol (2018) 28:3306–17. doi: 10.1007/s00330-018-5314-5
148. Dickerson E, Srinivasan A. Multicenter Survey of Current Practice Patterns in Perfusion MRI in Neuroradiology: Why, When, and How Is It Performed? Am J Roentgenol (2016) 207:406–10. doi: 10.2214/AJR.15.15740
149. Erker C, Tamrazi B, Poussaint TY, Mueller S, Mata-Mbemba D, Franceschi E, et al. Response Assessment in Paediatric High-Grade Glioma: Recommendations From the Response Assessment in Pediatric Neuro-Oncology (RAPNO) Working Group. Lancet Oncol (2020) 21:e317–29. doi: 10.1016/S1470-2045(20)30173-X
150. Manfrini E, Smits M, Thust S, Geiger S, Bendella Z, Petr J, et al. From Research to Clinical Practice: A European Neuroradiological Survey on Quantitative Advanced MRI Implementation. Eur Radiol (2021) 31:6334–41. doi: 10.1007/s00330-020-07582-2
151. Mandonnet E, Wager M, Almairac F, Baron M-H, Blonski M, Freyschlag CF, et al. Survey on Current Practice Within the European Low-Grade Glioma Network: Where do We Stand and What is the Next Step? Neurooncol Pract (2017) 4:241–7. doi: 10.1093/nop/npw031
152. Freyschlag CF, Krieg SM, Kerschbaumer J, Pinggera D, Forster M-T, Cordier D, et al. Imaging Practice in Low-Grade Gliomas Among European Specialized Centers and Proposal for a Minimum Core of Imaging. J Neurooncol (2018) 139:699–711. doi: 10.1007/s11060-018-2916-3
Keywords: high-grade glioma, glioblastoma, treatment response, monitoring biomarker, MRI, spectroscopy, CEST, radiomics
Citation: Booth TC, Wiegers EC, Warnert EAH, Schmainda KM, Riemer F, Nechifor RE, Keil VC, Hangel G, Figueiredo P, Álvarez-Torres MDM and Henriksen OM (2022) High-Grade Glioma Treatment Response Monitoring Biomarkers: A Position Statement on the Evidence Supporting the Use of Advanced MRI Techniques in the Clinic, and the Latest Bench-to-Bedside Developments. Part 2: Spectroscopy, Chemical Exchange Saturation, Multiparametric Imaging, and Radiomics. Front. Oncol. 11:811425. doi: 10.3389/fonc.2021.811425
Received: 08 November 2021; Accepted: 28 December 2021;
Published: 28 February 2022.
Edited by:
Nico Sollmann, University of California, San Francisco, United StatesReviewed by:
Giuseppe Barisano, University of Southern California, United StatesDaniel Paech, University Hospital Bonn, Germany
Copyright © 2022 Booth, Wiegers, Warnert, Schmainda, Riemer, Nechifor, Keil, Hangel, Figueiredo, Álvarez-Torres and Henriksen. This is an open-access article distributed under the terms of the Creative Commons Attribution License (CC BY). The use, distribution or reproduction in other forums is permitted, provided the original author(s) and the copyright owner(s) are credited and that the original publication in this journal is cited, in accordance with accepted academic practice. No use, distribution or reproduction is permitted which does not comply with these terms.
*Correspondence: Thomas C. Booth, dG9tYm9vdGhAZG9jdG9ycy5vcmcudWs=