 Nan Wang1
 Srinivas Gaddam2
 Yibin Xie1
 Anthony G. Christodoulou1,3
 Chaowei Wu1,3
 Sen Ma1
 Zhaoyang Fan1,4
 Lixia Wang1
 Simon Lo2
 Andrew E. Hendifar5
 Stephen J. Pandol2
 Debiao Li1,3*
- 1Biomedical Imaging Research Institute, Cedars-Sinai Medical Center, Los Angeles, CA, United States
- 2The Karsh Division of Gastroenterology and Hepatology, Cedars Sinai Medical Center, Los Angeles, CA, United States
- 3Bioengineering Department, University of California, Los Angeles, Los Angeles, CA, United States
- 4Department of Radiology, Keck School of Medicine, University of Southern California, Los Angeles, Los Angeles, CA, United States
- 5Samuel Oschin Comprehensive Cancer Center, Cedars-Sinai Medical Center, Los Angeles, CA, United States
Background and aims: Accurate differentiation of chronic pancreatitis (CP) and pancreatic ductal adenocarcinoma (PDAC) is an area of unmet clinical need. In this study, a novel Multitasking dynamic contrast enhanced (DCE) magnetic resonance imaging (MRI) technique was used to quantitatively evaluate the microcirculation properties of pancreas in CP and PDAC and differentiate between them.
Methods: The Multitasking DCE technique was able to acquire one 3D image per second during the passage of MRI contrast agent, allowing the quantitative estimation of microcirculation properties of tissue, including blood flow Fp, plasma volume fraction vp, transfer constant Ktrans, and extravascular extracellular volume fraction ve. Receiver operating characteristic (ROC) analysis was performed to differentiate the CP pancreas, PDAC pancreas, normal control pancreas, PDAC tumor, PDAC upstream, and PDAC downstream. ROCs from quantitative analysis and conventional analysis were compared.
Results: Fourteen PDAC patients, 8 CP patients and 20 healthy subjects were prospectively recruited. The combination of Fp, vp, Ktrans, and ve can differentiate CP versus PDAC pancreas with good AUC (AUC [95% CI] = 0.821 [0.654 – 0.988]), CP versus normal pancreas with excellent AUC (1.000 [1.000 – 1.000]), PDAC pancreas versus normal pancreas with excellent AUC (1.000 [1.000 – 1.000]), CP versus PDAC tumor with excellent AUC (1.000 [1.000 – 1.000]), CP versus PDAC downstream with excellent AUC (0.917 [0.795 – 1.000]), and CP versus PDAC upstream with fair AUC (0.722 [0.465 – 0.980]). This quantitative analysis outperformed conventional analysis in differentiation of each pair.
Conclusion: Multitasking DCE MRI is a promising clinical tool that is capable of unbiased quantitative differentiation between CP from PDAC.
Introduction
Pancreatic ductal adenocarcinoma (PDAC) is the third most common cause of cancer-related death in the United States with a poor 5-year survival rate of 9% (1). Currently the only curative treatment for PDAC is complete tumor resection, often in conjugation with adjuvant chemotherapy (2), where an accurate diagnosis at early stage is a prerequisite. Chronic pancreatitis is a fibrotic reaction of the pancreatic connective tissue due to an ongoing inflammation that can damage both endocrine and exocrine pancreas (3). The most worrisome complication of CP is the increased risk for developing PDAC, which can be 2.3 -18.5 folds higher (4–7). On the other hand, 10-20% of CP cases can be mass forming and mimic PDAC, which may cause misdiagnosis and overtreatment (8). PDAC is also likely to be associated with chronic obstructive pancreatitis in the upstream portion of the pancreas as a result of main pancreatic ductal obstruction by tumor (9).
Accurate differentiation of PDAC from CP is of great clinical importance for timely and precise treatment. However, this continues to be a challenging area due to the shared clinical signs, radiologic features, and morphologic appearance of the two diseases (10–13). Conventional imaging techniques including endoscopic ultrasound (EUS), PET/CT, and MRI cannot differentiate well between early PDAC and CP as the typical imaging features of CP (generalized parenchymal glandular atrophy, diffuse pancreatic calcifications, and dilation of the main pancreatic duct) can often be seen in PDAC (14, 15), resulting in reduced diagnostic accuracy. Even a fine needle biopsy (FNB) can be unreliable in this situation (16–18). This may result in further delay of diagnosis and treatment of PDAC or unnecessary surgery and exposure to complications of CP (11, 19).
In recent years, dynamic contrast enhanced (DCE) magnetic resonance imaging (MRI) has been an emerging tool for the clinical diagnosis of PDAC. Investigational studies also showed that DCE MRI may have a promising role in the diagnosis of CP and the differentiation of CP versus PDAC (20–23). It acquires a series of T1-weighted images during the injection and passage of gadolinium (Gd)-based contrast agent (CA). The changes of the signal intensity reflect the CA distribution within the tissue and the underlying microcirculation properties such as tissue blood flow, microvascular density, permeability, and extravascular extracellular space distribution. These microcirculation properties contain crucial information about disease characteristics, progression, and regression, and can be used for diagnosis and therapy monitoring (23–25).
However, DCE MRI has yet to fully realize its potential in the imaging of pancreas due to demanding technical challenges. Existing techniques cannot achieve adequate coverage and high spatiotemporal resolution at the same time. In clinical practice, T1-weighted images are usually acquired for four to six phases during the CA passage (referred as multi-phase MRI) (22, 26, 27), and each phase takes 15-20 seconds. In addition, the presence of respiratory motion and the need to hold breath makes the time intervals even larger, which is insufficient to quantify the microcirculation properties. Consequently, current diagnosis relies only on the morphological information of the pre- and post-contrast images, which are subject to coil positioning, and inter-scanner and inter-reader variability given its qualitative nature.
To overcome these limitations, our research group has developed a quantitative Multitasking DCE MRI technique (28) that has shown promise in the characterization of carotid atherosclerosis (29), PDAC (30), and breast cancer (31). Specifically for pancreas, this technique allows free-breathing acquisition, coverage of the entire abdomen, clinically sufficient spatial resolution, 1-second temporal resolution (one 3D image per second). With the high temporal resolution, Multitasking DCE is able to capture the contrast agent kinetics within the tissues, and thus to quantitatively evaluate the microcirculation properties. Our prior work has preliminarily demonstrated that Multitasking DCE MRI can produce high-quality image with free-breathing acquisition and characterize PDAC tissues (30). In this study, we aim to quantitatively evaluate the microcirculation properties of pancreas in CP and PDAC using Multitasking DCE, and to distinguish them with the quantitative parameters on an objective basis.
Materials and methods
Study population
The prospective study was approved by the local institutional review board and written informed consent was obtained from all participating subjects before the research imaging studies. The study was performed from February 2018 to June 2019 with PDAC patients, CP patients, and healthy volunteers. Among them, nineteen patients with PDAC, which was confirmed by histopathology obtained by EUS-guided FNB, were recruited to the study. All the PDAC patients received clinical CT within 1 week before the research MRI and were undergoing neoadjuvant chemotherapy at the time of the study. Patients were excluded for the following reasons: 1) prior surgical resections of PDAC; 2) intolerance to Gd-based contrast agent. Eight patients with definitive CP were recruited from an NIH-sponsored prospective cohort of patients with pancreatic disease (32). The inclusionary criteria were the clinical diagnosis of unequivocal CP (Cambridge grade >3). All these images were reviewed and confirmed to be CP by a radiologist as part of the PROCEED study (NCT03099850) (32). Healthy volunteers without a history of pancreas diseases or family history of pancreatic cancer were recruited as the normal control group. Subjects with noticeable pancreatic abnormality were excluded from the final analysis.
MRI experiments
All subjects received the research MRI imaging on a 3-Tesla clinical MRI scanner (Biograph mMR, Siemens Medical Solutions, Erlangen, Germany) in head-first supine position with an 18-channel phase array surface coil. In the imaging session, a standard-of-care non-contrast protocol was first performed. It consisted of:
1) 3D T1-weighted gradient echo with Dixon fat suppression in axial orientation with parameters: 18-second breath-holding, flip angle = 9°, field of view (FOV) = 247 × 380 mm, acquisition matrix = 180 × 320, slice thickness = 3 mm, number of slices = 72.
2) Multi-slice T2-weighted single-shot turbo spin-echo in axial and coronal orientations with parameters: 42-second free-breathing, flip angle = 105°, FOV=226 × 330 mm, matrix =176 × 256, slice thickness = 5 mm, slice gap = 1 mm, number of slices = 46.
3) Multi-slice single-shot echo-planar diffusion-weighted imaging with parameters: 5-min free-breathing, b-values = 50, 400, and 800 s/mm2, FOV = 306 × 399 mm; matrix, 132 × 172, slice thickness = 6 mm, slice gap = 1 mm, number of slices = 50.
4) Multi-slice magnetic resonance cholangiopancreatography (MRCP): 10-min respiratory-triggering, flip angle = 100°, FOV = 300 × 300 mm, acquisition matrix = 384 × 384, slice thickness = 1 mm, number of slices = 80.
5) Multitasking DCE. It is a 10-min free-breathing acquisition of saturation-prepared gradient echo sequence with following parameters: saturation recovery time = 500 ms, flip angle = 10°, field of view (FOV) = 268 × 380 mm, acquisition matrix = 200 × 320, slice thickness = 3 mm, number of slices = 120. The Gd-based contrast agent (Gadavist, 0.1 mmol/kg, Bayer Schering Pharma) was administrated intravenously 3 minutes into the scan at a rate of 2 mL/s, followed by a 20 mL saline flush at the same rate. The reconstructed images have a temporal resolution of 1 second.
Detailed imaging parameters for the protocols are summarized in Table 1.
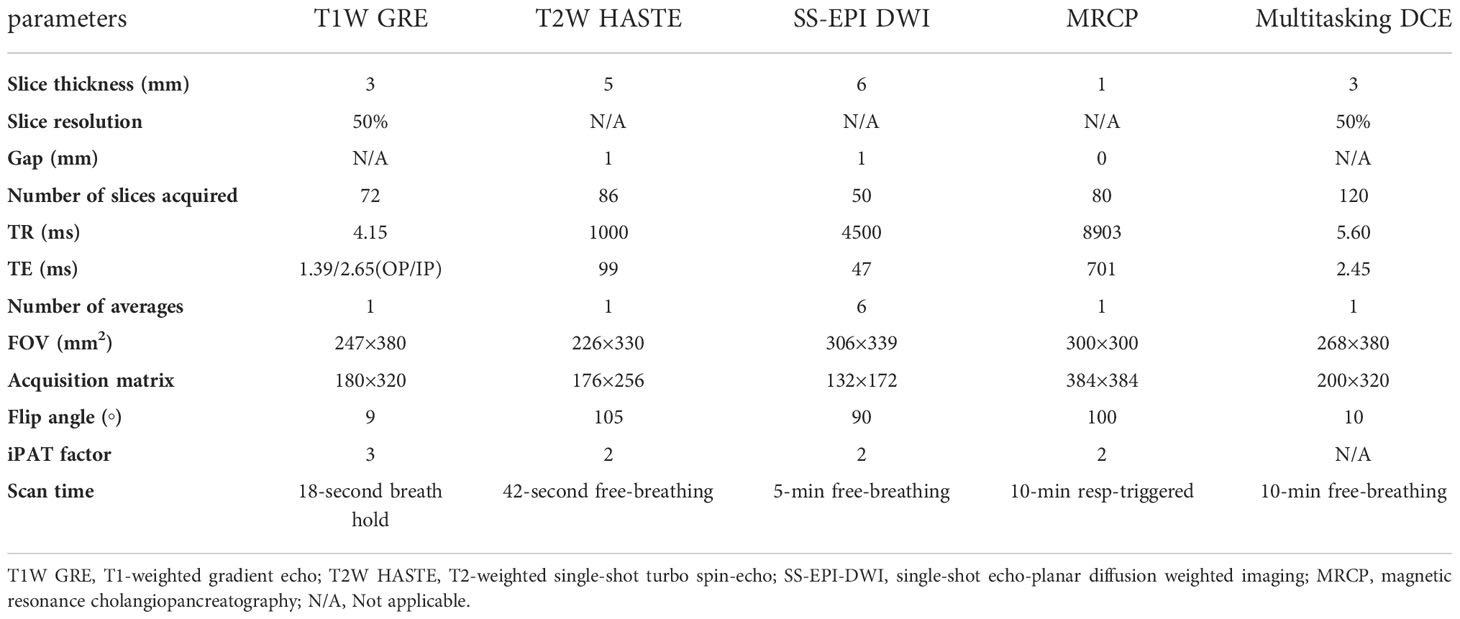
Table 1 List of imaging parameters.
Multitasking DCE reconstruction and quantitative DCE modeling
The reconstruction and quantitative analysis of Multitasking DCE images were processed off-line in MATLAB (R2018a, Mathworks, MA, USA). The details on the reconstruction have been described in Wang et al (30). In this work, the 3D Multitasking DCE images covering the entire abdomen were reconstructed at 6 respiratory states and the images of end-expiration were used for subsequent analysis. The reconstructed spatial resolution is 1.2 × 1.2 × 3.0 mm (3). The reconstructed temporal resolution is 1 second, leading to 600 dynamic T1 maps within the 10-minute acquisition.
With the dynamic T1 maps, the CA concentration can be directly calculated without approximation using the equation:
where Ct is the CA concentration in a certain tissue (any type of tissue within the FOV), td is the DCE time points from 0 to 10 minutes at an interval of 1 second, R1,t is the relaxation rate (1/T1,t) of the tissue, and γ= 4.0 L·mmol-1·s-1 is the relaxivity rate of Gadavist. The CA concentration in the arterial plasma Cp, termed as arterial input function (AIF), can also be derived using Equation 1.
With the CA concentration of plasma Cp and of the target tissue Ct, the two-compartment exchange model (33) was used to describe the contrast agent activities and estimate the microcirculation parameters including tissue plasma flow Fp, fractional plasma volume vp, transfer constant Ktrans, and extravascular extracellular faction ve. The microcirculation parameters were derived using following equations (31):
where * denotes convolution, and M, α, and β are intermediate variables. The plasma flow Fp and three intermediate parameters M, α, and β are first fitted from Cp and Ct using Equation 2. The vp, Ktrans, and ve are subsequently calculated using Equation 3.
Pancreas segmentation and image analysis
A radiologist (LW), who has 11-year clinical experience in the reading of abdominal MRIs and was blinded to the histopathological diagnosis, evaluated all the MRI images. The margin of the pancreas for all subjects were drawn manually on the Multitasking DCE images. For PDAC images, the tumor boundary was identified by cross-referencing the non-contrast MRI protocols of the same imaging session and the clinical contrast-enhanced CT images acquired within 1 week before the study. The region of interest (ROI) of PDAC tumor was then defined on multiple slices within the boundary of tumor avoiding edges and vessels. The ROI of pancreas upstream and downstream were defined subsequently, if applicable. The ROI of the PDAC pancreas was a combination of the ROIs of PDAC tumor, upstream (if any), and downstream (if any). For CP and normal control pancreas, the ROI was maximized within the pancreas margin. As a summary, six types of tissues were defined: 1) PDAC tumor, 2) PDAC upstream, 3) PDAC downstream, 4) PDAC pancreas, 5) CP pancreas, and 6) normal control pancreas. The microcirculation parameters reported for each type of tissue for each case were the average of all voxels within the ROI.
Statistical analysis
Statistical analysis was conducted in SPSS (Version 24, IBM, NY, USA). The descriptive statistics including mean and standard deviation (SD) were obtained for six type of tissues: PDAC pancreas, PDAC tumor, PDAC upstream, PDAC downstream, CP pancreas, and normal control pancreas. Analysis of variance (ANOVA) with Bonferroni correction was used to assess the multi-group comparison. The value of P< 0.05 was considered statistically significant. The performance of the microcirculation parameters in the differentiation of the tissues were assessed with receiver operating characteristic (ROC) analysis. The sensitivity, specificity, and area under the ROC curve (AUC) of each single microcirculation parameter and combination of all parameters were evaluated. An AUC of 0.5 to 0.6 suggests no discrimination, 0.6 to 0.7 is considered poor, 0.7 to 0.8 is fair, 0.8 to 0.9 is good, and > 0.9 is excellent (34).
Comparison of quantitative DCE analysis versus conventional time-signal intensity curve analysis
For clinical multi-phase MRI, quantitative microcirculation parameters are unavailable due to the small number of DCE phases acquired and the low temporal resolution. Under this circumstance, time-signal intensity curve (TIC) approach serves as an alternative way to analyze the CA dynamics (22). It classifies the shape of the time-signal intensity curves into several categories based on the time to the peak and the wash-out patterns, as shown in Supplementary Figure S1 in the supplementary materials. The enhancement patterns are useful to differentiate pathological tissues from normal. Zhang et al (22) reported that conventional multi-phase MRI with TIC analysis was able to differentiate mass-forming pancreatitis from PDAC. To compare the differentiation ability of the quantitative DCE analysis versus the TIC analysis, the high-temporal-resolution Multitasking DCE images were averaged to a temporal resolution of 18-second per phase and 6 key phases were chosen for analysis: pre-contrast, 18-second, 45-second, 75-second, 2.5-minute, 4-min post-contrast. The pattern of the signal intensity curves were classified into 5 types (18), as illustrated in Supplementary Figure S1A in the supplementary material: type I, a rapid rise to the peak at 18 s after injection; type II to V, a slower rise to a peak at 45s, 75s, 2.5 or 4 min after the injection, respectively. For each type of curve, two subtypes were defined based on the wash-out pattern (Supplementary Figure S1B): subtype-a, more than 10% signal decrease after reaching the peak; subtype-b, less than 10% signal decrease after the peak. Each tissue of each case was assigned to a category and the ROC analysis was performed to differentiate the tissues based on their categories. Subsequently, a significance test was performed to compare the AUC values produced by the ROC analysis using TIC versus using quantitative DCE approach according to DeLong test using MedCalc (MedCalc Software Ltd, Belgium).
Results
Demographics
The demographics of this study are summarized in Figure 1. Among the 19 PDAC patients, two of them had undergone surgery on the pancreas in the past. Additionally, two others were not able to receive MRI contrast agent. Finally, another one patient had excess bulk motion during the study, yielding unreadable MR images. These patients were excluded, and the final group included 14 PDAC patients (51 to 77 years old, 7 females). The mean size of the tumors, defined as the largest diameter in axial CT images according to RECIST 1.1 criteria31, was 3.9 cm, ranging from 1.6 cm to 6.7 cm. Six tumors were in the pancreatic head, three in the pancreatic neck, three in the pancreatic body, and two in the pancreatic tail. The PDAC downstream was measurable in 10 cases, while the PDAC upstream was measurable in 9 cases. A total of 8 CP patients (30 to 72 years old, 4 females) underwent MRI imaging. Upon review of the images, all of them met the Cambridge criteria for CP. In addition, a total of 20 healthy subjects (23 to 60 years old, 9 females) were included as normal control group in the study.
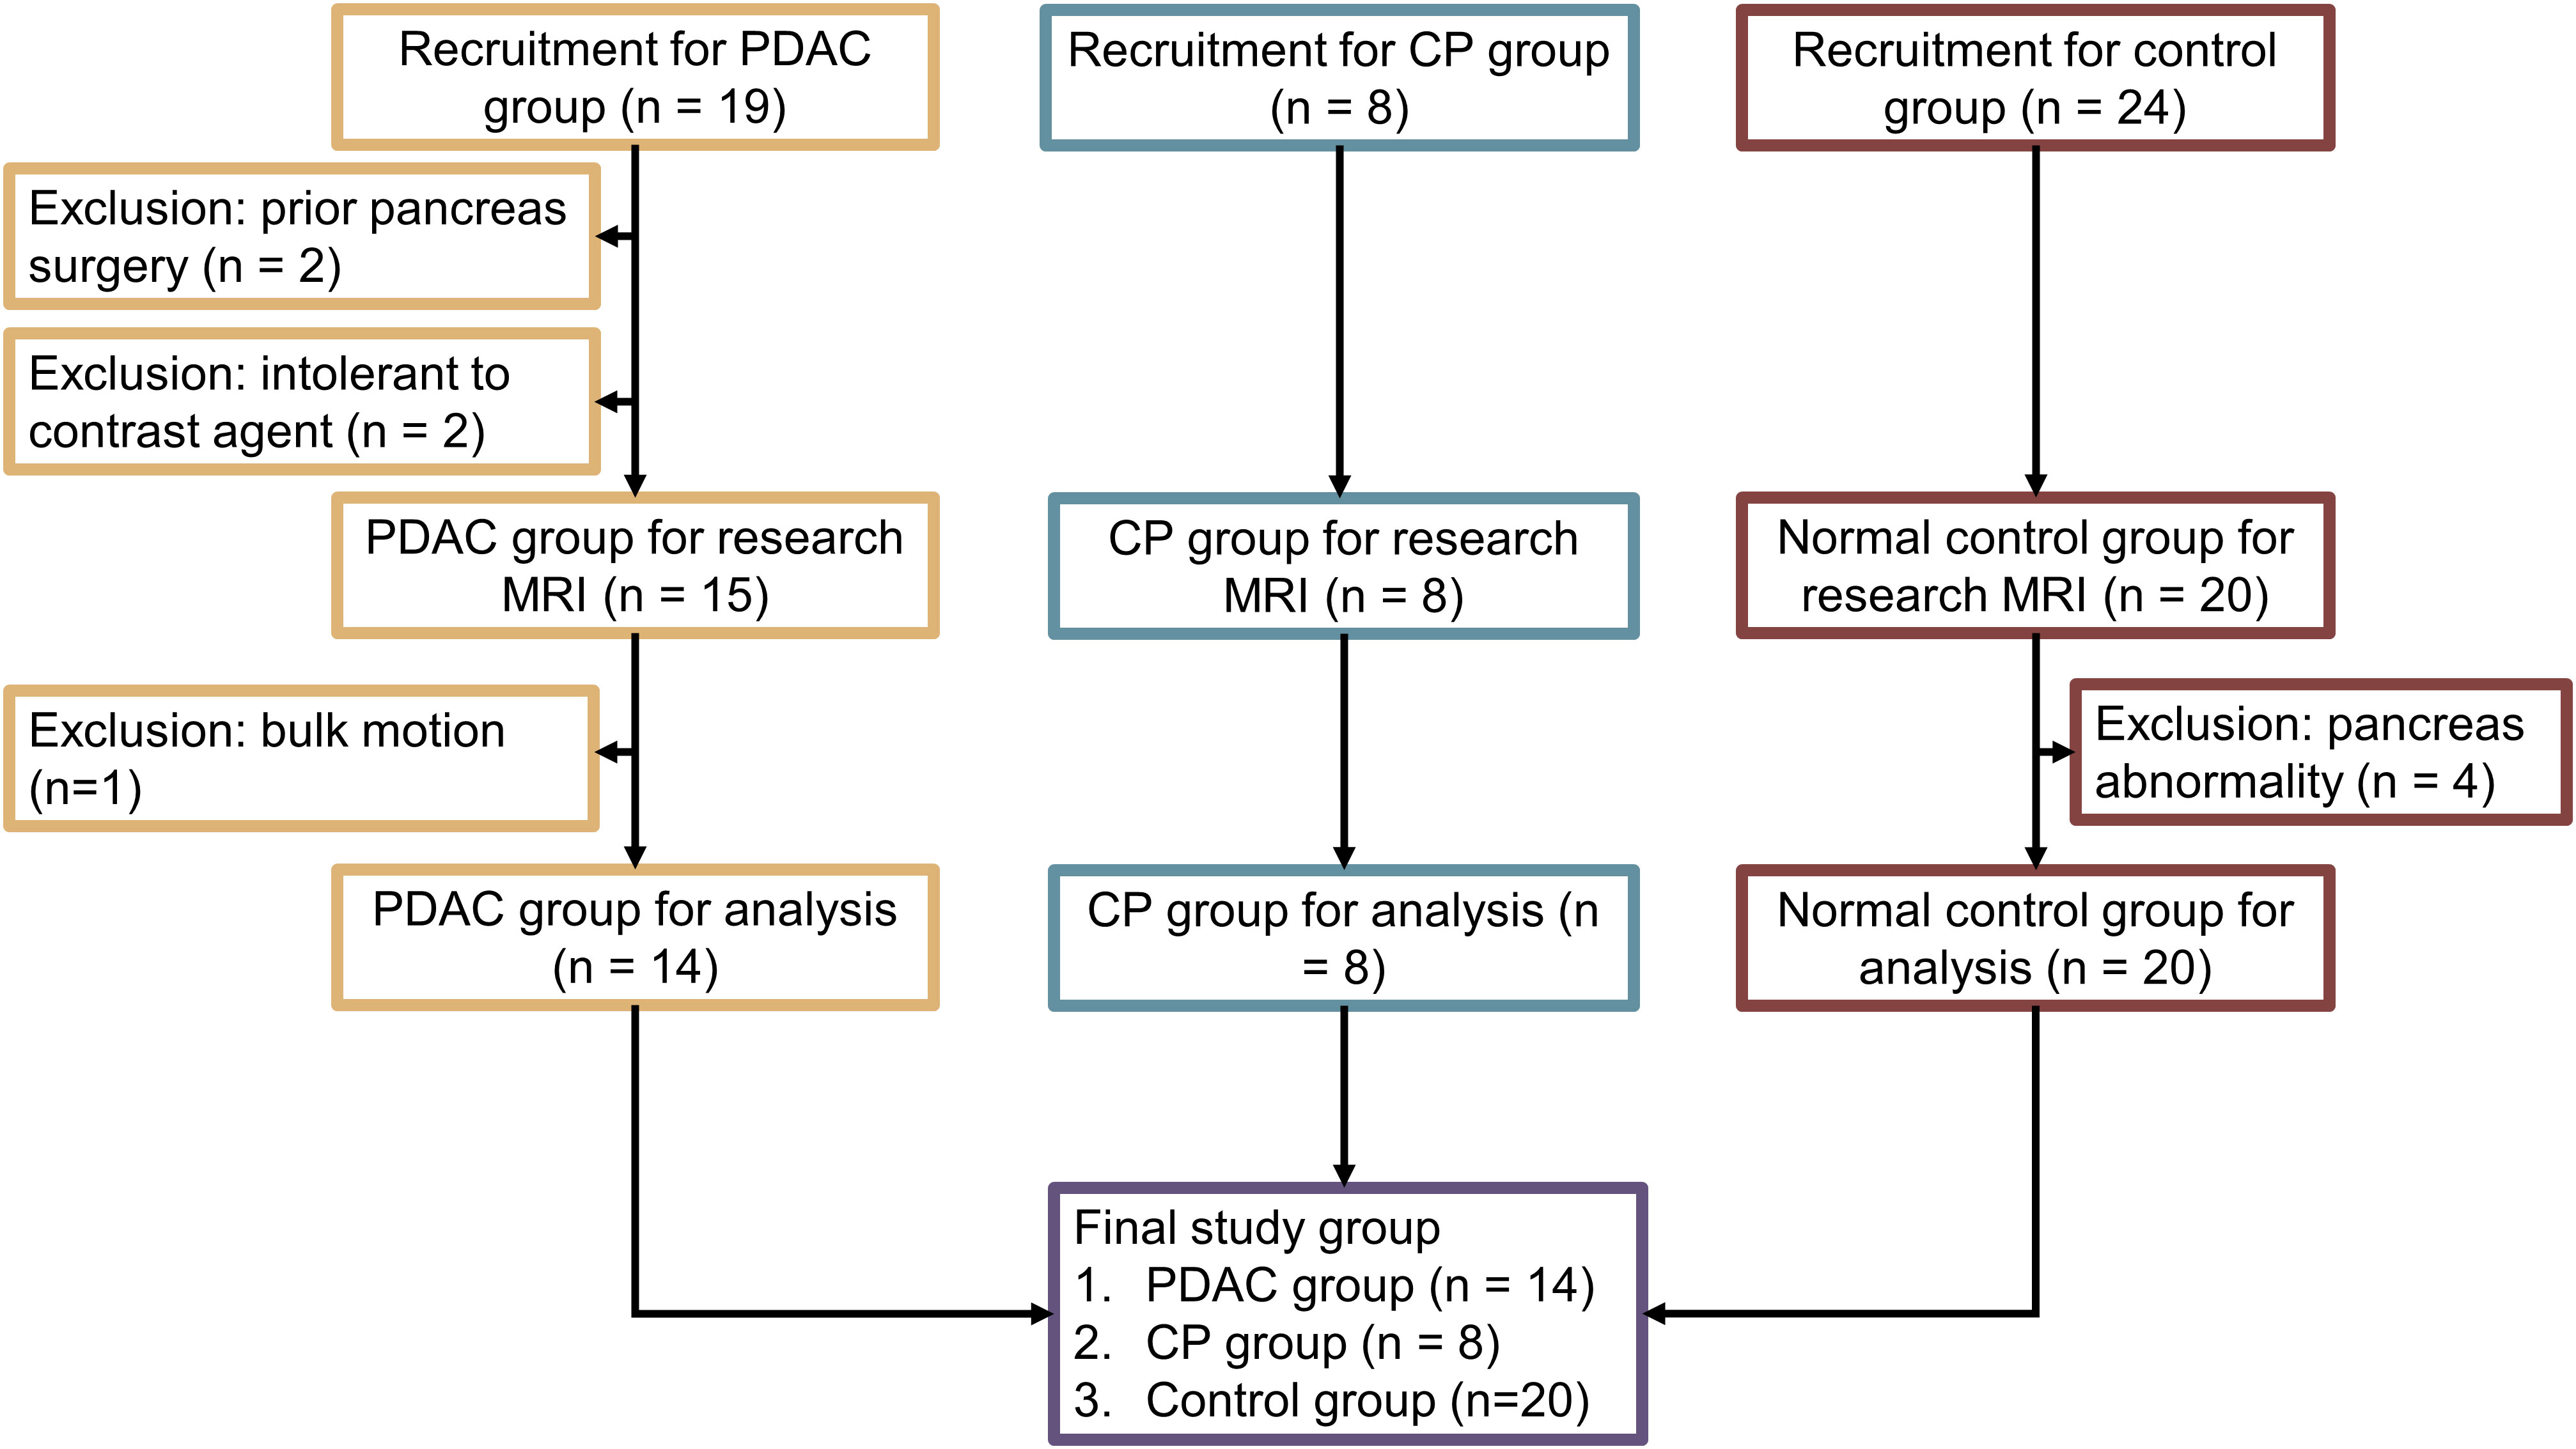
Figure 1 Flow chart for subject recruitment and grouping.
Quantifications of microcirculation parameters for different tissues
The microcirculation parameters were estimated successfully for all the involved subjects. Figure 2 (A) shows the example microcirculation parametric maps from a 72-year-old PDAC patient with the tumor located at the neck of the pancreas, as labeled by red solid boundary on the gray-scale image. The CA concentration curve of PDAC tumor shows slower and progressive enhancement, while the concentration curve of downstream pancreas showed faster wash-in and moderate wash-out. Reduced Fp, vp, Ktrans, and increased ve was observed in PDAC tumor. Figure 2B is an example from a 65-year-old patient with CP, labeled by yellow dashed boundary. An example of normal control pancreas from a 32-year-old healthy subject is shown in Figure 2C.
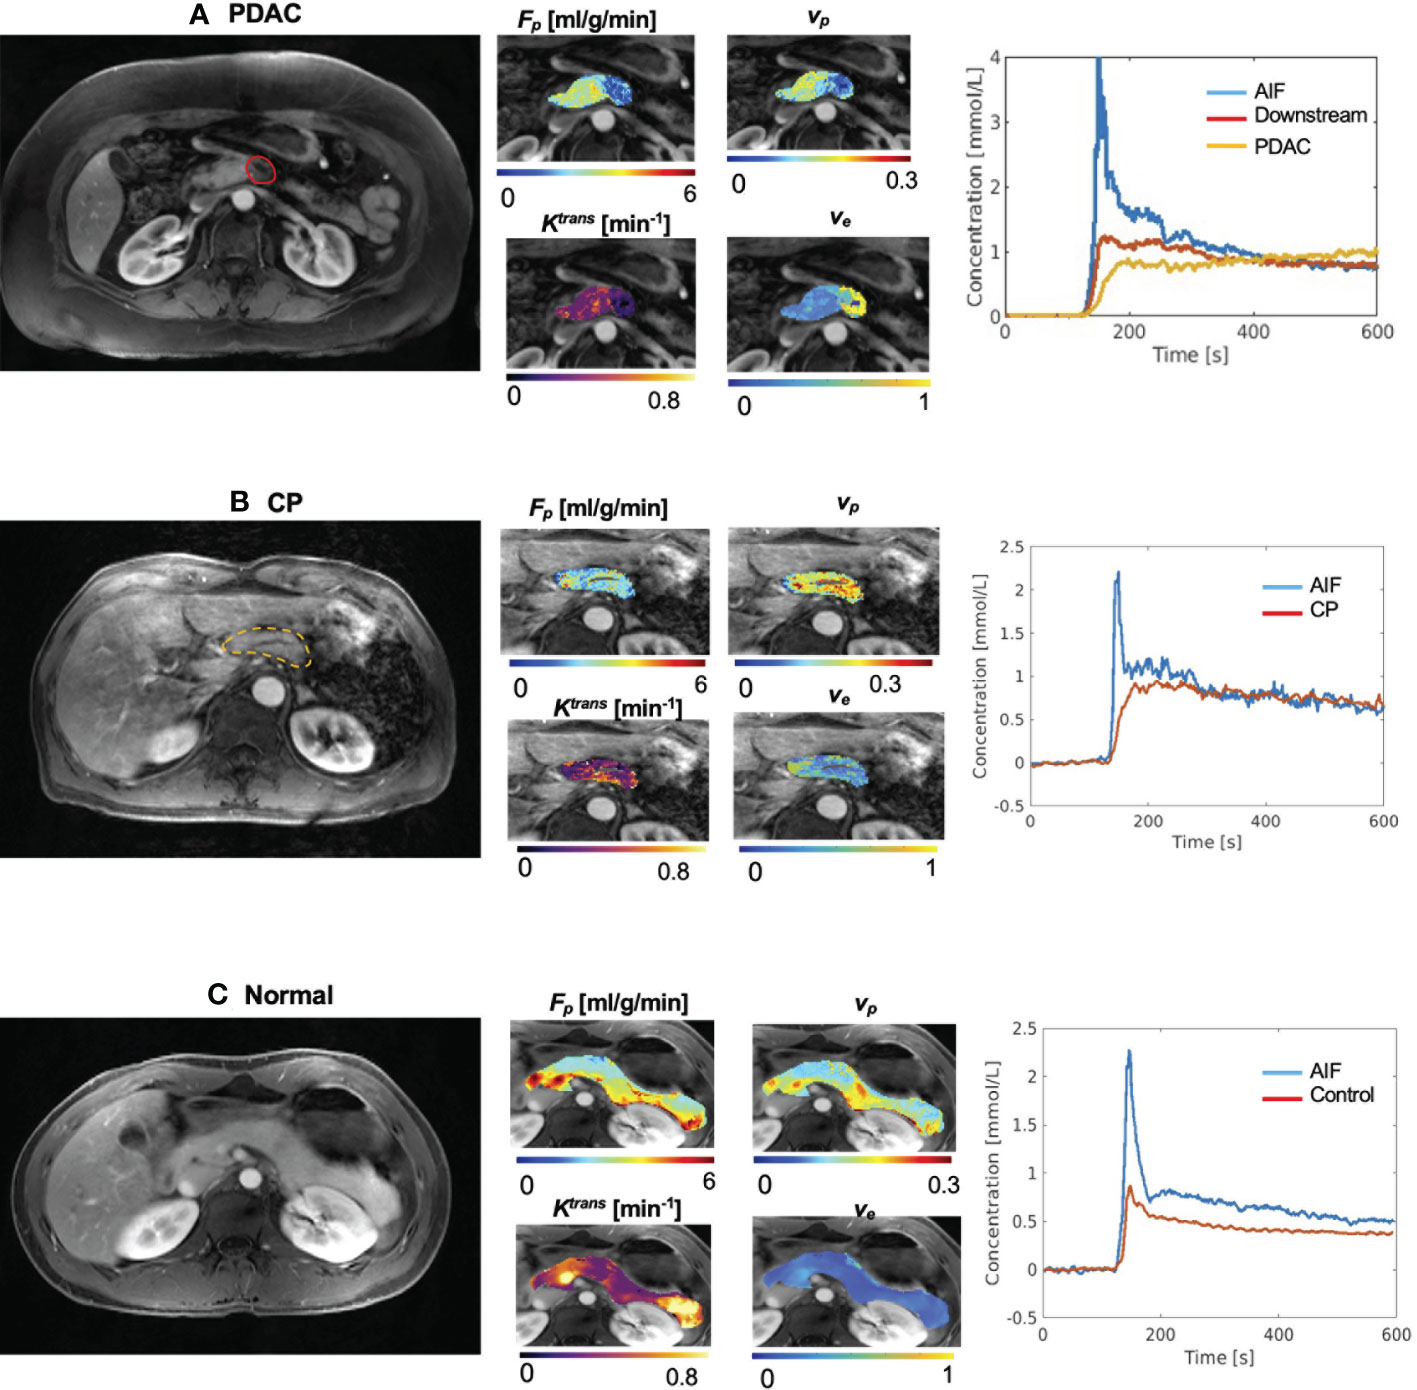
Figure 2 Example microcirculation parametric maps. (A) Example maps from 72-year-old patient with PDAC, whose tumor is located at the neck of pancreas. First panel shows a gray-scale Multitasking image at the arterial phase at the center slice of the tumor. The tumor was labeled by the red solid boundary. Downstream was visible in this slice. The second panel shows estimated microcirculation parametric maps. PDAC tumor showed lower Fp, lower vp, and elevated ve compared to downstream. The third panel shows the averaged contrast agent concentration curves for blood, PDAC tumor, and PDAC downstream. (B) Example maps from a 65-year-old patient with CP. The pancreas was labeled by the yellow dashed boundary. (C) Representative maps of a 32-year-old subject in the normal control group.
The mean and standard deviation measurement of Fp, vp, Ktrans, and ve for the six types of tissues are displayed in the bar graphs in Figure 3. The detailed mean values and standard deviations of each microcirculation parameter for each tissue are displayed in Table 2. The ANOVA test with Bonferroni correction of each microcirculation parameters between some pairs of tissues are listed in Table 3. The former half of Table 3 shows the comparison of each pair of CP, PDAC pancreas, and normal control pancreas. With Bonferroni correction, significant differences were observed in Fp for CP versus PDAC pancreas (P = 0.015), and in Fp and ve for CP versus normal control (P = 0.012,<0.001, respectively) and PDAC pancreas versus normal control (P<0.001,<0.001, respectively). The latter half of Table 3 compares the measurements between CP versus PDAC tumor, downstream, and upstream. Fp, Ktrans, and ve showed significant differences between CP and PDAC tumor (P<0.001, = 0.012,<0.001, respectively); ve was significantly different between CP and PDAC downstream (P =0.024); None of the microcirculation parameters showed significant differences between CP and PDAC upstream.
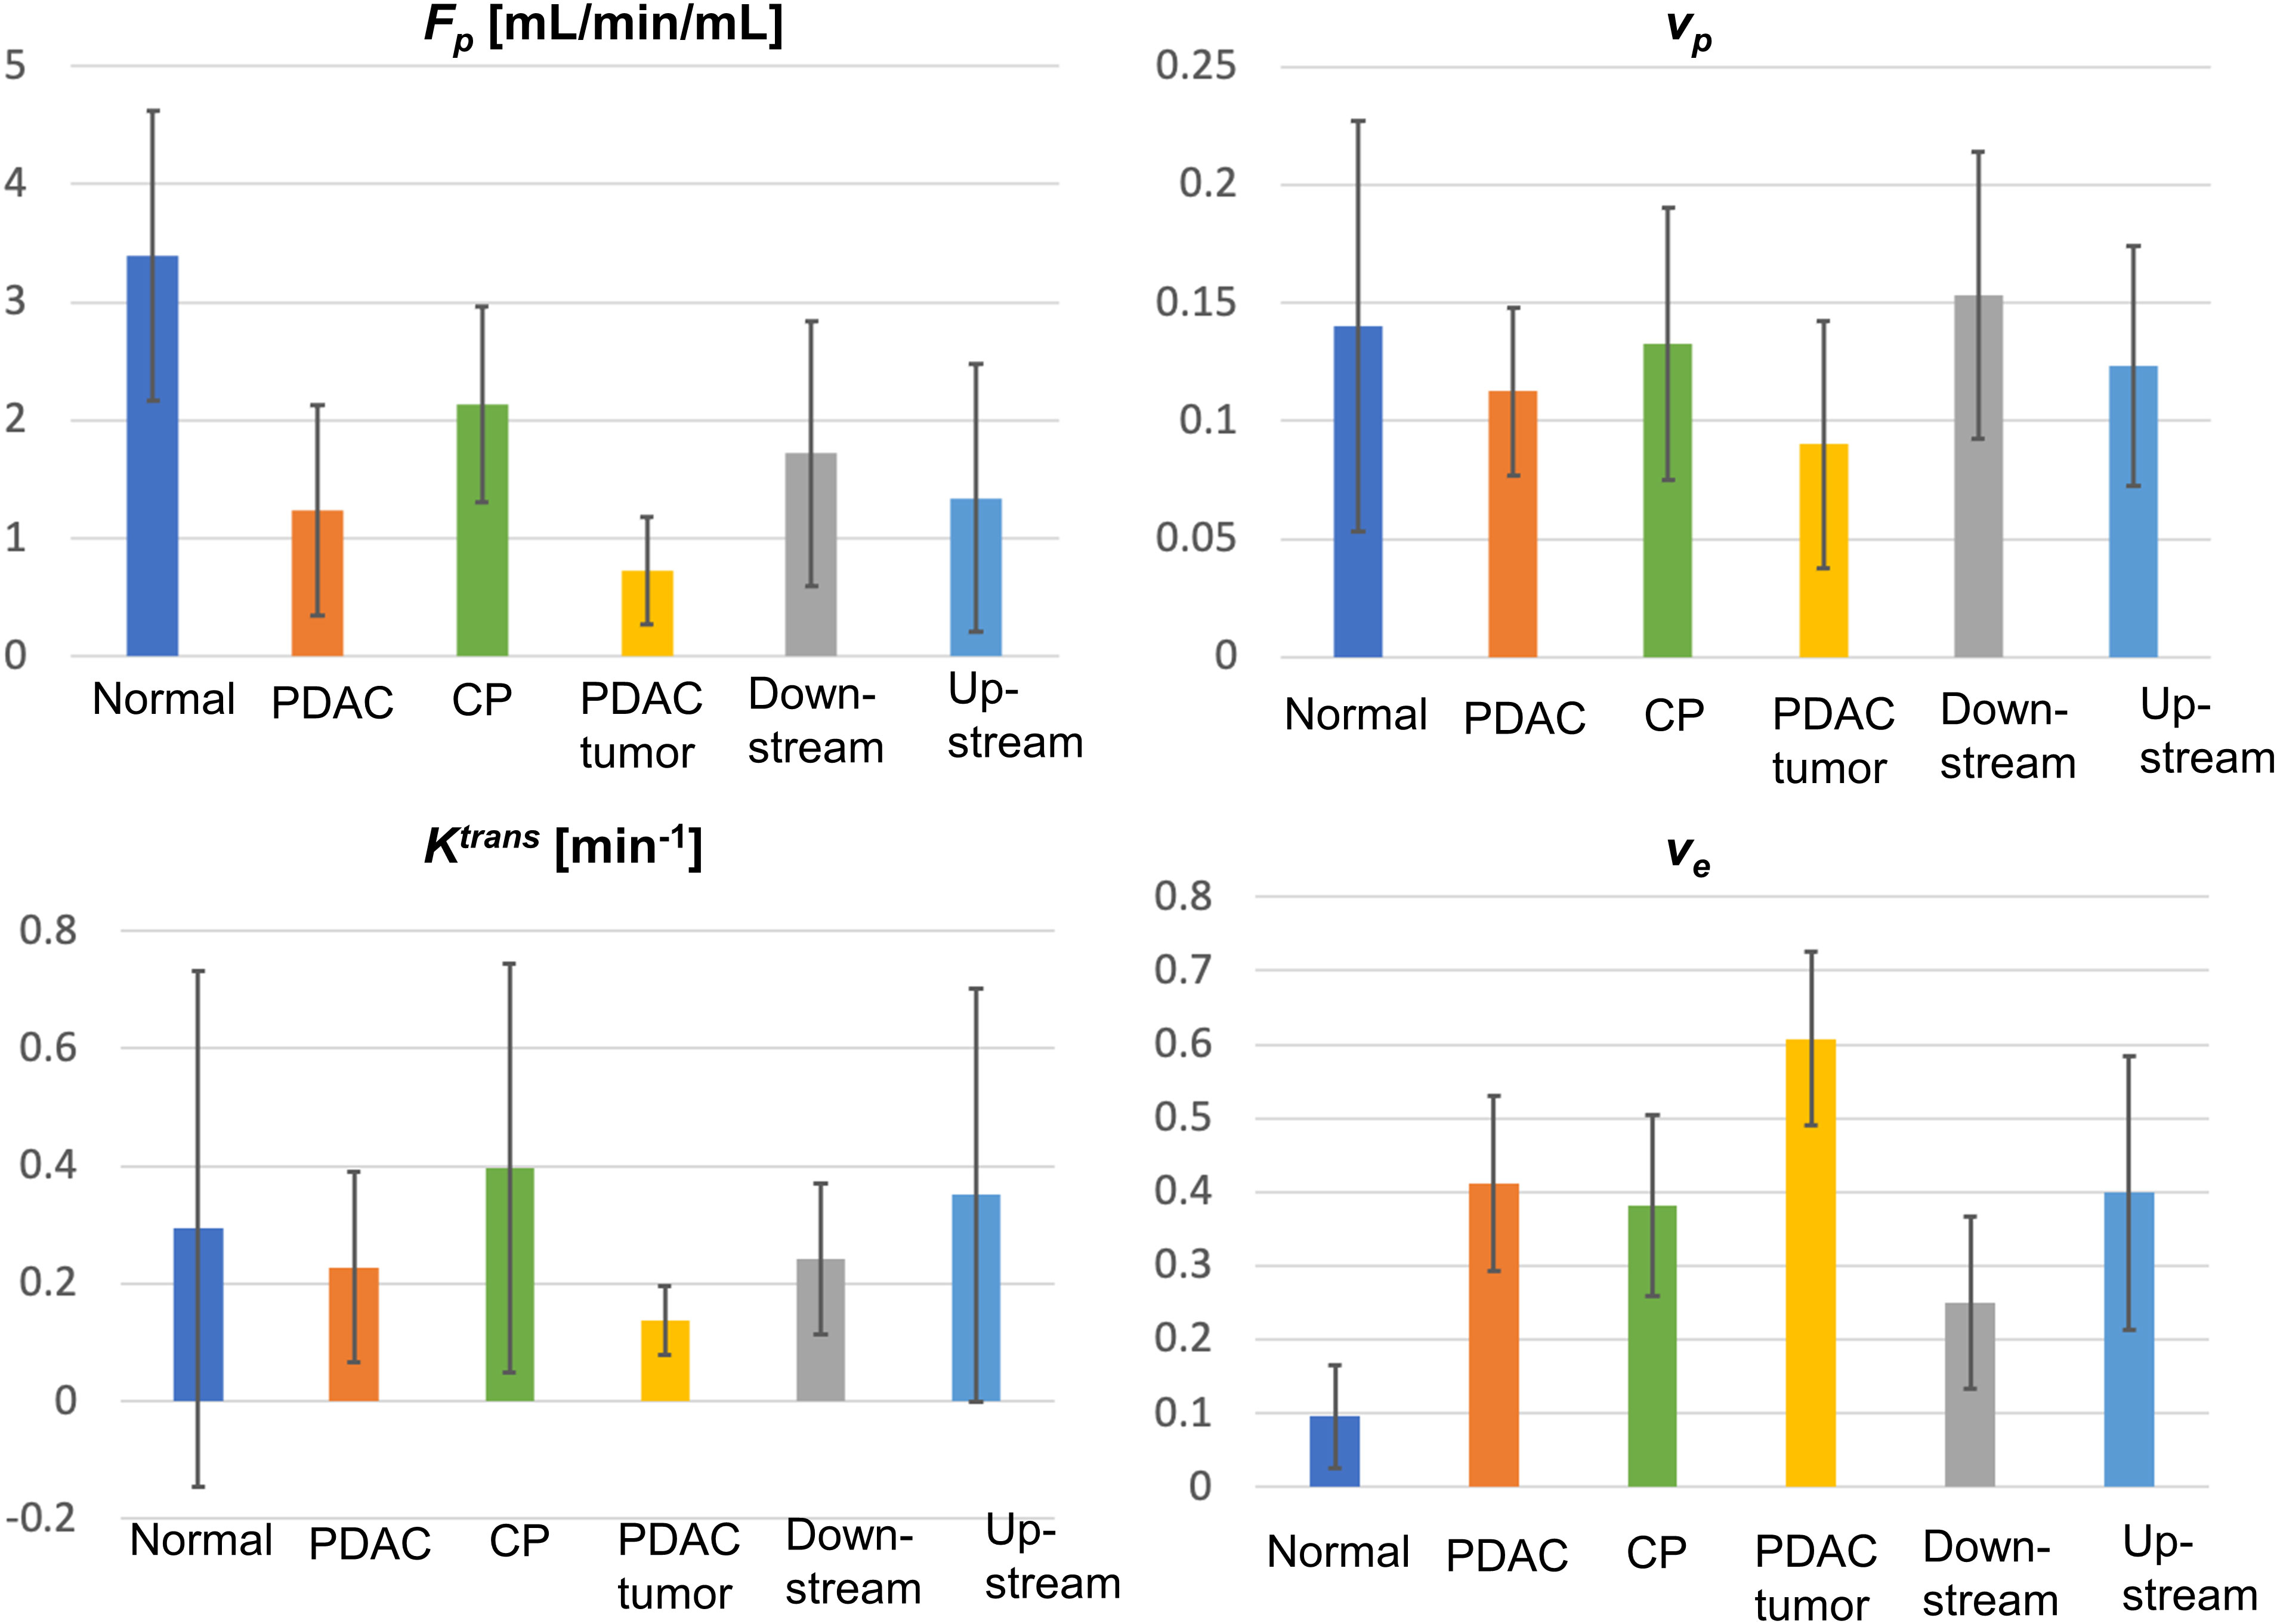
Figure 3 Bar graphs for the mean and standard deviation (error bar on top of each bar) for Fp, vp, Ktrans, and ve for all types of tissues (normal, normal control pancreas; PDAC, PDAC pancreas; CP, CP pancreas).
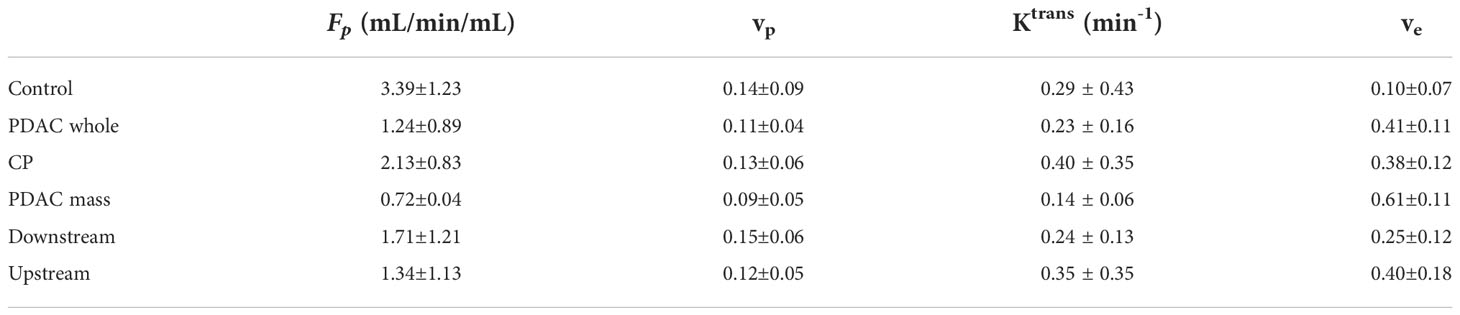
Table 2 The mean and standard deviation of Fp, vp, Ktrans, and ve for the six types of tissues.
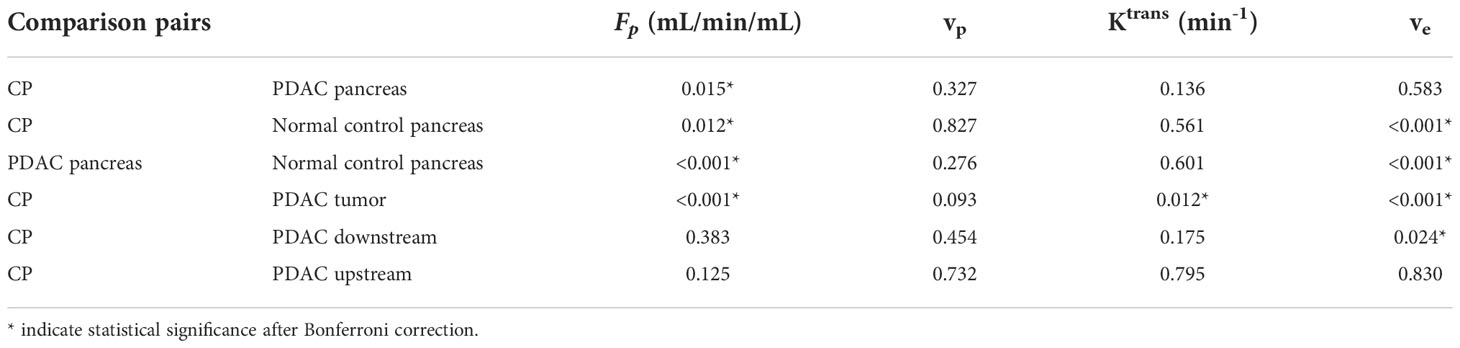
Table 3 The P value between some pairs of the tissues using one-way ANOVA analysis.
Prediction of type of tissue using microcirculation parameters
The ROC analysis was successfully carried out to evaluate the performance of microcirculation parameters in differentiating CP versus other tissues using either each single parameter or a combination of the four parameters. In the differentiation of CP and PDAC pancreas (Figure 4A, Fp showed the highest accuracy (AUC [95% CI] = 0.795 [0.604 - 0.985]) as a single parameter; the combination of the four parameters produced improved differentiation ability with good AUC (0.821 [0.654 – 0.988]). In the differentiation of CP and normal control pancreas (Figure 4B), ve showed the highest AUC (0.981 [0.938 – 1.000]) when using single parameter; the combination of the four parameters can differentiate all the cases of current study cohort with AUC = 1.000 [1.000 – 1.000]. In the differentiation of PDAC pancreas and normal control pancreas (Figure 4C), ve showed the highest AUC (0.993 [0.974 – 1.000]) for single parameter; the combination of the four parameters can differentiate all the cases with AUC = 1.000 [1.000 – 1.000]. For CP versus PDAC tumor (Figure 4D), Fp (0.929 [0.824 – 1.000]), Ktrans (0.920 [0.806 – 1.000]), and ve (0.920 [0.805 – 1.000]) showed excellent differentiation ability when using a single parameter; the combination of all the four parameters can differentiate all the cases with AUC = 1.000 [1.000 – 1.000]. For CP versus PDAC downstream (Figure 4E), ve showed the highest AUC for single parameter (0.781 [0.569 – 0.994]), while the combination of the four parameters showed increased accuracy with excellent AUC (0.917 [0.795 – 1.000]). For CP versus upstream (Figure 4F), Fp showed the fair AUC for single parameter (0.792 [0.558 – 1.000]), and the combination of the four parameters showed slightly reduced but still fair accuracy (0.722 [0.465 – 0.980]).
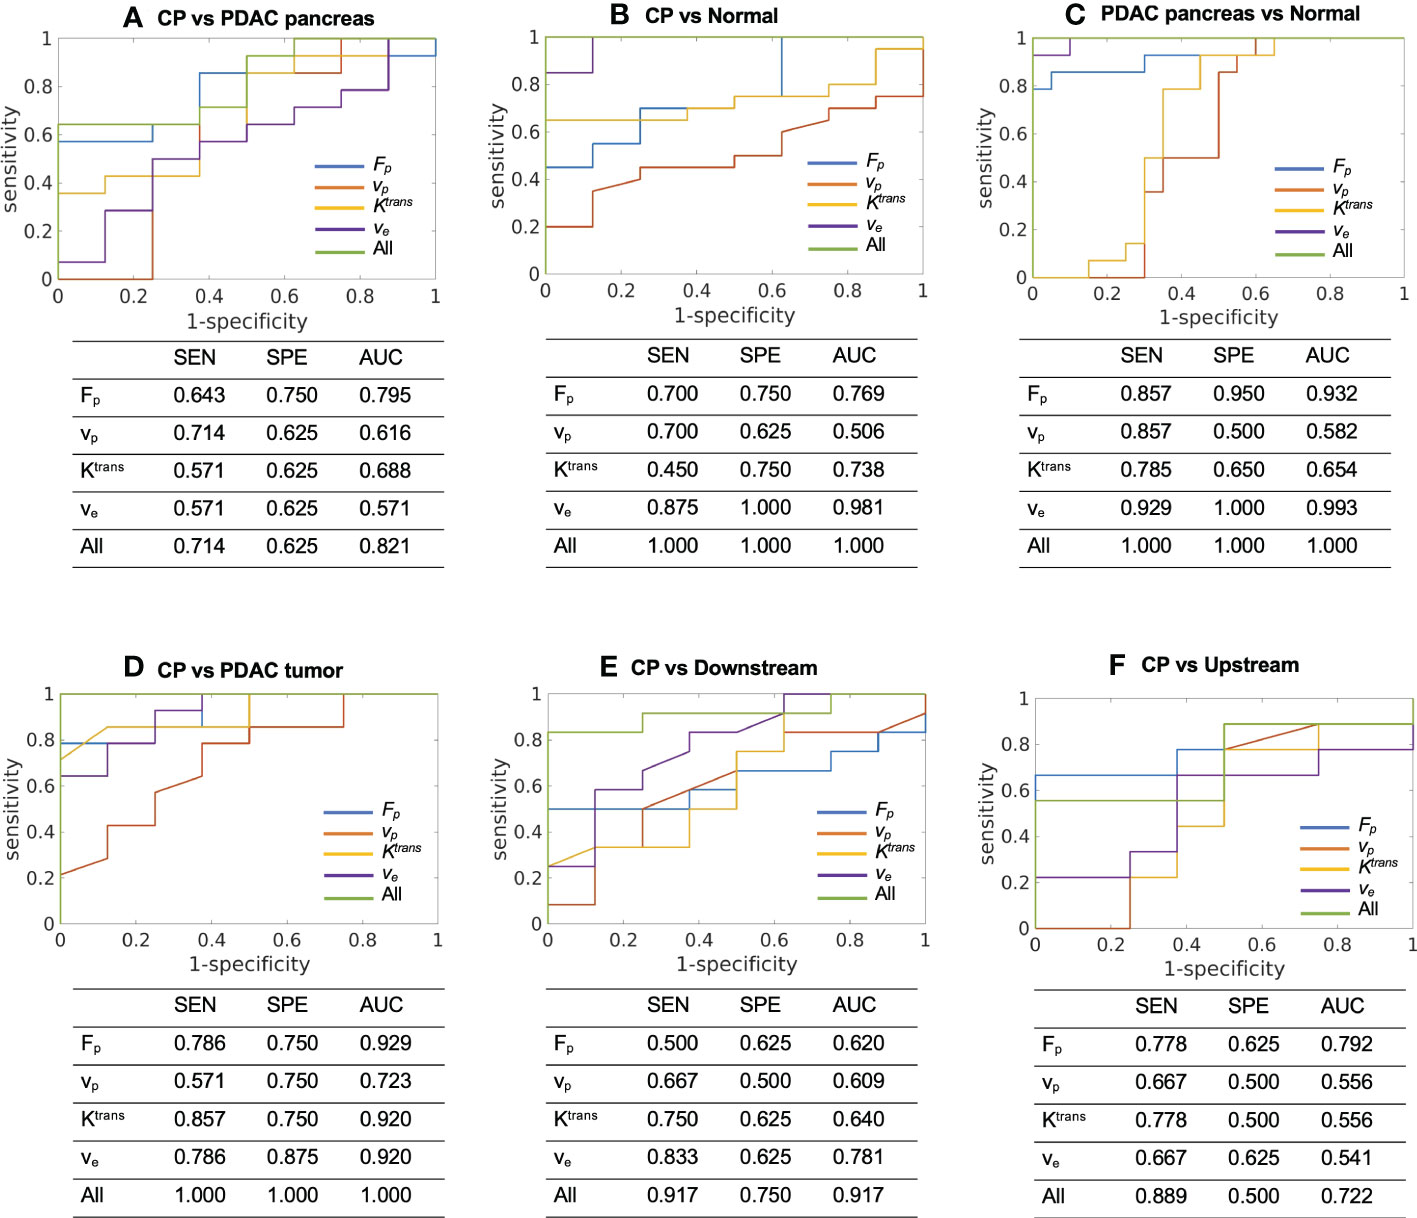
Figure 4 ROC curves and the sensitivity (SEN), specificity (SPE), and AUC to differentiate between (A) CP (N = 8) versus PDAC pancreas (N = 14), (B) CP (N = 8) versus normal control pancreas (N = 20), (C) PDAC pancreas (N = 14) versus normal control pancreas (N = 20), (D) CP (N = 8) versus PDAC tumor (N = 14), (E) CP (N = 8) versus PDAC downstream (N = 10), and (F) CP (N = 8) versus PDAC upstream (N = 9) using each single microcirculation parameter or the combination of all the four parameters. SEN, sensitivity; SPE, specificity; AUC, area under ROC curve.
Prediction of type of tissue using conventional TIC analysis
For TIC analysis, the number of cases in each category for each type of tissue are summarized in Table 4. CP demonstrated the TIC of type II (n = 2), type III (n = 5), and type IV (n = 1); the PDAC pancreas demonstrated type II (n = 3), type III (n = 4), and type IV (n = 7), which were within the same range of CP; PDAC tumor demonstrated type III (n = 3), type IV (n = 4), and type V (n = 7), representing a slower enhancement. Figure 5 displays the ROC plots to differentiate the CP versus PDAC pancreas (AUC [95% CI] = 0.629 [0.400 – 0.823], poor), CP versus normal control pancreas (0.984 [0.944 – 1.000], excellent), PDAC pancreas versus normal control pancreas (0.991 [0.968 – 1.000], excellent), CP versus PDAC tumor (0.915 [0.789 – 1.000], excellent), CP versus downstream (0.725 [0.468 – 0.905], fair), and CP versus upstream (0.625 [0.342 – 0.908], poor) with the sensitivity, specificity, and AUC listed under each plot.
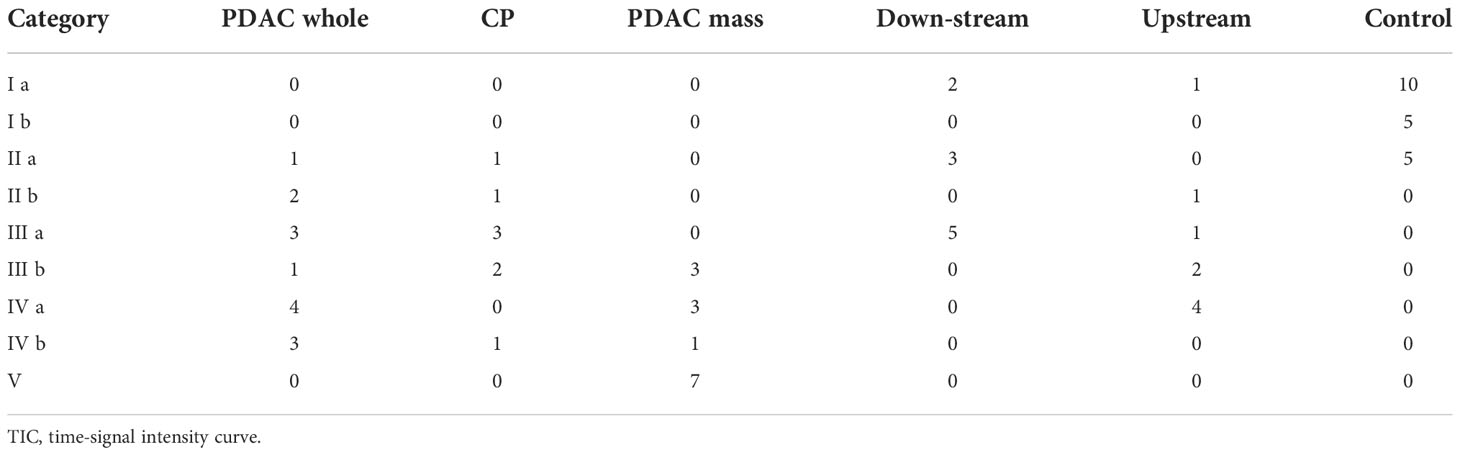
Table 4 TIC category for each type of tissue.
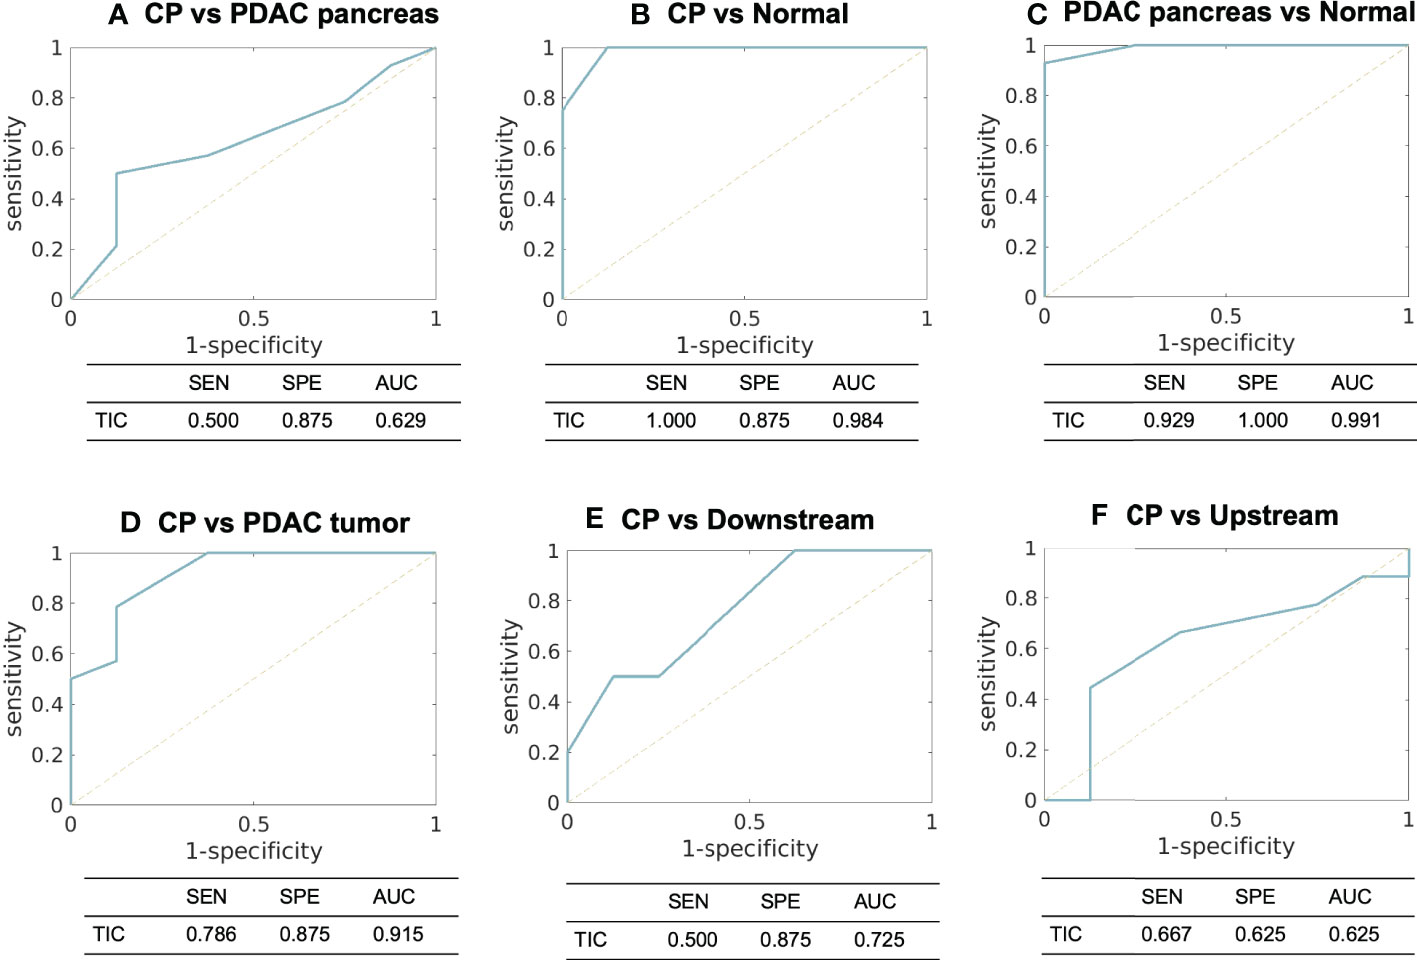
Figure 5 ROC curves and the sensitivity, specificity, and AUC using TIC analysis to differentiate between (A) CP versus PDAC pancreas, (B) CP versus normal control pancreas, (C) PDAC pancreas versus normal control pancreas, (D) CP versus PDAC tumor, (E) CP versus PDAC downstream, and (F) CP versus PDAC upstream. SEN, sensitivity; SPE, specificity; AUC, area under ROC curve; TIC, time-signal intensity curve.
Comparison of quantitative DCE analysis and conventional TIC analysis
Table 5 lists the AUC from TIC, the highest AUC using a single microcirculation parameter from quantitative DCE, the AUC of combining all microcirculation parameters for the differentiation of each pair, and the P values using DeLong test to compare the performance of TIC analysis and quantitative DCE analysis. In most pairs, a single microcirculation parameter from quantitative DCE approach produced higher AUC than conventional TIC approach (except in the differentiation of CP versus normal control, where the AUC for TIC is 0.984 and the AUC from a single microcirculation parameter is 0.981). The combination of microcirculation parameters demonstrated higher AUC in all pairs when compared to the conventional TIC approach. The DeLong test indicated that quantitative DCE analysis performed significantly better in differentiating CP versus PDAC pancreas (P = 0.032) and CP versus PDAC downstream (P = 0.042).
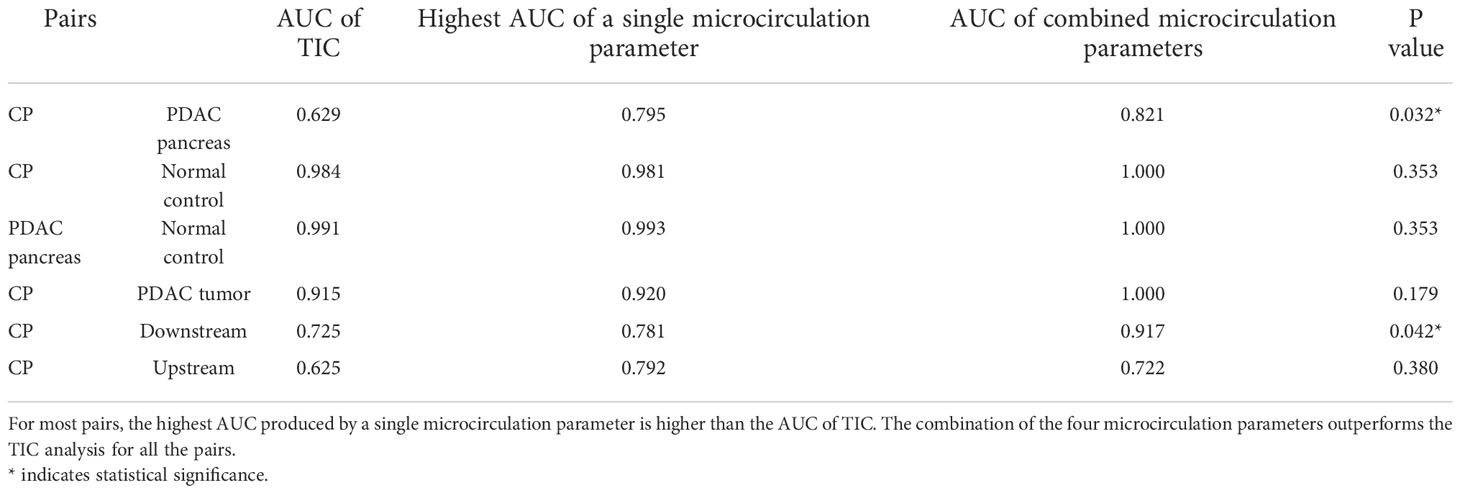
Table 5 The comparison of the differentiation ability of TIC approach versus quantitative DCE approach.
Discussions
The differential diagnosis between PDAC and CP remains an unmet clinical need. In terms of clinical factors, both diseases can have similar background histories such a history of alcohol and tobacco use, and similar clinical signs such as weight loss, chronic abdominal pain, anorexia, and diabetes (8). For blood test, the best-established biomarker for PDAC diagnosis is carbohydrate antigen 19-9 (CA19-9), a Lewis antigen of the MUC1 protein class. Unfortunately, CA19-9 can also be elevated in patients with CP, yielding a distinction no better than 65% (35). Imaging is the most common approach to diagnose these diseases. Contrast-enhanced CT and multi-phasic contrast-enhanced MRI have shown high sensitivity and high specificity for the diagnosis of CP or PDAC solely (36, 37). However, the shared imaging findings make the differential diagnosis a complicated issue. The common imaging features include generalized parenchymal glandular atrophy, diffuse pancreatic calcifications, dilation of the main pancreatic duct, hypo-attenuation on contrast-enhanced CT (38), and hypo-enhancement on multi-phasic contrast-enhanced MRI. EUS and EUS-guided fine needle aspiration (FNA) have high sensitivity and specificity in the detection of PDAC and CP (39). However, studies have shown that the sensitivity drops significantly to only 50–75% in patients with chronic pancreatitis (40, 41) due to shared pathological features (17).
In recent years, advanced techniques have been developed to improve the diagnosis and differentiation of PDAC and CP. New blood biomarkers including plasma suPAR (42) and a bunch of metabolic markers (43) have shown promises in the differentiation of the two diseases. Perfusion CT has been used for the diagnosis and differentiation of PDAC (44) and CP (45, 46) with positive results, but remains in the research phase for pancreas due to higher radiation dose and limited field of view. In MRI, non-contrast techniques including diffusion-weighted imaging and T1 mapping, and contrast-enhanced techniques with more dynamic phases and TIC analysis (22) also show promising differential ability of the two diseases (12, 45). These new techniques are non-invasive approaches with clinical promises, but still need to be validated on larger cohorts of patients.
In this work, we investigated the differential ability of tissue microcirculation parameters estimated from Multitasking DCE technique. The microcirculation properties carry crucial information about disease characteristics, progression, and regression. The alteration of microcirculation properties usually precedes morphological changes (47–49), providing a pathway for early detection, staging, and treatment monitoring. DCE MRI has the potential to capture the microcirculation properties by tracking the contrast agent kinetics within the tissues, but has been limited by the demanding sampling requirements. The pathological lesions usually bear high-level heterogeneity within the structure, which requires adequate coverage and high spatial resolution to capture the spatial variation. On the other hand, high temporal resolution is required to accurately track the kinetics of contrast agent within the tissues. Previous studies have demonstrated that a temporal resolution of least 10 seconds is necessary to depict tumor enhancement dynamics (50), and 1-3 seconds to capture the dynamics of AIF (51, 52). Furthermore, respiratory motion remains a major challenge and can further degrade the image quality for pancreas imaging.
The recently-proposed Multitasking DCE technique is a promising solution to resolve the abovementioned limitations (28–31, 53–55). The technique is capable of resolving respiratory motion, achieving a free-breathing acquisition for 10-minutes to capture the contrast agent kinetics. It enables entire-abdomen coverage, clinical-sufficient spatial resolution, and 1-second temporal resolution simultaneously, allowing for the capture of spatial variation and temporal kinetics. Consequently, quantitative DCE analysis can be performed to estimate the microcirculation parameters. In this work, the two-compartment exchange model was used, and four independent microcirculation parameters were estimated: Fp, representing tissue blood flow, vp, correlated with the microvascular density, Ktrans, which has a joint effect of blood flow and permeability-surface area product, and ve, which is correlated with fibrosis content. Compared with normal control pancreas, the PDAC tumor, PDAC pancreas and CP all showed significantly lower Fp (P<0.001,<0.001, 0.012, respectively) and higher ve (P<0.001,<0.001,<0.001, respectively), consistent with their pathological characteristics including reduced blood flow and high fibrosis replacement.
These microcirculation parameters showed strong ability in the differentiation of CP versus PDAC tumor. Fp, Ktrans, and ve demonstrated significant difference between CP and PDAC tumor (P<0.001, 0.012,<0.001, respectively); the AUC using these three parameters individually to differentiate CP versus PDAC tumor are all above 0.9 (0.929, 0.920, 0.920, respectively), representing excellent differential ability. The non-tumoral part of PDAC is frequently associated with secondary inflammatory changes (11, 56). This associated pancreatitis happens more frequently in the upstream of PDAC due to the obstruction of pancreatic duct (57, 58). The differential ability of the microcirculation parameter between CP and non-tumoral tissues in PDAC were also evaluated. For CP versus PDAC downstream, ve showed significant difference (P = 0.024) and produced the highest AUC (0.781) with a single parameter; the combination of all the four parameters demonstrated excellent differential ability with an AUC of 0.971. For CP versus PDAC upstream, Fp showed a visible reduction in the upstream as displayed in Figure 3, but none of the microcirculation parameters had significant difference between the two tissues. A major reason could be the large standard deviation from the small sample size and varied diseases grade or severity. The ROC analysis showed a fair AUC of 0.792 using Fp and 0.722 when combining of all the four parameters. These results indicate that the microcirculation parameters, especially Fp, has a great potential to differentiate CP with PDAC upstream.
Furthermore, the evaluation of differential ability between CP and whole PDAC pancreas were performed. Fp was significantly different between CP and PDAC pancreas (P = 0.015) and showed a fair and close to good AUC of 0.795. Combing of all parameters presented a good differentiation with an AUC of 0.821. The ability to differentiate CP versus whole PDAC pancreas has great utility in clinical context. It provides the possibility to identify patients with PDAC without the accurate localization of tumor.
To demonstrate the advantages of the quantitative Multitasking DCE technique, the comparison with the conventional TIC approach was also performed. The TIC approach showed excellent accuracy to differentiate CP versus PDAC tumor (AUC = 0.915), CP versus normal control pancreas (AUC = 0.984), and PDAC pancreas versus normal control pancreas (AUC = 0.991). These results are comparable to the highest AUCs produced by a single microcirculation parameter but lower than the AUCs from the combination of all microcirculation parameters. For CP versus downstream, TIC produced fair accuracy with AUC of 0.725, while the microcirculation parameters showed excellent differential ability with AUC of 0.917. For CP versus upstream, TIC produced poor differentiation ability with AUC of 0.625, perhaps due to the similar enhancement pattern of CP and PDAC upstream with associated pancreatitis. The quantitative DCE approach, on the other hand, can capture more dynamic information and improve the differentiation ability to an AUC of 0.792. For CP versus PDAC pancreas, TIC performed poorly with AUC of 0.629. while quantitative DCE approach presented a good differentiation (AUC = 0.821) when using all microcirculation parameters. The comparison demonstrated that Multitasking DCE with quantitative DCE analysis outperformed the conventional TIC approach and can potentially improve the differentiation between CP versus PDAC.
Another intriguing potential of the quantitative Multitasking DCE technique is to evaluate and predict the treatment outcome of PDAC and CP (24, 59, 60). Most of the therapies affect tumor microvasculature and thus the microcirculation properties, altering tumor blood flow, microvascular density, and extravascular extracellular distribution. By identifying the changes in microcirculation properties with quantitative Multitasking DCE, there is a great potential to predict the treatment effect at early stage and individualize the therapy regimen.
Our study has several limitations. First, the sample sizes for all groups were relatively small, which may affect the statistical outcome. The ability to differentiate CP versus PDAC of Multitasking DCE need to be validated on larger patient cohort. Second, the PDAC and CP groups included a variety of tumor stages or disease severity. Sub-group analysis based on tumor grade or disease severity was not possible due to the small sample size. This variation can be a major factor contributing to the wide standard deviation of the microcirculation parameters. Third, all the PDAC patients had undergone neoadjuvant chemotherapy at the time of the study, which may change the tissues properties. Future studies on treatment-naïve PDAC patients will be performed. Finally, the resection specimens were not available in this pilot study. The correlation between the microcirculation parameters and the histological markers including the microvascular density and fibrosis were not accessible in this work. With the promising preliminary results, future studies with the correlation between pathological details and imaging parameters will be performed on untreated PDAC and CP patients.
Conclusion
A novel Multitasking DCE MRI technique with quantitative analysis of microcirculation parameters was performed to differentiate PDAC and CP. The combination of the microcirculation parameters showed strong ability to different CP from normal control pancreas, PDAC pancreas, PDAC tumor, PDAC downstream, and PDAC upstream, and superior performance compared to conventional TIC analysis approach. Multitasking DCE appears to be a promising clinical tool for the differentiation of CP from PDAC on a quantitative and objective basis.
Data availability statement
The data will be available upon request with de-identification; the analytic methods are available upon request to the corresponding author.
Ethics statement
The studies involving human participants were reviewed and approved by Cedars-Sinai Medical Center. The patients/participants provided their written informed consent to participate in this study.
Author contributions
NW contributed to the data acquisition, analysis and interpretation, and article writing. SG, SP, SL, and AH contributed to the patient recruitment and study design. YX, AC, CW, SM, ZF, LW contributed to the data analysis and interpretation. DL contributed to the conception and study design. All authors contributed to the article and approved the submitted version.
Funding
This work was partially supported by NIH 1R01EB028146, and NIH 1R01EB032801.
Conflict of interest
The authors declare that the research was conducted in the absence of any commercial or financial relationships that could be construed as a potential conflict of interest.
Publisher’s note
All claims expressed in this article are solely those of the authors and do not necessarily represent those of their affiliated organizations, or those of the publisher, the editors and the reviewers. Any product that may be evaluated in this article, or claim that may be made by its manufacturer, is not guaranteed or endorsed by the publisher.
Supplementary material
The Supplementary Material for this article can be found online at: https://www.frontiersin.org/articles/10.3389/fonc.2022.1007134/full#supplementary-material
References
1. Siegel RL, Miller KD, Jemal A. Cancer statistics, 2020. CA Cancer J Clin (2020) 70:7–30. doi: 10.3322/caac.21590
2. Holzapfel K, Reiser-Erkan C, Fingerle AA, Erkan M, Eiber MJ, Rummeny EJ, et al. Comparison of diffusion-weighted MR imaging and multidetector-row CT in the detection of liver metastases in patients operated for pancreatic cancer. Abdom Imaging (2011) 36:179–84. doi: 10.1007/s00261-010-9633-5
3. Birgin E, Hablawetz P, Téoule P, Rückert F, Wilhelm TJ. Chronic pancreatitis and resectable synchronous pancreatic carcinoma: A survival analysis. Pancreatology (2018) 18:394–8. doi: 10.1016/j.pan.2018.04.009
4. Hao L, Zeng XP, Xin L, Wang D, Pan J, Bi YW, et al. Incidence of and risk factors for pancreatic cancer in chronic pancreatitis: A cohort of 1656 patients. Digestive Liver Dis (2017) 49:1249–56. doi: 10.1016/j.dld.2017.07.001
5. Kirkegård J, Mortensen FV, Cronin-Fenton D. Chronic pancreatitis and pancreatic cancer risk: a systematic review and meta-analysis. Off J Am Coll Gastroenterol ACG (2017) 112:1366–72. doi: 10.1038/ajg.2017.218
6. Gandhi S, de la Fuente J, Murad MH, Majumder S. Chronic pancreatitis is a risk factor for pancreatic cancer, and incidence increases with duration of disease: A systematic review and meta-analysis. Clin Transl Gastroenterol (2022) 13. doi: 10.14309/ctg.0000000000000463
7. Narkhede RA, Desai GS, Prasad PP, Wagle PK. Diagnosis and management of pancreatic adenocarcinoma in the background of chronic pancreatitis: Core issues. Digestive Dis (2019) 37:315–24. doi: 10.1159/000496507
8. Elsherif SB, Virarkar M, Javadi S, Ibarra-Rovira JJ, Tamm EP, Bhosale PR. Pancreatitis and PDAC: association and differentiation. Abdominal Radiol (2020) 45:1324–37. doi: 10.1007/s00261-019-02292-w
9. Li D, Xie K, Wolff R, Abbruzzese JL. Pancreatic cancer. Lancet (2004) 363:1049–57. doi: 10.1016/S0140-6736(04)15841-8
10. Choi SY, Kim SH, Kang TW, Song KD, Park HJ, Choi YH. Differentiating mass-forming autoimmune pancreatitis from pancreatic ductal adenocarcinoma on the basis of contrast-enhanced MRI and DWI findings. Am J Roentgenol (2016) 206:291–300. doi: 10.2214/AJR.15.14974
11. van Gulik TM, Moojen TM, Van Geenen R, Obertop H, Gouma DJ, Rauws EAJ. Differential diagnosis of focal pancreatitis and pancreatic cancer. Ann Oncol (1999) 10:S85–8. doi: 10.1093/annonc/10.suppl_4.S85
12. Wang L, Gaddam S, Wang N, Xie Y, Deng Z, Zhou Z, et al. Multiparametric mapping magnetic resonance imaging of pancreatic disease. Front Physiol (2020) 11:8. doi: 10.3389/fphys.2020.00008
13. Cruz-Monserrate Z, Gumpper K, Kaul S, Badi N, Terhorst S, Dubay K, et al. Delayed processing of secretin-induced pancreas fluid influences the quality and integrity of proteins and nucleic acids. Pancreas (2021) 50:17–28. doi: 10.1097/MPA.0000000000001717
14. Krishna NB, Mehra M, Reddy A. V & agarwal, b. EUS/EUS-FNA for suspected pancreatic cancer: influence of chronic pancreatitis and clinical presentation with or without obstructive jaundice on performance characteristics. Gastrointest Endosc (2009) 70:70–9. doi: 10.1016/j.gie.2008.10.030
15. Kim T, Murakami T, Takamura M, Hori M, Takahashi S, Nakamori S, et al. Pancreatic mass due to chronic pancreatitis: Correlation of CT and MR imaging features with pathologic findings. Am J Roentgenol (2001) 177:367–71. doi: 10.2214/ajr.177.2.1770367
16. Saraswat M, Joenväärä S, Seppänen H, Mustonen H, Haglund C, Renkonen R. Comparative proteomic profiling of the serum differentiates pancreatic cancer from chronic pancreatitis. Cancer Med (2017) 6:1738–51. doi: 10.1002/cam4.1107
17. Klöppel G, Adsay NV. Chronic pancreatitis and the differential diagnosis versus pancreatic cancer. Arch Pathol Lab Med (2009) 133:382–7. doi: 10.5858/133.3.382
18. Bang SJ, Kim MH, Kim DH, Lee TY, Kwon S, Oh HC, et al. Is pancreatic core biopsy sufficient to diagnose autoimmune chronic pancreatitis? Pancreas (2008) 36:84–9. doi: 10.1097/mpa.0b013e318135483d
19. Munigala S, Kanwal F, Xian H, Agarwal B. New diagnosis of chronic pancreatitis: Risk of missing an underlying pancreatic cancer. Off J Am Coll Gastroenterol ACG (2014) 109:1824–30. doi: 10.1038/ajg.2014.318
20. Coenegrachts K, Van Steenbergen W, De Keyzer F, Vanbeckevoort D, Bielen D, Chen F, et al. Dynamic contrast-enhanced MRI of the pancreas: initial results in healthy volunteers and patients with chronic pancreatitis. J Magnetic Resonance Imaging: Off J Int Soc Magnetic Resonance Med (2004) 20:990–7. doi: 10.1002/jmri.20212
21. Kim JK, Altun E, Elias Jr J, Pamuklar E, Rivero H, Semelka RC. Focal pancreatic mass: Distinction of pancreatic cancer from chronic pancreatitis using gadolinium-enhanced 3D-gradient-echo MRI. J Magnetic Resonance Imaging: Off J Int Soc Magnetic Resonance Med (2007) 26:313–22. doi: 10.1002/jmri.21010
22. Zhang TT, Wang L, Liu HH, Zhang CY, Li XM, Lu JP, et al. Differentiation of pancreatic carcinoma and mass-forming focal pancreatitis: qualitative and quantitative assessment by dynamic contrast-enhanced MRI combined with diffusion-weighted imaging. Oncotarget (2017) 8:1744. doi: 10.18632/oncotarget.12120
23. Kim JH, Lee JM, Park JH, Kim SC, Joo I, Han JK, et al. Solid pancreatic lesions: characterization by using timing bolus dynamic contrast-enhanced MR imaging assessment–a preliminary study. Radiology (2013) 266:185–96. doi: 10.1148/radiol.12120111
24. Akisik MF, Sandrasegaran K, Bu G, Lin C, Hutchins GD, Chiorean EG. Pancreatic cancer: utility of dynamic contrast-enhanced MR imaging in assessment of antiangiogenic therapy. Radiology (2010) 256:441–9. doi: 10.1148/radiol.10091733
25. Bali MA, Metens T, Denolin V, Delhaye M, Demetter P, Closset J, et al. Tumoral and nontumoral pancreas: Correlation between quantitative dynamic contrast-enhanced MR imaging and histopathologic parameters. Radiology (2011) 261:456–66. doi: 10.1148/radiol.11103515
26. Koelblinger C, Ba-Ssalamah A, Goetzinger P, Puchner S, Weber M, Sahora K, et al. Gadobenate dimeglumine–enhanced 3.0-T MR imaging versus multiphasic 64–detector row CT: prospective evaluation in patients suspected of having pancreatic cancer. Radiology (2011) 259:757–66. doi: 10.1148/radiol.11101189
27. Lee ES, Lee JM. Imaging diagnosis of pancreatic cancer: a state-of-the-art review. World J gastroenterol: WJG (2014) 20:7864. doi: 10.3748/wjg.v20.i24.7864
28. Christodoulou AG, Shaw JL, Nguyen C, Yang Q, Xie Y, Wang N, et al. Magnetic resonance multitasking for motion-resolved quantitative cardiovascular imaging. Nat BioMed Eng (2018) 2:215–26. doi: 10.1038/s41551-018-0217-y
29. Wang N, Christodoulou AG, Xie Y, Wang Z, Deng Z, Zhou B, et al. Quantitative 3D dynamic contrast-enhanced (DCE) MR imaging of carotid vessel wall by fast T1 mapping using multitasking. Magn Reson Med (2019) 81:2302–14. doi: 10.1002/mrm.27553
30. Wang N, Gaddam S, Wang L, Xie Y, Fan Z, Yang W, et al. Six-dimensional quantitative DCE MR multitasking of the entire abdomen: Method and application to pancreatic ductal adenocarcinoma. Magn Reson Med (2020) 84:928–48. doi: 10.1002/mrm.28167
31. Wang N, Xie Y, Fan Z, Ma S, Saouaf R, Guo Y, et al. Five-dimensional quantitative low-dose multitasking dynamic contrast-enhanced MRI: Preliminary study on breast cancer. Magn Reson Med (2021) 85:3096–111. doi: 10.1002/mrm.28633
32. Yadav D, Park WG, Fogel EL, Li L, Chari ST, Feng Z, et al. PROspective evaluation of chronic pancreatitis for EpidEmiologic and translational StuDies (PROCEED): Rationale and study design from the consortium for the study of chronic pancreatitis, diabetes, and pancreatic cancer. Pancreas (2018) 47:1229. doi: 10.1097/MPA.0000000000001170
33. Sourbron SP, Buckley DL. Classic models for dynamic contrast-enhanced MRI. NMR BioMed (2013) 26:1004–27. doi: 10.1002/nbm.2940
34. Mandrekar JN. Receiver operating characteristic curve in diagnostic test assessment. J Thorac Oncol (2010) 5:1315–6. doi: 10.1097/JTO.0b013e3181ec173d
35. Duffy MJ, Sturgeon C, Lamerz R, Haglund C, Holubec VL, Klapdor R, et al. Tumor markers in pancreatic cancer: a European group on tumor markers (EGTM) status report. Ann Oncol (2010) 21:441–7. doi: 10.1093/annonc/mdp332
36. Singh VK, Yadav D, Garg PK. Diagnosis and management of chronic pancreatitis: a review. JAMA (2019) 322:2422–34. doi: 10.1001/jama.2019.19411
37. Kichler A, Jang S. Chronic pancreatitis: epidemiology, diagnosis, and management updates. Drugs (2020) 80:1155–68. doi: 10.1007/s40265-020-01360-6
38. Eriksen RØ, Strauch LS, Sandgaard M, Kristensen TS, Nielsen MB, Lauridsen CA. Dynamic contrast-enhanced CT in patients with pancreatic cancer. Diagnostics (2016) 6:34. doi: 10.3390/diagnostics6030034
39. Kitano M, Yoshida T, Itonaga M, Tamura T, Hatamaru K, Yamashita Y. Impact of endoscopic ultrasonography on diagnosis of pancreatic cancer. J Gastroenterol (2019) 54:19–32. doi: 10.1007/s00535-018-1519-2
40. Dutta AK, Chacko A. Head mass in chronic pancreatitis: Inflammatory or malignant. World J Gastrointest Endosc (2015) 7:258–64. doi: 10.4253/wjge.v7.i3.258
41. Schima W, Böhm G, Rösch CS, Klaus A, Függer R, Kopf H. Mass-forming pancreatitis versus pancreatic ductal adenocarcinoma: CT and MR imaging for differentiation. Cancer Imaging (2020) 20:1–12. doi: 10.1186/s40644-020-00324-z
42. Aronen A, Aittoniemi J, Huttunen R, Nikkola A, Rinta-Kiikka I, Nikkola J, et al. Plasma suPAR may help to distinguish between chronic pancreatitis and pancreatic cancer. Scand J Gastroenterol (2021) 56:81–5. doi: 10.1080/00365521.2020.1849383
43. Mayerle J, Kalthoff H, Reszka R, Kamlage B, Peter E, Schniewind B, et al. Metabolic biomarker signature to differentiate pancreatic ductal adenocarcinoma from chronic pancreatitis. Gut (2018) 67:128–37. doi: 10.1136/gutjnl-2016-312432
44. Zaborienė I, Barauskas G, Gulbinas A, Ignatavičius P, Lukoševičius S, Žvinienė K. Dynamic perfusion CT–a promising tool to diagnose pancreatic ductal adenocarcinoma. Open Med (2021) 16:284–92. doi: 10.1515/med-2021-0228
45. Parakh A, Tirkes T. Advanced imaging techniques for chronic pancreatitis. Abdominal Radiol (2020) 45:1420–38. doi: 10.1007/s00261-019-02191-0
46. Yadav AK, Sharma R, Kandasamy D, Pradhan RK, Garg PK, Bhalla AS, et al. Perfusion CT–can it resolve the pancreatic carcinoma versus mass forming chronic pancreatitis conundrum? Pancreatology (2016) 16:979–87. doi: 10.1016/j.pan.2016.08.011
47. Mankoff DA, Dunnwald LK, Gralow JR, Ellis GK, Schubert EK, Tseng J, et al. Changes in blood flow and metabolism in locally advanced breast cancer treated with neoadjuvant chemotherapy. J Nucl Med (2003) 44:1806–14.
48. Jain RK, Duda DG, Willett CG, Sahani DV, Zhu AX, Loeffler JS, et al. Biomarkers of response and resistance to antiangiogenic therapy. Nat Rev Clin Oncol (2009) 6:327–38. doi: 10.1038/nrclinonc.2009.63
49. Othman AE, Falkner F, Weiss J, Kruck S, Grimm R, Martirosian P, et al. Effect of temporal resolution on diagnostic performance of dynamic contrast-enhanced magnetic resonance imaging of the prostate. Invest Radiol (2016) 51:290–6. doi: 10.1097/RLI.0000000000000234
50. Li KL, Buonaccorsi G, Thompson G, Cain JR, Watkins A, Russell D, et al. An improved coverage and spatial resolution–using dual injection dynamic contrast-enhanced (ICE-DICE) MRI: A novel dynamic contrast-enhanced technique for cerebral tumors. Magn Reson Med (2012) 68:452–62. doi: 10.1002/mrm.23252
51. Luypaert R, Sourbron S, de Mey J. Validity of perfusion parameters obtained using the modified tofts model: a simulation study. Magn Reson Med (2011) 65:1491–7. doi: 10.1002/mrm.22728
52. Shaw JL, Yang Q, Zhou Z, Deng Z, Nguyen C, Li D, et al. Free-breathing, non-ECG, continuous myocardial T1 mapping with cardiovascular magnetic resonance multitasking. Magn Reson Med (2019) 81:2450–63. doi: 10.1002/mrm.27574
53. Ma S, Nguyen CT, Han F, Wang N, Deng Z, Binesh N, et al. Three-dimensional simultaneous brain T1, T2, and ADC mapping with MR multitasking. Magn Reson Med (2020) 84:72–88. doi: 10.1002/mrm.28092
54. Ma S, Wang N, Fan Z, Kaisey M, Sicotte NL, Christodoulou AG, et al. Three-dimensional whole-brain simultaneous T1, T2, and T1ρ quantification using MR multitasking: Method and initial clinical experience in tissue characterization of multiple sclerosis. Magn Reson Med (2021) 85:1938–52. doi: 10.1002/mrm.28553
55. Baxi AC, Jiang Q, Hao J, Yang Z, Woods K, Keilin S, et al. The effect of solid pancreatic mass lesions on pancreatic duct diameter at endoscopic ultrasound. Endosc Ultrasound (2017) 6:103. doi: 10.4103/2303-9027.204812
56. Scialpi M, Cagini L, Pierotti L, De Santis F, Pusiol T, Piscioli I, et al. Detection of small (≤ 2 cm) pancreatic adenocarcinoma and surrounding parenchyma: correlations between enhancement patterns at triphasic MDCT and histologic features. BMC Gastroenterol (2014) 14:1–8. doi: 10.1186/1471-230X-14-16
57. Frampas E, Morla O, Regenet N, Eugene T, Dupas B, Meurette G. A solid pancreatic mass: Tumour or inflammation? Diagn Interv Imaging (2013) 94:741–55. doi: 10.1016/j.diii.2013.03.013
58. O’Flynn EAM, DeSouza NM. Functional magnetic resonance: biomarkers of response in breast cancer. Breast Cancer Res (2011) 13:1–10.
59. Georgiou L, Sharma N, Broadbent DA, Wilson DJ, Dall BJ, Gangi A, et al. Estimating breast tumor blood flow during neoadjuvant chemotherapy using interleaved high temporal and high spatial resolution MRI. Magn Reson Med (2018) 79:317–26. doi: 10.1002/mrm.26684
Keywords: quantitative imaging, dynamic contrast enhanced magnetic resonance imaging, microcirculation properties, Multitasking DCE, differential diagnosis of chronic pancreatitis and pancreatic ductal adenocarcinoma
Citation: Wang N, Gaddam S, Xie Y, Christodoulou AG, Wu C, Ma S, Fan Z, Wang L, Lo S, Hendifar AE, Pandol SJ and Li D (2023) Multitasking dynamic contrast enhanced magnetic resonance imaging can accurately differentiate chronic pancreatitis from pancreatic ductal adenocarcinoma. Front. Oncol. 12:1007134. doi: 10.3389/fonc.2022.1007134
Received: 30 July 2022; Accepted: 16 November 2022;
Published: 06 January 2023.
Edited by:
Pilar López-Larrubia, Spanish National Research Council (CSIC), SpainReviewed by:
Tao Yu, China Medical University, ChinaZhendong Jin, Second Military Medical University, China
Copyright © 2023 Wang, Gaddam, Xie, Christodoulou, Wu, Ma, Fan, Wang, Lo, Hendifar, Pandol and Li. This is an open-access article distributed under the terms of the Creative Commons Attribution License (CC BY). The use, distribution or reproduction in other forums is permitted, provided the original author(s) and the copyright owner(s) are credited and that the original publication in this journal is cited, in accordance with accepted academic practice. No use, distribution or reproduction is permitted which does not comply with these terms.
*Correspondence: Debiao Li, RGViaWFvLkxpQGNzaHMub3Jn