 Xianwu Xia
 Jiazhou Wang
 Sheng Liang2
 Weigang Hu
- 1The Second Affiliated Hospital, School of Medicine, Zhejiang University, Hangzhou, Zhejiang, China
- 2Department of Oncology Intervention, The Affiliated Municipal Hospital of Taizhou University, Taizhou, China
- 3Department of Radiation Oncology, Fudan University Shanghai Cancer Center, Shanghai, China
- 4Department of Oncology, Shanghai Medical College, Fudan University, Shanghai, China
- 5Department of Oncology Intervention, Jiangxi University of Traditional Chinese Medicine, Nanchang, Jiangxi, China
A parotid neoplasm is an uncommon condition that only accounts for less than 3% of all head and neck cancers, and they make up less than 0.3% of all new cancers diagnosed annually. Due to their nonspecific imaging features and heterogeneous nature, accurate preoperative diagnosis remains a challenge. Automatic parotid tumor segmentation may help physicians evaluate these tumors. Two hundred eighty-five patients diagnosed with benign or malignant parotid tumors were enrolled in this study. Parotid and tumor tissues were segmented by 3 radiologists on T1-weighted (T1w), T2-weighted (T2w) and T1-weighted contrast-enhanced (T1wC) MR images. These images were randomly divided into two datasets, including a training dataset (90%) and an validation dataset (10%). A 10-fold cross-validation was performed to assess the performance. An attention base U-net for parotid tumor autosegmentation was created on the MRI T1w, T2 and T1wC images. The results were evaluated in a separate dataset, and the mean Dice similarity coefficient (DICE) for both parotids was 0.88. The mean DICE for left and right tumors was 0.85 and 0.86, respectively. These results indicate that the performance of this model corresponds with the radiologist’s manual segmentation. In conclusion, an attention base U-net for parotid tumor autosegmentation may assist physicians to evaluate parotid gland tumors.
Introduction
Parotid tumors are uncommon neoplasms, accounting for less than 3% of all head and neck cancers (1). Unfortunately, a lack of early detection may lead to tumor progression, and nearly 20% of untreated polymorphic adenomas will become malignant tumors (2). In addition, 80% of salivary gland tumors occur in the parotid gland, of which 21% to 64% are malignant (3). Due to the absence of specific imaging findings (parotid tumor may have different appearance in MR images), their heterogeneous clinical nature, accurate diagnosis before surgery remains a challenge (4).
Similar to lung nodule detection, automatic parotid tumor segmentation may facilitate physicians evaluating these parotid tumors. It can be used to inspect the MRI image and highlight the tumor region. At the same time, with the progress of quantitative image analysis technology, we can construct a quantitative imaging model of parotid gland tumors through accurate and consistent automatic segmentation of tumors, which can be used to predict the pathological type and prognosis of the patients (5).
In this study, we developed and assessed an autosegmentation model for parotid tumors that can be used to improve the imaging evaluation of these conditions. This proposed model was also compared to other model architectures. Since we combined three MRI sequences, the value of each MRI sequence was investigated.
Methods
The study workflow is presented in Figure 1. Patient parotid MR images were exported from PACS. Parotid and tumor tissues were segmented by 3 radiologists based on T1-weighted (T1w), T2-weighted (T2w) and T1-weighted contrast-enhanced (T1wC) MR images. A 10-fold cross-validation was performed to assess the segmentation performance. These images were randomly divided into two datasets, including a training dataset (90%) and an validation dataset (10%). The autosegmentation model was trained on the training dataset, and its performance was then tested on the validation dataset. This retrospective study was approved by the Institutional Review Board of Fudan University Shanghai Cancer Center and Taizhou Municipal Hospital, and all methods were performed in accordance with the guidelines and regulations of this ethics board. The Hospital Ethics Committee agreed to the informed consent waiver.
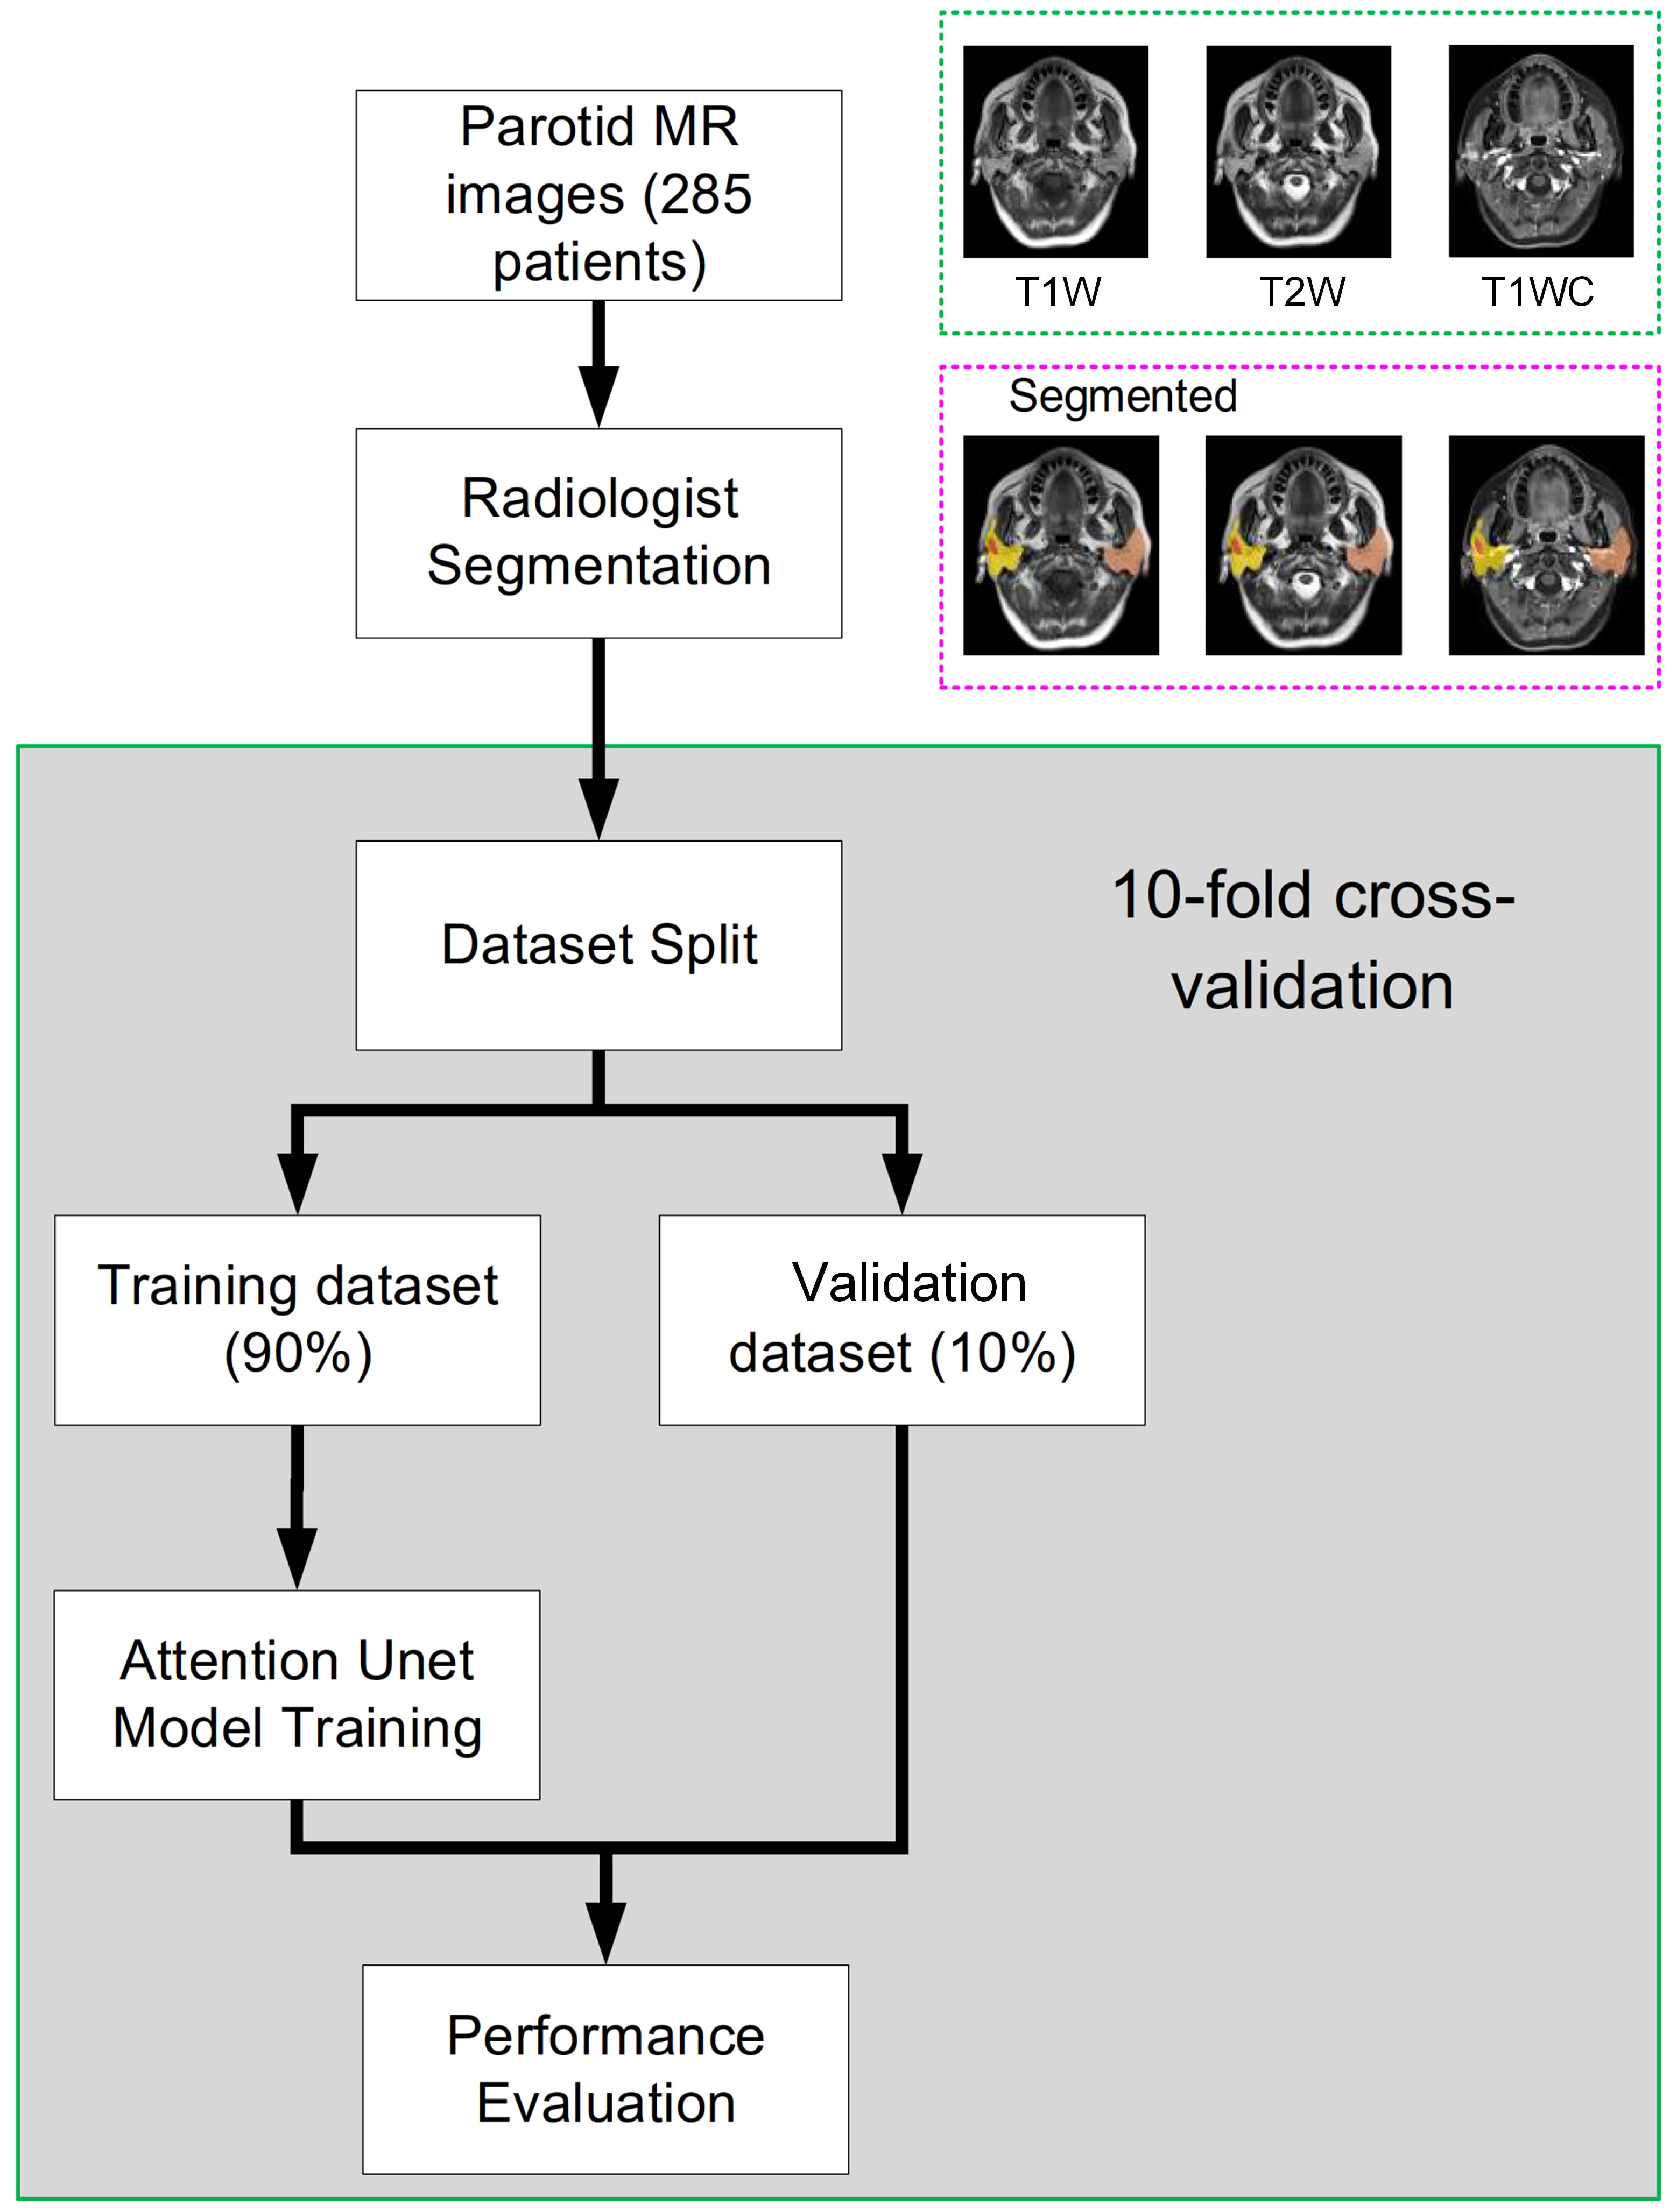
Figure 1 The whole study workflow. The parotid MR images were randomly divided into two datasets, including training and evaluation. Then, the performance was assessed on the validation dataset. Tenfold cross-validation was used to obtain a reliable result.
Patients and MRI image acquisition
Two hundred eighty-five patients diagnosed with benign or malignant parotid tumors from two institutions were enrolled in this study. Among these patients, 185 were male and 100 were female; the mean age of the patients was 52.4 years (range, 21–93 years). These patients were treated from 2014 to 2018. All patients received surgical resection and had a pathology report. The patient characteristics are shown in Table 1. All patients received a parotid site MRI scan before treatment. Three MR scanners were used to acquire these images, and details of the image parameters are shown in Table 2. The scan parameters were based on our parotid image protocol and were adjusted during scanning based on image quality by the MRI operator.
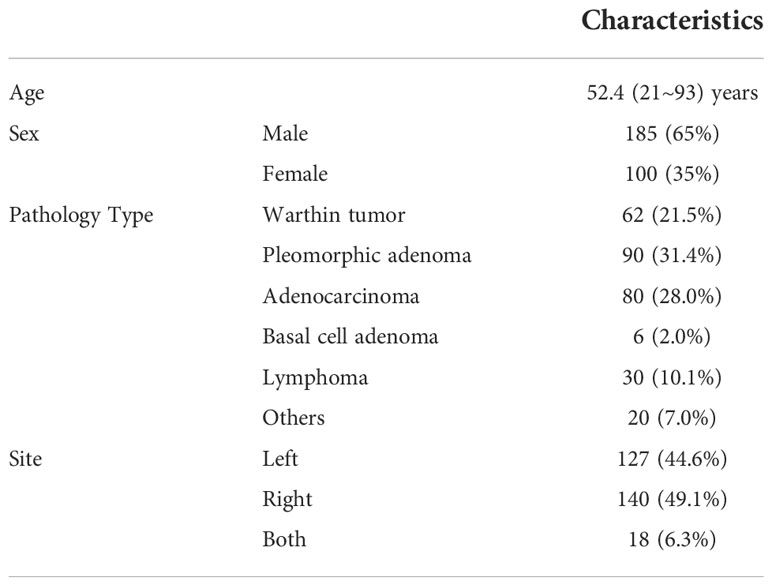
Table 1 Patient characteristics.
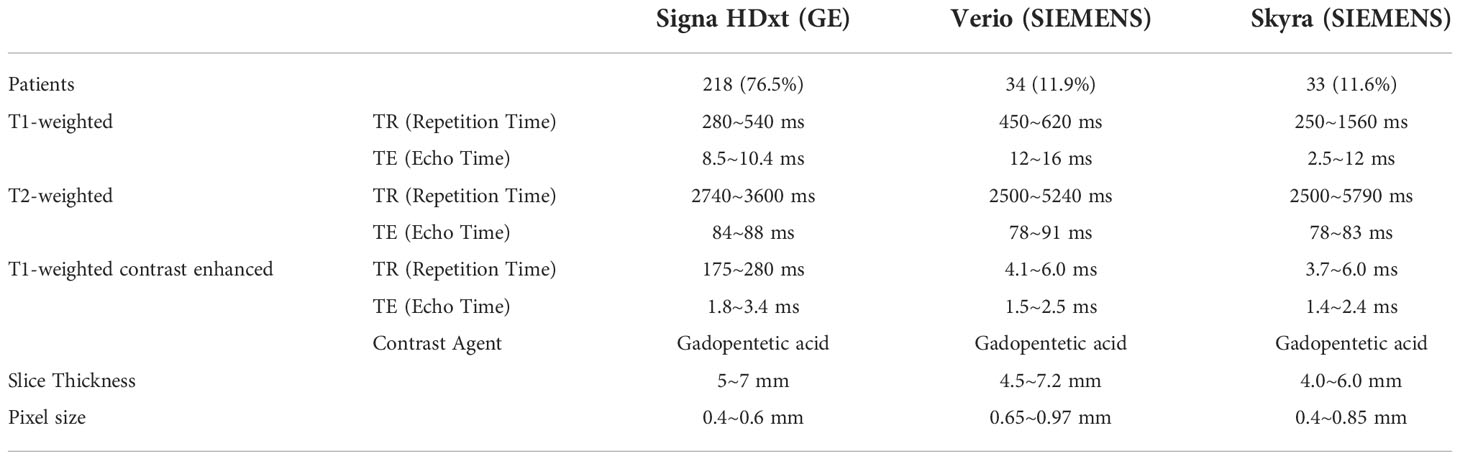
Table 2 MR scan parameters.
Tumor and parotid manual delineation
Parotid tumors were distinguished on axial thin-Section T1w, T2w and T1wC MR images and segmented by three experienced radiologists (>5 years of experience) in MIM (version 6.8.10, Cleveland, US). These three series were registered and fused before segmentation. The radiologists were required to distinguish the pathology type of the parotid tumor before delineation. Each radiologist segmented approximately 90 patients. To make the delineation between different radiologists consistent, all delineations were reviewed by one senior radiologist (more than 10 years’ experience). To improve the performance of the tumor delineation, the parotids were also segmented.
The attention U-net
A 2D U-Net with an attention module was used in this task. This network was inspired by the application of an attention mechanism to medical image deep learning-based segmentation (6–8). The basic structure of the model is shown in Figure 2. The input (512 x 512 x 3) was obtained from MR images. The channels were combined from the T1w, T2w and T1wC sequences. The output (512 x 512 x 4) contained 4 channels for 4 ROIs, including the left parotid, right parotid, left tumor and right tumor. The U-net was constituted by encoder and decoder parts. The encoder part was constituted by 12 convolution blocks and 4 max pooling blocks. The convolution block had a 3x3 convolution layer, batch normalization layer and rectified linear unit (ReLU) layer. The maximum pooling layer was used to downsample the features. Similarly, the decoder part was constituted by many convolution blocks and upsampling blocks. The convolution block was the same as the encoder part, using a 3x3 convolution layer, batch normalization layer and rectified linear unit (ReLU) layer. The skip connection was used to connect the encoder and decoder parts with the same feature map size. An attention gate was placed in these skip connections to improve the segmentation results. Because the slices thickness (4~7.2 mm) was larger than the pixel size (0.4~1mm), MR images were not be resampled to isotropy resolution. And
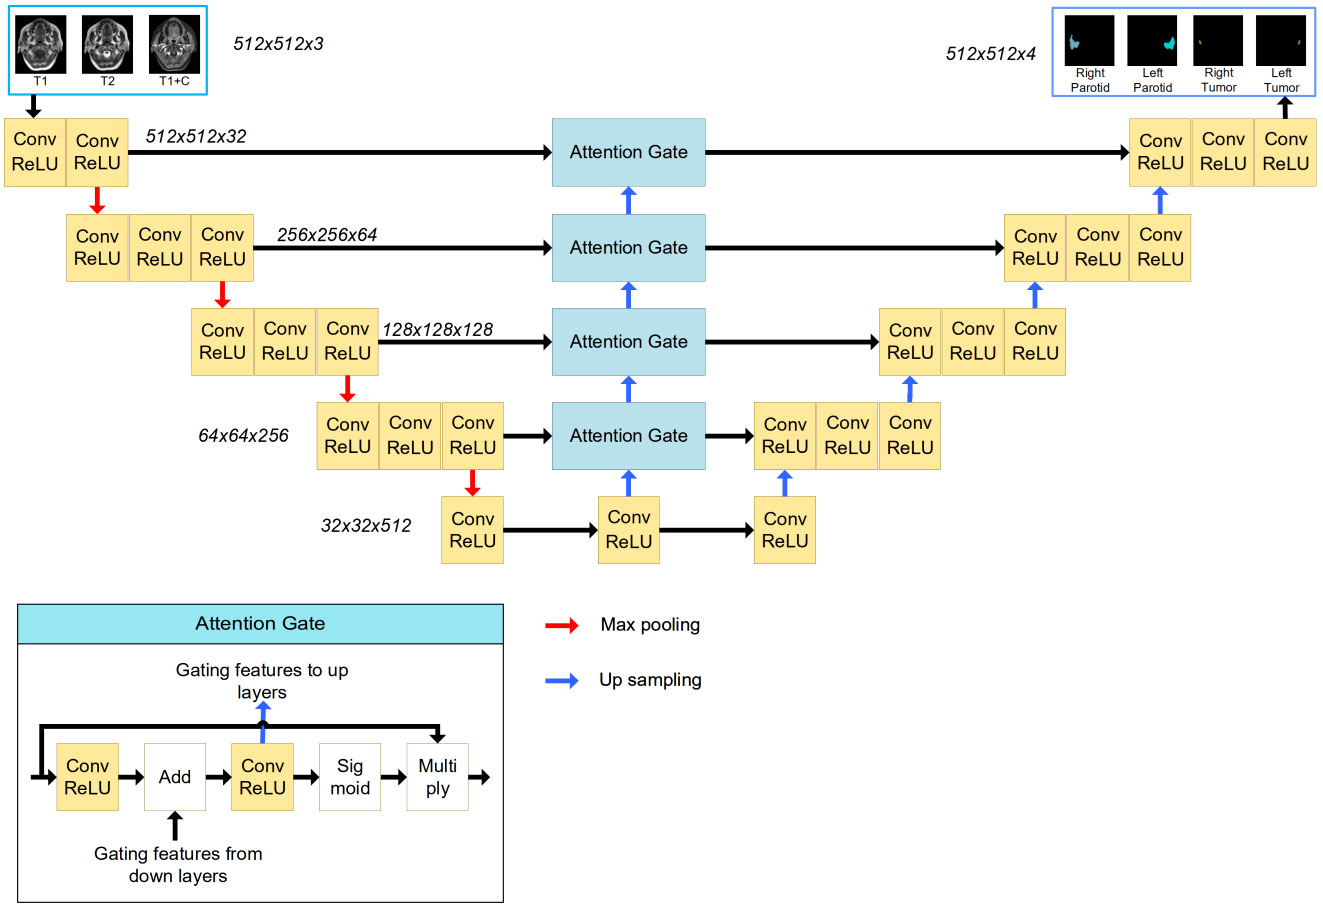
Figure 2 The structure of the attention-based U-Net. The input of the network is three MR images, and the output of the network is the four segmentations. The attention gate structure is shown in the left corner.
The tumor and parotid tissues were relatively small compared to the entire image size. The attention mechanism was used to create a model focused on local regions that extracted more relevant features from the feature maps. A mask with pixel values between 0 and 1 was generated by a sigmoid activation function. By multiplying the mask by feature maps, the region of interest remained unchanged, and the rest of the feature map was set to zero.
Model training
Before input into the model, the gray value of the MR images was centralized to 0.5 and scaled to [0, 1]. No spatial resampling was performed in the preprocessing stage. We used the original pixels, which means that different patients may have different pixel spacings. The loss used in this phase was 1- DICE index. The whole model was trained for 200 epochs with a learning rate of 1e-4, and the optimizer was RMSprop. The training procedure took approximately 20 h to complete on one 2080 ti GPU (Nvidia, Santa Clara, CA). The Python deep learning library pytoch (version 1.5) was applied to establish this autosegmentation system.
Next, a data augmentation method was performed. Two argumentation processes were implemented: gray level disturbance and shape disturbance. For gray disturbance, the gray value of the MR image was multiplied by a random number [0.9~1.1], and a random number [-0.1~0.1] was added. This random number was added to the normalized image. For shape disturbance, MR images and binary contour images were deformed using affine transformation. The augmentation method was the same as that in our previous study (9). Meanwhile, to increase the training samples, we mirrored images (and adjusted for the corresponding left and right labels) with a probability of 0.5.
To investigate the impact of each MRI sequence, 6 models with different image sequence combinations were trained and evaluated, including T1w only, T2w only, T1wC only, T1w+T2w, T1w+T1wC and T2w+T1wC.
Comparison to other models
Three other models, including DeepLab Version 3 (10), attention U-Net (11) and PSPNet (12), were trained on the same dataset. Some modifications were performed, such as changing the output channels and changing the softmax function to a sigmoid function. The same training hyperparameters were used, and all models converged after 200 epoch iterations.
Performance evaluation
Four indices were calculated for performance evaluation, including the Dice similarity coefficient (DICE), the Jaccard similarity coefficient (JACCARD), the 95% percentile of Hausdorff distance (HD95) and the average Hausdorff distance (AHD). The DICE and JACCARD are computed by the following:
where A represents the volume of the manual segmentation, B represents the volume of the autosegmentation, | · | denotes the volume of truth or predicted ROIs, |A∩B| indicates the volume shared by A and B and |A∪B| represents the total volume of A and B. Larger DICE and JACCARD values indicate more accurate results.
Results
Segmentation results
A 10-fold cross-validation was used in this study. A total of 256 (90%) patients were used for model training, and 29 (10%) patients were used for model evaluation and performance assessment. Training was converged after 200 epoch iterations. The results of the validation dataset are shown in Figure 3. It can be observed that the performance of the validation dataset has a relatively large variation.
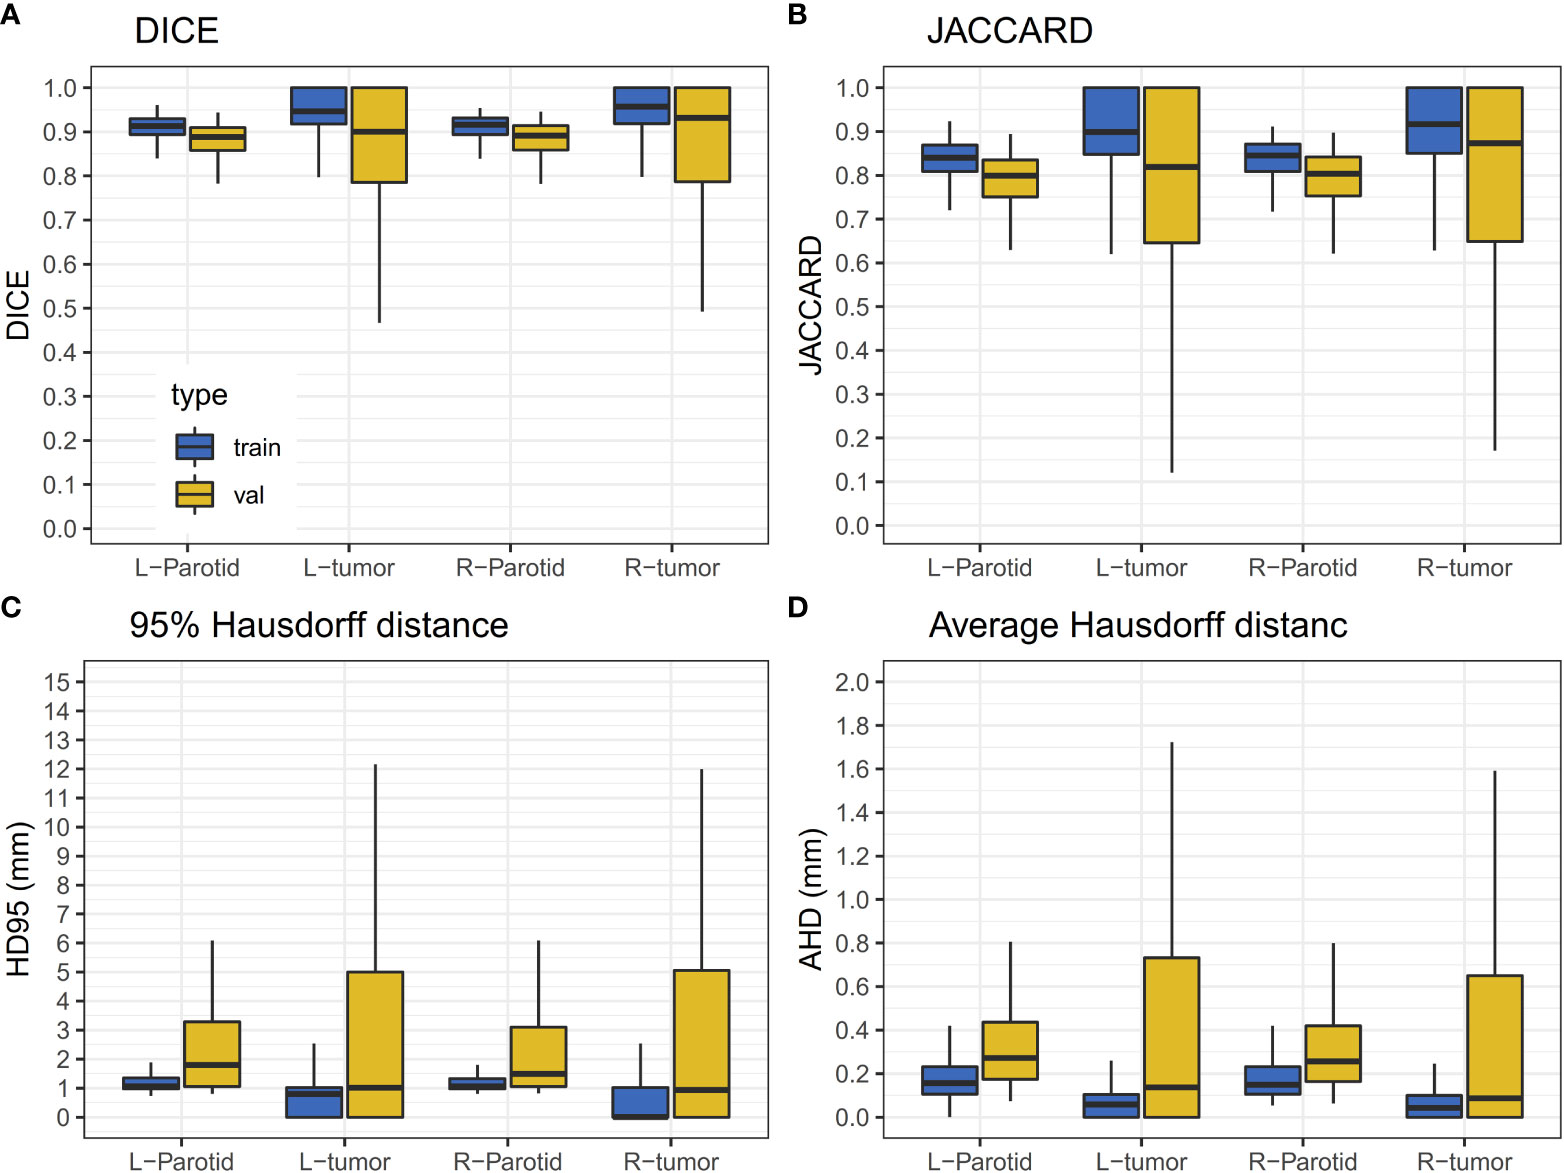
Figure 3 Results of the validation dataset. The horizontal lines indicate the median values. (A) The DICE value for the training and validation dataset. (B) JACCARD value for the training and validation datasets. (C) The HD95 value for the training and validation datasets. (D) The AHD value for the training and validation datasets.
For the results of the cross-validation, the mean DICE for both parotids was 0.88, and the mean DICE for left and right tumors was 0.85 and 0.86, respectively. The mean JACCARD for left and right parotids was 0.79. The mean JACCARD for left and right tumors was 0.78 and 0.80, respectively. The 95% ranges for left and right parotid DICE were 0.77-0.94 and 0.75-0.95, respectively. The 95% ranges for left and right tumor DICE were 0.37-1.00 and 0.30-1.00, respectively. Detailed values of these results are provided in Supplementary Table S1. Figure 4 demonstrates a result on a left parotid tumor patient.

Figure 4 An example of the results. a1, b1 and c1 represent one slice of the MR images; a2, b2 and c2 represent the results of autosegmentation; a3, b3 and c3 represent the results of manual segmentation; a4, b4 and c4 show the comparison of the tumor segmentation.
Comparison to other models
The performance of three other models, including DeepLab Version 3 (10), attention U-Net (11) and PSPNet (12), is presented in Table 3. Since all of the models were trained on the same training dataset, this comparison provides insight into the performance of the proposed model.
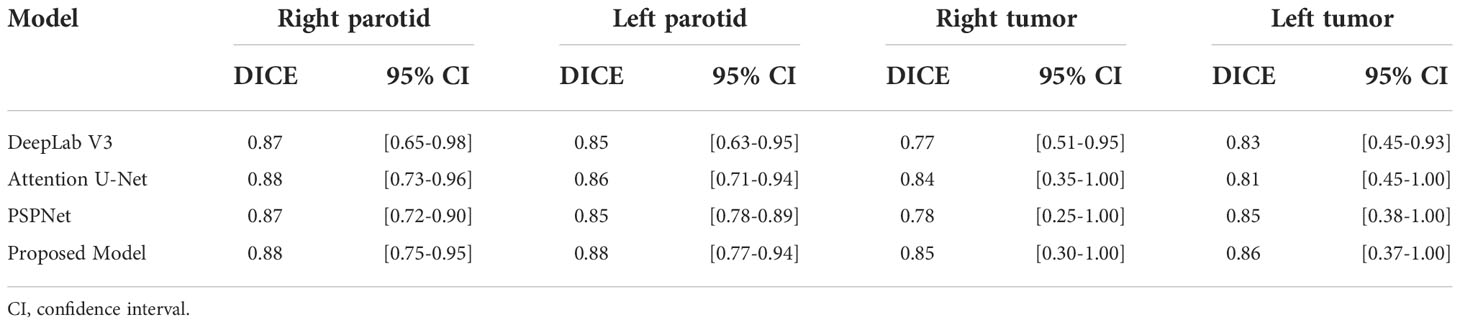
Table 3 The comparison with other models.
The impact of MRI sequences
The performance of models with different MRI sequences is presented in Table 4. For parotid gland segmentation, one MRI sequence can achieve segmentation performance similar to that of a combination of three MRI sequences. However, for tumor segmentation, combining three image sequences can provide the best performance. Among the three MRI sequences, T1w performed better than the other two.
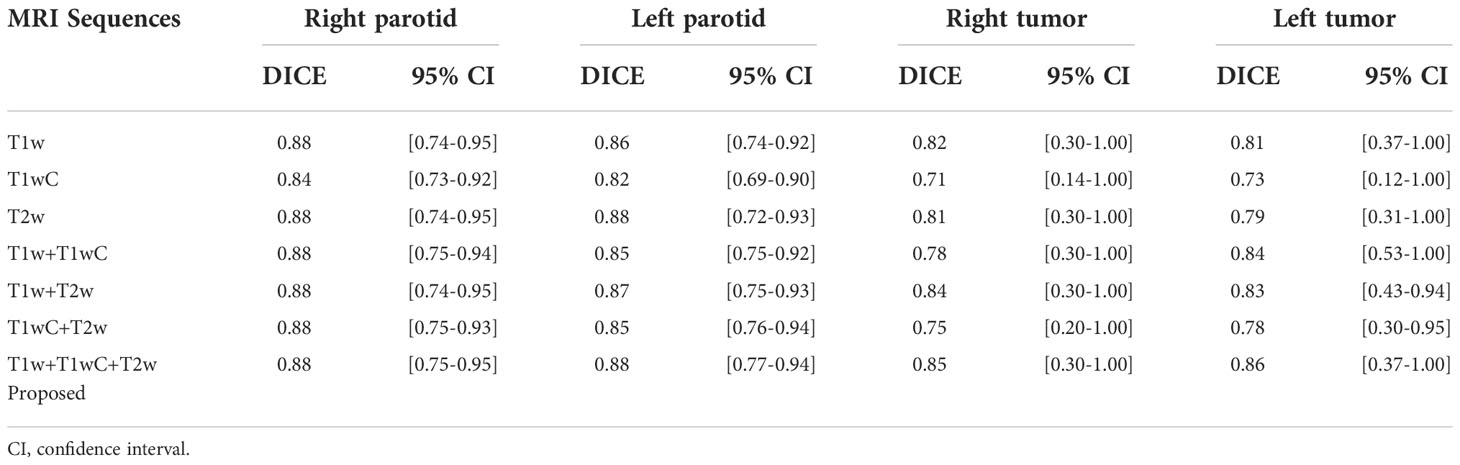
Table 4 The comparison between different MRI sequences.
Discussion
In this study, we implemented an attention base U-net for parotid tumor autosegmentation on MRI T1w, T2w and T1wC images. For a rare tumor, the entire dataset was relatively large, including 285 patients, and multiple MRI scanners were used for image acquisition. All whole images were acquired over the course of 4 years with many adjustments to the scan parameters. We believe these images are representative of most parotid tumor MRI scenarios.
An attention mechanism was applied to optimize the extracted spatial information of the feature maps in our study (13). Here, we used a mask with pixel values between 0 and 1 that was generated by transformation, and then feature maps were multiplied by the mask. The region of interest remained unchanged, and the rest of the feature map was set to zero because the regions of the parotid and tumor tissues were relatively small compared to the other organs. This will facilitate model training to focus on critical regions and provide improved results. Compared to the original attention U-Net, our proposed model extracts the gate feature from the bottom of the network. This architecture may help the network focus consistently on only a small region. For hyper-parameters tuning, the major parameters were learning rate. We have use 3 different learn rate (1e-2, 1e-3 and 1e-4), the results showed that 1e-4 can provide the stable results (Figure S1).
There are some differences in the difficulty of organs and tumors delineating. Organ delineation is a relatively simple task. Compare to other’s study, our research on the performance of parotid gland segmentation is similar (DICE = 0.88) (14, 15). Few studies have reported using MR imaging for parotid gland autosegmentation. Kieselmann et al. performed atlas-based autosegmentation for parotids (14). The DICE values for Kieselmann’s study were 0.83 and 0.84 for the left and right parotid, respectively. Nuo et al. used deep learning technology on a low-field MR segment of the parotid gland and found that the best performance was 0.85 (15). Compared with these studies, our data were delineated by radiologists with the same protocol on both the training and validation data. The data consistency was relatively good.
Parotid tumor delineation is a relatively difficult task. The main problem is the lack of training samples and the lack of consistent delineation standards (16). Parotid tumor delineation is challenging in medical image segmentation due to the infrequency of this disease, which physician may not have enough experience to precisely delineate the tumor. Even after carefully reviewed the manual segmentation, there still exist some uncertainty in the manual delineation. Figure 5 shows a patient with a DICE of 0.127 for a right tumor. After carefully checking the data and reviewing this patient’s history, we found that the delineation in training dataset only segmented part of the tumor, while this patient exhibited a bilateral diffuse MALT (mucosa-associated lymphoid tissue, mucosa-associated lymphoid tissue) lesion. Given this, our model correctly marked the entire tumor, and in this case, the tumor comprised nearly the entire parotid.
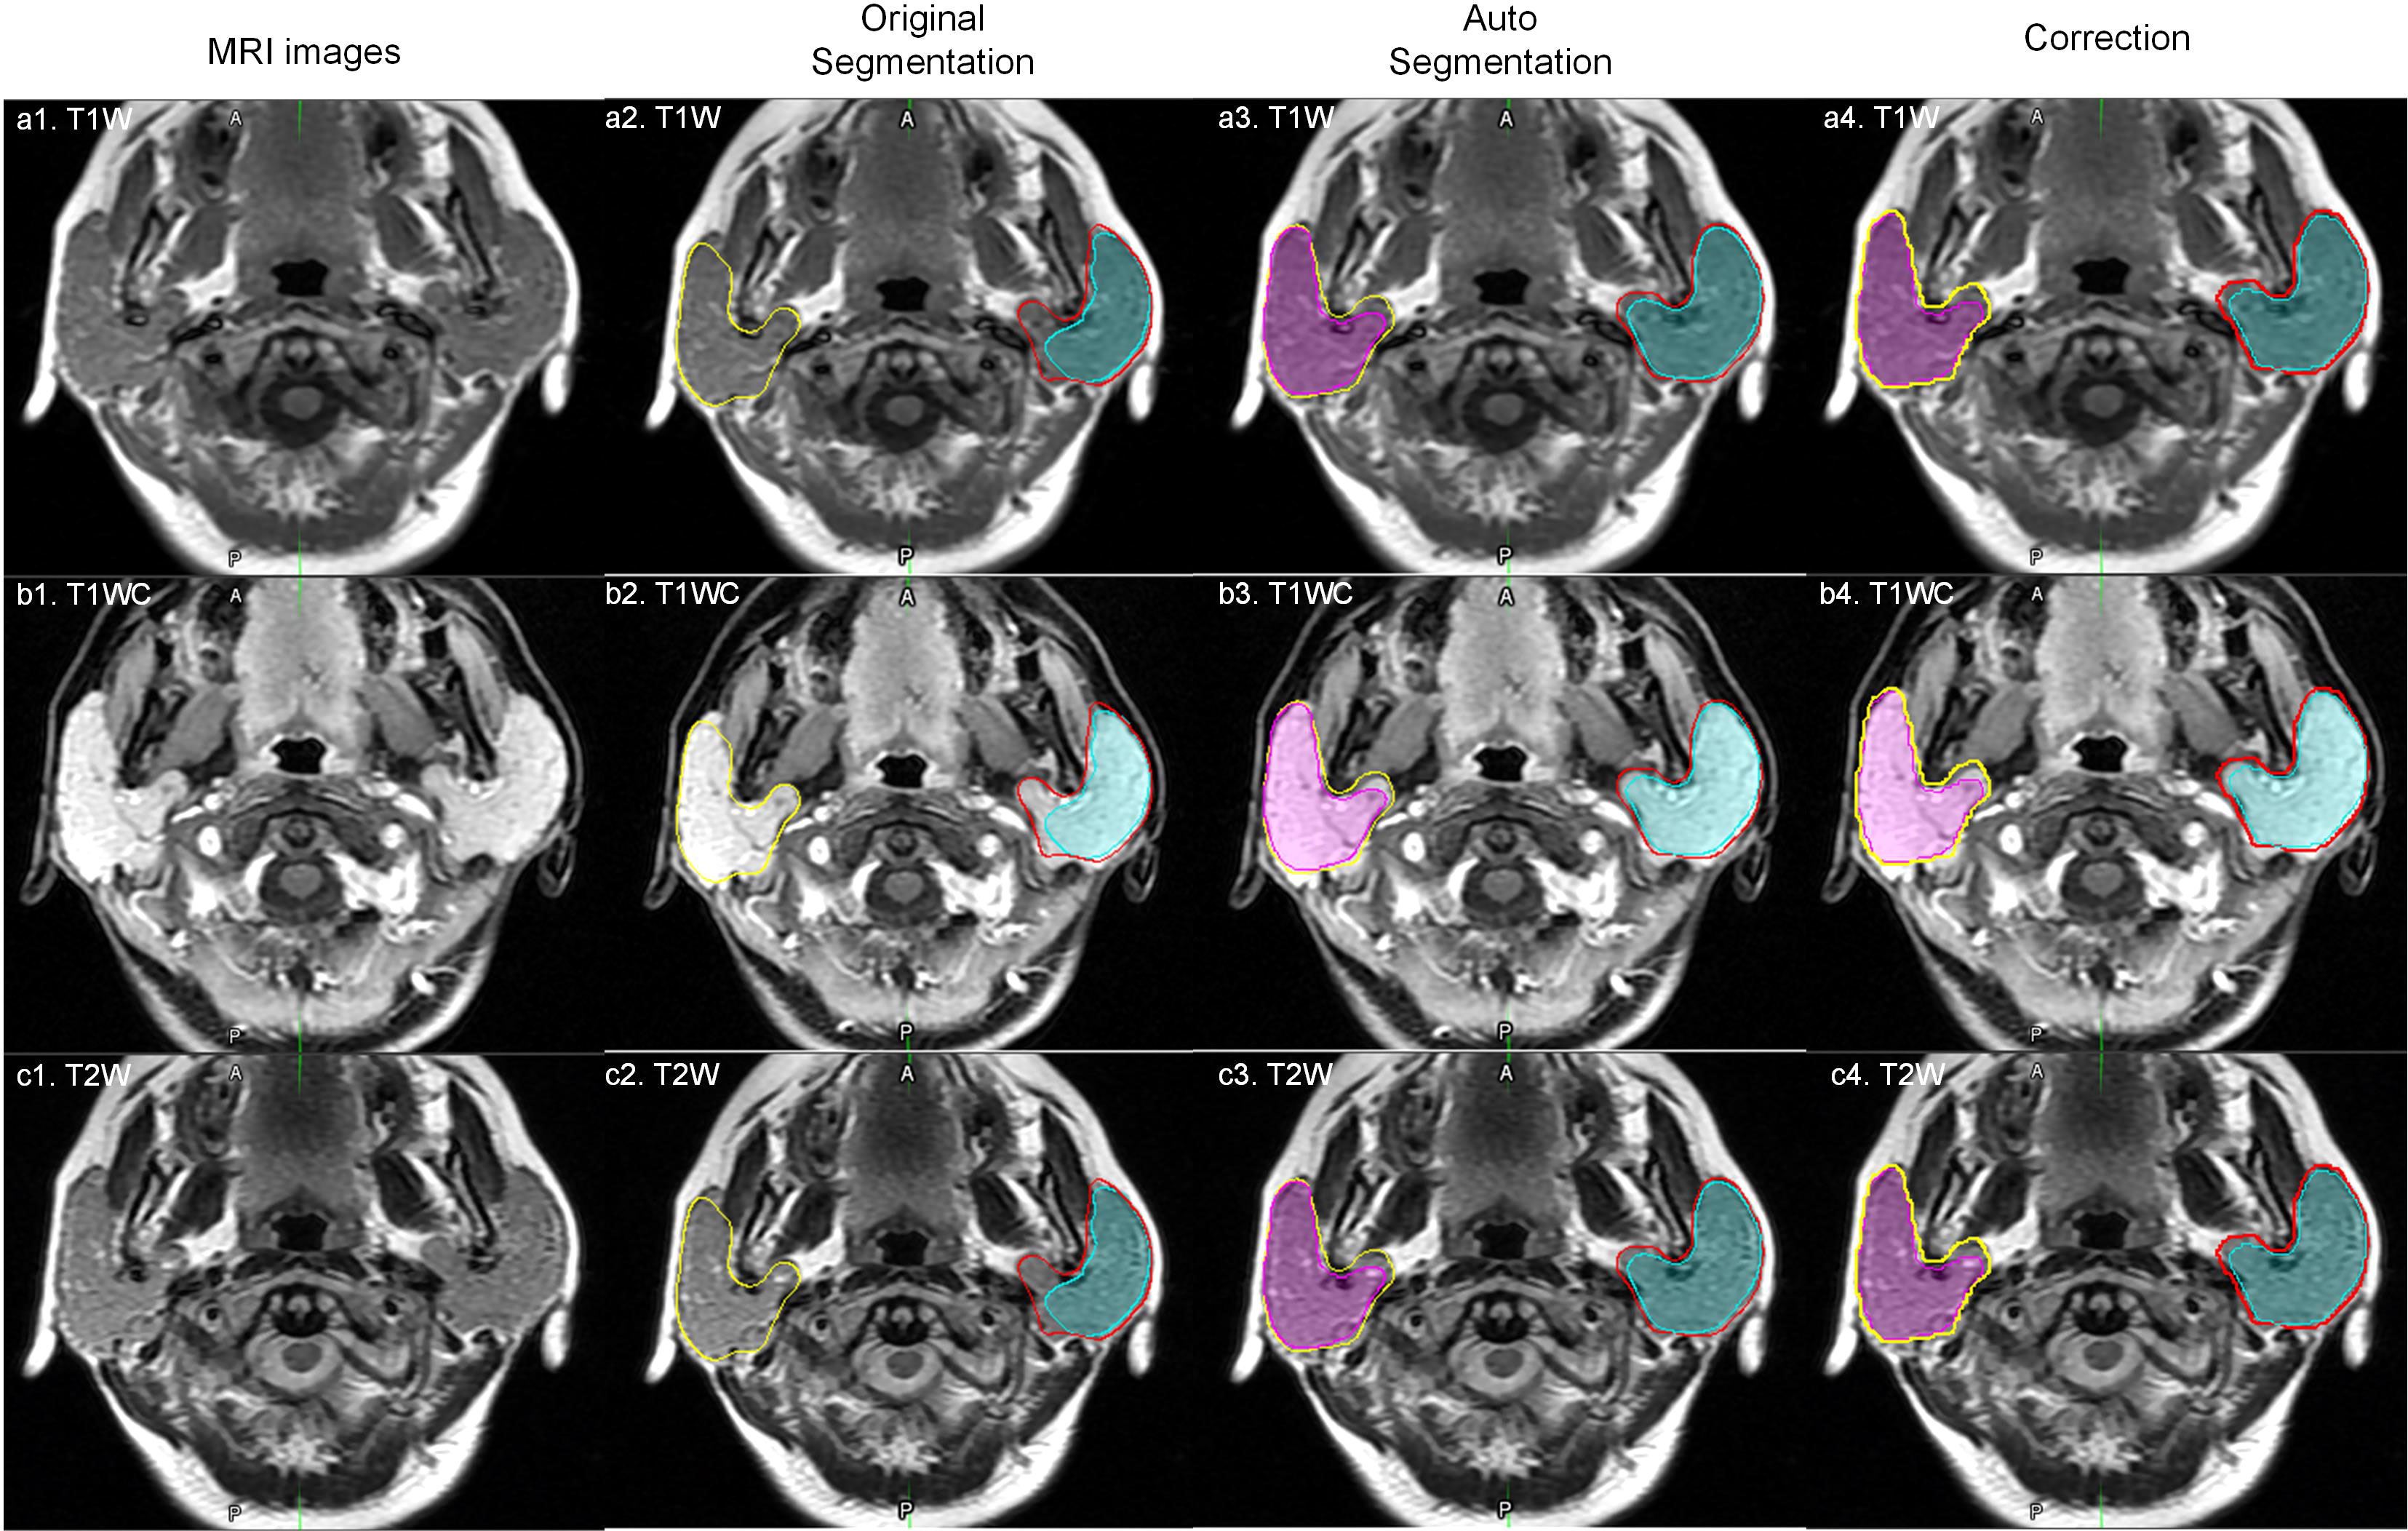
Figure 5 An outlier example. The yellow and red lines represent the right and left parotid. The pink and cyan colored filling represents the right and left tumor. a1, b1 and c1 represent one slice of MR images; a2, b2 and c2 represent original manual segmentation. The right tumor was not delineated correctly; a3, b3 and c3 represent the results of autosegmentation; a4, b4 and c4 represent the corrected segmentation by manual delineation by physicians.
There is an overfitting between training and validation. We believe this degree of overfitting is acceptable. While the deviation of performance between different patients still large. For example, the 95% CI of DICE was [0.30-1.00] for of right tumor. This phenomenon indicates that training sample may too small to cover different types of parotid tumors. And the training dataset also may have some uncertainty in delineation.
For the clinical application, because the parotid cancer is a rare cancer, physicians may not have enough experience to assess tumor-infiltrating area. Tumor autosegmentaion may help physicians to do this. Further researches may require to demonstrate the benefit of this model.
There are some limitations to this study. First, we did not validate our model on an external dataset, which might be valuable for providing reliability information. However, because there were 3 MR scanners were used to acquire these images, and the parameters of image protocol were changed during 4 years, using cross validation can precisely estimate the model performance. Second, we combined three images, T1w, T2w and T1wC. For routine diagnostic purposes, some of these images may not be acquired, and a model accounting for missing data may need to be developed in the future.
Conclusion
An attention base U-net for parotid tumor autosegmentation may assist physicians to evaluate parotid gland tumors.
Data availability statement
The original contributions presented in the study are included in the article/Supplementary Material. Further inquiries can be directed to the corresponding authors.
Ethics statement
The studies involving human participants were reviewed and approved by Institutional Review Board of Fudan University Shanghai Cancer Center and Taizhou Municipal Hospital. Written informed consent for participation was not required for this study in accordance with the national legislation and the institutional requirements.
Author contributions
JW, XX, LX, and WH designed study. Data collection: SL, FY, and M-MT. Image segmentation: SL and FY. Data analysis and interpretation XX and JW. Manuscript written – all authors contributed. All authors read and approved final manuscript.
Funding
The work was supported by the Zhejiang Provincial Health Science and Technology Project. Grant number: 2021KY396.
Conflict of interest
The authors declare that the research was conducted in the absence of any commercial or financial relationships that could be construed as a potential conflict of interest.
Publisher’s note
All claims expressed in this article are solely those of the authors and do not necessarily represent those of their affiliated organizations, or those of the publisher, the editors and the reviewers. Any product that may be evaluated in this article, or claim that may be made by its manufacturer, is not guaranteed or endorsed by the publisher.
Supplementary material
The Supplementary Material for this article can be found online at: https://www.frontiersin.org/articles/10.3389/fonc.2022.1028382/full#supplementary-material
Abbreviations
DICE, Dice similarity coefficient.
References
1. Lewis AG, Tong T, Maghami E. Diagnosis and management of malignant salivary gland tumors of the parotid gland. Otolaryngol Clin North Am (2016) 49:343–80. doi: 10.1016/j.otc.2015.11.001
2. Zhou N, Chu C, Dou X, Li M, Liu S, Zhu L, et al. Early evaluation of irradiated parotid glands with intravoxel incoherent motion MR imaging: correlation with dynamic contrast-enhanced MR imaging. BMC Cancer (2016) 16:865. doi: 10.1186/s12885-016-2900-2
3. Tao X, Yang G, Wang P, Wu Y, Zhu W, Shi H, et al. The value of combining conventional, diffusion-weighted and dynamic contrast-enhanced MR imaging for the diagnosis of parotid gland tumours. Dentomaxillofac Radiol (2017) 46(6):20160434. doi: 10.1259/dmfr.20160434
4. Sentani K, Ogawa I, Ozasa K, Sadakane A, Utada M, Tsuya T, et al. Characteristics of 5015 salivary gland neoplasms registered in the Hiroshima tumor tissue registry over a period of 39 years. J Clin Med (2019) 8(5):566. doi: 10.3390/jcm8050566
5. Zheng YM, Li J, Liu S, Cui JF, Zhan JF, Pang J, et al. MRI-Based radiomics nomogram for differentiation of benign and malignant lesions of the parotid gland. Eur Radiol (2021) 31(6):4042–52. doi: 10.1007/s00330-020-07483-4
6. Dolz J, Gopinath K, Yuan J, Lombaert H, Desrosiers C, Ben Ayed I. HyperDense-net: A hyper-densely connected CNN for multi-modal image segmentation. IEEE Trans Med Imaging (2019) 38(5):1116–26. doi: 10.1109/TMI.2018.2878669
7. Mishra D, Chaudhury S, Sarkar M, Soin AS. Ultrasound image segmentation: A deeply supervised network with attention to boundaries. IEEE Trans BioMed Eng (2019) 66:1637–48. doi: 10.1109/TBME.2018.2877577
8. Ronneberger O, Fischer P, Brox T. Medical image computing and computer-assisted intervention – MICCAI 2015. Navab N, Hornegger J, Wells WM, Frangi AF, editors. Springer International Publishing p. 234–41.
9. Wang J, Lu J, Qin G, Shen L, Sun Y, Ying H, et al. Technical note: A deep learning-based autosegmentation of rectal tumors in MR images. Med Phys (2018) 45(6):2560–4. doi: 10.1002/mp.12918
10. Chen L-C, Papandreou G, Schroff F, Adam H. Rethinking atrous convolution for semantic image segmentation. In: arXiv:1706.05587 (2017). Available at: https://ui.adsabs.harvard.edu/abs/2017arXiv170605587C.
11. Oktay O, Schlemper J, Le Folgoc L, Lee M, Heinrich M, Misawa K, et al. Attention U-net: Learning where to look for the pancreas. In: arXiv:1804.03999 (2018). Available at: https://ui.adsabs.harvard.edu/abs/2018arXiv180403999O.
12. Zhao H, Shi J, Qi X, Wang X, Jia J. Proceedings of the IEEE conference on computer vision and pattern recognition In 2017 IEEE Conference onComputer Vision and Pattern Recognition (CVPR). pp. 2881–90.
13. Chen L-C, Yang Y, Wang J, Xu W, Yuille AL. Proceedings of the IEEE conference on computer vision and pattern recognition In 2017 IEEE Conference onComputer Vision and Pattern Recognition (CVPR). pp. 3640–9.
14. Kieselmann JP, Kamerling CP, Burgos N, Menten MJ, Fuller CD, Nill S, et al. Geometric and dosimetric evaluations of atlas-based segmentation methods of MR images in the head and neck region. Phys Med Biol (2018) 63(14):145007. doi: 10.1088/1361-6560/aacb65
15. Tong N, Gou S, Yang S, Cao M, Sheng K. Shape constrained fully convolutional DenseNet with adversarial training for multiorgan segmentation on head and neck CT and low-field MR images. Med Phys (2019) 46:2669–82. doi: 10.1002/mp.13553
Keywords: parotid, auto-segmentation, artificial intelligence (AI), neoplasms, diagnosis
Citation: Xia X, Wang J, Liang S, Ye F, Tian M-M, Hu W and Xu L (2022) An attention base U-net for parotid tumor autosegmentation. Front. Oncol. 12:1028382. doi: 10.3389/fonc.2022.1028382
Received: 25 August 2022; Accepted: 26 October 2022;
Published: 24 November 2022.
Edited by:
Michele Avanzo, Aviano Oncology Reference Center (IRCCS), ItalyReviewed by:
Kuo Men, Chinese Academy of Medical Sciences and Peking Union Medical College, ChinaDavid G. Ellis, University of Nebraska Medical Center, United States
Copyright © 2022 Xia, Wang, Liang, Ye, Tian, Hu and Xu. This is an open-access article distributed under the terms of the Creative Commons Attribution License (CC BY). The use, distribution or reproduction in other forums is permitted, provided the original author(s) and the copyright owner(s) are credited and that the original publication in this journal is cited, in accordance with accepted academic practice. No use, distribution or reproduction is permitted which does not comply with these terms.
*Correspondence: Weigang Hu, amFja2h1d2dAZ21haWwuY29t; Leiming Xu, bWR4dUB6anUuZWR1LmNu