Abstract
Purpose:
The aim was to investigate the association between microvascular invasion (MVI) and the peritumoral imaging features of gadolinium ethoxybenzyl DTPA-enhanced magnetic resonance imaging (Gd-EOB-DTPA-enhanced MRI) in hepatocellular carcinoma (HCC).
Methods:
Up until Feb 24, 2022, the PubMed, Embase, and Cochrane Library databases were carefully searched for relevant material. The software packages utilized for this meta-analysis were Review Manager 5.4.1, Meta-DiSc 1.4, and Stata16.0. Summary results are presented as sensitivity (SEN), specificity (SPE), diagnostic odds ratios (DORs), area under the receiver operating characteristic curve (AUC), and 95% confidence interval (CI). The sources of heterogeneity were investigated using subgroup analysis.
Results:
An aggregate of nineteen articles were remembered for this meta-analysis: peritumoral enhancement on the arterial phase (AP) was described in 13 of these studies and peritumoral hypointensity on the hepatobiliary phase (HBP) in all 19 studies. The SEN, SPE, DOR, and AUC of the 13 investigations on peritumoral enhancement on AP were 0.59 (95% CI, 0.41−0.58), 0.80 (95% CI, 0.75−0.85), 4 (95% CI, 3−6), and 0.73 (95% CI, 0.69−0.77), respectively. The SEN, SPE, DOR, and AUC of 19 studies on peritumoral hypointensity on HBP were 0.55 (95% CI, 0.45−0.64), 0.87 (95% CI, 0.81−0.91), 8 (95% CI, 5−12), and 0.80 (95% CI, 0.76−0.83), respectively. The subgroup analysis of two imaging features identified ten and seven potential factors for heterogeneity, respectively.
Conclusion:
The results of peritumoral enhancement on the AP and peritumoral hypointensity on HBP showed high SPE but low SEN. This indicates that the peritumoral imaging features on Gd-EOB-DTPA-enhanced MRI can be used as a noninvasive, excluded diagnosis for predicting hepatic MVI in HCC preoperatively. Moreover, the results of this analysis should be updated when additional data become available. Additionally, in the future, how to improve its SEN will be a new research direction.
1 Introduction
Hepatocellular carcinoma (HCC) is considered the global third highest cause of cancer mortality, ranking second among men (1). However, recurrence is common after surgical treatment. In addition, 5-year recurrence rates reach 70% after surgical resection and 35% after liver transplantation (2). In addition, microvascular invasion (MVI) has been identified as a possible predictor of early recurrence of HCC (3). MVI is considered to be the invasion of tumor cells into the vascular endothelium, which can only be seen under a microscope but not macroscopically. The presence of MVI suggests the aggressive behavior and poor survival outcome of HCC (4). A preoperative risk assessment of HCC patients by surgeons is of great importance. If radical hepatectomy is undertaken in patients at high risk for MVI, larger margins may be preferred; if liver transplantation is performed, the survival outcome of the patient is severely compromised (5). Histopathological examination is the gold standard for diagnosing MVI. However, histopathological examination is an invasive procedure that necessitates extensive sampling. Therefore, a preoperative, noninvasive test for detecting MVI would be extremely helpful in choosing the best treatment options for HCC patients (6). Both clinicians and patients benefit from preoperative noninvasive prediction of MVI.
Gadolinium ethoxybenzyl DTPA-enhanced (Gd-EOB-DTPA-enhanced) MRI uses a liver-specific, intracellular MRI contrast agent called Primovist or Eovist, which is distributed differently in various phases during the course of an MRI. In the arterial phase (AP), Primovist is distributed in vascular and extracellular regions. Gradually, it is distributed in bile ducts and hepatocytes in the hepatobiliary phase (HBP) (7). Gd-EOB-DTPA provides insight into hemodynamic changes in the liver and liver tumors. Gd-EOB-DTPA-enhanced MRI is not only helpful in the diagnosis of HCC but has also been widely applied to the preoperative evaluation and prognostic evaluation of HCC (8, 9). In addition, gadobenate dimeglumine (Gd-BOPTA) is a liver-specific contrast agent. The T1 relaxivity at 1.5T for Primovist and Gd-BOPTA is 6.5−7.3 and 6−6.6, respectively (10). Moreover, the protein-binding capabilities of Gd-BOPTA are weaker than that of Gd-EOB-DTPA, and its uptake by hepatocytes is about one-tenth of the amount of Gd-EOB-DTPA, which might be related to the difference in the lipophilicity of the benzene ring in Gd-BOPTA and the EOB group in Gd-EOB-DTPA (10–12).
Recently, some studies have focused on the imaging findings of HCC tumors themselves to predict the relationship of MVI (13–15). However, based on the altered hemodynamics, peritumoral tissue is the first tissue that is affected by MVI. It is worthy to explore whether peritumoral tissue can directly reflect the relationship between tumor and MVI. Moreover, a high-quality meta-analysis showed that peritumoral enhancement on AP and peritumoral hypointensity on HBP were associated with MVI but with poor diagnostic accuracy (16). However, the number of included literatures in the publication was small, with only four articles about peritumoral hypointensity on HBP, and 2 studies used CT to assess peritumoral enhancement (16). Moreover, the research did not use Primovist as a contrast agent. However, Ahn SJ et al. and Ahn, S Y. et al. found that peritumoral enhancement on AP and peritumoral hypointensity on HBP did not show a statistically significant association with MVI (P > 0.05) (17, 18). In addition, the reported SEN and SPE of peritumoral hypointensity on HBP varied widely—0.38−0.81 and 0.56−0.97, respectively (8, 9, 17–33). Yet, as the peritumoral microenvironment has received more attention in recent years, papers on the link between peritumoral imaging and MVI have been updated. Therefore, it is critical to determine the actual accuracy of the two imaging features for predicting the presence of MVI in HCC. As a result, the value of assessing the association between peritumoral imaging features and MVI by taking advantage of Gd-EOB-DTPA-enhanced MRI remains to be investigated.
On the whole, the predictive value of peritumoral enhancement on AP and peritumoral hypointensity on HBP on Gd-EOB-DTPA-enhanced MRI for MVI in HCC patients remains controversial. Furthermore, there has been no systematic evaluation of the diagnostic significance of these imaging findings of preoperative Gd-EOB-DTPA-enhanced MRI for MVI. Hence, this research was performed to determine the diagnostic performance of these features for MVI in HCC patients.
2 Methods
2.1 Literature Search Strategy
This study was conducted in accordance with the Preferred Reporting Items for Systematic Reviews and Meta-Analyses guidelines (34). Up until Feb 24, 2022, the PubMed, Embase, and Cochrane Library databases were carefully searched for relevant material by two researchers. Medical subject headings, free words, and their variations were employed for retrieval. Literature retrieval has no language restrictions. The full search strategy is described in the Supplementary material.
2.2 Inclusion and Exclusion Criteria
The criteria for selecting the subjects were as follows: 1) studies on preoperative MVI prediction with peritumoral tissue on disodium gadoxetate–enhanced MRI; 2) studies without treatment before curative hepatectomy; 3) histopathologically proven primary HCC; and 4) studies providing sufficient data to create a diagnostic 2 × 2 table. Further, the following circumstances would be excluded: 1) studieses that did not satisfy any of the aforementioned inclusion criteria; 2) reviews, letters, and reports; 3) studies for involving macrovascular invasion; and 4) studies for which we were unable to get the full text.
2.3 Quality Assessment and Data Extraction
This paper assessed the methodological quality of each study, applying the Quality Assessment of Diagnostic Accuracy Studies (QUADAS-2) tool (35). In addition, a comprehensive evaluation of the bias risk for each research was conducted, including patient selection, index test, reference standard, flow and timing, and applicability concerns. Meanwhile, two researchers independently extracted the data and cross-checked them to arrive at an agreement. In addition, the extracted data from each included study consisted of the first author, year of publication, region, lesion size, sample size of tumors and patients, single tumors or multiple, interval between imaging and surgery, magnetic field strengths, preoperative anti-tumor therapy, microvascular invasion, macrovascular invasion, and blindness to reference and index test. Moreover, the third researcher collated the extracted data as true positives, false positives, false negatives, and true negatives to form a 2 × 2 diagnostic table.
2.4 Definition of Peritumoral Enhancement and Peritumoral Hypointensity
Each study reached a consensus on the definition of peritumoral enhancement on AP and peritumoral hypointensity on HBP. Peritumoral enhancement on AP is defined as a polygonal-shaped or crescent-shaped enhancement outside the cancer edge during the AP, which becomes isointense to background hepatic parenchyma in the delayed phase (21). The definition of peritumoral hypointensity on HBP is considered as a flame-like or wedge-shaped hypointense region of hepatic parenchyma outside the edge of tumor during the HBP (23).
2.5 Statistical Analysis
Review Manager 5.4.1, Meta-DiSc 1.4, and Stata16.0 were used for data analysis and statistics. The evaluation indexes of diagnostic efficiency include SEN, SPE, positive likelihood ratio (PLR), negative likelihood ratio (NLR), diagnostic odds ratio (DOR), and 95% confidence interval (CI). Further, the diagnostic precision of peritumoral imaging features on Gd-EOB-DTPA-enhanced MRI for the prediction of MVI was analyzed using the area under the receiver operating characteristic curve (AUC). The Spearman correlation coefficient in Meta-DiSc1.4 was adopted to evaluate heterogeneity caused by the threshold effect. There was a significant threshold effect, as evidenced by a strong positive association (P < 0.05) (36). The heterogeneity of studies was determined by applying Cochran’s Q test and I2 analysis and regarded as P < 0.1 or I2 > 50% (37). In the case of notable heterogeneity, the random-effects coefficient binary regression model was utilized; otherwise, the fixed-effects coefficient binary regression model was employed (38). In addition, the causes of heterogeneity were investigated by subgroup analysis; the stability of this meta-analysis was estimated by sensitivity analysis, and the publication bias was detected by Deeks’ funnel plot asymmetry tests. If the slope coefficient was greater than zero, publication bias was suspected (P < 0.05) (39).
3 Results
3.1 Literature Search and Study Selection
Following the research approach, 168 publications were obtained via PubMed, Embase, and Cochrane Library databases. Forty-five articles were removed as duplicates (Figure 1). Moreover, 91 articles were eliminated after a review of titles and abstracts on the basis of the following reasons: publications were not related to the prediction of MVI or were reviews or report or letters, leaving 32 studies for further screening. After checking for the full text, a review was excluded, and 3 investigations were eliminated due to the unavailability of the full text, 3 for not having valid data, 5 for not using gadoxetic acid as a contrast medium, and one for involving macrovascular invasion. Finally, a total of nineteen articles were involved in this paper and their characteristics are listed in Table 1.
Figure 1
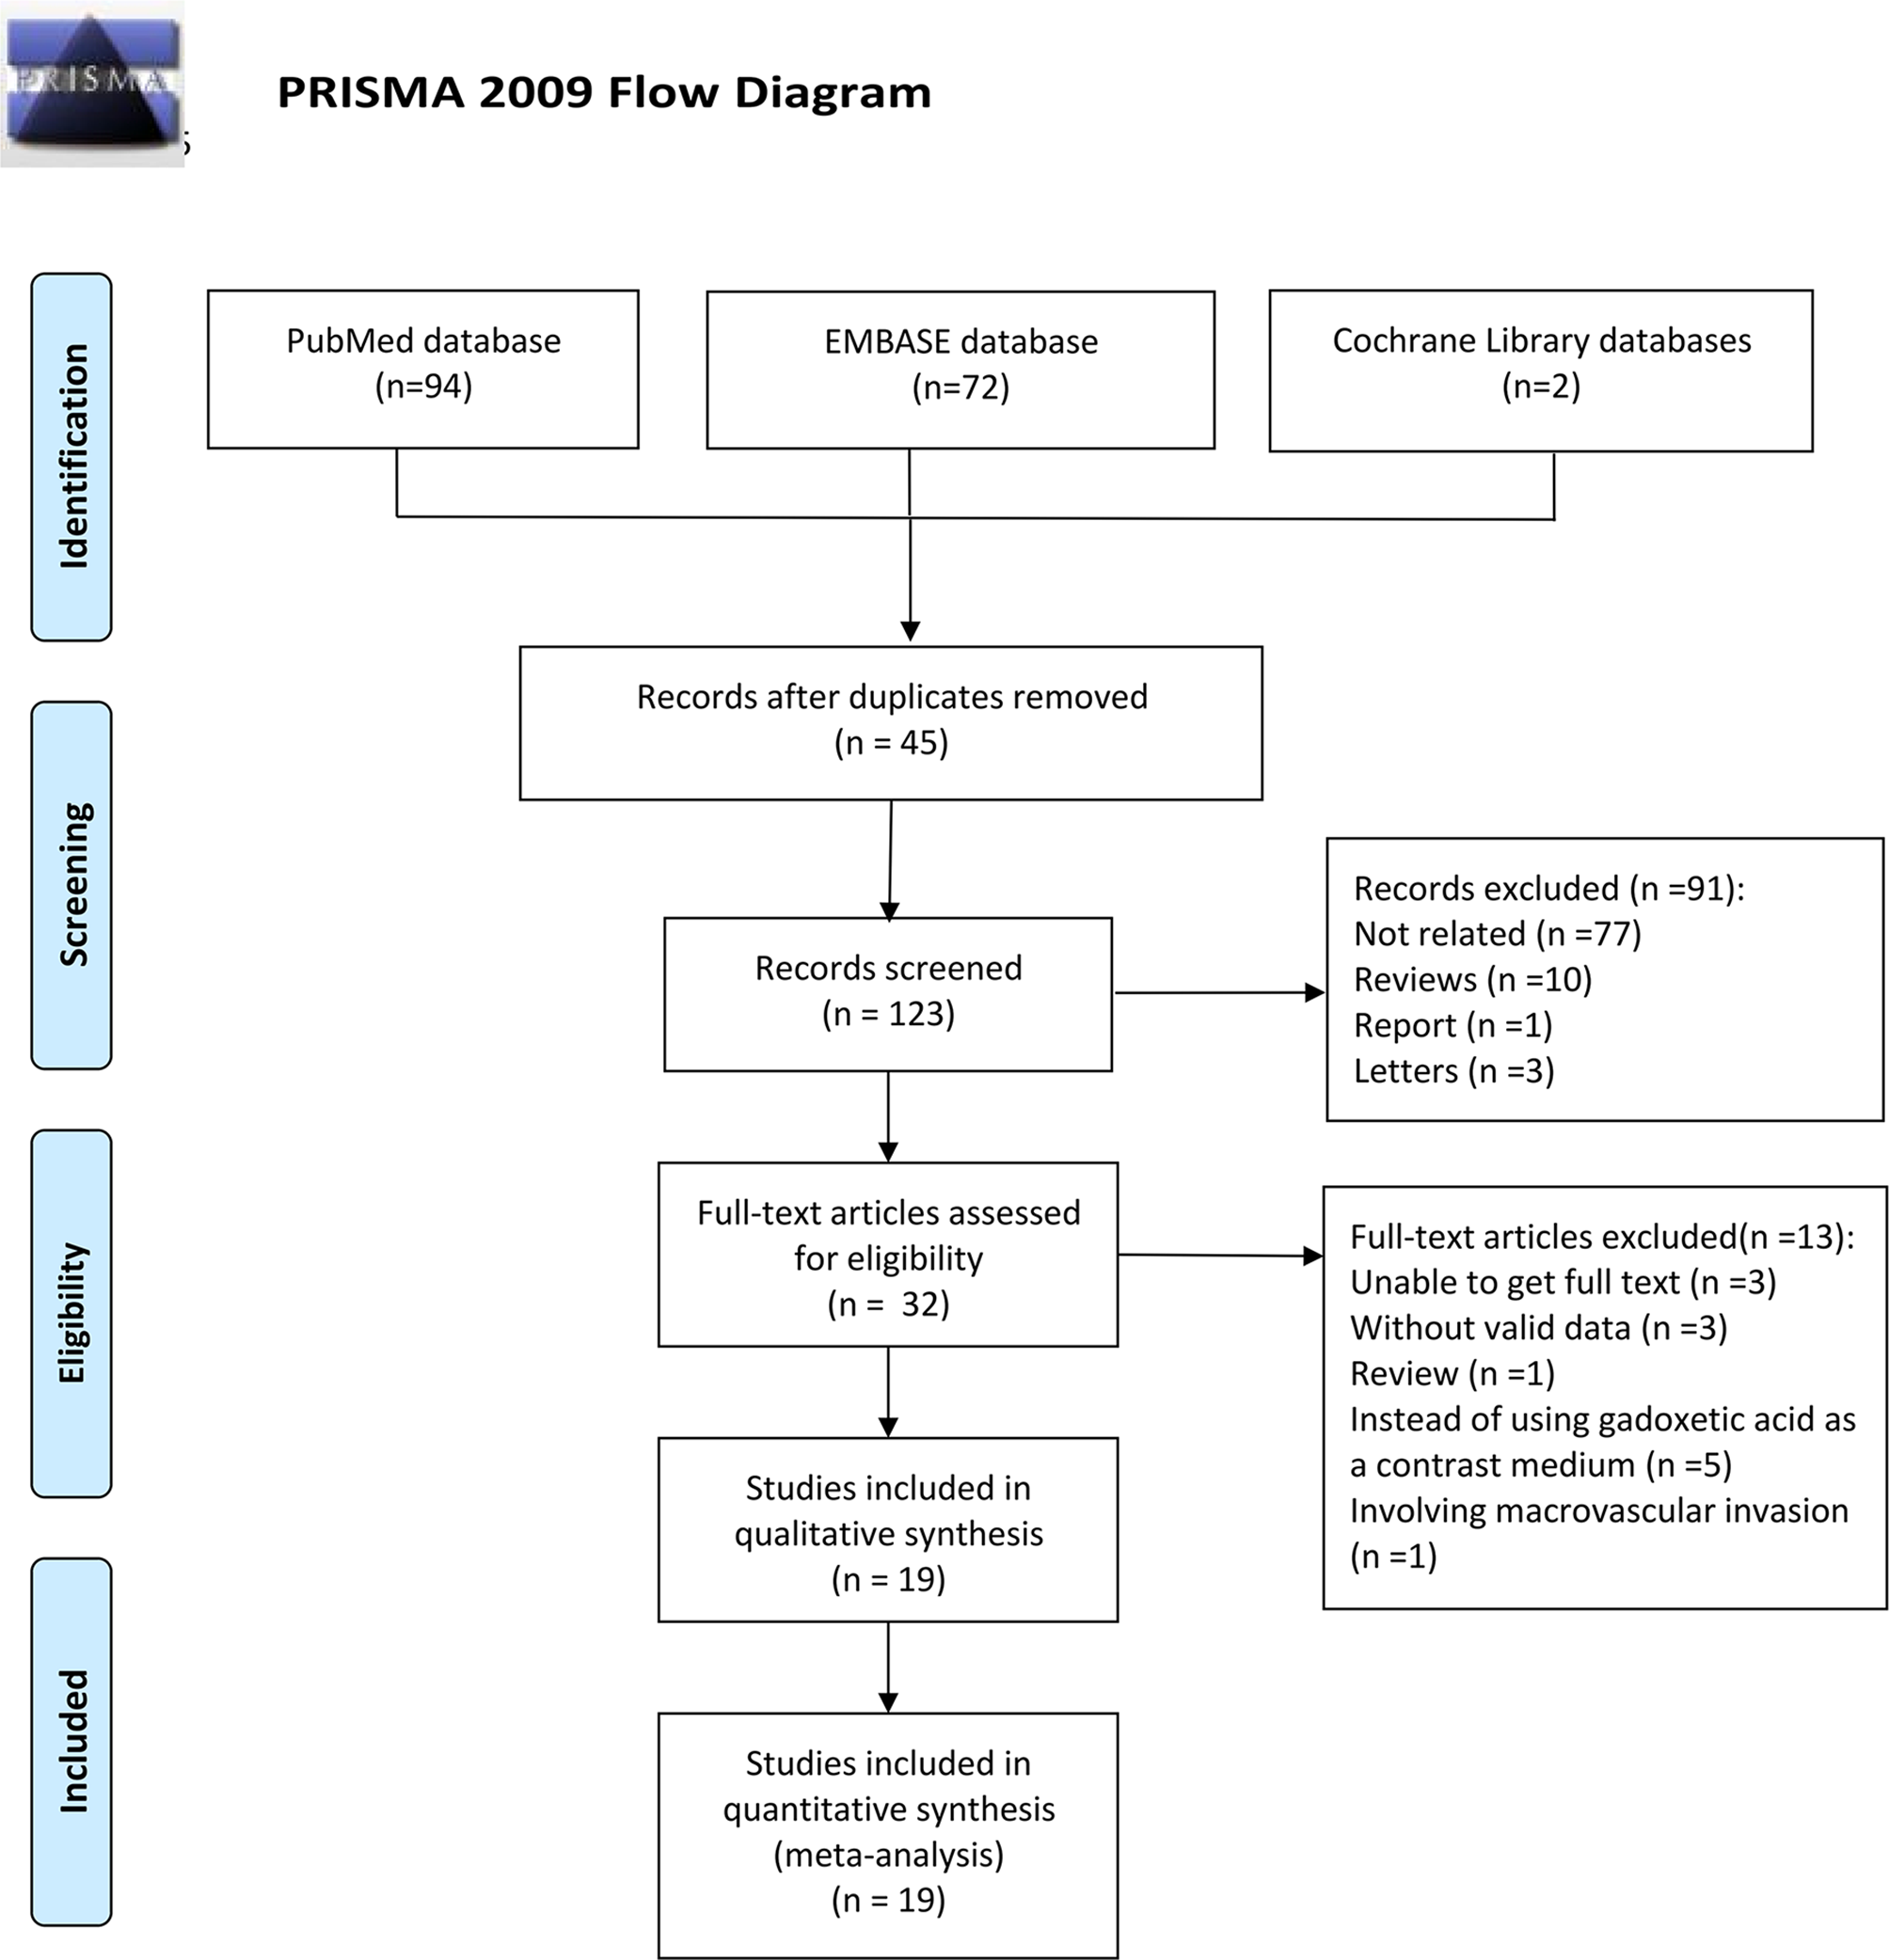
Flow diagram illustrating the search strategy.
Table 1
| Study | Year | Region | Mean age (years) | Patients/Lesions (n) | Lesions | Lesions size | IBIS (days) | PEAP (n) | PHHBP (n) | MVI (n) | |||
|---|---|---|---|---|---|---|---|---|---|---|---|---|---|
| + | − | + | − | + | − | ||||||||
| Ahn SJ. et al (17) |
2019 | South Korea | 56.71 | 179 (179) | S | NR | ≤30 | 64 | 115 | 61 | 118 | 68 | 111 |
| Ahn SY. et al (18) |
2015 | South Korea | 51.94 | 51 (78) | S/M | NR | ≤63 | 10 | 68 | 4 | 74 | 18 | 60 |
| Chen PP. et al (20) |
2019 | China | 58 | 70 (77) | S/M | NR | ≤14 | 15 | 62 | 20 | 57 | 27 | 50 |
| Chen Y. et al (21) |
2021 | China | 51.5 | 269 (269) | U | NR | ≤14 | 73 | 196 | 105 | 164 | 111 | 158 |
| Chong HH. et al (22) |
2020 | China | 54.22 | 356 (356) | S | ≤5 cm | ≤30 | 74 | 282 | 54 | 302 | 90 | 266 |
| Chou YC. et al (23) |
2019 | China | 64.76 | 114 (114) | S | NR | U | 27 | 87 | 34 | 80 | 39 | 75 |
| Dong SY. et al (24) |
2022 | China | 54.66 | 214 (214) | S | ≤3 cm | ≤30 | 79 | 135 | 75 | 139 | 49 | 165 |
| Feng ST. et al (9) |
2019 | China | 54.8 | 160 (160) | S/M | NR | ≤30 | 44 | 116 | 48 | 112 | 62 | 98 |
| Huang M. et al (8) |
2018 | China | 52.2 | 60 (66) | S/M | NR | ≤30 | 21 | 45 | 26 | 40 | 17 | 49 |
| Kim KA. et al (19) |
2012 | South Korea | 55 | 104 (104) | S/M | NR | ≤30 | NM | NM | 26 | 78 | 60 | 44 |
| Lee S. et al (25) |
2020 | South Korea | 54 | 122 (122) | S/M | NR | ≤30 | NM | NM | 21 | 101 | 21 | 101 |
| Lu XY. et al (26) |
2020 | China | 57.5 | 102 (102) | U | NR | ≤30 | NM | NM | 26 | 76 | 31 | 71 |
| Nishie A. et al (27) |
2014 | Japan | 67 | 61 (61) | S/M | NR | ≤30 | NM | NM | 25 | 36 | 25 | 36 |
| Shin SK. et al (28) |
2017 | South Korea | 57 | 126 (126) | S | ≤5 cm | U | NM | NM | 15 | 111 | 29 | 97 |
| Wang LL. et al (29) |
2021 | China | 54.22 | 113 (113) | S/M | NR | ≤14 | NM | NM | 67 | 46 | 50 | 63 |
| Yang L. et al (30) |
2019 | China | 55.5 | 208 (208) | S/M | NR | ≤30 | 67 | 141 | 30 | 178 | 53 | 155 |
| Yang Y. et al (31) |
2021 | China | 52.4 | 201 (201) | S | NR | ≤30 | 111 | 90 | 82 | 119 | 111 | 90 |
| Zhang K. et al (32) |
2022 | China | 56.4 | 129 (129) | S | NR | ≤30 | 49 | 80 | 43 | 86 | 36 | 93 |
| Zhou M. et al (33) |
2021 | China | 55 | 60 (62) | S/M | ≤3 cm | ≤30 | 14 | 48 | 12 | 50 | 19 | 43 |
Characteristics of the 19 included studies.
IBIS, interval between imaging and surgery; PEAP, peritumoral enhancement on arterial phase; PHHBP, peritumoral hypointensity on hepatobiliary phase; MVI, microvascular invasion; +, positive; -, negative; S, single; M, multiple; U, unclear; NR, no restriction; NM, not mentioned.
3.2 Study Characteristics and Quality Assessment
A total of nineteen articles were included, and all studies examined peritumoral hypointensity on HBP, and 13 studies examined peritumoral enhancement on AP. Furthermore, all articles were retrospective studies. The studies were published between 2011 and 2022. Among these studies, 13 were from China, 5 from South Korea, and 1 from Japan. All 19 studies included 2,699 HCC patients with 2,741 tumors, of which 916 tumors were pathologically diagnosed as MVI-positive and 1,825 tumors as MVI-negative.
Figure 2 depicts the quality of the included investigations as assessed by QUADAS-2 guidelines. As it was not clear whether patients received other treatments before the operation in 2 studies (19, 28), the risk bias arising from patient selection in those studies was determined to be “unclear.” Due to the fact that the seven studies did not mention whether there was macrovascular invasion, we also marked it as an unclear risk of patient selection bias (8, 17–19, 24, 27, 28). Moreover, because the lesion size was limited in 4 studies (22, 24, 28, 33), the patient selection bias was considered as “high.” Six studies did not mention whether the radiologists were blinded to the pathology data (9, 21, 23, 24, 27, 29) and were therefore marked as unclear risk of index bias domain. The interval between imaging and surgery was unclear in 2 studies (23, 28); hence, the risk bias arising from flow and timing was determined to be “unclear.” All tumors were subjected to MRI examination and a histopathological test. Although most articles did not explicitly mention that “pathologists were blinded to the imaging data,” they did elaborate on the pathological findings. Accordingly, the risk bias arising from the reference standard was determined to be “unclear,” but in this research, we considered the applicability concerns of reference standard as “low concern.”
Figure 2
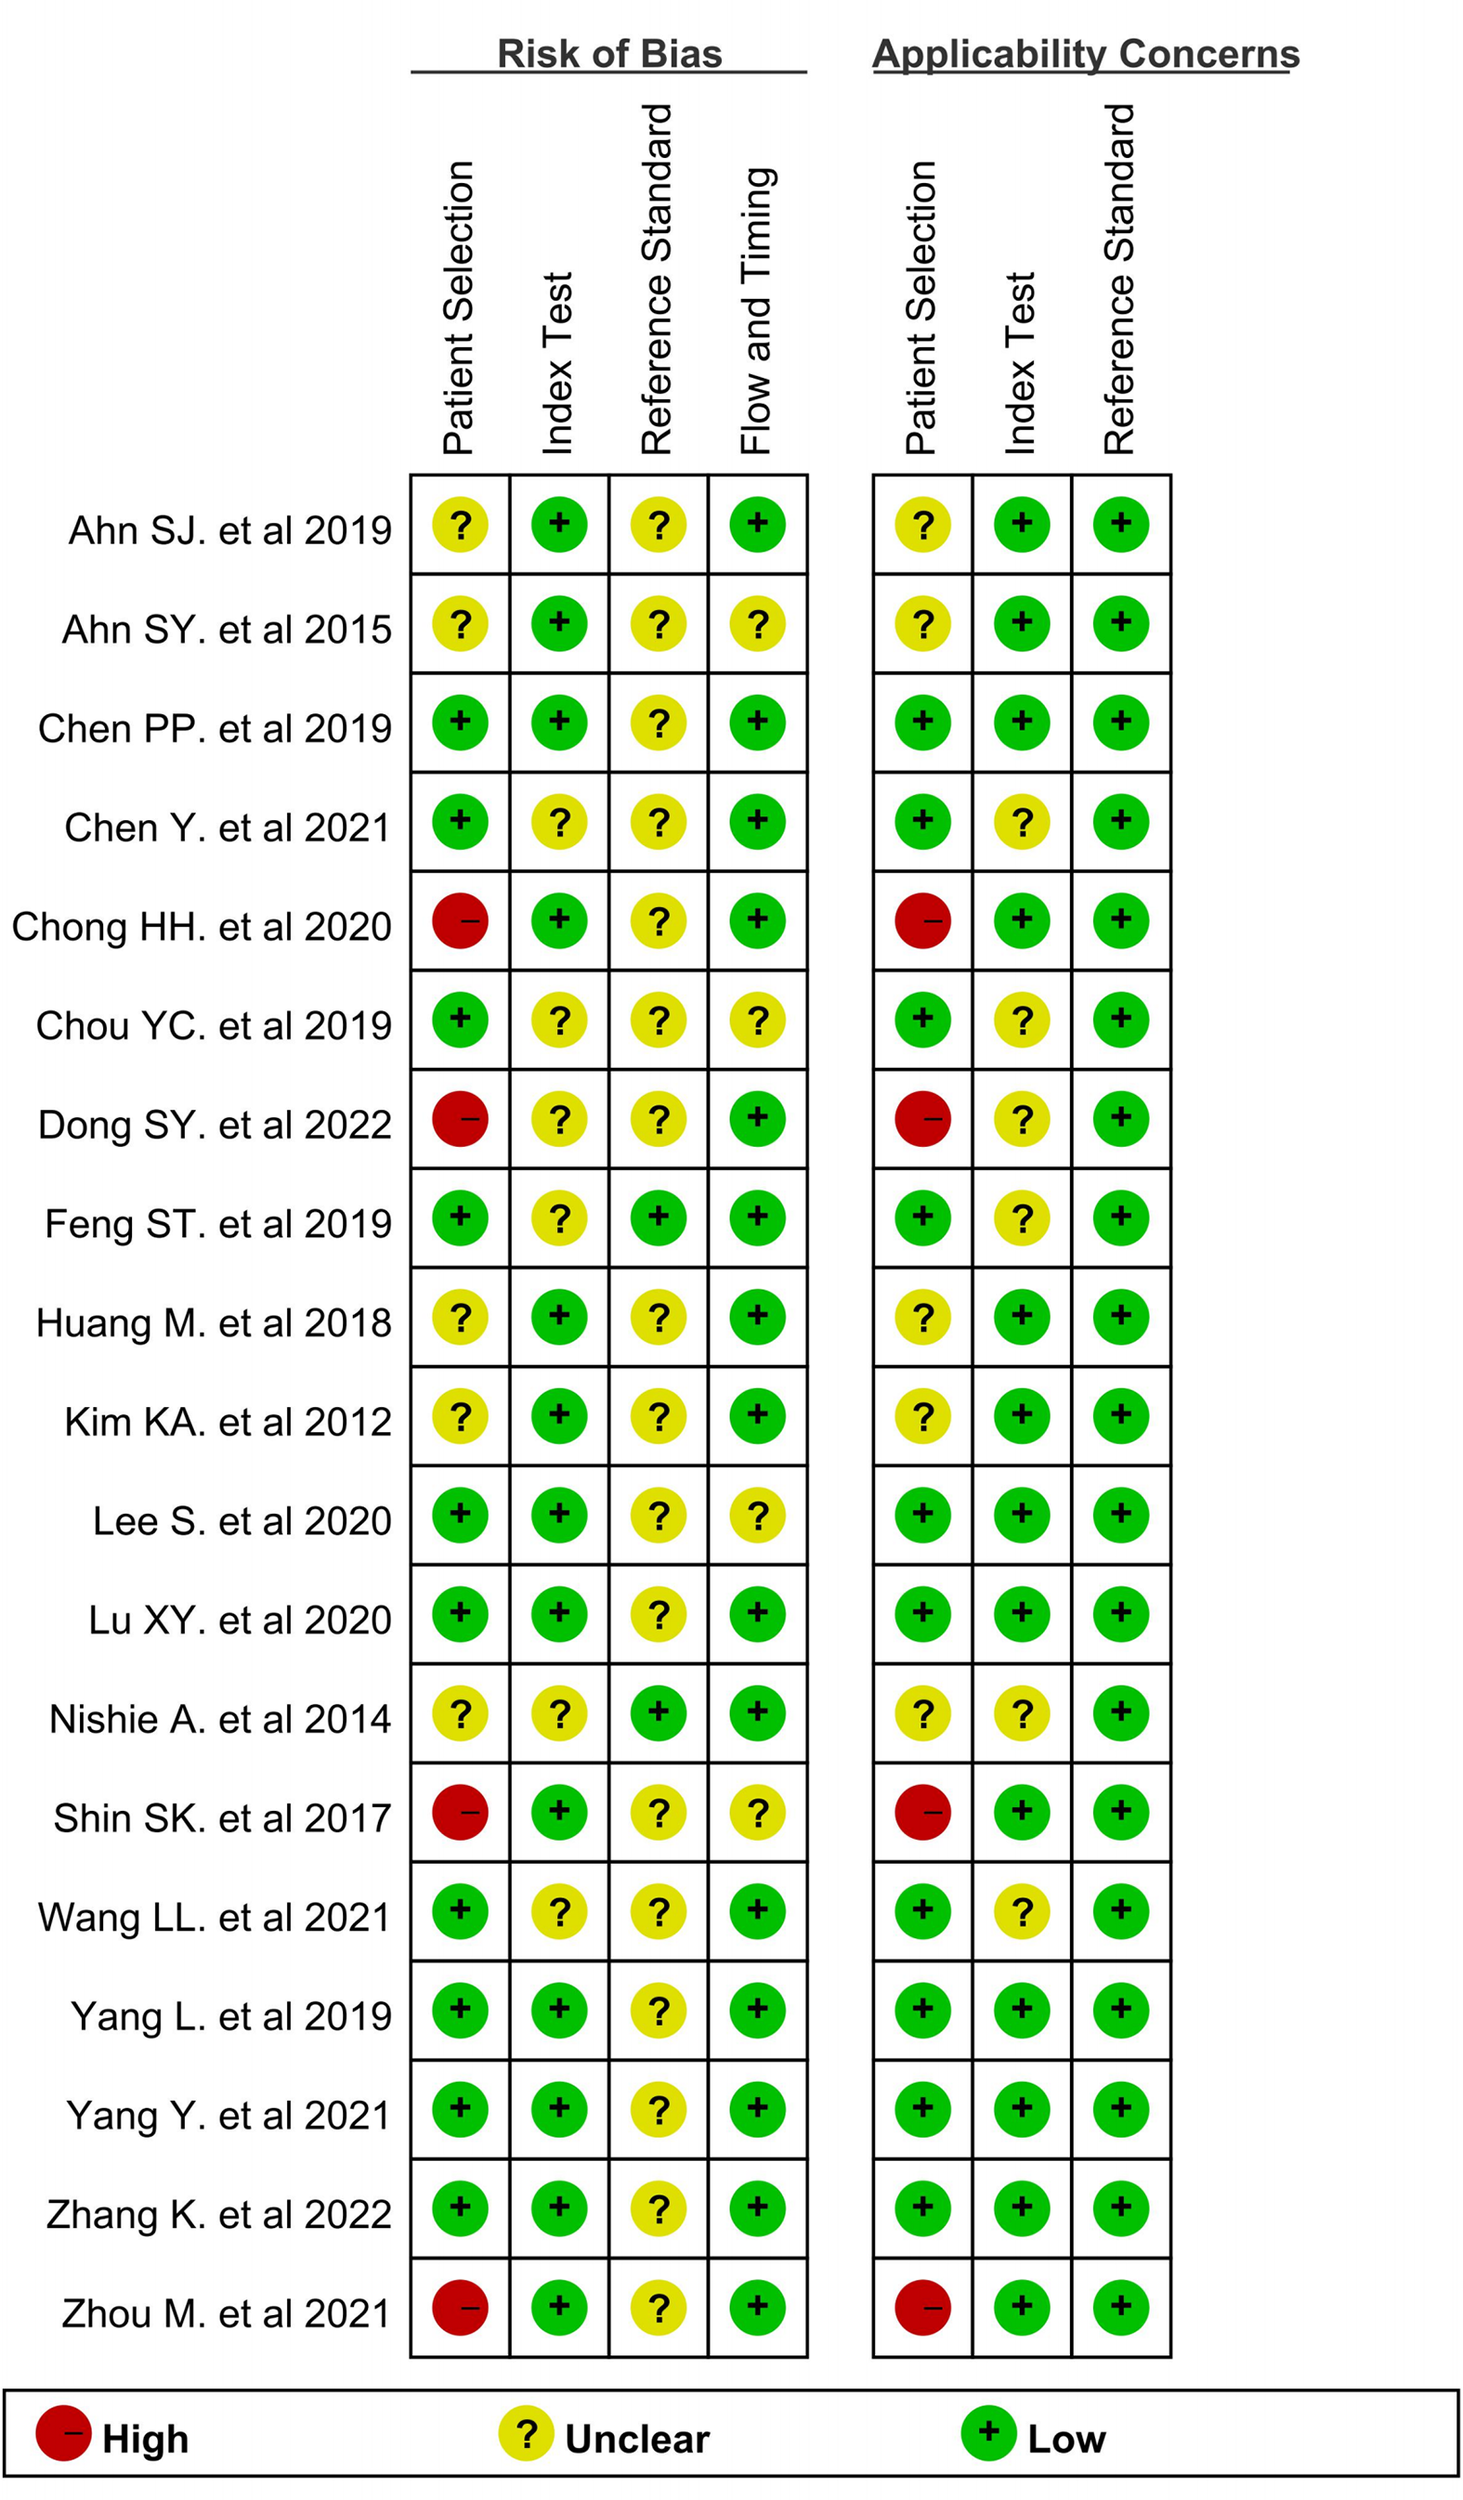
Methodological quality summary of all included studies by using Quality Assessment of Diagnostic Accuracy Studies.
3.3 Imaging Methods
The characteristics of the imaging methods for the included studies are listed in Table 2. Ten studies reported MRI performed with a field strength of 3T, 4 studies used both 1.5T and 3T MRI systems, and 5 studies used 1.5T. In addition, ten articles used Siemens MR devices, while the rest used Philips/GE or two and three devices. Moreover, the scan acquisition time of the AP of 10 studies was performed at 20−35 s following the contrast injection. Three studies scanned AP seven seconds after the contrast media had arrived at the distal thoracic aorta and one when the contrast medium was visible at the level of the celiac trunk of the abdominal aorta. Additionally, the remaining five articles did not illustrate the scan acquisition time of AP. In all studies, the scan acquisition time for HBP was 20 min after the contrast injection. Moreover, the injection dose of Gd-EOB-DTPA was 0.025 mmol/kg body weight in 11 studies and 0.1 ml/kg in 5 studies, and one study injected the contrast in the dose of 0.2 ml/kg. One study used a bolus injection of 10 ml. In addition, one study did not specify the dose of contrast injection. The injection rate was 1 ml/s in 6 studies, 1.5 ml/s in 2 studies, and 1.0−1.5 ml/s in 2 studies. Aditionally, one article injected the contrast agent at a rate of 2 ml/s. The remaining studies did not mention the injection rate.
Table 2
| Study | MFS(T) | Scanners | Scan acquisition time | Doses of contrast agent | Injection flow rate | |
|---|---|---|---|---|---|---|
| AP | HBP | |||||
| Ahn SJ. et al (17) |
1.5/3 | GE/Siemens/Philips | Seven seconds after the contrast media had arrived at the distal thoracic aorta | 20 min* | 0.025 mmol/kg | 1.5 ml/s |
| Ahn SY. et al (18) |
1.5/3 | GE/Siemens | Seven seconds after the contrast media had arrived at the distal thoracic aorta | 20 min* | 0.025 mmol/kg | 1.5 ml/s |
| Chen PP. et al (20) |
3 | Philips | 20 s* | 20 min* | 0.1 ml/kg | 1.0−1.5 ml/s |
| Chen Y. et al (21) |
3 | Siemens | NM | 20 min* | 0.2 ml/kg | 1 ml/s |
| Chong HH. et al (22) |
1.5 | Siemens | 20−30 s* | 20 min* | 0.025 mmol/kg | NM |
| Chou YC. et al (23) |
1.5 | Siemens | When the contrast medium was visible at the level of the celiac trunk of the abdominal aorta. | 20 min* | Bolus injection of 10 ml | 1 ml/s |
| Dong SY. et al (24) |
1.5 | Siemens | 20−30 s* | 20 min* | 0.025 mmol/kg | NM |
| Feng ST. et al (9) |
3 | Siemens | 30–35 s* | 20 min* | 0.1 ml/kg | 1 ml/s |
| Huang M. et al (8) |
3 | Siemens | NM | 20 min* | NM | NM |
| Kim KA. et al (19) |
3 | Siemens | NM | 10–20 min* | 0.025 mmol/kg | 2.0 ml/s |
| Lee S. et al (25) |
1.5/3 | Siemens/Philips | 20–35 s* | 20 min* | 0.025 mmol/kg | 1 ml/s |
| Lu XY. et al (26) |
3 | Philips | 20 s* | 10 and 20 min* | 0.1 ml/kg | 1.0–1.5 ml/s |
| Nishie A. et al (27) |
1.5 | Philips | NM | 20 min* | 0.1 ml/kg (total amount: 4.5–8 ml) | NM |
| Shin SK. et al (28) |
3 | Siemens | Seven seconds after the contrast media had arrived at the distal thoracic aorta | 20 min* | 0.025 mmol/kg | NM |
| Wang LL. et al (29) |
3 | Siemens | 20−30 s* | 20 min* | 0.025 mmol/kg | 1 ml/s |
| Yang L. et al (30) |
1.5 | Siemens | 20–30 s* | 20 min* | 0.025 mmol/kg | NM |
| Yang Y. et al (31) |
1.5/3 | GE | 20–35 s* | 20 min* | 0.025 mmol/kg | NM |
| Zhang K. et al (32) |
3 | Philips | NM | 20 min* | 0.025 mmol/kg | NM |
| Zhou M. et al (33) |
3 | Philips | 25 s* | 20 min* | 0.1 ml/kg | 1 ml/s |
Characteristics of imaging methods.
*This acquisition time is defined as after contrast media injection. MFS, magnetic field strength; AP, arterial phase; HBP, hepatobiliary phase; NM, no specific time point was mentioned.
3.4 Accuracy of Peritumoral Imaging Features of HCC for Predicting MVI
3.4.1 Peritumoral Enhancement on AP
Thirteen studies assessed the relationship between peritumoral enhancement on AP with Gd-EOB-DTPA-enhanced MRI and MVI (8, 9, 17, 18, 20–24, 30–33), including 2,071 HCC patients with 2,113 tumors. Of 2,113 tumors, 700 were pathologically diagnosed as MVI-positive (356 tumors with peritumoral enhancement on AP and 344 tumors without) and 1,413 as MVI-negative (292 tumors with peritumoral enhancement on AP and 1,121 tumors without). The Spearman correlation coefficient was 0.531 (P = 0.062), which indicated that threshold effect–derived heterogeneity was not present. The results of Cochran’s Q test and I2 analysis (P < 0.001, I2 = 95%) indicated that there was substantial heterogeneity. The pooled SEN was 0.50 (95% CI, 0.41−0.58), and the pooled SPE was 0.80 (95% CI, 0.75−0.85) (Figure 3). Moreover, the values of pooled PLR, NLR, and DOR were 2.5 (95% CI, 2.0−3.2), 0.63 (95% CI, 0.54−0.73), and 4 (95% CI, 3−6), respectively. In addition, the SROC curve was plotted (Figure 4), resulting in an AUC of 0.73 (95% CI, 0.69−0.77).
Figure 3
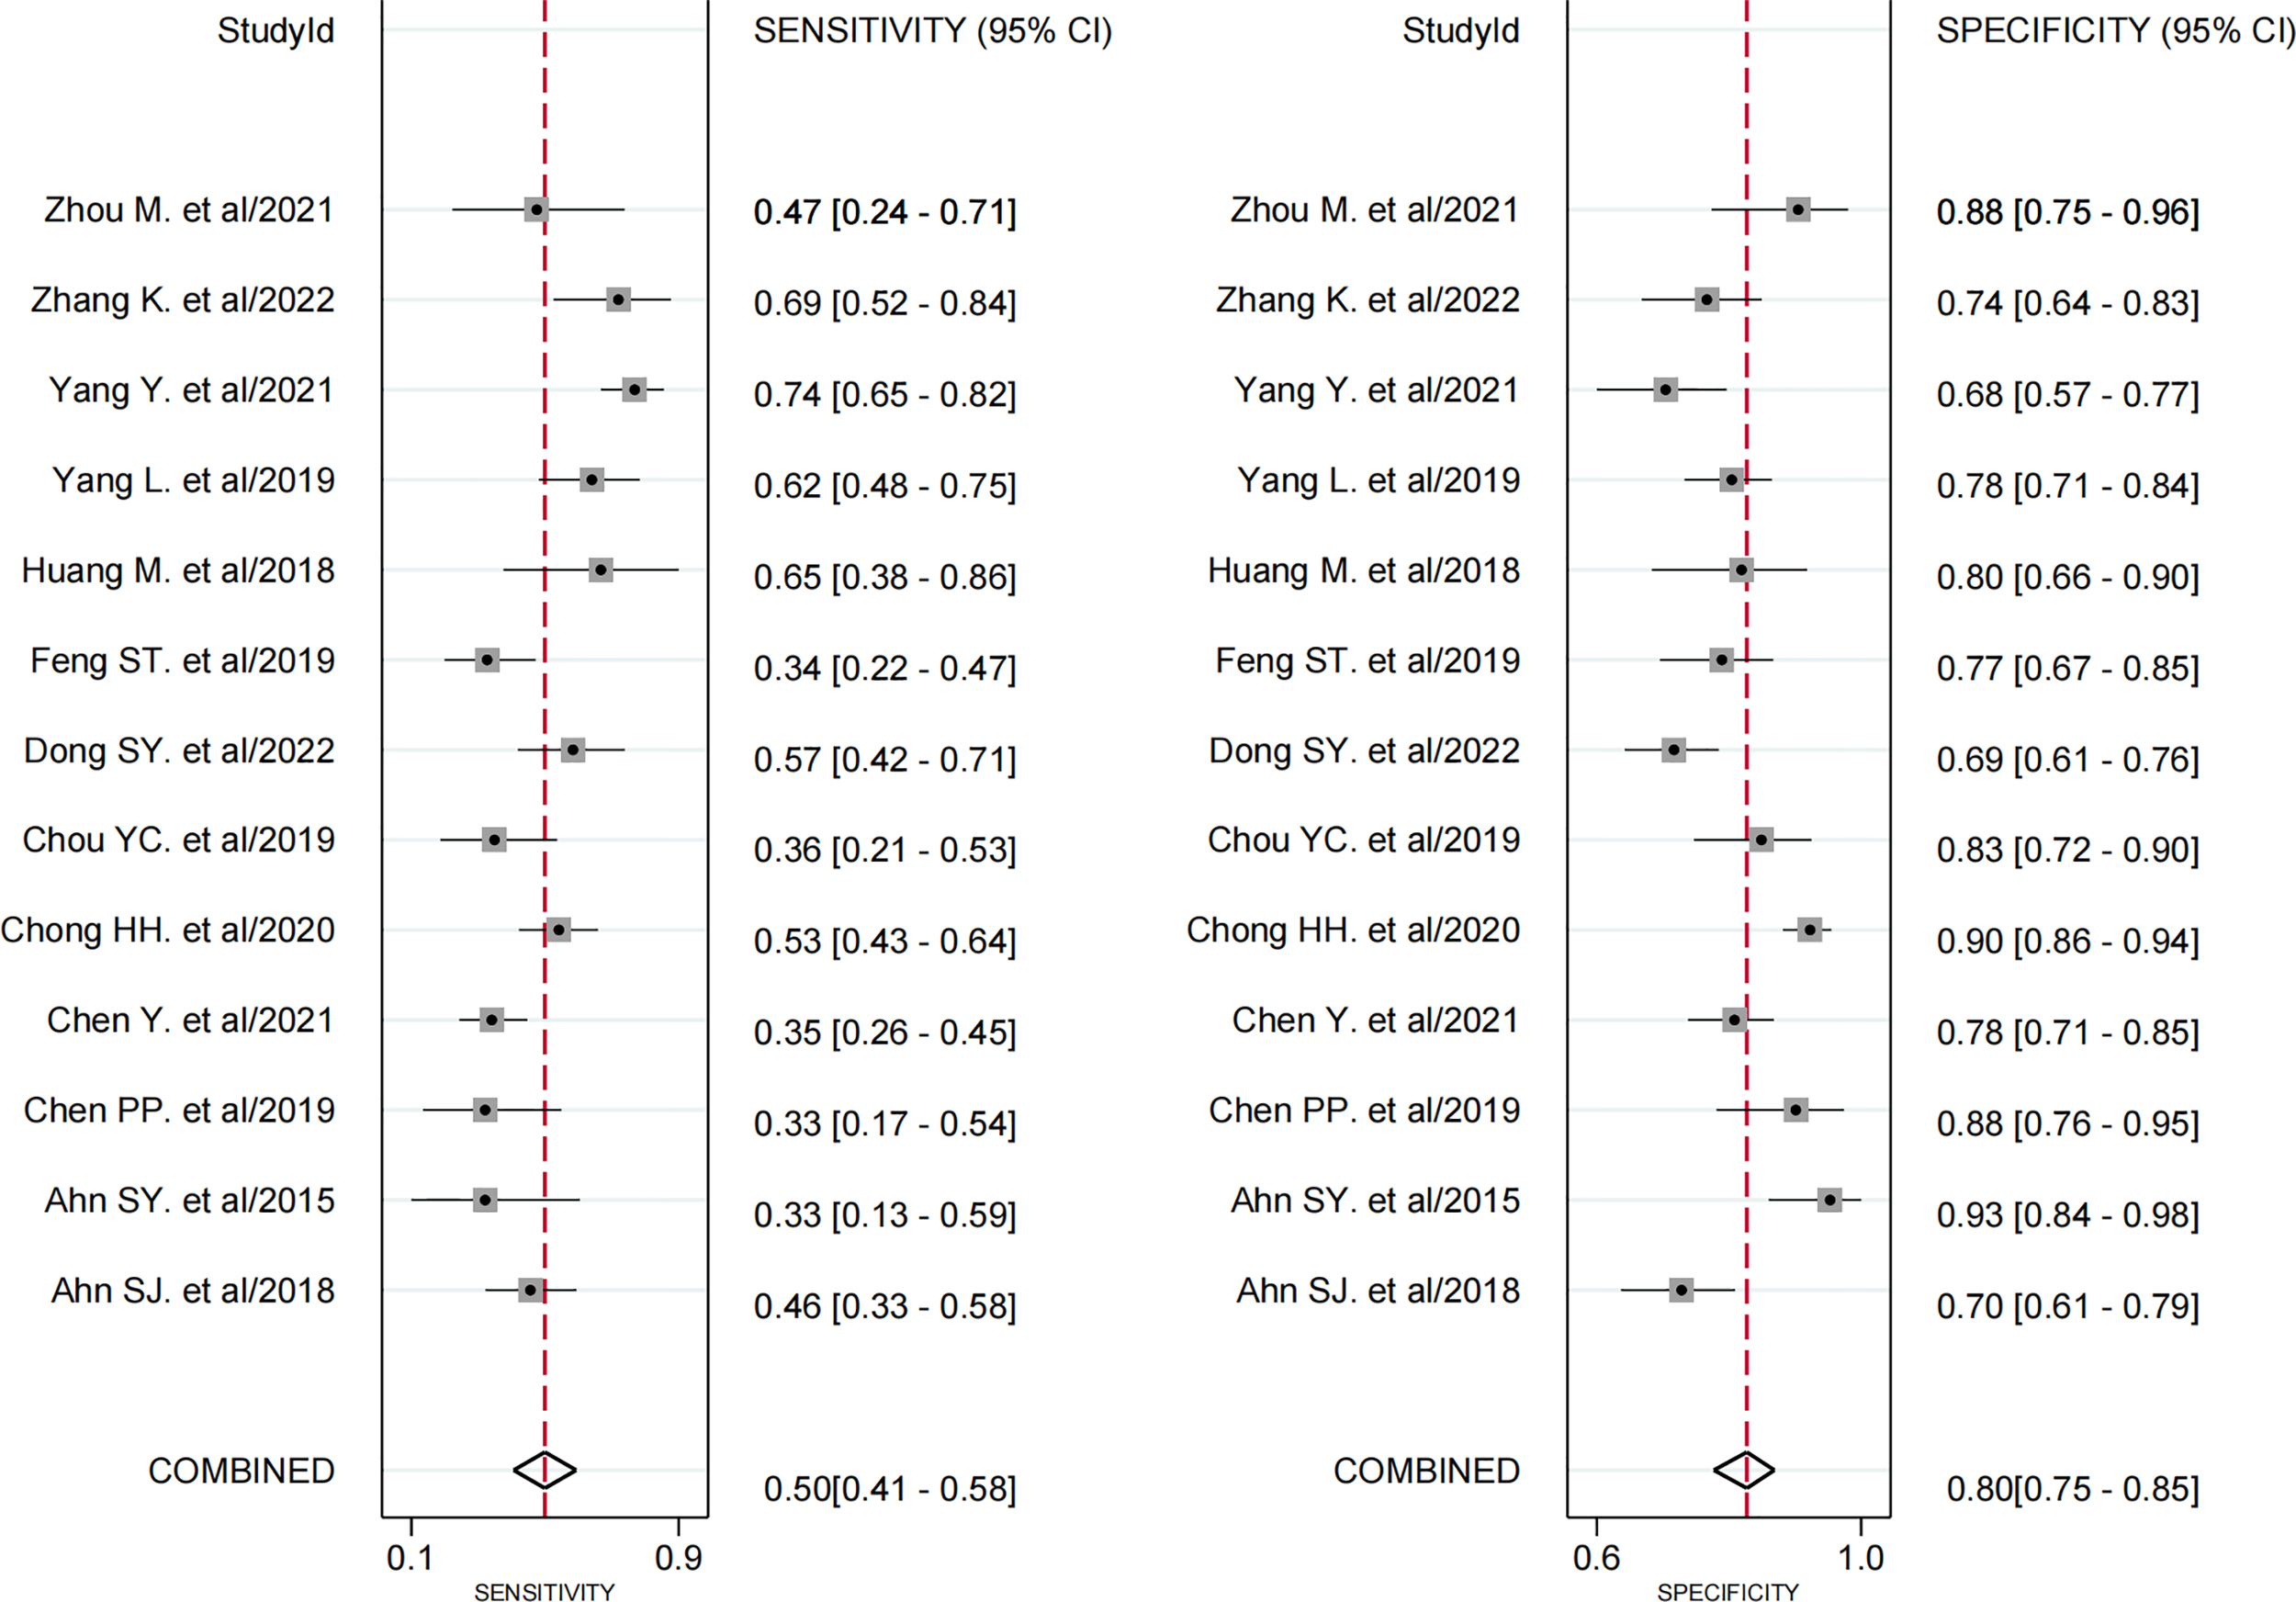
Forest plots demonstrate the pooled sensitivity and specificity of peritumoral enhancement on the arterial phase. The 95% CI are shown around point estimates and the pooled result.
Figure 4
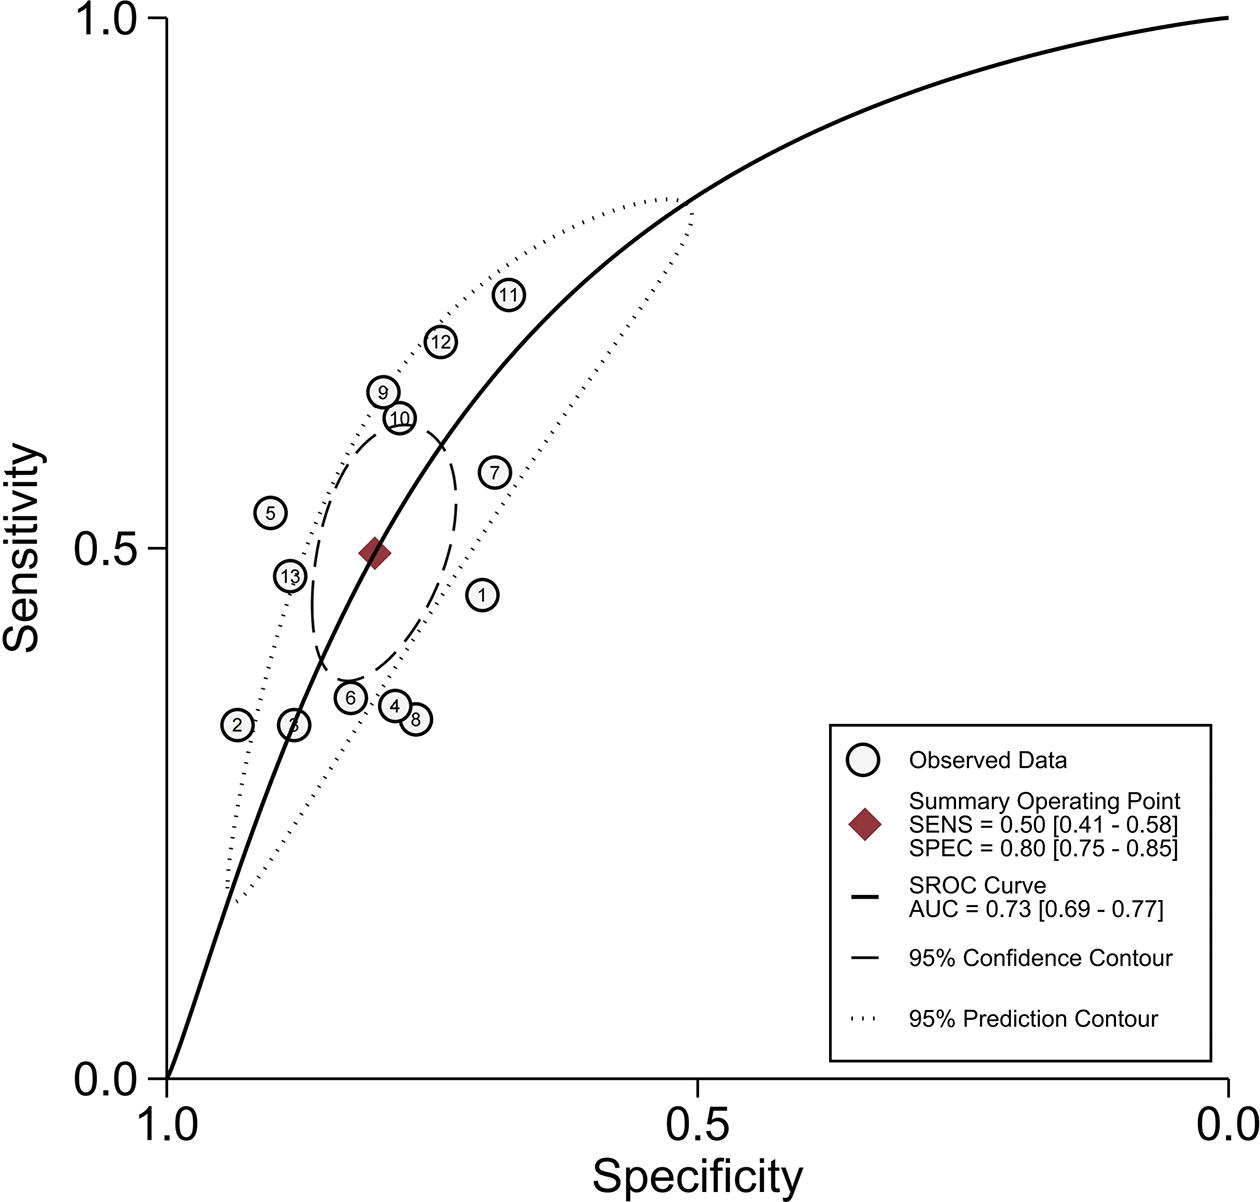
Summary receiver operating characteristic curves of peritumoral enhancement on the arterial phase.
3.4.2 Peritumoral Hypointensity on HBP
All 19 studies (8, 9, 17–33) provided the relevant data of peritumoral hypointensity on HBP to predict MVI in HCC with disodium gadoxetate–enhanced MRI, including 2,699 HCC patients with 2,741 tumors. Of 2,741 tumors, 916 were pathologically diagnosed as MVI-positive (500 tumors with peritumoral hypointensity on HBP and 416 tumors without) and 1,825 as MVI-negative (274 tumors with peritumoral hypointensity on HBP and 1,551 tumors without). Additionally, the Spearman correlation coefficient was 0.318 (P = 0.185), indicating the absence of threshold effect–derived heterogeneity. There was, however, significant heterogeneity among the included articles (P < 0.001, I2 = 98%). The results of pooled SEN and SPE were 0.55 (95% CI, 0.45−0.64) and 0.87 (95% CI, 0.81−0.91), respectively (Figure 5). In addition, the pooled PLR, NLR, and DOR, separately, were 4.1 (95% CI, 3.0−5.7), 0.52 (95% CI, 0.43−0.63), and 8 (95% CI, 5−12). In addition, the AUC was 0.80 (95% CI, 0.76−0.83) (Figure 6).
Figure 5
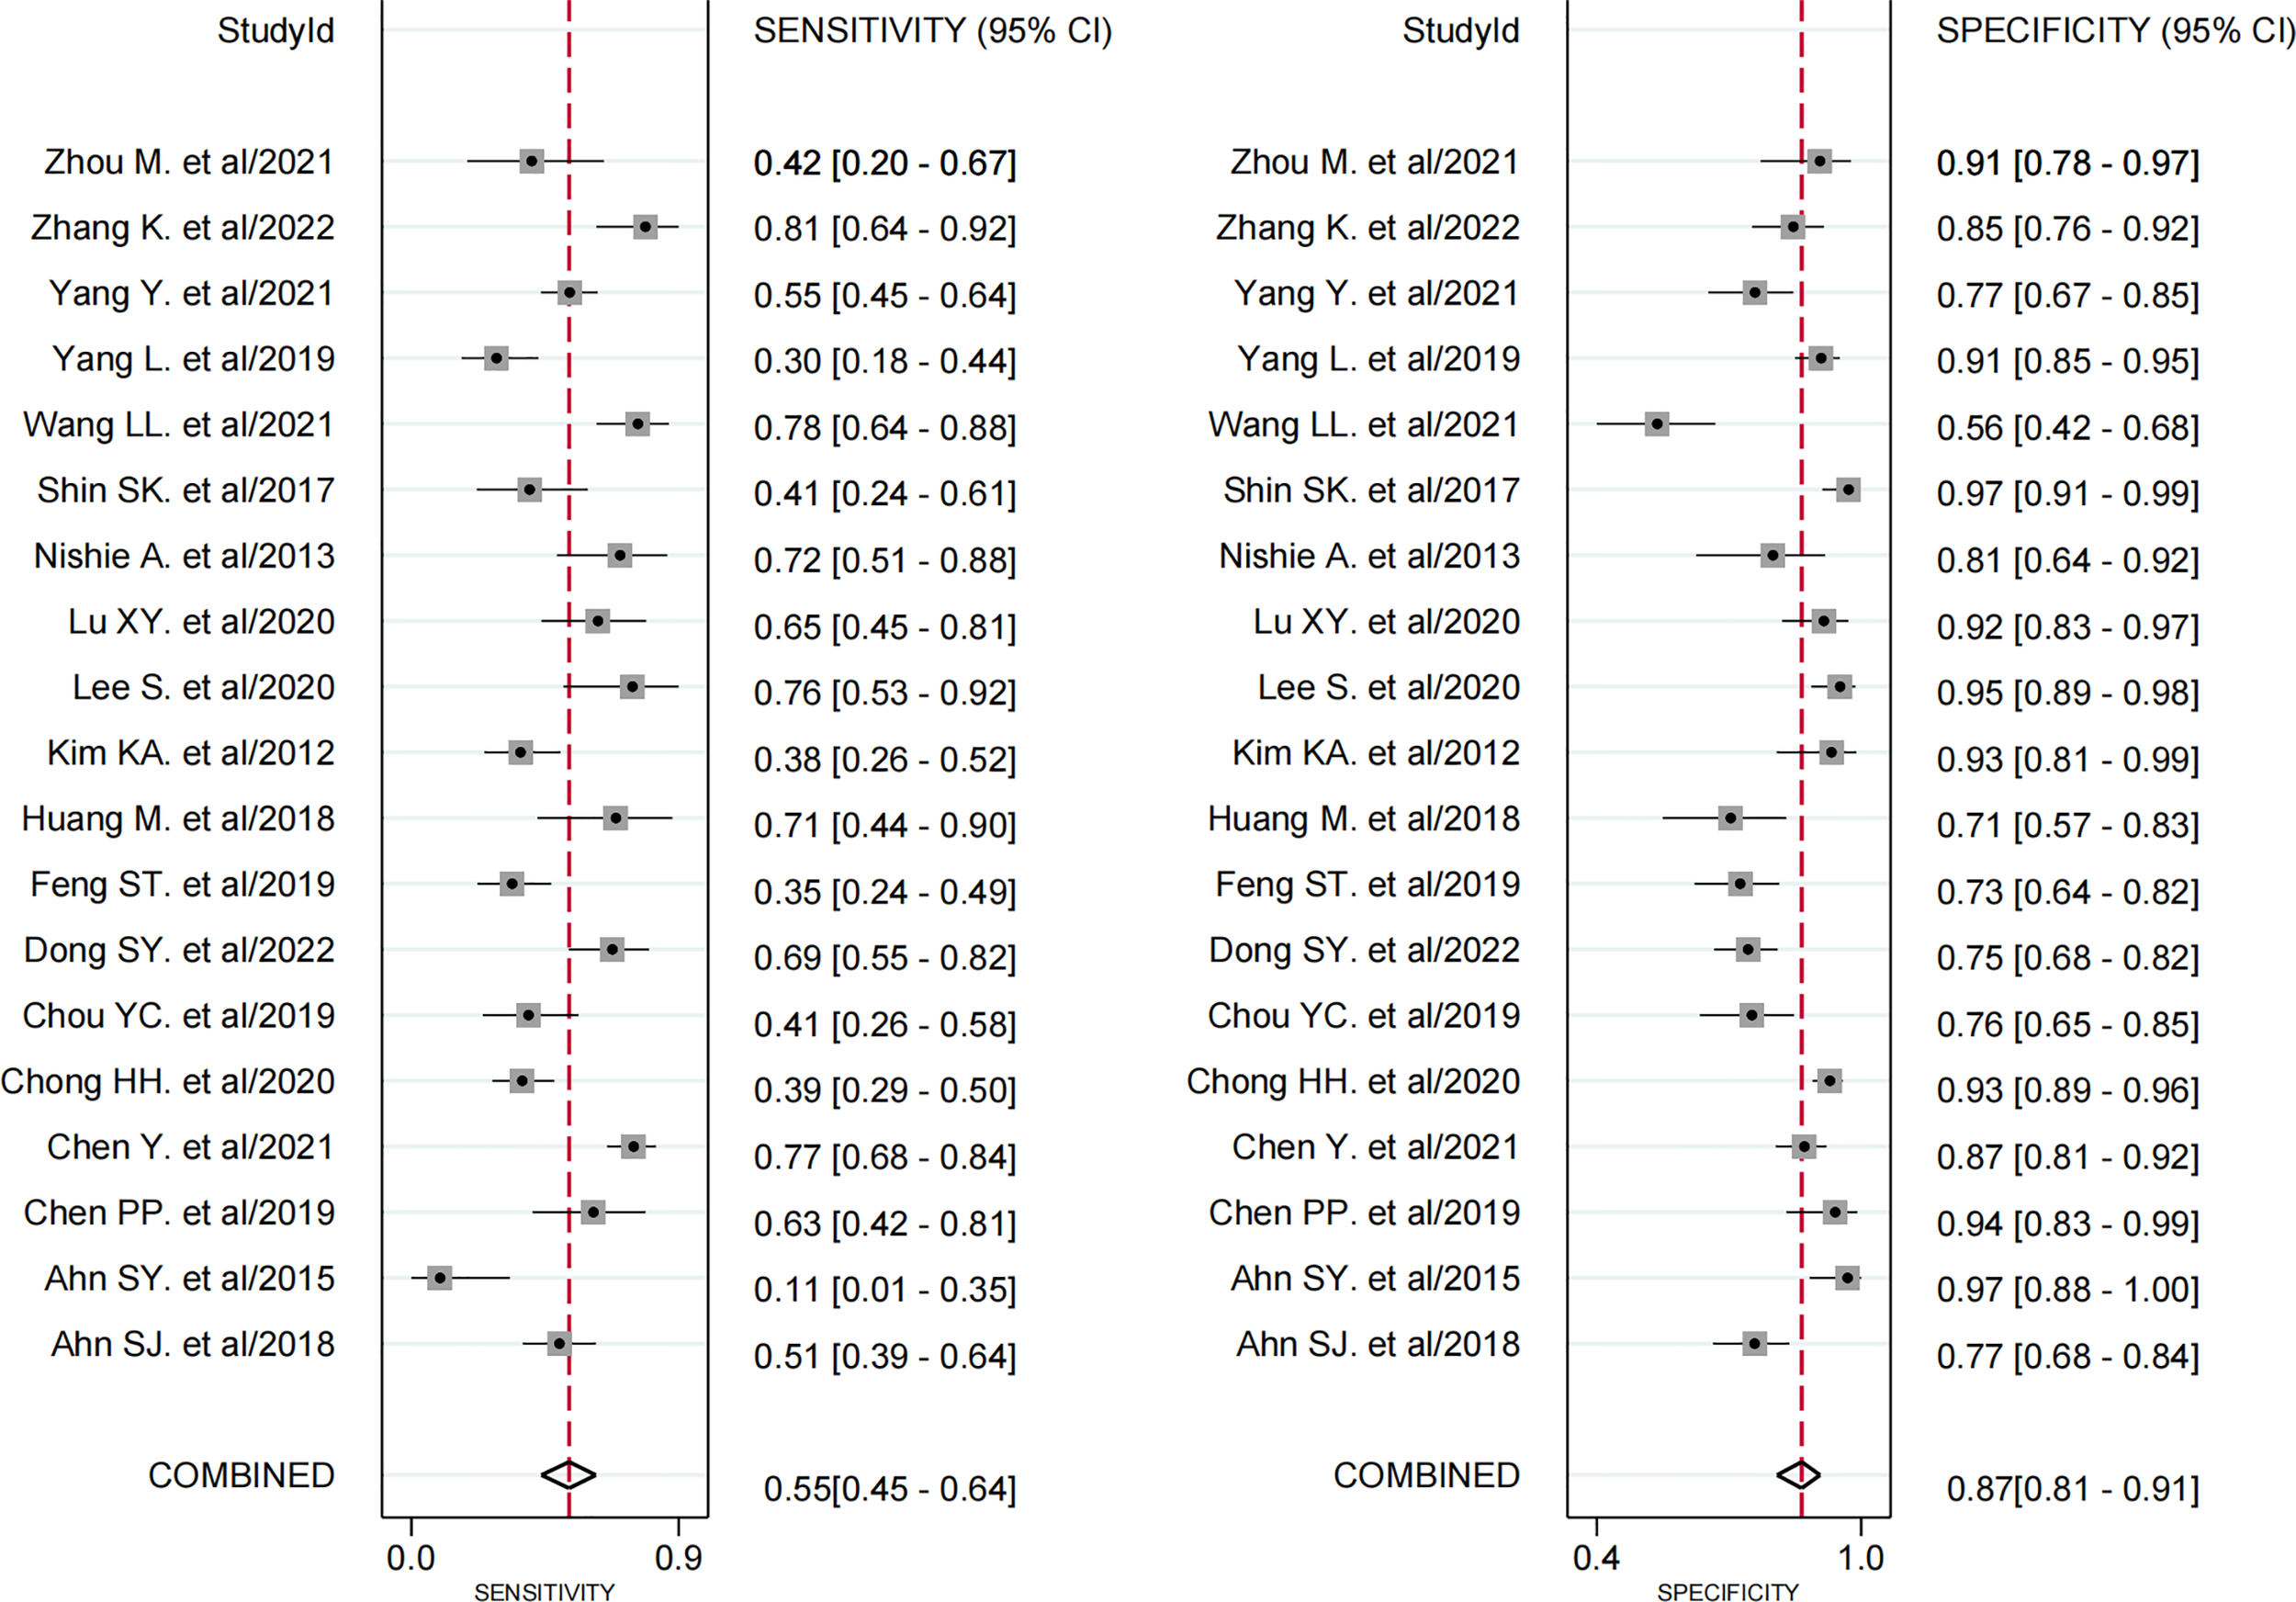
Forest plots demonstrate the pooled sensitivity and specificity of peritumoral hypointensity on the hepatobiliary phase. The 95% CI are shown around point estimates and the pooled result.
Figure 6
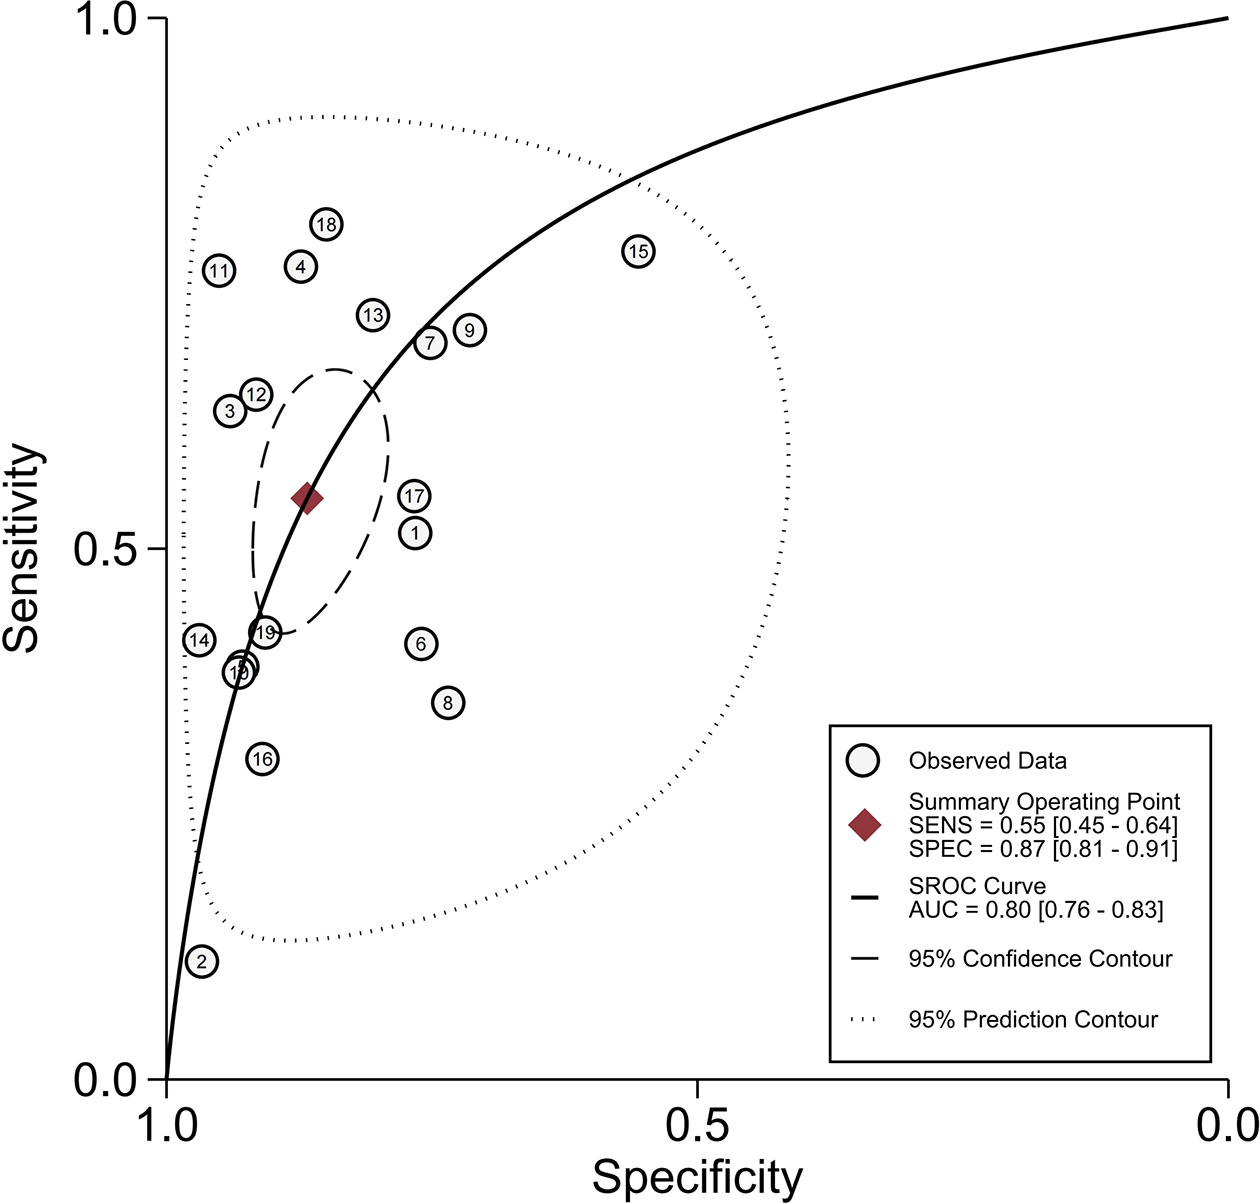
Summary receiver operating characteristic curves of peritumoral hypointensity on the hepatobiliary phase.
3.5 Subgroup Analysis
The causes of pooled variability were investigated using subgroup analysis. Based on clinical experience and the classification of basic information from the included literature, subgroups were formed as follows: 1) region (China as “1,” others as “0”); 2) the mean age of included patients (≥55 years as “1,” <55 years as “0”); 3) magnetic field strength (only 3T as “1,” 1.5T or mixed as “0”); 4) MRI unit (Siemens as “1,” Philips/GE or mixed as “0”); 5) the lesion size of HCC (no restriction as “1,” ≤5 cm as “0”); 6) number of included tumors (≥100 as “1,” <100 as “0”); 7) only a single HCC (yes as “1,” multiple or mixed as “0”); 8) interval between imaging and surgery (≤30 days as “1,” >30 days as “0”); 9) without macrovascular invasion (yes as “1,” unclear as “0”); 10) blind to pathological outcomes (yes as “1,” unclear as “0”); and 11) blind to imaging diagnosis (yes as “1,” unclear as “0”).
Tables 3 and 4 present the outcomes of the subgroup analysis. Except for blindness to the index test during the pathological test, the above ten covariates were major determinants in causing heterogeneity, according to the results of peritumoral enhancement on AP (P < 0.05). Additionally, in terms of peritumoral hypointensity on HBP, the findings demonstrated that the region, mean age of included patients, magnetic field strength, MRI unit, number of included tumors, and only a single HCC, as well as the interval between imaging and surgery, are significant sources of heterogeneity (P < 0.05).
Table 3
| Variable | Subgroups | Studies (n) | Sensitivity | P1 | Specificity | P2 |
|---|---|---|---|---|---|---|
| Region | China | 11 | 0.51 (0.42−0.60) | 0.31 | 0.80 (0.75−0.85) | 0.03 |
| Others | 2 | 0.39 (0.18−0.59) | 0.82 (0.71−0.94) | |||
| Mean age (years) | ≥55 | 6 | 0.49 (0.36−0.62) | 0.96 | 0.80 (0.73−0.87) | 0.00 |
| <55 | 7 | 0.50 (0.39−0.61) | 0.80 (0.74−0.87) | |||
| MFS (T) | 3 | 6 | 0.45 (0.33−0.57) | 0.57 | 0.81 (0.74−0.88) | 0.00 |
| Others | 7 | 0.53 (0.42−0.64) | 0.80 (0.74−0.86) | |||
| MRI unit | Siemens | 7 | 0.48 (0.37−0.59) | 0.78 | 0.80 (0.74−0.86) | 0.00 |
| Others | 6 | 0.52 (0.39−0.64) | 0.81 (0.74−0.88) | |||
| Lesion size | ≤5 cm | 3 | 0.53 (0.36−0.71) | 0.76 | 0.84 (0.76−0.92) | 0.03 |
| NR | 10 | 0.48 (0.39−0.58) | 0.79 (0.74−0.85) | |||
| No. of tumors (n) | ≥100 | 9 | 0.52 (0.43−0.61) | 0.48 | 0.77 (0.72−0.82) | 0.00 |
| <100 | 4 | 0.44 (0.27−0.61) | 0.88 (0.82−0.94) | |||
| Lesions | S | 6 | 0.57 (0.46−0.67) | 0.21 | 0.77 (0.70−0.84) | 0.00 |
| Others | 7 | 0.43 (0.32−0.53) | 0.83 (0.77−0.89) | |||
| IBIS (days) | ≤30 | 11 | 0.52 (0.44−0.61) | 0.14 | 0.79 (0.74−0.84) | 0.00 |
| >30 | 2 | 0.34 (0.14−0.54) | 0.88 (0.80−0.96) | |||
| Macro VI | N | 9 | 0.50 (0.40−0.60) | 0.91 | 0.81(0.76−0.86) | 0.01 |
| U | 4 | 0.49 (0.33−0.65) | 0.78 (0.69−0.87) | |||
| BR | Y | 9 | 0.55 (0.46−0.64) | 0.13 | 0.82 (0.77−0.88) | 0.02 |
| U | 4 | 0.40 (0.28−0.52) | 0.77 (0.68−0.86) | |||
| BI | Y | 1 | 0.34 (0.09−0.58) | 0.45 | 0.77 (0.58−0.95) | 0.16 |
| U | 12 | 0.51 (0.43−0.59) | 0.81 (0.76−0.86) |
Subgroup analyses of peritumoral enhancement on arterial phase.
Data in parentheses are 95% confidence interval (CI). MFS, magnetic field strength; IBIS, interval between imaging and surgery; Macro VI, macrovascular invasion, BR, blindness to reference; BI, blindness to index test; NR, no restrictions; S, single; M, multiple; U, unclear; N, no, Y, yes.
Table 4
| Variable | Subgroups | Studies (n) | Sensitivity | P1 | Specificity | P2 |
|---|---|---|---|---|---|---|
| Region | China | 13 | 0.58 (0.47−0.69) | 0.58 | 0.84 (0.78−0.90) | 0.00 |
| Others | 6 | 0.48 (0.31−0.64) | 0.92 (0.87−0.97) | |||
| Mean age (years) | ≥55 | 10 | 0.52 (0.40−0.65) | 0.48 | 0.89 (0.84−0.94) | 0.03 |
| <55 | 9 | 0.57 (0.44−0.71) | 0.84 (0.77−0.91) | |||
| MFS (T) | 3 | 10 | 0.60 (0.48−0.72) | 0.59 | 0.87 (0.80−0.93) | 0.01 |
| Others | 9 | 0.49 (0.36−0.62) | 0.87 (0.80−0.93) | |||
| MRI unit | Siemens | 10 | 0.52 (0.40−0.65) | 0.48 | 0.84 (0.78−0.91) | 0.00 |
| Others | 9 | 0.58 (0.44−0.71) | 0.89 (0.84−0.95) | |||
| Lesion size | ≤5 cm | 4 | 0.48 (0.28−0.68) | 0.52 | 0.91 (0.84−0.98) | 0.18 |
| NR | 15 | 0.57 (0.46−0.67) | 0.85 (0.80−0.91) | |||
| No. of tumors (n) | ≥100 | 14 | 0.56 (0.45−0.66) | 0.97 | 0.86 (0.80−0.91) | 0.01 |
| <100 | 5 | 0.52 (0.33−0.72) | 0.89 (0.81−0.97) | |||
| Lesions | S | 7 | 0.54 (0.39−0.69) | 0.71 | 0.85 (0.77−0.93) | 0.00 |
| Others | 12 | 0.55 (0.43−0.67) | 0.88 (0.82−0.93) | |||
| IBIS (days) | ≤30 | 15 | 0.58 (0.48−0.68) | 0.28 | 0.84 (0.79−0.90) | 0.00 |
| >30 | 4 | 0.41 (0.21−0.61) | 0.93 (0.88−0.99) | |||
| Macro VI | N | 13 | 0.56 (0.45−0.67) | 0.97 | 0.88 (0.82−0.93) | 0.05 |
| U | 6 | 0.52 (0.35−0.69) | 0.85 (0.75−0.94) | |||
| BR | Y | 13 | 0.51 (0.40−0.62) | 0.17 | 0.90 (0.87−0.94) | 0.26 |
| U | 6 | 0.63 (0.49−0.78) | 0.76 (0.66−0.86) | |||
| BI | Y | 2 | 0.52 (0.24−0.81) | 0.81 | 0.77 (0.56−0.97) | 0.05 |
| U | 17 | 0.55 (0.45−0.65) | 0.88 (0.83−0.92) |
Subgroup analyses of peritumoral hypointensity on hepatobiliary phase.
Data in parentheses are 95% confidence interval (CI). MFS, magnetic field strength; IBIS, interval between imaging and surgery; Macro VI, macrovascular invasion; BR, blindness to reference; BI, blindness to index test; NR, no restrictions; S, single; M, multiple; U, unclear; N, no; Y, yes.
3.6 Sensitivity Analysis and Publication Bias
The results of sensitivity analysis, performed for the two imaging features by eliminating included articles one by one, revealed that none of the articles had any significant effect on the pooled results. There was no significant publication bias in Deeks’ funnel plot asymmetry test of peritumoral enhancement on AP (P = 0.73) (Figure 7A) and peritumoral hypointensity on HBP (P = 0.58) (Figure 7B).
Figure 7
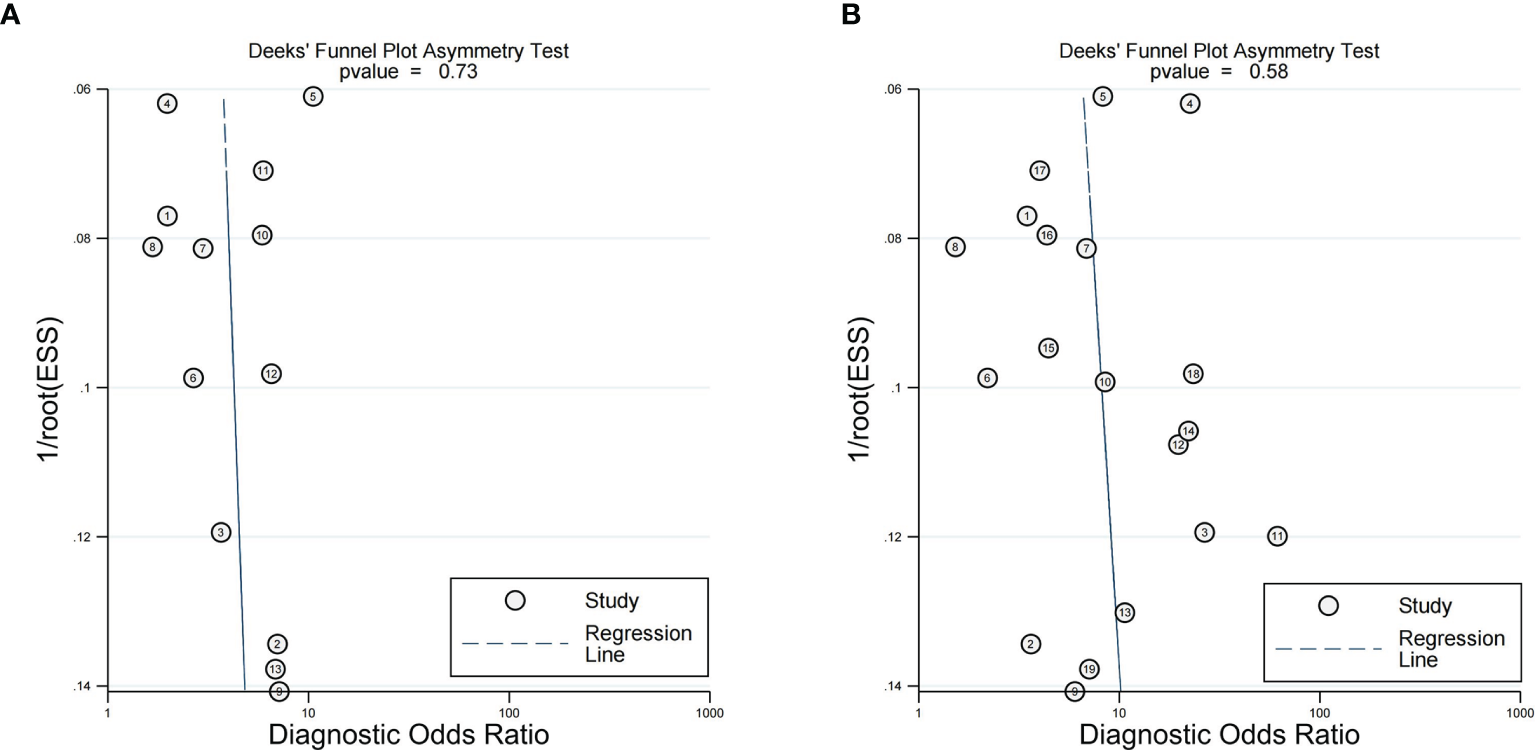
Deeks' functional plots of peritumoral enhancement on the arterial phase (A) and peritumoral hypointension on the hepatobiliary phase (B).
4 Discussion
MVI is a risk factor for HCC recurrence, and the preoperative noninvasive prediction of MVI remains challenging. In our meta-analysis, based on peritumoral imaging findings, the results revealed that both peritumoral enhancement on AP and peritumoral hypointensity on HBP had high SPE but low SEN, which indicated that Gd-EOB-DTPA-enhanced MRI is helpful as a noninvasive, excluded diagnosis for predicting MVI in HCC preoperatively.
The relationship between peritumoral enhancement and the presence of MVI could be understood as that corona enhancement is a hemodynamic perfusion change due to disturbed portal venous drainage (40–42). Furthermore, the reasons why the peritumoral signal was low during HBP could be explained as follows: the occlusion of the intrahepatic portal vein and insufficient compensation of the hepatic arterial flow lead to hepatic parenchyma injury, edema, hepatocyte depletion, and fibrosis (43). Moreover, previous articles have confirmed a positive correlation between the enhancement ratio of HCCs in the HBP of Primovist-enhanced MRI and the expression of organic anion–transporting polypeptide (OATPs) and multidrug-resistant proteins (MRPs); of note, gadoxetic acid disodium is absorbed by OATP8 and excreted by MRP3 (44, 45). Additionally, tumor invasion into small portal vein branches probably leads to hemodynamic perfusion changes and then affects the expression of OATP8 and MRP3 in hepatocytes, which may have an impact on hepatic function and decrease gadoxetic acid uptake into hepatocytes near tumors, leading to peritumoral hypointensity on HBP (19, 23).
The preoperative imaging of peritumoral tissue showing MVI has been applied to conventional CT and MRI. However, Chou CT et al. found that peritumoral enhancement on CT was not a significant risk factor for MVI (46). Chun Yang et al. also claimed that peritumoral enhancement did not show a statistically significant association with MVI (P > 0.05), when performing MRI scans using non-hepatocyte-specific contrast agents, called Magnevist (47). However, in our study, peritumoral enhancement on Gd-EOB-DTPA-enhanced MRI had an association with MVI and had a high SPE of 87%. This may be related to the imaging principles of CT and non-hepatocyte-specific contrast agents. Moreover, since the drainage of contrast from the tumor vein to the peritumoral parenchymal sinusoids and portal venules is an extremely transient process, it inevitably causes transient and severe respiratory motion. In addition, respiratory motion artifacts affect all dynamic phases, especially during the arterial phase (48). Additionally, Wybranski C et al. suggested that Gd-EOB-DTPA-related respiratory motion could not be improved by a series of standard pre-scan patient preparations including breath-holding training (48). This might be the reason why peritumoral enhancement had a low SEN. As a result, Kim H et al. proposed that a more accurate assessment of peritumoral enhancement should be done by a multi-arterial phase study (49). Although an SEN of 50% of peritumoral enhancement in the present study is low, it has been greatly improved compared with a previous meta-analysis that included traditional CT (a pooled SEN of 0.29) (16). It is undeniable that Gd-EOB-DTPA-enhanced MRI has some advantages in detecting MVI. However, peritumoral enhancement is more often seen in hypervascular progressed HCC. While peritumoral enhancement was not present in many hypovascular HCCs, it is reported that the double hypointensity in the portal/venous and HBP were highly suggestive of hypovascular HCC. However, the diagnostic performance of double hypointensity for MVI has not been reported; therefore, it needs further investigation in the future (50).
There were few studies performed to detect MVI utilizing the peritumoral tissue imaging performance of Gd-EOB-DTPA-enhanced MRI. However, a study conducted by Ahn SY et al. (18) found no significant correlation between peritumoral hypointensity on HBP and MVI (P > 0.05). These authors explained that peritumoral hypointensity was not a common observation (it was found in 25% of HCCs) and attributed this discrepancy to the differences in patient populations, small sample size, and low SEN (38.3%) in the research of Kim KA et al. (19). However, in present study, the SEN and SPE of peritumoral hypointensity were 0.55 and 0.87, respectively, which had some clinical applicability, especially as an exclusionary diagnostic tool. Further, Kim KA et al. (19) suggested that the SEN of detecting MVI with peritumoral hypointensity is relatively low, which may be due to the fact that the prevalence of MVI in certain tumors is not associated with any changes in peritumoral hepatocyte function. We hypothesize that some tumor functional changes occur later. This could also be the cause for the low SEN of peritumoral hypointensity in the current study.
Furthermore, in a high-quality study using Gd-BOPTA-enhanced MRI, the SEN and SPE of peritumoral enhancement on AP and peritumoral hypointensity on HBP were 0.23 and 0.95, respectively, and 0.49 and 0.89, respectively (51). Overall, the gap of peritumoral hypointensity between the study results and the present study was not significant, but the difference in peritumoral enhancement was a little higher. In particular, the results showed that the missed diagnosis rate using Gd-EOB-DTPA was relatively lower compared to Gd-BOPTA, but it needs to be verified by multicenter and large sample studies in the future.
According to our meta-analysis, both peritumoral enhancement and peritumoral hypointensity are key factors in predicting MVI and demonstrate moderate accuracy, which are consistent with the findings of most previous studies (8, 19, 21, 25–29, 32, 33). Different imaging techniques to explore the relationship between MVI with peritumoral imaging all showed a low SEN. In the future, how to improve its SEN will be a new research direction. For example, we speculate on whether the radiomics of peritumoral imaging or quantitative analysis to determine MVI can further improve its accuracy. As shown in the Huang M et al. study, peritumoral enhancement and peritumoral hypointense do not always coexist and a more accurate prediction model for MVI is needed (8). Therefore, whether a model with a combination of multiple imaging presentations has a higher clinical application deserves further investigation.
Assessing accuracy is necessarily preceded by assessing heterogeneity. In our study, ten covariates and seven covariates were found to be significant sources of heterogeneity for peritumoral enhancement and peritumoral hypointensity on HBP, respectively. It indicated that the future articles should pay attention to the basic information of the included patients, including the region, mean age, and number and size of included lesions, and should not ignore the interval between imaging and surgery and blindness to reference tests, so as to improve the quality of research.
In this investigation, there are several flaws. First, the population included in those studies was predominantly Asian, which meant that it was not possible to exclude out the potentiality of selection bias. Second, image interpretation depends on the observer so that subjectivity is inevitable to some extent. Finally, the data provided were inadequate for further investigation on peritumoral imaging findings. Therefore, larger multicenter studies are required for a more accurate assessment of the ability of Gd-EOB-DTPA-enhanced MRI to predict MVI.
In conclusion, our study found that the results of peritumoral enhancement on AP and peritumoral hypointensity on HBP showed high SPE but low SEN. This indicates that the peritumoral imaging features on Gd-EOB-DTPA-enhanced MRI can be used as a noninvasive, excluded diagnosis for predicting hepatic MVI in HCC preoperatively. Moreover, the results of this analysis should be updated when additional data become available. In the future, how to improve its SEN will be a new research direction.
Funding
This study was supported by the Diagnosis and Treatment Projects of Major Digestive System Diseases, the Department of Science and Technology of Sichuan Province (No. 2021YFS0375).
Publisher’s Note
All claims expressed in this article are solely those of the authors and do not necessarily represent those of their affiliated organizations, or those of the publisher, the editors and the reviewers. Any product that may be evaluated in this article, or claim that may be made by its manufacturer, is not guaranteed or endorsed by the publisher.
Statements
Data availability statement
The original contributions presented in the study are included in the article/Supplementary Material. Further inquiries can be directed to the corresponding author.
Author contributions
YW and LY proposed the concepts and designed the study. YW wrote the manuscript. MZ was responsible for the study selection and data extraction. YL and XC contributed to analyze the statistics. GZ and LY revised this manuscript. All authors read and approved the final manuscript.
Acknowledgments
The authors gratefully acknowledge LY for his assistance in study design.
Conflict of interest
The authors declare that the research was conducted in the absence of any commercial or financial relationships that could be construed as a potential conflict of interest.
Supplementary material
The Supplementary Material for this article can be found online at: https://www.frontiersin.org/articles/10.3389/fonc.2022.907076/full#supplementary-material
References
1
Sung H Ferlay J RL S Laversanne M Soerjomataram I Jemal A et al . Global Cancer Statistics 2020: GLOBOCAN Estimates of Incidence and Mortality Worldwide for 36 Cancers in 185 Countries. CA Cancer J Clin (2021) 71(3):209–49. doi: 10.3322/caac.21660
2
Banerjee S Wang DS Kim HJ Sirlin CB Chan MG Korn RL et al . A Computed Tomography Radiogenomic Biomarker Predicts Microvascular Invasion and Clinical Outcomes in Hepatocellular Carcinoma. Hepatology (2015) 62(3):792–800. doi: 10.1002/hep.27877
3
Lim KC Chow PK Allen JC Chia GS Lim M Cheow PC et al . Microvascular Invasion is a Better Predictor of Tumor Recurrence and Overall Survival Following Surgical Resection for Hepatocellular Carcinoma Compared to the Milan Criteria. Ann Surg (2011) 254(1):108–13. doi: 10.1097/SLA.0b013e31821ad884
4
Roayaie S Blume IN Thung SN Guido M Fiel MI Hiotis S et al . A System of Classifying Microvascular Invasion to Predict Outcome After Resection in Patients With Hepatocellular Carcinoma. Gastroenterology (2009) 137(3):850–5. doi: 10.1053/j.gastro.2009.06.003
5
Hirokawa F Hayashi M Miyamoto Y Asakuma M Shimizu T Komeda K et al . Outcomes and Predictors of Microvascular Invasion of Solitary Hepatocellular Carcinoma. Hepatol Res (2014) 44(8):846–53. doi: 10.1111/hepr.12196
6
Hu H Zheng Q Huang Y Huang XW Lai ZC Liu J et al . A non-Smooth Tumor Margin on Preoperative Imaging Assesses Microvascular Invasion of Hepatocellular Carcinoma: A Systematic Review and Meta-Analysis. Sci Rep (2017) 7(1):15375. doi: 10.1038/s41598-017-15491-6
7
Murakami T Sofue K Hori M . Diagnosis of Hepatocellular Carcinoma Using Gd-EOB-DTPA MR Imaging. Magn Reson Med Sci (2022) 21(1):168–81. doi: 10.2463/mrms.rev.2021-0031
8
Huang M Liao B Xu P Cai H Huang K Dong Z et al . Prediction of Microvascular Invasion in Hepatocellular Carcinoma: Preoperative Gd-EOB-DTPA-Dynamic Enhanced MRI and Histopathological Correlation. Contrast Media Mol Imaging (2018) 2018:9674565. doi: 10.1155/2018/9674565
9
Feng ST Jia Y Liao B Huang B Zhou Q Li X et al . Preoperative Prediction of Microvascular Invasion in Hepatocellular Cancer: A Radiomics Model Using Gd-EOB-DTPA-Enhanced MRI. Eur Radiol (2019) 29(9):4648–59. doi: 10.1007/s00330-018-5935-8
10
Guglielmo FF Mitchell DG Gupta S . Gadolinium Contrast Agent Selection and Optimal Use for Body MR Imaging. Radiol Clin North Am (2014) 52(4):637–56. doi: 10.1016/j.rcl.2014.02.004
11
Stroszczynski C Gaffke G Gnauck M Streitparth F Wieners G Lopez-Häninnen E . Aktueller Stand Der MRT-Diagnostik Mit Leberspezifischen Kontrastmitteln. Gd-EOB-DTPA Und Gd-BOPTA [Current Status of MRI Diagnostics With Liver-Specific Contrast Agents. Gd-EOB-DTPA and Gd-BOPTA]. Radiologe (2004) 44(12):1185–91. doi: 10.1007/s00117-004-1134-5
12
Rohrer M Bauer H Mintorovitch J Requardt M Weinmann H . Comparison of Magnetic Properties of MRI Contrast Media Solutions at Different Magnetic Field Strengths. Invest Radiol (2005) 40(11):715–24. doi: 10.1097/01.rli.0000184756.66360.d3
13
Zhao W Liu W Liu H Yi X Hou J Pei Y et al . Preoperative Prediction of Microvascular Invasion of Hepatocellular Carcinoma With IVIM Diffusion-Weighted MR Imaging and Gd-EOB-DTPA-Enhanced MR Imaging. PLoS One (2018) 13(5):e197488. doi: 10.1371/journal.pone.0197488
14
He YZ He K Huang RQ Wang ZL Ye SW Liu LW et al . Preoperative Evaluation and Prediction of Clinical Scores for Hepatocellular Carcinoma Microvascular Invasion: A Single-Center Retrospective Analysis. Ann Hepatol (2020) 19(6):654–61. doi: 10.1016/j.aohep.2020.07.002
15
Mule S Chalaye J Legou F Tenenhaus A Calderaro J PA G et al . Hepatobiliary MR Contrast Agent Uptake as a Predictive Biomarker of Aggressive Features on Pathology and Reduced Recurrence-Free Survival in Resectable Hepatocellular Carcinoma: Comparison With Dual-Tracer 18F-FDG and 18F-FCH PET/Ct. Eur Radiol (2020) 30(10):5348–57. doi: 10.1007/s00330-020-06923-5
16
Hu HT SL S Wang Z QY S XW H Zheng Q et al . Peritumoral Tissue on Preoperative Imaging Reveals Microvascular Invasion in Hepatocellular Carcinoma: A Systematic Review and Meta-Analysis. Abdom Radiol (NY) (2018) 43(12):3324–30. doi: 10.1007/s00261-018-1646-5
17
Ahn SJ Kim JH Park SJ Kim ST Han JK . Hepatocellular Carcinoma: Preoperative Gadoxetic Acid-Enhanced MR Imaging can Predict Early Recurrence After Curative Resection Using Image Features and Texture Analysis. Abdom Radiol (NY) (2019) 44(2):539–48. doi: 10.1007/s00261-018-1768-9
18
Ahn SY JM L Joo I ES L SJ L GJ C et al . Prediction of Microvascular Invasion of Hepatocellular Carcinoma Using Gadoxetic Acid-Enhanced MR and (18)F-FDG PET/Ct. Abdom Imaging (2015) 40(4):843–51. doi: 10.1007/s00261-014-0256-0
19
Kim KA Kim MJ Jeon HM Kim KS Choi JS Ahn SH et al . Prediction of Microvascular Invasion of Hepatocellular Carcinoma: Usefulness of Peritumoral Hypointensity Seen on Gadoxetate Disodium-Enhanced Hepatobiliary Phase Images. J Magn Reson Imaging (2012) 35(3):629–34. doi: 10.1002/jmri.22876
20
Chen PP Lu J Zhang T Zhang XQ Liang HW Miao XF . The Value of Gadolinium-Ethoxybenzyl-Diethylenetriamine Pentaacetic Acid Enhanced MRI in the Prediction of Microvascular Invasion of Hepatocellular Carcinoma. Chin J Radiol (2019) 53(2):103–8. doi: 10.3760/cma.j.issn.1005-1201.2019.02.005
21
Chen Y Xia Y PP T Long L Jiang Z Huang Z et al . Comparison of Conventional Gadoxetate Disodium-Enhanced MRI Features and Radiomics Signatures With Machine Learning for Diagnosing Microvascular Invasion. AJR Am J Roentgenol (2021) 216(6):1510–20. doi: 10.2214/AJR.20.23255
22
Chong HH Yang L RF S YL Yu DJ Wu SX R et al . Multi-Scale and Multi-Parametric Radiomics of Gadoxetate Disodium-Enhanced MRI Predicts Microvascular Invasion and Outcome in Patients With Solitary Hepatocellular Carcinoma </= 5 Cm. Eur Radiol (2021) 31(7):4824–38. doi: 10.1007/s00330-020-07601-2
23
Chou YC Lao IH Hsieh PL Su YY Mak CW Sun DP et al . Gadoxetic Acid-Enhanced Magnetic Resonance Imaging can Predict the Pathologic Stage of Solitary Hepatocellular Carcinoma. World J Gastroenterol (2019) 25(21):2636–49. doi: 10.3748/wjg.v25.i21.2636
24
Dong SY Wang WT Chen XS Yang YT Zhu S Zeng MS et al . Microvascular Invasion of Small Hepatocellular Carcinoma can be Preoperatively Predicted by the 3D Quantification of MRI. Eur Radiol (2022) 32(6):4198–209. doi: 10.1007/s00330-021-08495-4
25
Lee S Kim KW Jeong WK Kim MJ Choi GH Choi JS et al . Gadoxetic Acid-Enhanced MRI as a Predictor of Recurrence of HCC After Liver Transplantation. Eur Radiol (2020) 30(2):987–95. doi: 10.1007/s00330-019-06424-0
26
Lu XY Lu J Zhang T Zhang XQ Chen PP Jiang JF et al . Predicting Microvascular Invasion of Hepatocellular Carcinoma According to Hepatobiliary Stage Peritumoral Hypointensity During Gadolinium-Ethoxybenzyl-Diethylenetriamine Pentaacetic Aicd Enhanced MRI. Chin J Med Imaging Technol (2020) 36(9):1350–4. doi: 10.13929/j.issn.1003-3289.2020.09.018
27
Nishie A Asayama Y Ishigami K Kakihara D Nakayama T Ushijima Y et al . Clinicopathological Significance of the Peritumoral Decreased Uptake Area of Gadolinium Ethoxybenzyl Diethylenetriamine Pentaacetic Acid in Hepatocellular Carcinoma. J Gastroenterol Hepatol (2014) 29(3):561–7. doi: 10.1111/jgh.12423
28
Shin SK Kim YS Shim YS Choi SJ Park SH Jung DH et al . Peritumoral Decreased Uptake Area of Gadoxetic Acid Enhanced Magnetic Resonance Imaging and Tumor Recurrence After Surgical Resection in Hepatocellular Carcinoma: A STROBE-Compliant Article. Med (Baltimore) (2017) 96(33):e7761. doi: 10.1097/MD.0000000000007761
29
Wang LL Li JF Lei JQ Guo SL Li JK Xu YS et al . The Value of the Signal Intensity of Peritumoral Tissue on Gd-EOB-DTPA Dynamic Enhanced MRI in Assessment of Microvascular Invasion and Pathological Grade of Hepatocellular Carcinoma. Med (Baltimore) (2021) 100(20):e25804. doi: 10.1097/MD.0000000000025804
30
Yang L Gu D Wei J Yang C Rao S Wang W et al . A Radiomics Nomogram for Preoperative Prediction of Microvascular Invasion in Hepatocellular Carcinoma. Liver Cancer (2019) 8(5):373–86. doi: 10.1159/000494099
31
Yang Y Fan W Gu T Yu L Chen H Lv Y et al . Radiomic Features of Multi-ROI and Multi-Phase MRI for the Prediction of Microvascular Invasion in Solitary Hepatocellular Carcinoma. Front Oncol (2021) 11:756216. doi: 10.3389/fonc.2021.756216
32
Zhang K SS X WC Li ZX Ye ZW S Shen W . Prediction of Microvascular Invasion in HCC by a Scoring Model Combining Gd-EOB-DTPA MRI and Biochemical Indicators. Eur Radiol (2022) 32(6):4186–97. doi: 10.1007/s00330-021-08502-8
33
Zhou M Shan D Zhang C Nie J Wang G Zhang Y et al . Value of Gadoxetic Acid-Enhanced MRI for Microvascular Invasion of Small Hepatocellular Carcinoma: A Retrospective Study. BMC Med Imaging (2021) 21(1):40. doi: 10.1186/s12880-021-00572-w
34
Moher D Liberati A Tetzlaff J Altman DG . Preferred Reporting Items for Systematic Reviews and Meta-Analyses: The PRISMA Statement. PloS Med (2009) 6(7):e1000097. doi: 10.1371/journal.pmed.1000097
35
Whiting PF Rutjes AW Westwood ME Mallett S Deeks JJ Reitsma JB et al . QUADAS-2: A Revised Tool for the Quality Assessment of Diagnostic Accuracy Studies. Ann Intern Med (2011) 155(8):529–36. doi: 10.7326/0003-4819-155-8-201110180-00009
36
Zamora J Abraira V Muriel A Khan K Coomarasamy A . Meta-DiSc: A Software for Meta-Analysis of Test Accuracy Data. BMC Med Res Methodol (2006) 6:31. doi: 10.1186/1471-2288-6-31
37
Higgins JP SG T JJ D Altman DG . Measuring Inconsistency in Meta-Analyses. BMJ (2003) 327(7414):557–60. doi: 10.1136/bmj.327.7414.557
38
Leeflang MM JJ D Gatsonis C Bossuyt PM . Systematic Reviews of Diagnostic Test Accuracy. Ann Intern Med (2008) 149(12):889–97. doi: 10.7326/0003-4819-149-12-200812160-00008
39
Deeks JJ Macaskill P Irwig L . The Performance of Tests of Publication Bias and Other Sample Size Effects in Systematic Reviews of Diagnostic Test Accuracy was Assessed. J Clin Epidemiol (2005) 58(9):882–93. doi: 10.1016/j.jclinepi.2005.01.016
40
Matsui O Kobayashi S Sanada J Kouda W Ryu Y Kozaka K et al . Hepatocelluar Nodules in Liver Cirrhosis: Hemodynamic Evaluation (Angiography-Assisted CT) With Special Reference to Multi-Step Hepatocarcinogenesis. Abdom Imaging (2011) 36(3):264–72. doi: 10.1007/s00261-011-9685-1
41
Miyayama S Yamashiro M Okuda M Yoshie Y Nakashima Y Ikeno H et al . Detection of Corona Enhancement of Hypervascular Hepatocellular Carcinoma by C-Arm Dual-Phase Cone-Beam CT During Hepatic Arteriography. Cardiovasc Intervent Radiol (2011) 34(1):81–6. doi: 10.1007/s00270-010-9835-9
42
Ueda K Matsui O Kawamori Y Nakanuma Y Kadoya M Yoshikawa J et al . Hypervascular Hepatocellular Carcinoma: Evaluation of Hemodynamics With Dynamic CT During Hepatic Arteriography. Radiology (1998) 206(1):161–6. doi: 10.1148/radiology.206.1.9423667
43
Choi BI Lee KH Han JK Lee JM . Hepatic Arterioportal Shunts: Dynamic CT and MR Features. Korean J Radiol (2002) 3(1):1–15. doi: 10.3348/kjr.2002.3.1.1
44
Kitao A Zen Y Matsui O Gabata T Kobayashi S Koda W et al . Hepatocellular Carcinoma: Signal Intensity at Gadoxetic Acid-Enhanced MR Imaging–correlation With Molecular Transporters and Histopathologic Features. Radiology (2010) 256(3):817–26. doi: 10.1148/radiol.10092214
45
Tsuboyama T Onishi H Kim T Akita H Hori M Tatsumi M et al . Hepatocellular Carcinoma: Hepatocyte-Selective Enhancement at Gadoxetic Acid-Enhanced MR Imaging–Correlation With Expression of Sinusoidal and Canalicular Transporters and Bile Accumulation. Radiology (2010) 255(3):824–33. doi: 10.1148/radiol.10091557
46
Chou CT Chen RC Lin WC Ko CJ Chen CB Chen YL . Prediction of Microvascular Invasion of Hepatocellular Carcinoma: Preoperative CT and Histopathologic Correlation. AJR Am J Roentgenol (2014) 203(3):W253–9. doi: 10.2214/AJR.13.10595
47
Yang C Wang H Sheng R Ji Y Rao S Zeng M . Microvascular Invasion in Hepatocellular Carcinoma: Is it Predictable With a New, Preoperative Application of Diffusion-Weighted Imaging? Clin Imaging (2017) 41:101–5. doi: 10.1016/j.clinimag.2016.10.004
48
Wybranski C Siedek F Damm R Gazis A Wenzel O Haneder S et al . Respiratory Motion Artefacts in Gd-EOB-DTPA (Primovist/Eovist) and Gd-DOTA (Dotarem)-Enhanced Dynamic Phase Liver MRI After Intensified and Standard Pre-Scan Patient Preparation: A Bi-Institutional Analysis. PloS One (2020) 15(3):e230024. doi: 10.1371/journal.pone.0230024
49
Kim H Park MS Choi JY Park YN Kim MJ Kim KS et al . Can Microvessel Invasion of Hepatocellular Carcinoma be Predicted by Pre-Operative MRI? Eur Radiol (2009) 19(7):1744–51. doi: 10.1007/s00330-009-1331-8
50
Granito A Galassi M Piscaglia F Romanini L Lucidi V Renzulli M et al . Impact of Gadoxetic Acid (Gd-EOB-DTPA)-Enhanced Magnetic Resonance on the non-Invasive Diagnosis of Small Hepatocellular Carcinoma: A Prospective Study. Aliment Pharmacol Ther (2013) 37(3):355–63. doi: 10.1111/apt.12166
51
Zhang L Yu X Wei W Pan X Lu L Xia J et al . Prediction of HCC Microvascular Invasion With Gadobenate-Enhanced MRI: Correlation With Pathology. Eur Radiol (2020) 30(10):5327–36. doi: 10.1007/s00330-020-06895-6
Summary
Keywords
Gd-EOB-DTPA-enhanced MRI, microvascular invasion, hepatocellular carcinoma, peritumoral enhancement, peritumoral hypointensity, meta-analysis
Citation
Wu Y, Zhu M, Liu Y, Cao X, Zhang G and Yin L (2022) Peritumoral Imaging Manifestations on Gd-EOB-DTPA-Enhanced MRI for Preoperative Prediction of Microvascular Invasion in Hepatocellular Carcinoma: A Systematic Review and Meta-Analysis. Front. Oncol. 12:907076. doi: 10.3389/fonc.2022.907076
Received
29 March 2022
Accepted
25 May 2022
Published
24 June 2022
Volume
12 - 2022
Edited by
Xiankai Sun, University of Texas Southwestern Medical Center, United States
Reviewed by
Alessandro Granito, University of Bologna, Italy; Zoltan Kovacs, University of Texas Southwestern Medical Center, United States
Updates
Copyright
© 2022 Wu, Zhu, Liu, Cao, Zhang and Yin.
This is an open-access article distributed under the terms of the Creative Commons Attribution License (CC BY). The use, distribution or reproduction in other forums is permitted, provided the original author(s) and the copyright owner(s) are credited and that the original publication in this journal is cited, in accordance with accepted academic practice. No use, distribution or reproduction is permitted which does not comply with these terms.
*Correspondence: Longlin Yin, yinlonglin@163.com
†These authors have contributed equally to this work and share first authorship
This article was submitted to Cancer Imaging and Image-directed Interventions, a section of the journal Frontiers in Oncology
Disclaimer
All claims expressed in this article are solely those of the authors and do not necessarily represent those of their affiliated organizations, or those of the publisher, the editors and the reviewers. Any product that may be evaluated in this article or claim that may be made by its manufacturer is not guaranteed or endorsed by the publisher.