 Myung-Hoon Han1
 Kyueng-Whan Min2*
 Yung-Kyun Noh3,4*
 Jae Min Kim1
 Jin Hwan Cheong1
 Je Il Ryu1
 Yu Deok Won1
 Seong-Ho Koh5
 Young Mi Park6
- 1Department of Neurosurgery, Hanyang University Guri Hospital, Hanyang University College of Medicine, Guri, South Korea
- 2Department of Pathology, Hanyang University Guri Hospital, Hanyang University College of Medicine, Guri, South Korea
- 3Department of Computer Science, Hanyang University, Seoul, South Korea
- 4School of Computational Sciences, Korea Institute for Advanced Study, Seoul, South Korea
- 5Department of Neurology, Hanyang University Guri Hospital, Hanyang University College of Medicine, Guri, South Korea
- 6Department of Pediatrics, Gangneung Asan Hospital, Ulsan University College of Medicine, Gangneung-si, South Korea
Glioblastoma multiforme (GBM) is the most malignant brain tumor with an extremely poor prognosis. The Cancer Genome Atlas (TCGA) database has been used to confirm the roles played by 10 canonical oncogenic signaling pathways in various cancers. The purpose of this study was to evaluate the expression of genes in these 10 canonical oncogenic signaling pathways, which are significantly related to mortality and disease progression in GBM patients. Clinicopathological information and mRNA expression data of 525 patients with GBM were obtained from TCGA database. Gene sets related to the 10 oncogenic signaling pathways were investigated via Gene Set Enrichment Analysis. Multivariate Cox regression analysis was performed for all the genes significantly associated with mortality and disease progression for each oncogenic signaling pathway in GBM patients. We found 12 independent genes from the 10 oncogenic signaling pathways that were significantly related to mortality and disease progression in GBM patients. Considering the roles of these 12 significant genes in cancer, we suggest possible mechanisms affecting the prognosis of GBM. We also observed that the expression of 6 of the genes significantly associated with a poor prognosis of GBM, showed negative correlations with CD8+ T-cells in GBM tissue. Using a large-scale open database, we identified 12 genes belonging to 10 well-known oncogenic canonical pathways, which were significantly associated with mortality and disease progression in patients with GBM. We believe that our findings will contribute to a better understanding of the mechanisms underlying the pathophysiology of GBM in the future.
Introduction
Glioblastoma multiforme (GBM) is the most malignant and common primary brain tumor with an extremely poor prognosis. Despite the variety of modern therapies against GBM, the median survival of GBM patients is approximately 14 to 15 months from the diagnosis (1).
The Cancer Genome Atlas (TCGA) is the world’s largest and richest collection of genomic data, including digital pathologic slides, clinicopathological information, and gene expression and RNA sequencing data (2). TCGA data have confirmed the roles of 10 canonical oncogenic signaling pathways with frequent genetic alterations in cancer (3). The 10 oncogenic signaling pathways are cell cycle, Hippo, Myc, Notch, nuclear factor erythroid 2-related factor 2 (Nrf2), phosphatidylinositol 3-kinase (PI3K), receptor tyrosine kinase (RTK), transforming growth factor beta (TGF-β), p53, and Wnt/β-catenin (3). With the aid of TCGA, we recently showed that dickkopf-3 (DKK3) in the Wnt/β-catenin signaling pathway is associated with an immunosuppressive tumor microenvironment and a poor prognosis in patients with GBM (4). Since Wnt/β-catenin signaling is one of the 10 oncogenic signaling pathways, we expanded the scope of the study to use TCGA data to identify additional genes in the remaining 9 oncogenic signaling pathways that are significantly related to mortality and disease progression in GBM patients.
Therefore, the primary aim of the study was to use TCGA data to identify genes in the 10 canonical oncogenic signaling pathways, which are significantly associated with mortality and disease progression in GBM patients. The secondary objective of the study was to investigate correlations between these genes and between these genes and immunosuppressive conditions in GBM. Further, drug sensitivity screening was also performed in GBM cell lines using the Genomics of Drug Sensitivity in Cancer (GDSC) and the Catalog of Somatic Mutations in Cancer (COSMIC) databases.
Materials and methods
Study patients
As we recently reported, the same 525 GBM cases with virtual histopathological slides, clinical information, and mRNA expression data from TCGA were used to conduct this study (https://gdc.cancer.gov/about-data/publications/pancanatlas and https://www.cbioportal.org/) (4). The raw data used in this study are presented in the Supplementary Data 1 file.
Extra informed consent is not essential because the data were all obtained from public TCGA database.
Gene sets related to the 10 oncogenic signaling pathways
To identify genes significantly associated with disease progression and mortality in GBM, we used the Molecular Signatures Database (MSigDB version 7.5.1) with 32,880 gene sets of the Gene Set Enrichment Analysis (GSEA) (version 4.1.0) (https://www.gsea-msigdb.org/) (5). Gene sets related to the 10 oncogenic signaling pathways were investigated via GSEA. The gene sets in the 10 canonical signaling pathways used for the analysis are from the following signaling pathways (1): cell cycle (standard name, KEGG_CELL_CYCLE; systematic name, M7963; when matching with TCGA database, 112 genes out of 125 were available for analysis) (2), Hippo signaling (standard name, GOBP_HIPPO_SIGNALING; systematic name, M11445; 29 genes out of 40 were available for analysis) (3), Myc signaling (standard name, PID_MYC_PATHWAY; systematic name, M139; 23 genes out of 25 were available for analysis) (4), Notch signaling (standard name, KEGG_NOTCH_SIGNALING_PATHWAY; systematic name, M7946; 36 genes out of 47 were available for analysis) (5), Nrf2 signaling (standard name, WP_NRF2_PATHWAY; systematic name, M39454; 106 genes out of 145 were available for analysis) (6), PI3K signaling (standard name, HALLMARK_PI3K_AKT_MTOR_SIGNALING; systematic name, M5923; 97 genes out of 105 were available for analysis) (7), RTK signaling (standard name, KEGG_ERBB_SIGNALING_PATHWAY; systematic name, M12467; 80 genes out of 87 were available for analysis) (8), TGF-β signaling (standard name, KEGG_TGF_BETA_SIGNALING_PATHWAY; systematic name, M2642; 79 genes out of 86 were available for analysis) (9), p53 signaling (standard name, KEGG_P53_SIGNALING_PATHWAY; systematic name, M6370; 59 genes out of 68 were available for analysis), and (10) Wnt/β-catenin signaling (standard name, ST_WNT_BETA_CATENIN_PATHWAY; systematic name, M17761; 31 genes out of 34 were available for analysis). We present raw data related to the mRNA levels of all gene sets in GBM tissues for each oncogenic signaling pathway used in the analysis in the Supplementary Data File 2.
In silico flow cytometry
As described previously, the immune cell composition of GBM tissues in our study patients was identified using CIBERSORT (https://cibersort.stanford.edu), which is a computational program to decipher the immune cell-type fractions based on a validated leukocyte gene signature matrix containing 547 genes and 22 human immune cell subpopulations (4, 6). We entered the gene expression profiles of GBM tissues from TCGA into CIBERSORT for analysis, and the algorithm was run using the LM22 signature matrix at 100 permutations. There is a positive correlation between elevated CD8+ T cell counts in the tumor microenvironment and a good prognosis in cancer (7). In addition, because CD8+ T cells are considered major drivers of antitumor immunity, we included CD8+ T cells in our examination of the relationship between gene expression and the degree of antitumor immunity in the GBM microenvironment in this study (8).
Data extraction from the GDSC and COSMIC databases
We performed drug screening using datasets from the GDSC and COSMIC databases, which are large-scale cancer cell line and drug response databases containing data from 1,796 cancer cell lines and 565 compounds, respectively (9, 10). We examined the gene expression in 49 GBM cell lines (A172, AM-38, Becker, CAS-1, CCF-STTG1, D-247MG, D-263MG, D-336MG, D-392MG, D-423MG, D-502MG, D-542MG, D-566MG, DBTRG-05MG, DK-MG, GAMG, GB-1, GI-1, GMS-10, H4, KALS-1, KINGS-1, KNS-42, KNS-81-FD, KS-1, LN-18, LN-229, LN-405, LNZTA3WT4, M059J, MOG-G-CCM, MOG-G-UVW, NMC-G1, no-10, no-11, SF126, SF268, SF295, SF539, SK-MG-1, SNB75, SW1088, SW1783, T98G, U-118-MG, U-87-MG, U251, YH-13, YKG-1). The responses of 49 GBM cell lines to 316 drugs were measured and reported as the natural log half-maximal inhibitory concentration [ln(IC50)] value. A drug was defined as being effective when a negative correlation was observed between gene expression and the ln(IC50) values in 49 GBM cell lines with a p value < 0.05 (11, 12).
Statistical analysis
Pearson’s correlation coefficients and significance levels (p-values) were estimated to examine the associations between the mRNA expression of the above-mentioned 12 genes from the 10 oncogenic signaling pathways and between the gene expression of these 12 genes and CD8+ T cell fractions using R with clustering technique (R code: corrplot, M, order = “hclust”, p.mat = p_mat, sig.level = 0.01, method = “square”). In addition, Pearson’s correlation analysis was also performed to identify the correlation between gene expression and ln(IC50) values for various antitumor agents in 49 GBM cell lines.
We estimated overall survival (OS) and progression-free survival (PFS) using Kaplan–Meier analysis for all genes related to each oncogenic signaling pathway based on the gene expression tertiles (tertile 1 = low expression; tertile 2 = moderate expression; tertile 3 = high expression) (4). First, we identified all genes for each oncogenic signaling pathway that were significantly related to OS and PFS of the Kaplan–Meier analysis. We then performed multivariate Cox regression analysis for only those genes to identify independent genes associated with OS and PFS in GBM patients.
Linear regression analysis using R was performed to visualize associations between age and gene expressions of 12 selected genes and gene expression and ln(IC50) values for antitumor agents in 49 GBM cell lines. Regression lines and a line determined by locally weighted scatter plot smoothing (LOWESS) were used to visualize the association between age and expression of the 12 selected genes (13).
A p-value < 0.05 was considered statistically significant. All statistical analyses were performed using R software version 4.1.2 and SPSS for Windows version 24.0 (IBM, Chicago, IL).
Results
Characteristics of patients
Altogether, 525 patients with GBM from TCGA database were enrolled in the study. The mean patient age at diagnosis was 57.7 years, and 39.0% of patients were female. A total of 435 (82.9%) patients had received radiation treatment, and 39.0% of the patients received adjuvant chemotherapy and/or immunotherapy. The mean CD8+ T cell fraction in GBM tissues was 0.022; further detailed information is shown in Table 1.
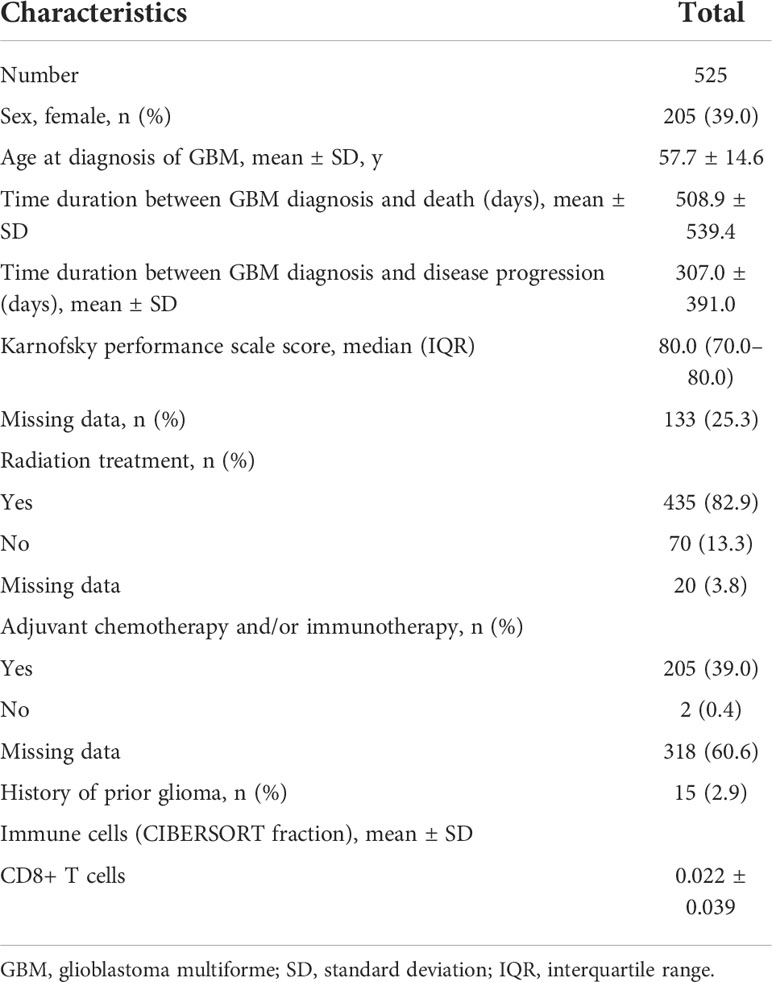
Table 1 Clinical characteristics of the study patients with GBM.
Identification of genes from the 10 oncogenic signaling pathways associated with both OS and PFS in GBM patients
Table 2 shows all the genes, classified by each 10 oncogenic signaling pathway, that were significantly associated with both OS and PFS in Kaplan-Meier survival analysis with log-rank test. When we performed multivariate Cox regression analysis, we found 12 such independent genes from the 10 oncogenic signaling pathways. The identified 12 significant genes were (1): E2F transcription factor 2 (E2F2) (tertile 2 vs. tertile 1, OS: hazard ratio (HR), 0.74; p = 0.032; PFS: HR, 0.75; p = 0.034) from the cell cycle signaling pathway (2), C-terminal binding protein 2 (CTBP2) (tertile 3 vs. tertile 1, OS: HR, 0.69; p = 0.010; PFS: HR, 0.74; p = 0.032) from the Notch signaling pathway (3), MAF bZIP transcription factor F (MAFF) (tertile 1 vs. tertile 3, OS: HR, 0.74; p = 0.036; PFS: HR, 0.64; p = 0.002) from the Nrf2 signaling pathway (4), solute carrier family 2 member 3 (SLC2A3) (tertile 1 vs. tertile 3, OS: HR, 0.75; p = 0.037; PFS: HR, 0.71; p = 0.012) from the Nrf2 signaling pathway (5), evolutionarily conserved signaling intermediate in Toll pathways (ECSIT) (tertile 2 vs. tertile 3, OS: HR, 1.69; p < 0.001; PFS: HR, 1.41; p = 0.016) from the PI3K signaling pathway (6), heat shock protein 90 kDa beta member 1 (HSP90B1) (tertile 1 vs. tertile 3, OS: HR, 0.74; p < 0.034; PFS: HR, 0.57; p < 0.001) from the PI3K signaling pathway (7), tumor necrosis factor receptor superfamily member 1A (TNFRSF1A) (tertile 1 vs. tertile 3, OS: HR, 0.75; p < 0.041; PFS: HR, 0.63; p = 0.001) from the PI3K signaling pathway (8), p21 activated kinase 1 (PAK1) (tertile 1 vs. tertile 3, OS: HR, 0.60; p = 0.001; PFS: HR, 0.75; p = 0.044) from the RTK signaling pathway (9), inhibitor of DNA binding 4 (ID4) (tertile 2 vs. tertile 1, OS: HR, 1.53; p = 0.002; PFS: HR, 1.41; p = 0.009) from the TGF-β signaling pathway (10), damage-specific DNA-binding protein 2 (DDB2) (tertile 1 vs. tertile 3, OS: HR, 0.73; p = 0.031; PFS: HR, 0.72; p = 0.024) from the P53 signaling pathway (11), mouse double minute 2 homolog (MDM2) (tertile 1 vs. tertile 3, OS: HR, 0.68; p = 0.006; PFS: HR, 0.63; p = 0.001) from the p53 signaling and cell cycle pathways, and (12) dickkopf-3 (DKK3) (tertile 1 vs. tertile 3, OS: HR, 0.73; p = 0.031; PFS: HR, 0.75; p = 0.044) from the Wnt/β-catenin signaling pathway (Table 2). When we examined the relationship between age and the expression of the 12 selected genes, we found that the expression of E2F2 and CTBP2 decreased slightly with age in GBM patients (Supplementary Figure 1). In contrast, the expression of MAFF, SLC2A3, TNFRSF1A, DDB2, and DKK3 gradually increased with age (Supplementary Figures 1, 2). However, as shown above, when we adjusted all variables including age in the multivariate analysis, the significant associations between the 12 selected genes and both OS and PFS were maintained in patients with GBM. In addition, we identified the differences between the radiation treatment population and the adjuvant chemotherapy and/or immunotherapy population on the basis of expression of the 12 selected genes in patients with GBM (Supplementary Table 1). There were significant differences in the expression of MAFF and ECSIT in the adjuvant chemotherapy and/or immunotherapy populations. Moreover, even when factors like radiation treatment and chemotherapy were adjusted, MAFF and ECSIT still showed significant correlations with both OS and PFS in GBM patients. We also present the Kaplan-Meier survival curves for OS and PFS in GBM patients according to the tertile groups of gene expression of the 12 significant genes in Figure 1.
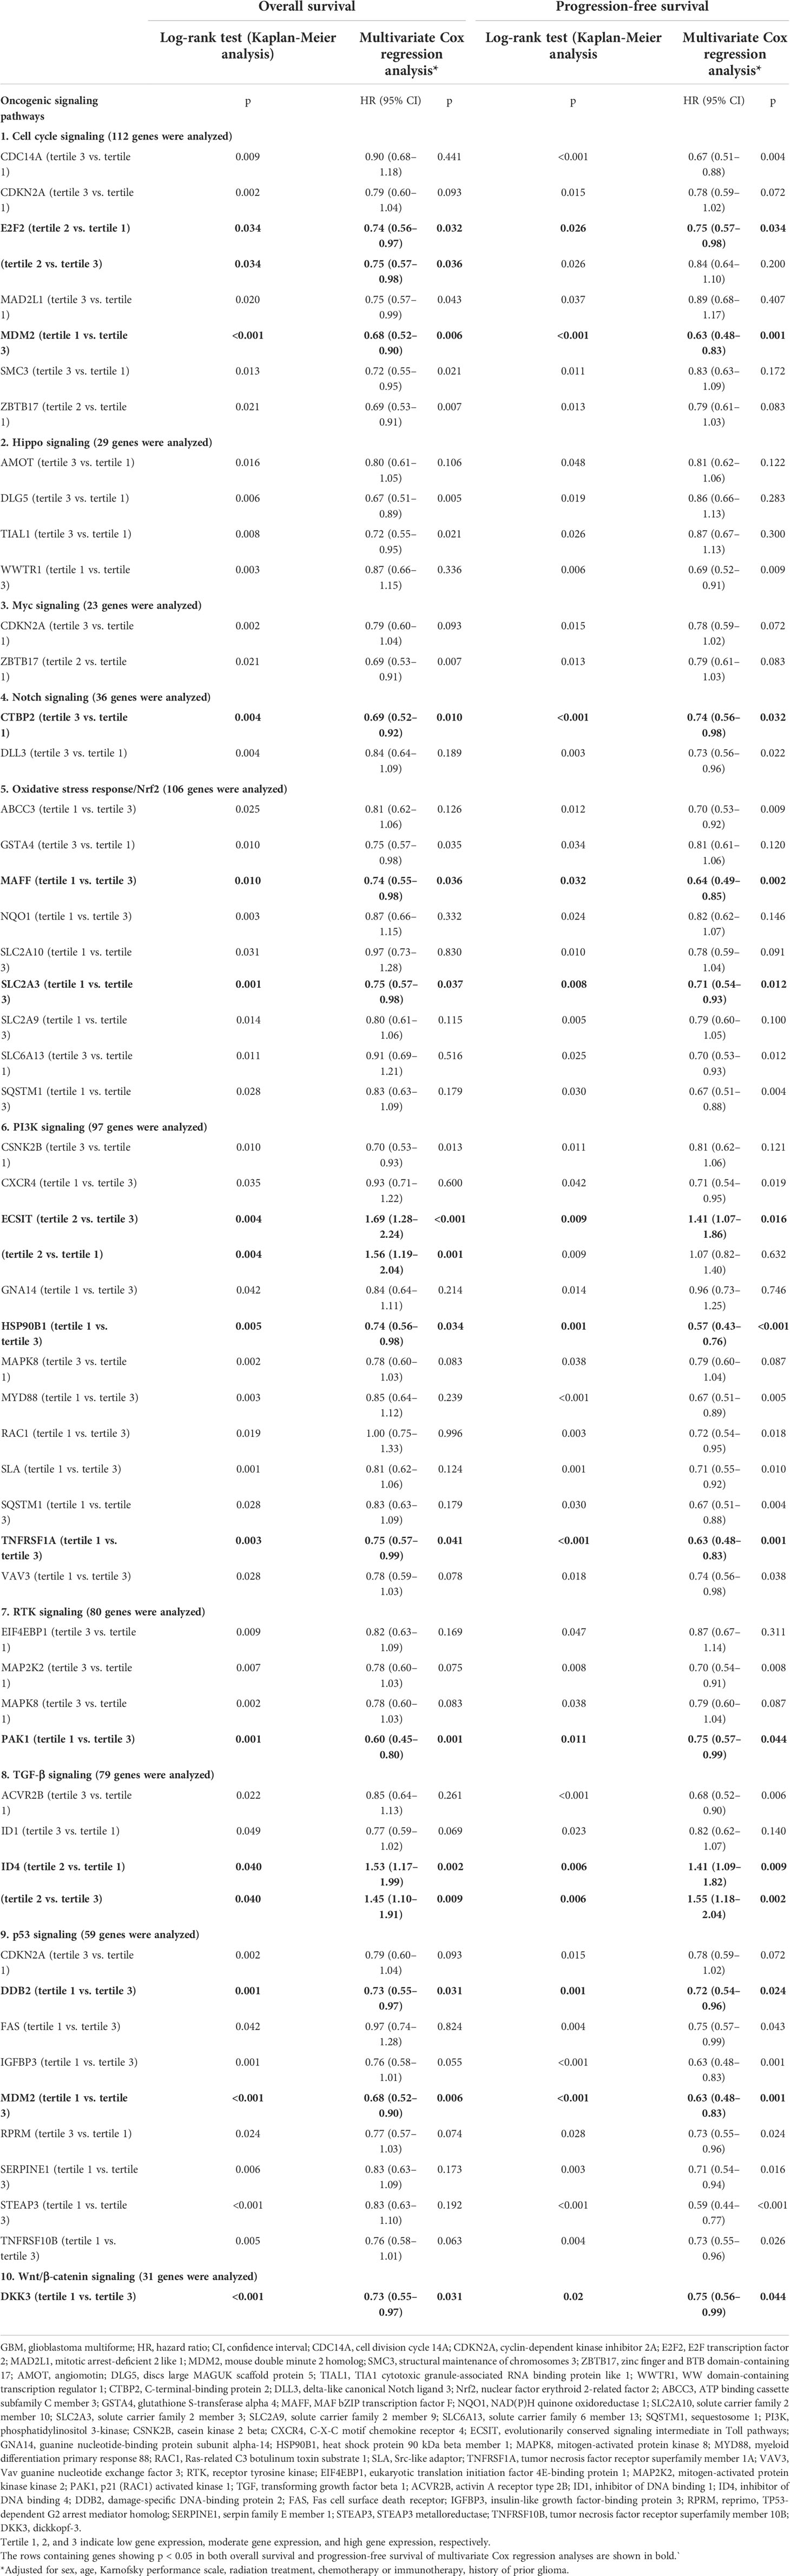
Table 2 Multivariate Cox analyses of genes significantly associated with overall survival and progression-free survival in GBM patients related to 10 oncogenic signaling pathways.
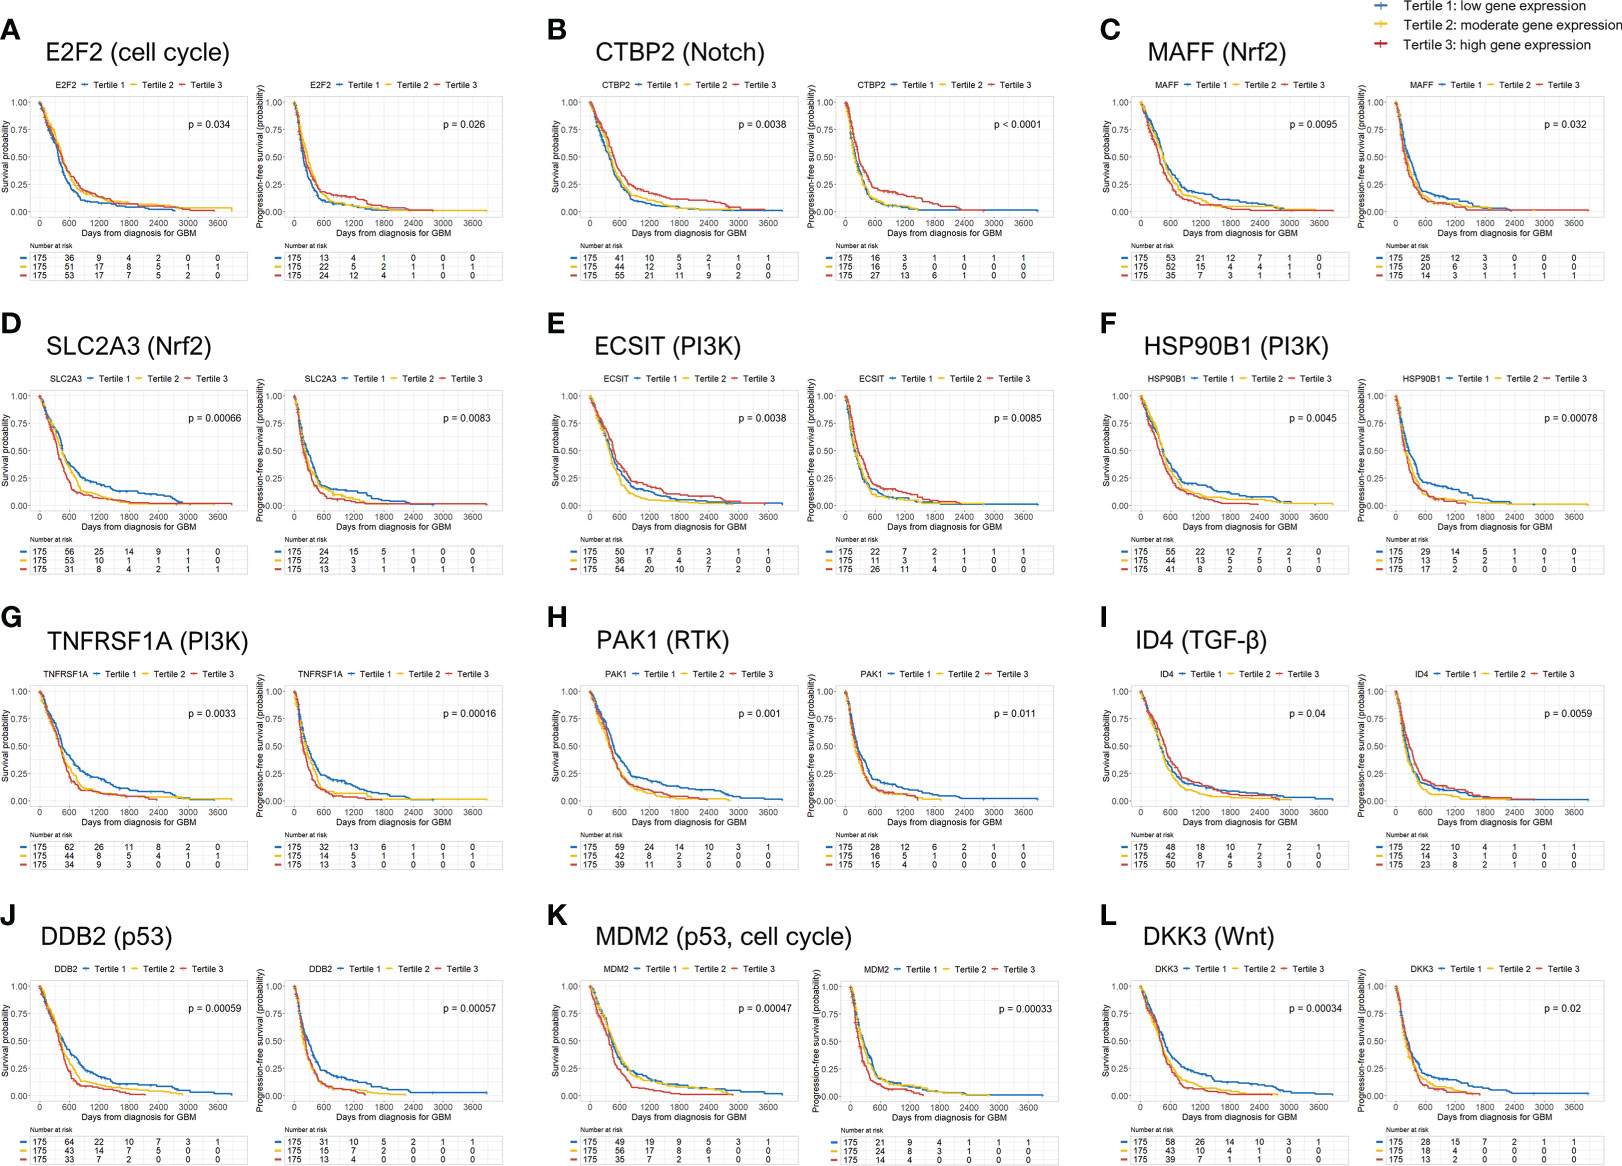
Figure 1 Overall survival (OS) and progression-free survival (PFS) rates according to 12 genes significantly associated with mortality and disease progression in GBM patients. GBM, glioblastoma.
For 8 of the above-mentioned genes—MAFF, SLC2A3, HSP90B1, TNFRSF1A, PAK1, DDB2, MDM2, and DKK3—being in the first tertile of gene expression was an independent predictor of better OS and PFS in GBM patients compared to the third tertile. Thus, higher expression of the above 8 genes was significantly associated with a higher risk of mortality and disease progression than the lower expression of those genes. In contrast, higher CTBP2 gene expression was significantly associated with better OS and PFS in GBM patients. However, E2F2 gene expression in the second tertile was associated with better OS and PFS than the genes in the first tertile in GBM patients. Moreover, the E2F2 expression in the second tertile of gene expression was associated with better OS than the genes in the highest tertile. In contrast, the second tertile of gene expression of ECSIT was associated with poor OS and PFS compared to those in the third tertile and poor OS compared to those in the first tertile. ID4 expression in the second tertile was also associated with poor OS and PFS compared to the genes whose expression was in the first and third tertiles. Therefore, moderate E2F2 gene expression and high or low ECSIT and ID4 gene expression was associated with a lower risk of mortality and disease progression in patients with GBM (except for disease progression at moderate E2F2 expression compared with high E2F2 expression and low ECSIT expression) (Table 3).
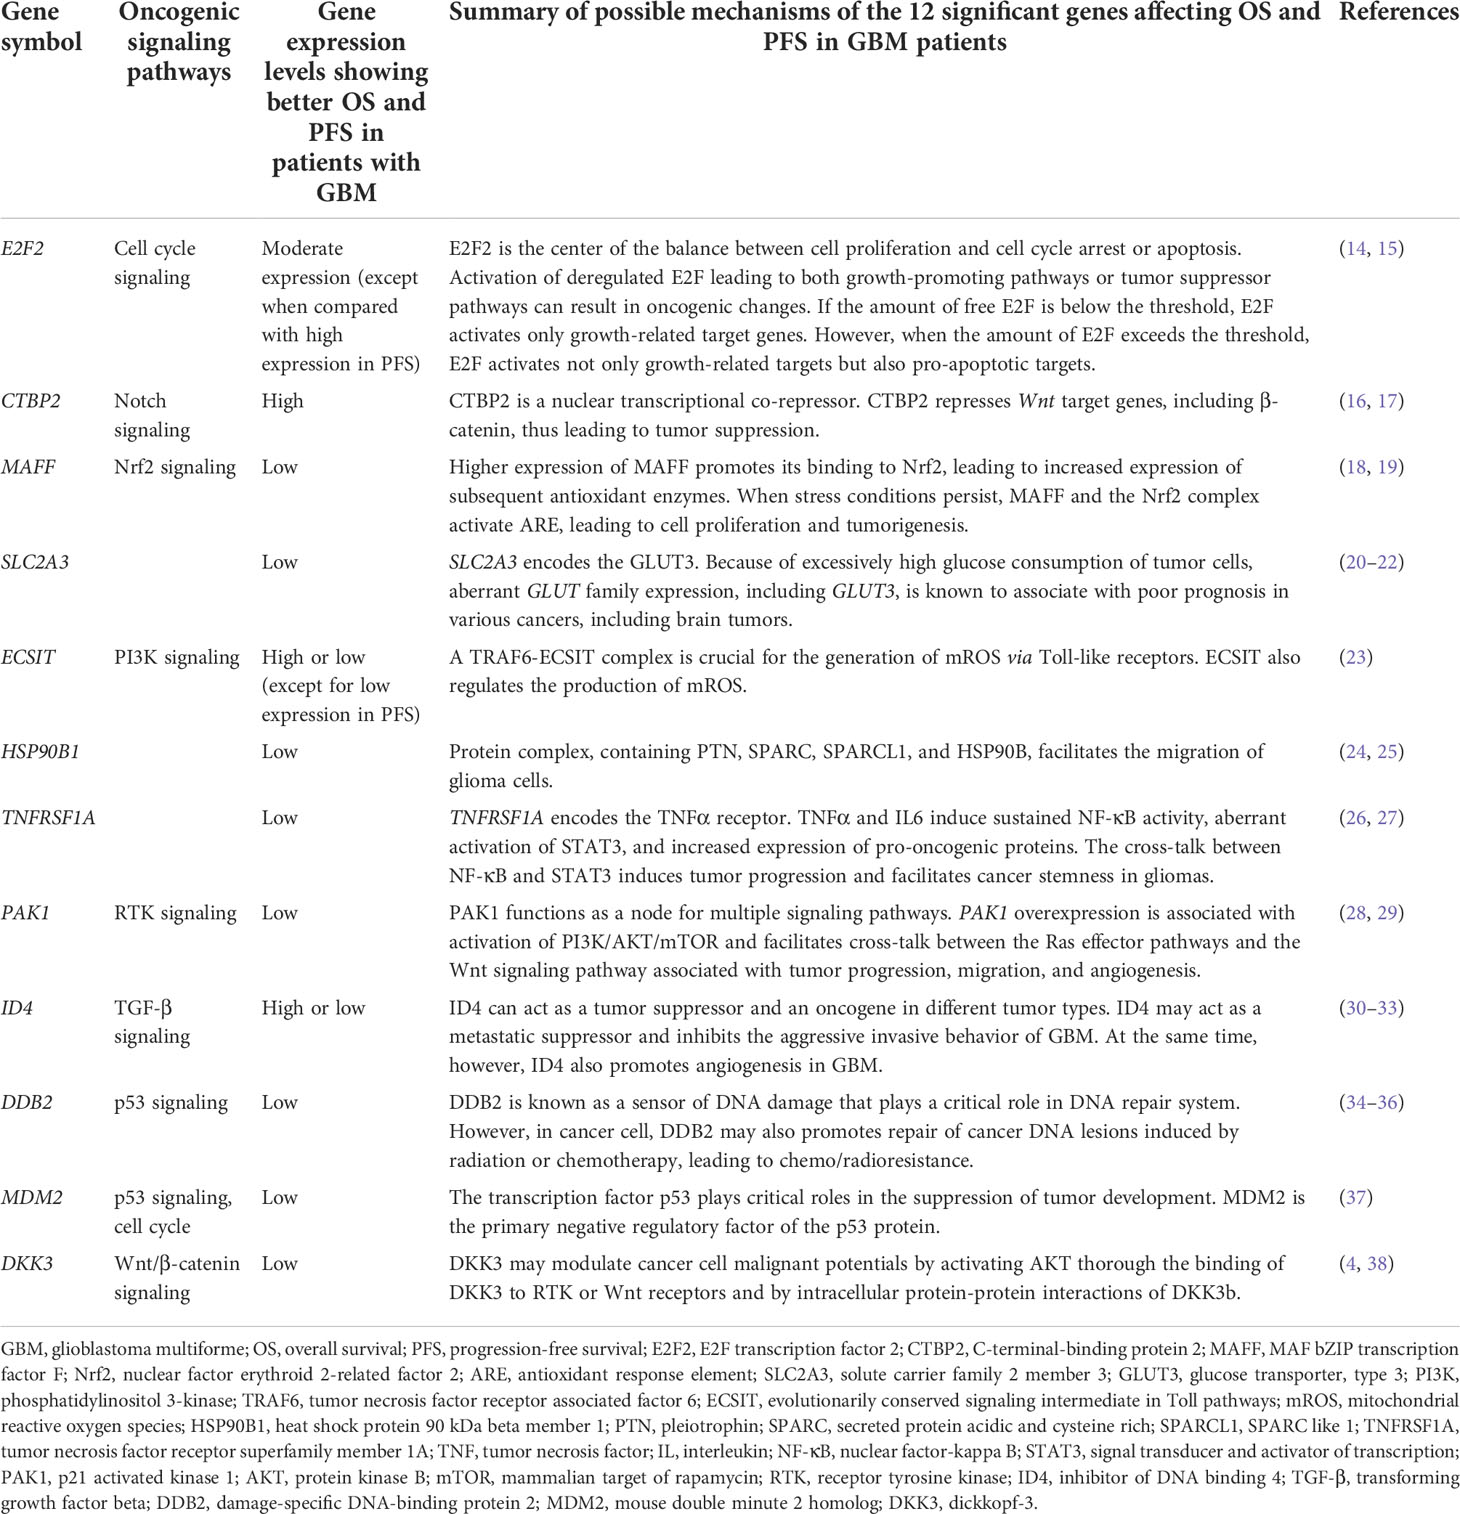
Table 3 Detailed information of the 12 genes from the 10 oncogenic signaling pathways, which are significantly associated with overall survival and progression-free survival in patients with GBM.
Possible mechanisms of the 12 genes affecting OS and PFS in GBM patients
Based on our study findings, we show schematic illustrations of the possible roles of the 12 significant genes in GBM in Figure 2. We also present a table summarizing our findings and possible mechanisms of the 12 significant genes affecting OS and PFS in GBM patients (Table 3).
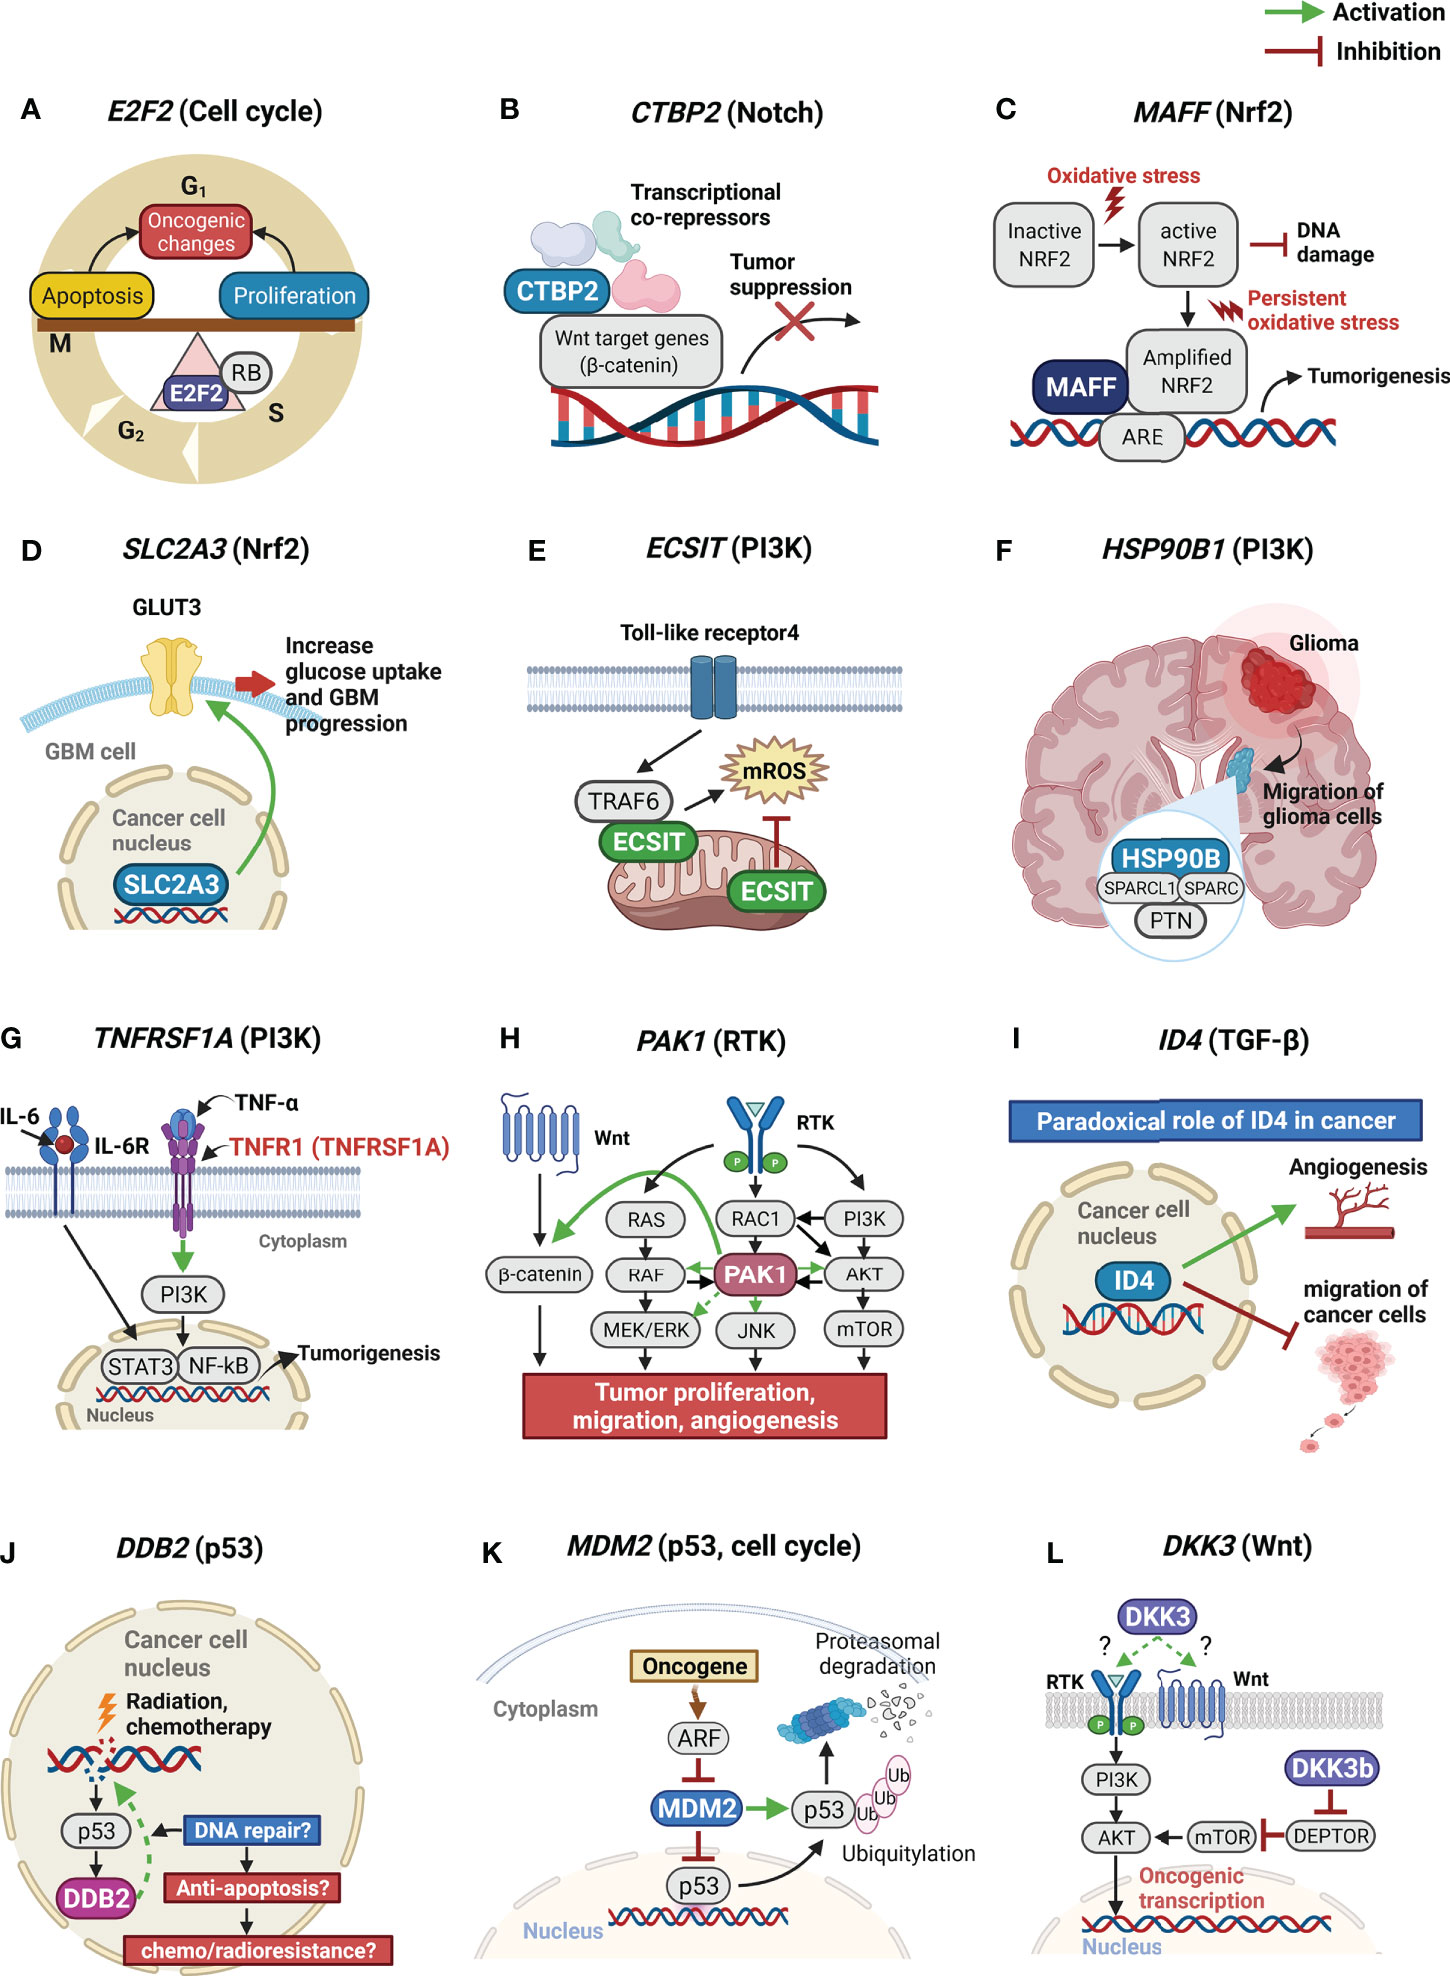
Figure 2 Schematic illustrations of possible roles of the 12 significant genes in GBM. GBM, glioblastoma. (A) E2F2 is the center of the balance between cell proliferation and cell cycle arrest or apoptosis; (B) CTBP2 is a nuclear transcriptional co-repressor. CTBP2 represses Wnt target genes leading to tumor suppression; (C) Higher expression of MAFF promotes its binding to Nrf2. When stress conditions persist, MAFF and the Nrf2 complex activate ARE, leading to tumorigenesis; (D) SLC2A3 encodes the GLUT3. Because of excessively high glucose consumption of tumor cells, aberrant GLUT3 expression is known to associate with poor prognosis in brain tumors; (E) A TRAF6-ECSIT complex is crucial for the generation of mROS. ECSIT also regulates the production of mROS; (F) Protein complex, containing PTN, SPARC, SPARCL1, and HSP90B, facilitates the migration of glioma cells; (G) TNFRSF1A encodes the TNFα receptor. TNFα and IL6 induce sustained NF-κB activity, aberrant activation of STAT3, and increased expression of pro-oncogenic proteins; (H) PAK1 functions as a node for multiple signaling pathways. PAK1 overexpression is associated with activation of PI3K/AKT/mTOR and facilitates cross-talk between the Ras effector pathways and the Wnt signaling pathway associated with tumor progression, migration, and angiogenesis; (I) ID4 can act as a tumor suppressor and an oncogene in different tumor types. ID4 may act as a migration suppressor of GBM. At the same time, however, ID4 also promotes angiogenesis in GBM. (J) DDB2 plays a critical role in DNA repair system. However, in cancer cell, DDB2 may also promotes repair of cancer DNA lesions induced by radiation or chemotherapy, leading to chemo/radioresistance. (K) MDM2 is the primary negative regulatory factor of the p53 protein; (L) DKK3 may modulate cancer cell malignant potentials by activating AKT thorough the binding of DKK3 to RTK or Wnt receptors and by intracellular protein-protein interactions of DKK3b. GBM, glioblastoma multiforme; E2F2, E2F transcription factor 2; CTBP2, C-terminal-binding protein 2; MAFF, MAF bZIP transcription factor F; Nrf2, nuclear factor erythroid 2-related factor 2; ARE, antioxidant response element; SLC2A3, solute carrier family 2 member 3; GLUT3, glucose transporter, type 3; TRAF6, tumor necrosis factor receptor associated factor 6; ECSIT, evolutionarily conserved signaling intermediate in Toll pathways; mROS, mitochondrial reactive oxygen species; PTN, pleiotrophin; SPARC, secreted protein acidic and cysteine rich; SPARCL1, SPARC like 1; HSP90B1, heat shock protein 90 kDa beta member 1; TNFRSF1A, tumor necrosis factor receptor superfamily member 1A; TNF, tumor necrosis factor; IL, interleukin; NF-κB, nuclear factor-kappa B; STAT3, signal transducer and activator of transcription; PAK1, p21 activated kinase 1; PI3K, phosphatidylinositol 3-kinase; AKT, protein kinase B; mTOR, mammalian target of rapamycin; ID4, inhibitor of DNA binding 4; DDB2, damage-specific DNA-binding protein 2; MDM2, mouse double minute 2 homolog; DKK3, dickkopf-3; RTK, receptor tyrosine kinase.
Correlations between the expression of the 12 genes and between the expression of the 12 genes and CD8+ T cells in GBM tissues
When we estimated the correlations between the mRNA expression of the 12 above-mentioned genes, we observed that the 12 genes are largely divided into three clusters according to the significance of the correlation between the expression of these genes (Figures 3A, B). Clusters 2 and 3 were again divided into two sub-clusters based on the significance of the correlation between the expression of the genes (Figures 3A, B). Sub-cluster 1 consists of PAK1, HSP90B1, DDB2, and SLC2A3; sub-cluster 2 consists of HSP90B1, DDB2, SLC2A3, MAFF, and TNFRSF1A; sub-cluster 3 consists of CTBP2, ID4, and ECSIT; and sub-cluster 4 consists of ID4, ECSIT, and DKK3. When we identified the correlations between gene expression outside the clusters or subclusters, we observed that E2F2 had negative correlations with all genes of sub-clusters 2, 3, and 4 (Figure 3C). In addition, the expression of both MDM2 and DKK3 showed positive correlations with DDB2 and SLC2A3 expression, while DKK3 expression also showed positive correlations with TNFRSF1A and MAFF expression. Other correlations between the expression of these genes are shown in Figure 3C. We then estimated the correlations between the expression of the 12 genes and CD8+ T cell fractions. The expression of most of the genes associated with poor prognosis in GBM such as PAK1, DDB2, SLC2A3, TNFRSF1A, MAFF, and DKK3 showed significant, negative correlations with CD8+ T immune cell infiltrations in GBM tissues (Figures 3A, D). We also observed positive correlations of CD8+ T-cell fractions with CTBP2 and E2F2 expression, which were associated with a better prognosis in GBM at high and moderate levels of expression, respectively (Figure 3D).
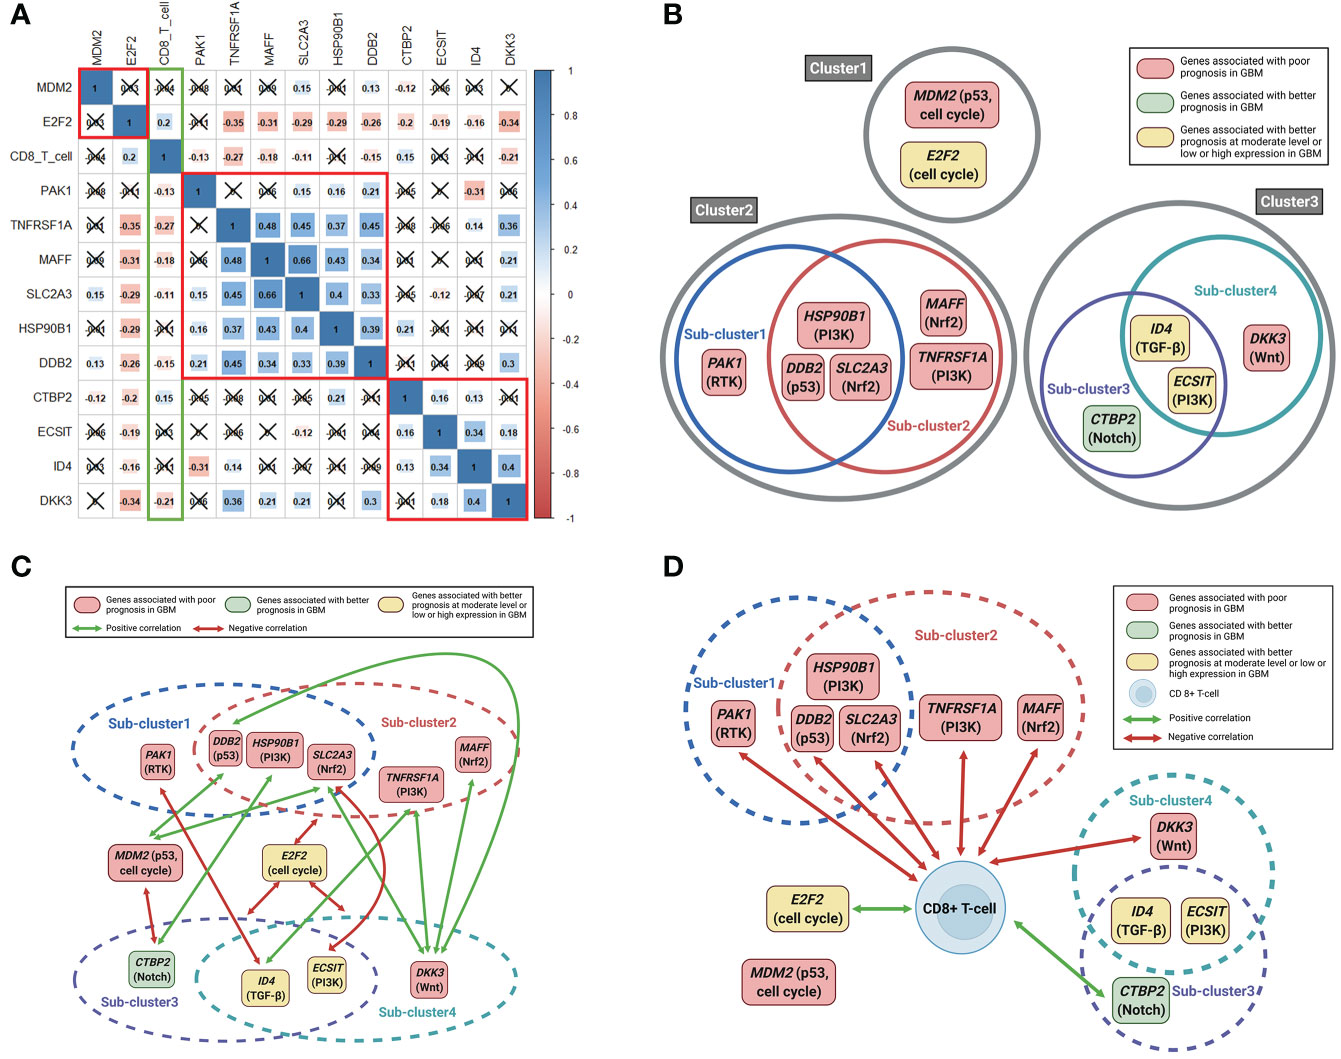
Figure 3 Correlation plots between 12 significant genes and between 12 significant genes and CD8+ T-cell fractions. Schematic illustrations of correlations between the 12 significant genes and between the 12 significant genes and CD8+ T-cell fractions. (A) Pearson correlation coefficients and significance levels were calculated between the 12 significant genes and between the 12 significant genes and CD8+ T-cell fractions. The color-coordinated legend indicates the value and sign of Pearson’s correlation coefficient. The number in the box indicates Pearson’s correlation coefficient. Moreover, an x in the box indicates a p value ≥ 0.001; (B) the 12 significant genes are largely classified into three clusters according to the significance of the correlation between mutual genes. Clusters 2 and 3 were again divided into two sub-clusters; (C) correlations between gene expression outside the clusters or subclusters; (D) correlations between the expression of the 12 significant genes and CD8+ T cell fractions.
Identification of antitumor agents for the suppression of genes related to poor prognosis in GBM patients
We evaluated the correlations and significance levels between gene expression and ln(IC50) values for 316 antitumor drugs in 49 GBM cell lines. A negative correlation between gene expression and the ln(IC50) value for an antitumor agent indicates that the antitumor agent effectively inhibits the expression of the corresponding gene. Therefore, we identified antitumor agents effective against the genes related to poor prognosis in GBM, showing negative correlations between gene expression and ln(IC50) values with p-values less than 0.05 (Table 4). Antitumor agents that effectively inhibited the expression of at least two identified significant genes in GBM cell lines were nutlin-3a, cabozantinib, fedratinib, NVP-BHG712, and MIM1 (Figure 4). Nutlin-3a effectively inhibited DDB2, TNFRSF1A, and MDM2 expression. In addition, cabozantinib, fedratinib, and NVP-BHG712 also effectively inhibited both TNFRSF1A and MDM2 expression, while MIM1 effectively blocked PAK1 and HSP90B1 expression (Figure 4).
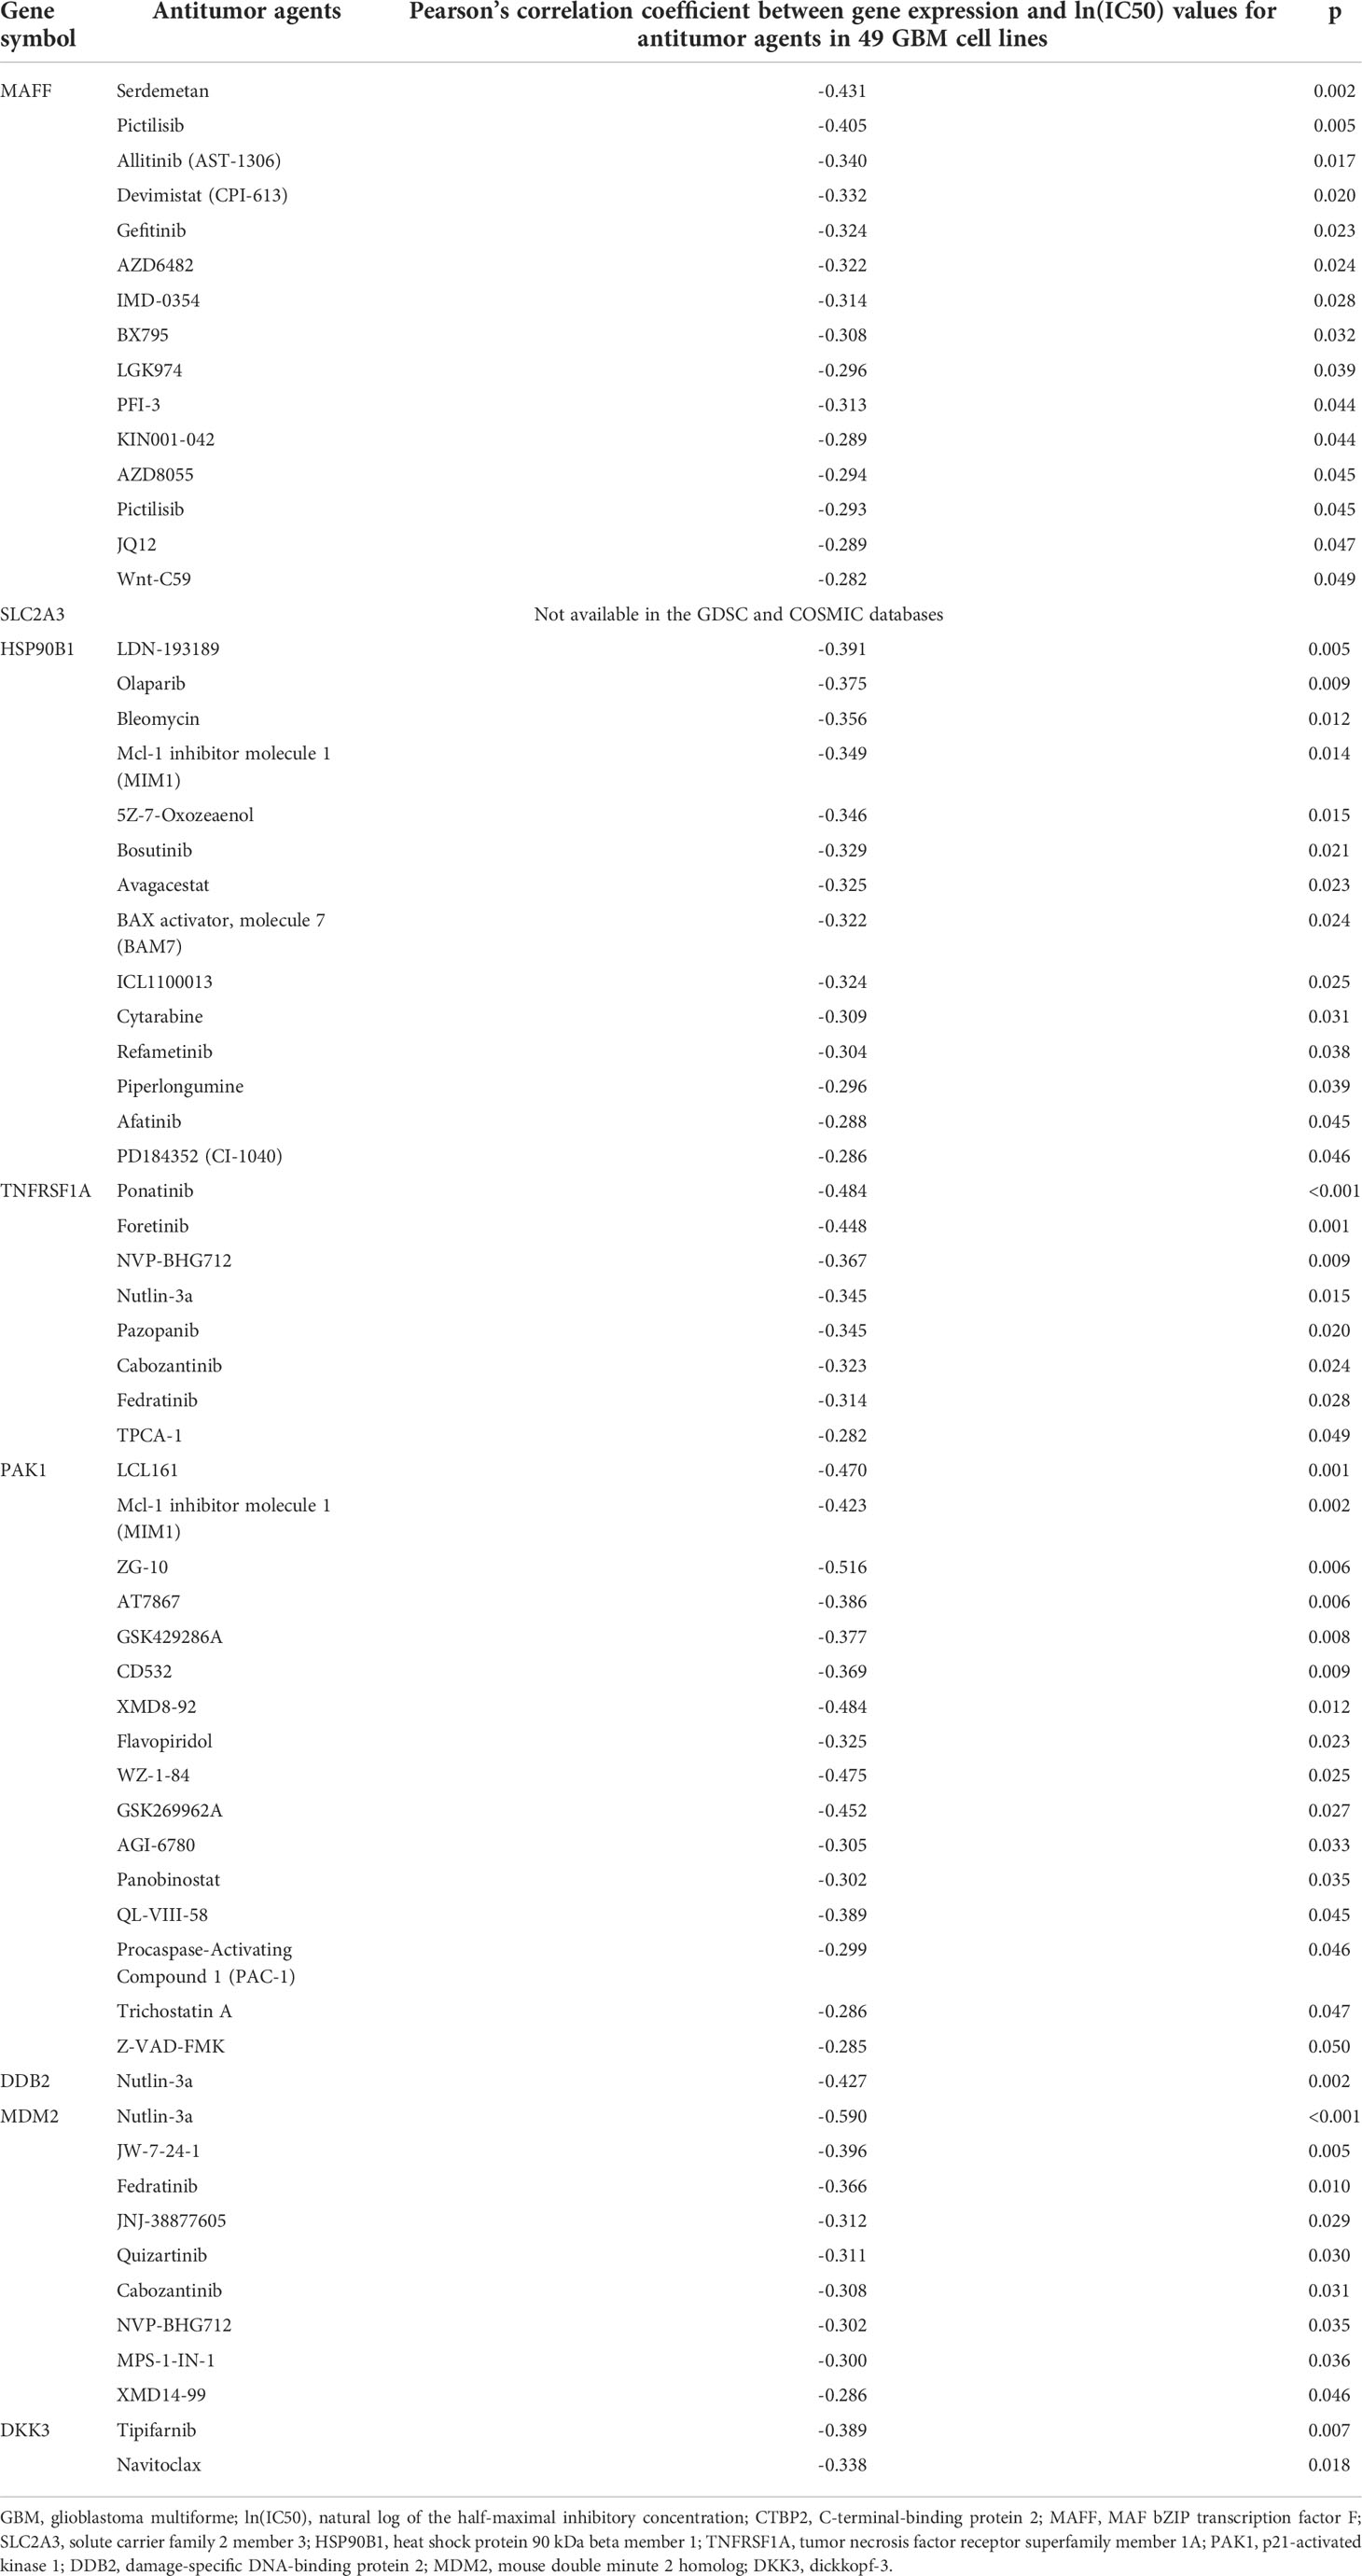
Table 4 Identification of antitumor agents for the genes significantly associated with poor prognosis in GBM.
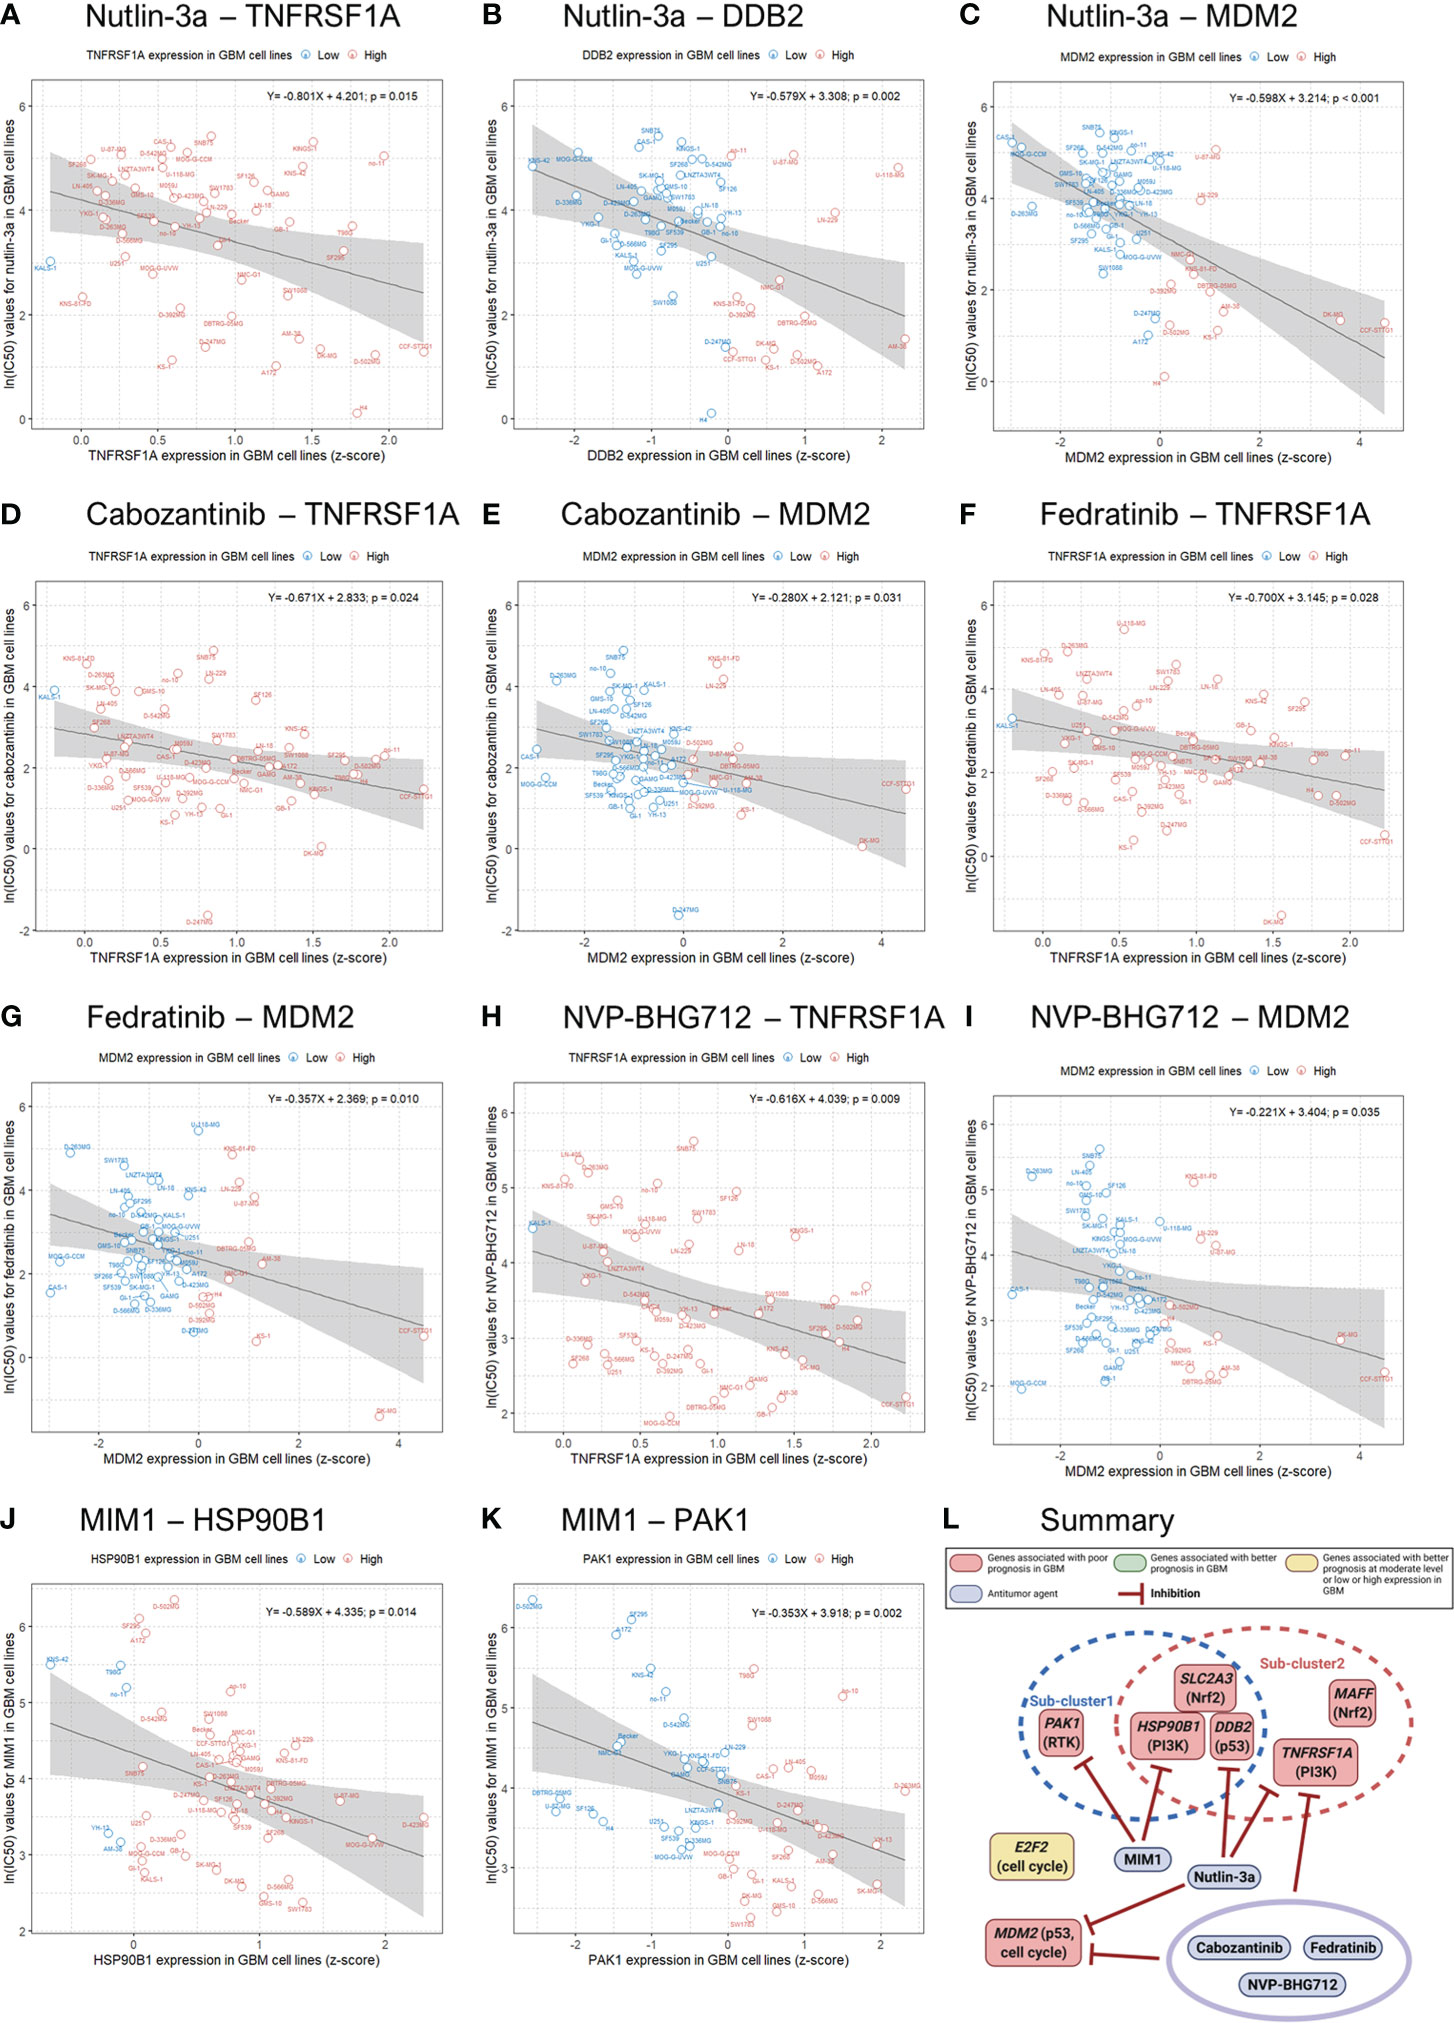
Figure 4 Genomics of Drug Sensitivity in Cancer (GDSC) database analysis and an illustration showing actions of antitumor agents on several significant genes associated with poor prognosis in GBM patients. Linear regression analysis shows associations between gene expression and the natural log of the half-maximal inhibitory concentration [ln(IC50)] values for antitumor agents in 49 GBM cell lines (blue, low gene expression; red, high gene expression).
Discussion
We recently used TCGA data to report that DKK3, a component of the Wnt/β-catenin signaling pathway, is associated with higher mortality, disease progression, and chemoresistance in patients with GBM (4). To expand the scope of our study, we identified genes whose expression was significantly associated with mortality and disease progression in GBM patients in TCGA from all genes belonging to well-known 10 canonical oncogenic pathways, including Wnt/β-catenin signaling (3). We then observed that there were 12 genes whose expression was significantly related to both mortality and disease progression in patients with GBM. These 12 genes were E2F2 (cell cycle signaling pathway), CTBP2 (Notch signaling), MAFF (Nrf2 signaling), SLC2A3 (Nrf2 signaling), ECSIT (PI3K signaling), HSP90B1 (PI3K signaling), TNFRSF1A (PI3K signaling), PAK1 (RTK signaling), ID4 (TGF-β signaling), DDB2 (p53 signaling), MDM2 (p53 and cell cycle signaling), and DKK3 (Wnt/β-catenin signaling). To the best of our knowledge, this study is the first to identify these 12 genes belonging to 10 oncogenic pathways that significantly affect both mortality and disease progression in GBM patients.
Considering the role of these 12 genes in cancer, we briefly suggest possible mechanisms affecting the prognosis of GBM as follows (1). E2F2 is known as the center of the balance between cell proliferation and apoptosis (14). As shown in Figure 3C of our study, E2F2 was negatively correlated with all 10 significant genes in subcluster 2-4 (except for PAK1 and MDM2). Therefore, we hypothesized that E2F2 may be a control tower regulating tumor aggressiveness in GBM. However, the activation of deregulated E2F leading to both growth-promoting pathways or tumor suppressor pathways can result in oncogenic changes (14). In addition, if the level of free E2F is below the threshold, E2F activates only growth-related target genes. When the level of E2F exceeds the threshold, E2F activates not only growth-related targets but also pro-apoptotic targets (14, 15). Therefore, we hypothesized that E2F2 must be maintained at appropriate levels to properly regulate cell proliferation and apoptosis. Any pathological increase or decrease in the E2F2 levels can adversely affect the prognosis of GBM (2). CTBP2 is known as a nuclear transcriptional co-repressor, repressing Wnt target genes and thus leading to tumor suppression (16, 17). According to Figures 3C, D CTBP2 expression is negatively correlated with MDM2 expression, which is the primary negative regulatory factor of p53, but is positively associated with CD8+ T-cell fractions. Therefore, we believe that high CTBP2 expression is associated with a better prognosis in GBM (3). MAFF binds to Nrf2 and leads to the increased expression of subsequent antioxidant enzymes. When stress conditions persist, MAFF and the Nrf2 complex activate the antioxidant response element (ARE), leading to cell proliferation and tumorigenesis (18, 19) (4). SLC2A3 encodes the glucose transporter 3 (GLUT3) (20). Because of the excessively high glucose consumption of brain tumor cells, GLUT3 is associated with a poor prognosis in GBM (20–22) (5). ECSIT forms a complex with TRAF6 in mitochondria to generate mitochondrial reactive oxygen species (mROS). However, ECSIT also inhibits mROS in mitochondria (23). Therefore, ECSIT performs two seemingly contradictory roles in mitochondria. Although the exact mechanism is unknown, according to our results, the prognosis of GBM was better when ECSIT expression was increased or decreased than moderate level (6). It is known that the protein complex of HSP90B with PTN, SPARC, and SPARCL1 facilitates the migration of glioma cells (7, 24, 25). TNFRSF1A encodes the TNFα receptor (39). TNFα and IL6 induce sustained NF-κB activity and aberrant activation of STAT3. The cross-talk between NF-κB and STAT3 induces tumor progression and facilitates cancer stemness in gliomas (8, 26, 27). PAK1 functions as a node for multiple signaling pathways. PAK1 overexpression is associated with the activation of the PI3K/AKT/mTOR signaling pathway (28). In addition, PAK1 facilitates the cross-talk between the Ras effector pathways and the Wnt signaling pathway that are associated with tumor progression, migration, and angiogenesis (29). Therefore, we believe that the increase of interactions of PAK1 with multiple oncogenic signaling pathways adversely affects the prognosis of patients with GBM in this study (9). ID4 has a paradoxical role in cancer. ID4 may act as a metastatic suppressor and inhibit the aggressive invasive behavior of GBM (30, 31). At the same time, however, ID4 also promotes angiogenesis in GBM (32, 33). We believe that this paradoxical role of ID4 might be associated with a better prognosis in GBM patients when ID4 expression was high or low than moderate level in our study (10). DDB2 is known as a sensor of DNA damage that plays a critical role in the DNA repair system. However, DDB2 is reported to have dual functions in cancer, sometimes with tumor suppressive properties and sometimes functioning as an oncogene (34). In cancer cells, DDB2 may also promote the repair of cancer DNA lesions induced by radiation or chemotherapy leading to chemo/radioresistance (34–36) (11). The transcription factor p53 plays critical roles in the suppression of tumor development, and MDM2 is the primary negative regulatory factor of p53 (37). Therefore, we believe that MDM2 was significantly associated with a poor prognosis in GBM patients in this study (12). DKK3 may be associated with GBM aggressiveness by activating AKT through the binding of DKK3 to RTK or Wnt receptors and by intracellular protein-protein interactions of DKK3b (4, 38). According to Figure 3C, DKK3 expression was positively correlated with the expression of genes associated with a poor prognosis in GBM such as DDB2, SLC2A3, TNFRSF1A, and MAFF. We recently reported that DKK3 expression is associated with GBM immunosuppression (4). In this study, we also observed that the expression of six of the genes significantly associated with a poor prognosis of GBM, showed negative correlations with CD8+ T-cell fractions in GBM tissue (Figure 3D). The immunosuppressive tumor microenvironment of GBM is known to lead to a poor prognosis in patients with GBM (40). It is noteworthy that most of the genes associated with a poor prognosis of GBM in this study, were also related to immunosuppressive conditions in GBM.
We used GDSC data to investigate drug sensitivity in 49 GBM cell lines according to the several genes significantly associated with a poor prognosis in GBM. Although, there were many antitumor agents inhibiting the expression of these genes, nutlin-3a, cabozantinib, fedratinib, NVP-BHG712, and Mcl-1 inhibitor molecule 1 (MIM1) effectively and concurrently inhibited the expression of at least two significant genes in GBM cell lines. Nutlin-3a, cabozantinib, fedratinib, and NVP-BHG712 effectively blocked the expression of both TNFRSF1A and MDM2 in GBM cell lines. To our knowledge, nutlin-3a and cabozantinib have been reported to be effective against GBM, but there have been no reports of the efficacy of fedratinib and NVP-BHG712 against GBM (41, 42). Meanwhile, MIM1 effectively blocked HSP90B1 and PAK1 expression in GBM cell lines. Previously, MIM1 was reported to induce apoptosis and sensitize GBM cells to alkylating agents (43). Unfortunately, we were not able to identify drugs that inhibit SLC2A3 expression because there was no information on SLC2A3 expression in 49 GBM cell lines in the GDSC and COSMIC databases. We also expect to develop antitumor agents that simultaneously block the expression of more genes related to the poor prognosis of GBM.
Our study has some limitations. First, as this study is retrospective in nature and based on TCGA data, further prospective studies are needed to validate the results. However, because we used TCGA public data, researchers can check and verify our results. Second, there were no experimental analyses to investigate the relationships between the 12 above-mentioned genes and GBM cells, and further in vitro and/or in vivo studies are necessary. Third, missing data and gene sets associated with 10 oncogenic signaling pathways that were not available in TCGA data may affect the results of statistical analysis in the study. Last, the relationships between significant genes and mortality and disease progression classified by GBM molecular subtypes were not analyzed.
In conclusion, despite these limitations, we used a large-scale, open database to identify 12 genes whose expression was significantly related to mortality and disease progression of GBM among genes belonging to 10 well-known oncogenic canonical pathways. We present the possible mechanisms by which these 12 genes affect both mortality and disease progression of GBM. We also identified that most of these genes were related to immunosuppressive conditions in GBM. Nutlin-3a, cabozantinib, fedratinib, NVP-BHG712, and MIM1 effectively and concurrently inhibited the expression of at least two of these genes in GBM cell lines. We believe that our findings will contribute to improve the understanding of the mechanisms underlying GBM pathophysiology and help develop treatments for patients with GBM in the future.
Data availability statement
The datasets presented in this study can be found in online repositories. The names of the repository/repositories and accession number(s) can be found in the article/Supplementary Material.
Author contributions
Conception and design: MHH. Data acquisition: MHH, KWM. Data analysis/interpretation: MHH. Visualization: MHH. Supervision and critical review of the manuscript: All. Final approval of submission: All.
Funding
Y-KN was partly supported by NRF/MSIT (No. 2018R1A5A7059549, 2021M3E5D2A01019545), IITP/MSIT Artifcial Intelligence Graduate School Program for Hanyang University (2020-0-01373).
Acknowledgments
Illustrations created with BioRender.
Conflict of interest
The authors declare that the research was conducted in the absence of any commercial or financial relationships that could be construed as a potential conflict of interest.
Publisher’s note
All claims expressed in this article are solely those of the authors and do not necessarily represent those of their affiliated organizations, or those of the publisher, the editors and the reviewers. Any product that may be evaluated in this article, or claim that may be made by its manufacturer, is not guaranteed or endorsed by the publisher.
Supplementary material
The Supplementary Material for this article can be found online at: https://www.frontiersin.org/articles/10.3389/fonc.2022.965638/full#supplementary-material
References
1. Hanif F, Muzaffar K, Perveen K, Malhi SM, Simjee SU. Glioblastoma multiforme: A review of its epidemiology and pathogenesis through clinical presentation and treatment. Asian Pac J Cancer Prev APJCP (2017) 18:3–9. doi: 10.22034/APJCP.2017.18.1.3
2. Weinstein JN, Collisson EA, Mills GB, Shaw KRM, Ozenberger BA, Ellrott K, et al. The cancer genome atlas pan-cancer analysis project. Nat Genet (2013) 45:1113–20. doi: 10.1038/ng.2764
3. Sanchez-Vega F, Mina M, Armenia J, Chatila WK, Luna A, La KC, et al. Oncogenic signaling pathways in the cancer genome atlas. Cell (2018) 173:321–37.e10. doi: 10.1016/j.cell.2018.03.035
4. Han M-H, Min K-W, Noh Y-K, Kim JM, Cheong JH, Ryu JI, et al. High DKK3 expression related to immunosuppression was associated with poor prognosis in glioblastoma: Machine learning approach. Cancer Immunol Immunother CII (2022). doi: 10.1007/s00262-022-03222-4
5. Subramanian A, Tamayo P, Mootha VK, Mukherjee S, Ebert BL, Gillette MA, et al. Gene set enrichment analysis: A knowledge-based approach for interpreting genome-wide expression profiles. Proc Natl Acad Sci (2005) 102:15545–50. doi: 10.1073/pnas.0506580102
6. Newman AM, Liu CL, Green MR, Gentles AJ, Feng W, Xu Y, et al. Robust enumeration of cell subsets from tissue expression profiles. Nat Methods (2015) 12:453–7. doi: 10.1038/nmeth.3337
7. Maimela NR, Liu S, Zhang Y. Fates of CD8+ T cells in tumor microenvironment. Comput Struct Biotechnol J (2019) 17:1–13. doi: 10.1016/j.csbj.2018.11.004
8. van der Leun AM, Thommen DS, Schumacher TN. CD8+ T cell states in human cancer: insights from single-cell analysis. Nat Rev Cancer (2020) 20:218–32. doi: 10.1038/s41568-019-0235-4
9. Yang W, Soares J, Greninger P, Edelman EJ, Lightfoot H, Forbes S, et al. Genomics of drug sensitivity in cancer (GDSC): A resource for therapeutic biomarker discovery in cancer cells. Nucleic Acids Res (2013) 41:D955–961. doi: 10.1093/nar/gks1111
10. Tate JG, Bamford S, Jubb HC, Sondka Z, Beare DM, Bindal N, et al. COSMIC: the catalogue of somatic mutations in cancer. Nucleic Acids Res (2019) 47:D941–7. doi: 10.1093/nar/gky1015
11. Kim HS, Kim MG, Min K-W, Jung US, Kim D-H. High MMP-11 expression associated with low CD8+ T cells decreases the survival rate in patients with breast cancer. PLoS One (2021) 16:e0252052. doi: 10.1371/journal.pone.0252052
12. Cho K, Choi E-S, Kim J-H, Son J-W, Kim E. Numerical learning of deep features from drug-exposed cell images to calculate IC50 without staining. Sci Rep (2022) 12:6610. doi: 10.1038/s41598-022-10643-9
13. Cleveland WS, Devlin SJ. Locally weighted regression: An approach to regression analysis by local fitting. J Am Stat Assoc (1988) 83:596–610. doi: 10.1080/01621459.1988.10478639
14. Ozono E, Yamaoka S, Ohtani K. To grow, stop or die? – novel tumor-suppressive mechanism regulated by the transcription factor E2F. IntechOpen (2013). doi: 10.5772/54510
15. Trimarchi JM, Lees JA. Sibling rivalry in the E2F family. Nat Rev Mol Cell Biol (2002) 3:11–20. doi: 10.1038/nrm714
16. Kim TW, Kwak S, Shin J, Kang B-H, Lee S-E, Suh MY, et al. Ctbp2-mediated β-catenin regulation is required for exit from pluripotency. Exp Mol Med (2017) 49:e385–5. doi: 10.1038/emm.2017.147
17. Chinnadurai G. CtBP, an unconventional transcriptional corepressor in development and oncogenesis. Mol Cell (2002) 9:213–24. doi: 10.1016/s1097-2765(02)00443-4
18. Telkoparan-Akillilar P, Suzen S, Saso L. Pharmacological applications of Nrf2 inhibitors as potential antineoplastic drugs. Int J Mol Sci (2019) 20:E2025. doi: 10.3390/ijms20082025
19. Geismann C, Arlt A, Sebens S, Schäfer H. Cytoprotection “gone astray”: Nrf2 and its role in cancer. OncoTarg Ther (2014) 7:1497–518. doi: 10.2147/OTT.S36624
20. Cosset É, Ilmjärv S, Dutoit V, Elliott K, von Schalscha T, Camargo MF, et al. Glut3 addiction is a druggable vulnerability for a molecularly defined subpopulation of glioblastoma. Cancer Cell (2017) 32:856–68.e5. doi: 10.1016/j.ccell.2017.10.016
21. Wang Y, Wu S, Huang C, Li Y, Zhao H, Kasim V. Yin yang 1 promotes the warburg effect and tumorigenesis via glucose transporter GLUT3. Cancer Sci (2018) 109:2423–34. doi: 10.1111/cas.13662
22. Flavahan WA, Wu Q, Hitomi M, Rahim N, Kim Y, Sloan AE, et al. Brain tumor initiating cells adapt to restricted nutrition through preferential glucose uptake. Nat Neurosci (2013) 16:1373–82. doi: 10.1038/nn.3510
23. Carneiro FRG, Lepelley A, Seeley JJ, Hayden MS, Ghosh S. An essential role for ECSIT in mitochondrial complex I assembly and mitophagy in macrophages. Cell Rep (2018) 22:2654–66. doi: 10.1016/j.celrep.2018.02.051
24. Gutmann DH. The tropism of pleiotrophin: Orchestrating glioma brain invasion. Cell (2017) 170:821–2. doi: 10.1016/j.cell.2017.08.011
25. Qin EY, Cooper DD, Abbott KL, Lennon J, Nagaraja S, Mackay A, et al. Neural precursor-derived pleiotrophin mediates subventricular zone invasion by glioma. Cell (2017) 170:845–59.e19. doi: 10.1016/j.cell.2017.07.016
26. Tannous BA, Badr CE. A TNF-NF-κB-STAT3 loop triggers resistance of glioma-stem-like cells to smac mimetics while sensitizing to EZH2 inhibitors. Cell Death Dis (2019) 10:1–3. doi: 10.1038/s41419-019-1505-5
27. Cruceriu D, Baldasici O, Balacescu O, Berindan-Neagoe I. The dual role of tumor necrosis factor-alpha (TNF-α) in breast cancer: Molecular insights and therapeutic approaches. Cell Oncol Dordr (2020) 43:1–18. doi: 10.1007/s13402-019-00489-1
28. Huynh N, He H. p21-activated kinase family: promising new drug targets. Res Rep Biochem (2015) 5:119–28. doi: 10.2147/RRBC.S57278
29. Yao D, Li C, Rajoka MSR, He Z, Huang J, Wang J, et al. P21-activated kinase 1: Emerging biological functions and potential therapeutic targets in cancer. Theranostics (2020) 10:9741–66. doi: 10.7150/thno.46913
30. Rahme GJ, Israel MA. Id4 suppresses MMP2-mediated invasion of glioblastoma-derived cells by direct inactivation of Twist1 function. Oncogene (2015) 34:53–62. doi: 10.1038/onc.2013.531
31. Wang C-C, Hsu Y-L, Chang C-J, Wang C-J, Hsiao T-H, Pan S-H. Inhibitor of DNA-binding protein 4 suppresses cancer metastasis through the regulation of epithelial mesenchymal transition in lung adenocarcinoma. Cancers (2019) 11:2021. doi: 10.3390/cancers11122021
32. Kuzontkoski PM, Mulligan-Kehoe MJ, Harris BT, Israel MA. Inhibitor of DNA binding-4 promotes angiogenesis and growth of glioblastoma multiforme by elevating matrix GLA levels. Oncogene (2010) 29:3793–802. doi: 10.1038/onc.2010.147
33. Martini M, Cenci T, D’Alessandris GQ, Cesarini V, Cocomazzi A, Ricci-Vitiani L, et al. Epigenetic silencing of Id4 identifies a glioblastoma subgroup with a better prognosis as a consequence of an inhibition of angiogenesis. Cancer (2013) 119:1004–12. doi: 10.1002/cncr.27821
34. Gilson P, Drouot G, Witz A, Merlin J-L, Becuwe P, Harlé A. Emerging roles of DDB2 in cancer. Int J Mol Sci (2019) 20:E5168. doi: 10.3390/ijms20205168
35. Sun C-L, Chao CC-K. Cross-resistance to death ligand-induced apoptosis in cisplatin-selected HeLa cells associated with overexpression of DDB2 and subsequent induction of cFLIP. Mol Pharmacol (2005) 67:1307–14. doi: 10.1124/mol.104.008797
36. He Y-H, Yeh M-H, Chen H-F, Wang T-S, Wong R-H, Wei Y-L, et al. ERα determines the chemo-resistant function of mutant p53 involving the switch between lincRNA-p21 and DDB2 expressions. Mol Ther Nucleic Acids (2021) 25:536–53. doi: 10.1016/j.omtn.2021.07.022
37. Zhao Y, Aguilar A, Bernard D, Wang S. Small-molecule inhibitors of the MDM2-p53 protein-protein interaction (MDM2 inhibitors) in clinical trials for cancer treatment. J Med Chem (2015) 58:1038–52. doi: 10.1021/jm501092z
38. Katase N, Nagano K, Fujita S. DKK3 expression and function in head and neck squamous cell carcinoma and other cancers. J Oral Biosci (2020) 62:9–15. doi: 10.1016/j.job.2020.01.008
39. Stojanov S, McDermott MF. The tumour necrosis factor receptor-associated periodic syndrome: Current concepts. Expert Rev Mol Med (2005) 7:1–18. doi: 10.1017/S1462399405009749
40. Bausart M, Préat V, Malfanti A. Immunotherapy for glioblastoma: the promise of combination strategies. J Exp Clin Cancer Res (2022) 41:35. doi: 10.1186/s13046-022-02251-2
41. Wen PY, Drappatz J, de Groot J, Prados MD, Reardon DA, Schiff D, et al. Phase II study of cabozantinib in patients with progressive glioblastoma: Subset analysis of patients naive to antiangiogenic therapy. Neuro-Oncol (2018) 20:249–58. doi: 10.1093/neuonc/nox154
42. Villalonga-Planells R, Coll-Mulet L, Martínez-Soler F, Castaño E, Acebes J-J, Giménez-Bonafé P, et al. Activation of p53 by nutlin-3a induces apoptosis and cellular senescence in human glioblastoma multiforme. PLoS One (2011) 6:e18588. doi: 10.1371/journal.pone.0018588
Keywords: glioblastoma multiforme, oncogenic signaling pathways, The Cancer Genome Atlas, survival, gene
Citation: Han M-H, Min K-W, Noh Y-K, Kim JM, Cheong JH, Ryu JI, Won YD, Koh S-H and Park YM (2022) Identification of genes from ten oncogenic pathways associated with mortality and disease progression in glioblastoma. Front. Oncol. 12:965638. doi: 10.3389/fonc.2022.965638
Received: 09 June 2022; Accepted: 20 July 2022;
Published: 10 August 2022.
Edited by:
Hang Chang, Berkeley Lab (DOE), United StatesReviewed by:
Saman Seyed Ahmadian, State Library of Ohio, United StatesQingsu Cheng, University of Wisconsin–Milwaukee, United States
Copyright © 2022 Han, Min, Noh, Kim, Cheong, Ryu, Won, Koh and Park. This is an open-access article distributed under the terms of the Creative Commons Attribution License (CC BY). The use, distribution or reproduction in other forums is permitted, provided the original author(s) and the copyright owner(s) are credited and that the original publication in this journal is cited, in accordance with accepted academic practice. No use, distribution or reproduction is permitted which does not comply with these terms.
*Correspondence: Kyueng-Whan Min, a3l1ZW5nQGhhbnlhbmcuYWMua3I=; Yung-Kyun Noh, bm9oeXVuZ0BoYW55YW5nLmFjLmty