 Peng Pan1†Jingnan Li2†
 Bo Wang3†
 Xiaoyan Tan4Hekun Yin5Yingmin Han6Haobin Wang6
 Xiaoli Shi3Xiaoshuang Li3Cuinan Xie3Longfei Chen3Lanyou Chen3
 Yu Bai1*
 Zhaoshen Li1*Geng Tian6*
- 1Department of Gastroenterology, Shanghai Changhai Hospital, Shanghai, China
- 2Department of Gastroenterology, Peking Union Medical College Hospital, Beijing, China
- 3Department of Science, Geneis Beijing Co., Ltd., Beijing, China
- 4Department of Gastroenterology, Maoming People's Hospital, Maoming, China
- 5Department of Gastroenterology, Jiangmen Central Hospital, Jiangmen, China
- 6Department of Bioinformatics, Boke Biotech Co., Ltd., Wuxi, China
Introduction: Colorectal adenoma can develop into colorectal cancer. Determining the risk of tumorigenesis in colorectal adenoma would be critical for avoiding the development of colorectal cancer; however, genomic features that could help predict the risk of tumorigenesis remain uncertain.
Methods: In this work, DNA and RNA parallel capture sequencing data covering 519 genes from colorectal adenoma and colorectal cancer samples were collected. The somatic mutation profiles were obtained from DNA sequencing data, and the expression profiles were obtained from RNA sequencing data.
Results: Despite some similarities between the adenoma samples and the cancer samples, different mutation frequencies, co-occurrences, and mutually exclusive patterns were detected in the mutation profiles of patients with colorectal adenoma and colorectal cancer. Differentially expressed genes were also detected between the two patient groups using RNA sequencing. Finally, two random forest classification models were built, one based on mutation profiles and one based on expression profiles. The models distinguished adenoma and cancer samples with accuracy levels of 81.48% and 100.00%, respectively, showing the potential of the 519-gene panel for monitoring adenoma patients in clinical practice.
Conclusion: This study revealed molecular characteristics and correlations between colorectal adenoma and colorectal cancer, and it demonstrated that the 519-gene panel may be used for early monitoring of the progression of colorectal adenoma to cancer.
1 Introduction
Although the mortality rate of colorectal cancer is declining, it remains one of the top three causes of cancer-related deaths (1–7). The occurrence of cancer is a multi-step process, and most malignant colorectal cancers are caused by pre-existing benign tumors (8, 9). Colorectal cancer is caused by the activation of oncogene mutations and the inactivation of tumor suppressor genes, the latter of which is the main cause (10–14). The specific process begins with the abnormal growth of colonic epithelium, which transforms into colorectal adenoma and finally into cancer (15–17). Chemotherapy and radiation therapy are the main modes of treatment for tumors, but these treatments are quite taxing for patients and the results are not always ideal (18–22). Therefore, the detection and treatment of cancer at an early stage of development is critical. Preventive intervention during this period can preclude the development of cancer and potentially reverse the process of cancer development (23).
Colonoscopy plays an important role in the diagnosis and treatment of colorectal cancer during its formation and development (24). However, the disadvantages of colonoscopy include patients’ reluctance to undergo the procedure, possible complications, and economic burden for patients (23). Colorectal adenoma generally refers to a raised lesion that protrudes from the rectal mucosa surface into the intestinal cavity. Colonoscopy can detect polyps and aid doctors in polyp removal, but it cannot identify whether a polyp is neoplastic (15). Gong et al. established a real-time quality improvement system to monitor the speed of colonoscopy sampling in real time, thereby improving the effectiveness of colonoscopy in detecting adenomas (24). In another study, regular aspirin was shown to reduce the incidence of colorectal adenomas, and other non-steroidal anti-inflammatory drugs (NSAIDs) were shown to mitigate the risk of colorectal tumors (25). Moreover, obesity has been reported as a poor prognostic factor, and weight control has been shown to decrease the risk of colorectal adenoma progression (26, 27). Therefore, establishing an approach to discerning the prognosis of colorectal adenoma can increase the early screening detection of colorectal cancers and avoid unnecessary treatment for benign colorectal adenoma.
Numerous studies have explored the relationship between colorectal adenoma and colorectal cancer. By comparing the somatic mutation research of colorectal adenoma and colorectal cancer, a supervised random deep forest model was established in (23). In (28), whole-exome sequencing and targeted sequencing methods were used to describe the somatic mutations of colorectal precancerous lesions, and then through comparison with colorectal cancer, a colorectal adenoma genome map was established to identify the direction of colorectal adenoma molecular markers of cancer development. The map indicated that, during the process of colorectal adenoma development into colorectal cancer, genome stability decreased and mutations accumulated, resulting in alterations in RNA expression. The Consensus Molecular Subtype (CMS) is a colorectal cancer classification system based on RNA expression. In (15), it was found that colorectal adenomas can be classified into CMS types. Further study revealed that the distribution of CMS types in colorectal adenomas was consistent with the proportion of adenomas that progressed to colorectal cancer. Colorectal adenomas are also called colorectal neoplastic polyps, which belong to a category of polyps. Polyps can be divided into cancer adjacent polyps (CAP) and cancer-free polyps (CFP). The characteristics of CAP and CFP tissues based on their genes, expression, and methylation patterns are used to define molecules related to the progression of polyps to cancer, and to provide candidate markers for screening. Adenoma and normal mucosa transcripts from the same individual were explored in (29), and it was found that a key feature of the transformation process was the remodeling of the Wnt pathway. KIAA1199 is a new target of the Wnt signaling pathway and a potential indicator of colorectal adenoma transformation. In (30, 31), an unidentified gene locus (chR16: hCG_1815491) named colorectal neoplasia differentially expressed (CRNDE) was found to be activated in the early stage of colorectal cancer; further research found that the single CRNDE transcript can be used as a tissue and plasma biomarker of colorectal adenoma and cancer with high sensitivity and specificity. The human large intestine has many complex bacterial communities. Studying the relationship between these bacterial communities and colorectal adenomas in (32, 33) revealed that changes in the composition of the bacterial communities associated with adenomas may be related to the etiology of colorectal cancer. This provides a new direction for the prevention of colorectal adenoma and colorectal cancer. In terms of technology, the use of next-generation sequencing (NGS) technology to study colorectal adenoma and colorectal cancer-related genes is a superior choice. Studies have shown that a targeted sequencing platform using NGS technology can be used in the clinic to provide comprehensive data on genetic changes (5, 34, 35).
Past research has improved our understanding of the natural history and treatment of colorectal adenomas and uncovered the advantages and disadvantages of general methods of detecting and removing adenomas. Although some studies have investigated colorectal adenoma and colorectal cancer based on the NGS platform, few have utilized multi-omics data. With the advancement of science and technology, improvements in risk stratification, adenoma detection, monitoring intervals, and screening have contributed to the prevention of colorectal cancer (36). The objective of the present study was to develop an NGS panel capable of DNA&RNA Parallel Capture for the exploration of molecular characterization of colorectal adenoma and cancer. Comparing the separate capture of DNA and RNA with co-capture of DNA and RNA, the latter brings about several advantages. Firstly, detections in RNA could complement detections in DNA (37). Though targeted capture at the DNA level can precisely identify genomic variation such as single nucleotide variants, insertions, deletions and breakpoints of structure variation, changes at the DNA level do not necessarily reflect corresponding changes in biological phenotypes. Therefore, detection at the transcriptome or proteome level is essential. According to reports, 12.8% of uncommon fusions identified at the DNA level did not result in abnormal transcription or proteins. In such cases, targeted therapy is not effective in clinical treatment (38). Secondly, co-capturing of DNA and RNA minimizes molecular difference between DNA and RNA caused by tumor heterogeneity (39). Thirdly, co-capture of DNA and RNA is a simpler process that requires only one hybridization capture experiment, but allowed obtaining DNA and RNA sequencing results simultaneously. It reduces reagent and sequencing costs and saves experimental time (40).
First, 519 cancer-related genes in the NGS targeted panel—consisting of tumor oncogenes, tumor suppressor genes, and genes associated with target drugs and chemotherapy drugs—were collected from OncoKB (41), Cosmic (42), TCGA (43), and the literature. Specifically, the panel covered 73 drug target genes, 30 chemotherapy drug-related genes, and 74 hereditary tumor genes. Then the potential molecular mechanism of the progression from colorectal adenoma to colorectal cancer was investigated, and common markers and key driver genes were identified to aid clinical application in more accurately determining the potential for disease progression.
2 Results
2.1 Overview
First, 26 colorectal adenoma patients and 28 colorectal cancer patients were enrolled. The clinical information of these patients are listed in Supplementary Tables 1, 2. Mutation profiles and expression profiles were obtained for all available patients. Multiple analysis was applied to the mutation profiles and the expression profiles. Finally, a model was trained for classification between adenoma and cancer samples, achieving good results. The entire analysis process is shown in Figure 1.
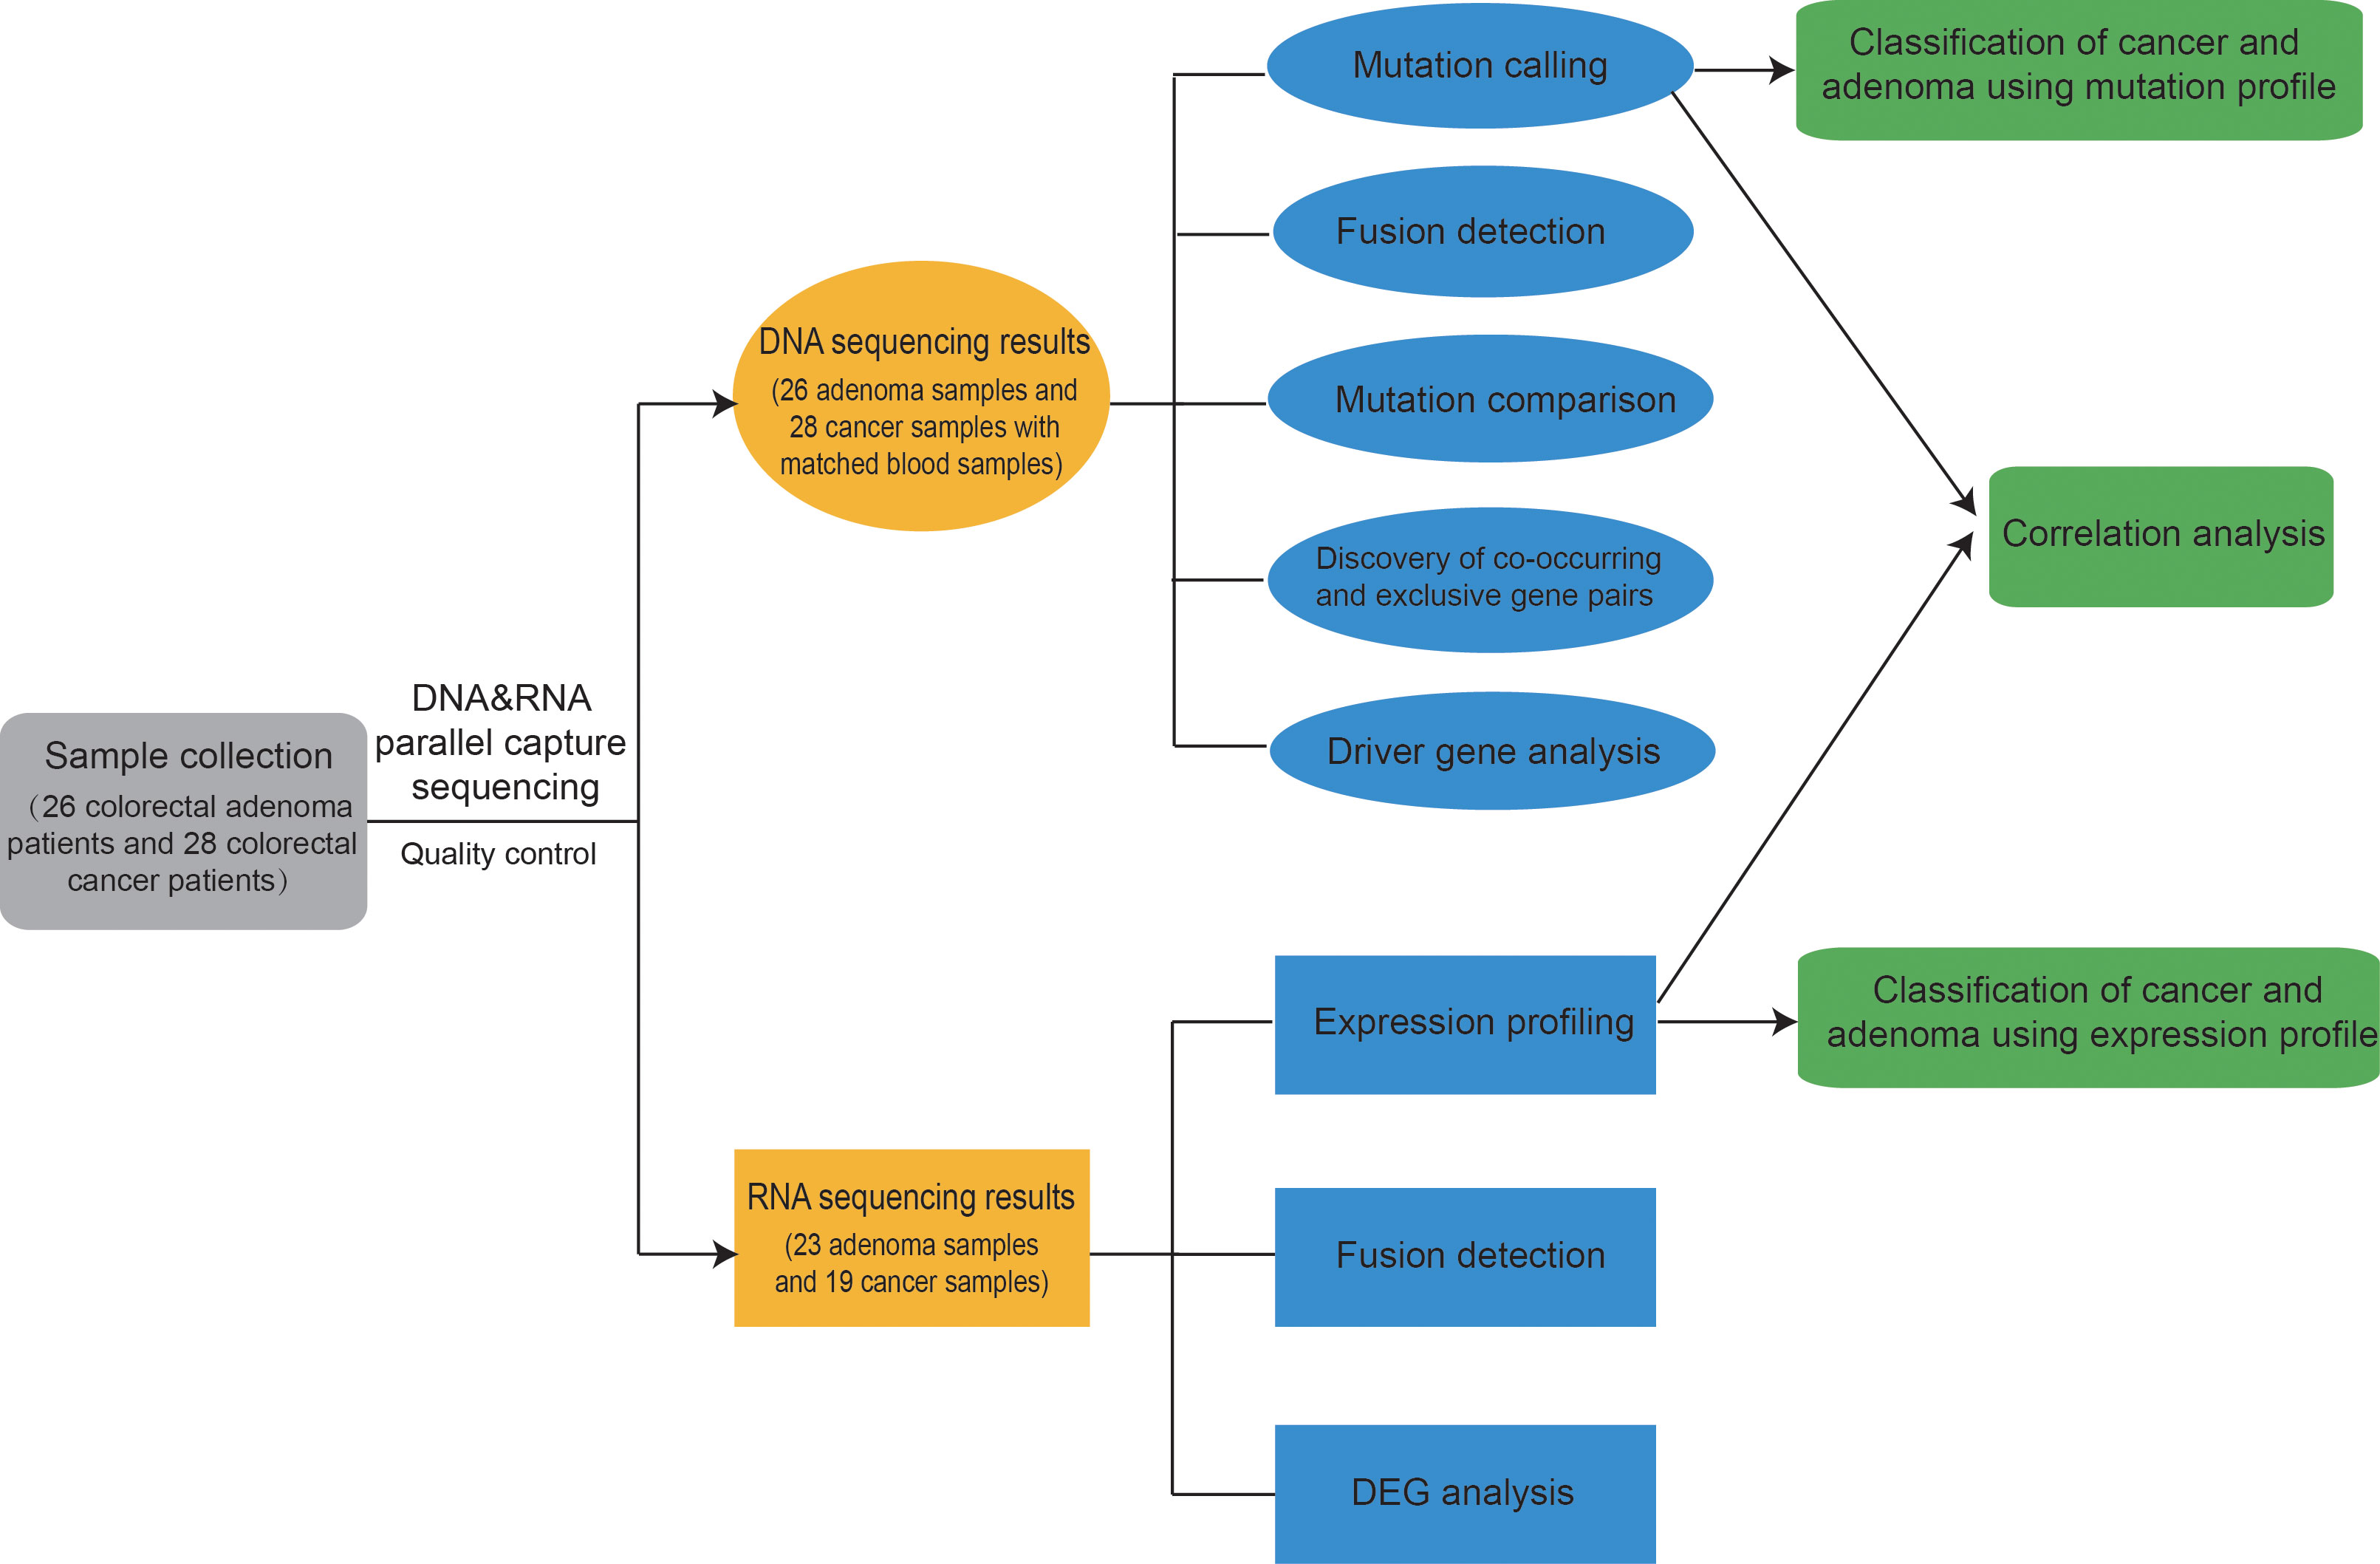
Figure 1 Overview of this study. First, 26 colorectal adenoma patients and 28 colorectal cancer patients were enrolled, and DNA&RNA Parallel Capture was applied on the patients’ adenoma and cancer samples. Mutation profiles and expression profiles were analyzed. Finally, a model was trained for classification between adenoma and cancer samples, achieving good results. Classification results from both expression profiles and mutation profiles could aid in making decisions.
2.2 Somatic mutations in the two groups showed similarity in most frequently mutated genes and transitions/transversions ratio
In total, DNA sequencing data of 26 colorectal adenoma and 28 colorectal cancer cases passed the quality control. Thus, somatic mutations were called for those samples using matched blood samples as normal. The mutations are listed in Supplementary Table 3.
The top five most frequently mutated genes in the adenoma group were APC, TTN, MUC16, KRAS, and GATA3, and the top five most frequently mutated genes in the cancer group were TP53, APC, KRAS, TTN, and MUC16 (Figures 2A, B). Hence, the two groups shared four common genes in the top five most frequently mutated genes, namely APC, TTN, MUC16, and KRAS. The most frequently mutated gene, APC, encodes a tumor suppressor protein that acts as an antagonist of the Wnt signaling pathway. Mutations at specific loci of APC and inactivation of APC can lead to familial adenomatous polyposis, an autosomal dominant pre-malignant disease that usually progresses to colorectal cancer (44, 45).
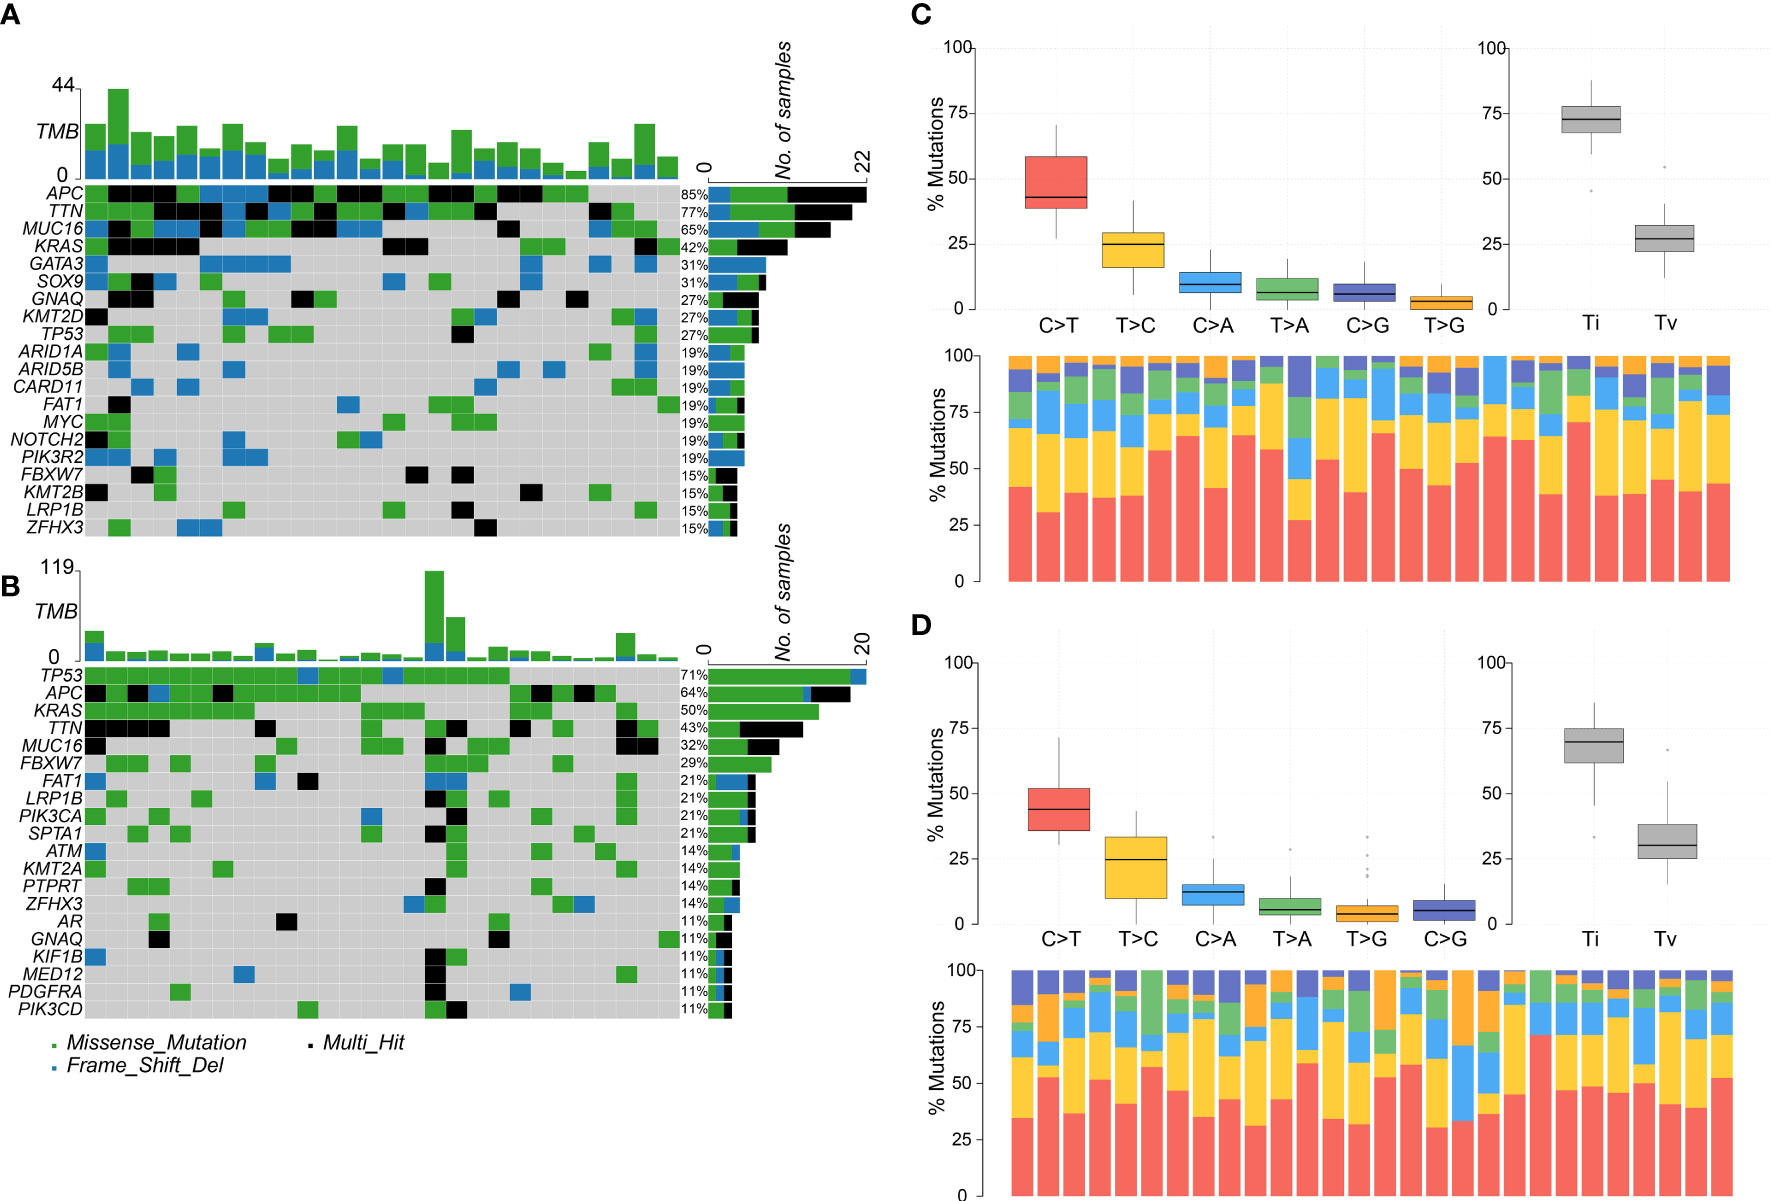
Figure 2 Colorectal adenoma or cancer sample mutation profile analysis. (A) Mutation profile summary for 26 adenoma samples. (B) Mutation profile summary for 28 cancer samples. (C) Transitions and transversions ratio visualization for 26 adenoma samples. (D) Transitions and transversions ratio visualization for 28 cancer samples.
Transitions and transversions were also analyzed in the adenoma and cancer groups (Figures 2C, D). The two groups tended to harbor more transitions than transversions, had similar Ti/Tv (transition/transversion) ratios, and had C>T as the most frequent mutation type. Interestingly, the top four most frequent mutation types, C>T, T>C, C>A, and T>A, were in the same order in both groups.
Furthermore, the driver genes were analyzed in the two groups. In the adenoma group, GNAQ, KRAS, MUC16, and TTN were identified as the driver genes, whereas in the cancer group, only GNAQ and KRAS were identified as the driver genes. Notably, GNAQ and KRAS were identified as driver genes in both groups.
2.3 TP53, SPTA1, SOX9, and ARID5B were differentially mutated in the two groups
Colorectal cancer patients harbored more mutations in TP53 and SPTA1, two genes that are frequently mutated in breast cancer (46). TP53 encodes a tumor suppressor protein containing transcriptional activation, DNA binding, and oligomerization domains; this protein responds to diverse cellular stresses to regulate the expressions of the target genes, thereby inducing cell cycle arrest, apoptosis, senescence, DNA repair, or changes in metabolism. TP53 is closely related to colon cancer (47) and other cancers (48, 49). SPTA1 encodes molecular scaffold proteins that link the plasma membrane to the actin cytoskeleton. These proteins determine cell shape, arrangement of transmembrane proteins, and organization of organelles. Mutations in SPTA1 result in a variety of hereditary red blood cell disorders. Furthermore, as reported by Tian et al., SPTA1 is also related to tumor burden in cholangiocarcinoma (50).
SOX9 and ARID5B were mutated in the adenoma group but not in the cancer group. The protein encoded by SOX9 acts during chondrocyte differentiation and, with steroidogenic factor 1, regulates transcription of the anti-Müllerian hormone (AMH) gene. SOX9 has been reported to be positively correlated to tumor size (51). Thus, mutations on SOX9 might impair the function of the protein encoded by SOX9, which might suppress the development of colorectal cancer. ARID5B plays a role in the cell growth and differentiation of B-lymphocyte progenitors. It is also reported to be related to the development of acute lymphoblastic leukemia (52). We surmise that ARID5B might be a new target for the prevention of colorectal cancer.
2.4 Distinct mutually exclusive and co-occurring oncogene patterns were found in the two groups
Correlations between mutations in the adenoma group and cancer group were analyzed (Figure 3), focusing on the 10 overlapping mutated genes between the two groups: APC, ARID1A, FAT1, FBXW7, GNAQ, KRAS, LRP1B, MUC16, TP53, TTN, and ZFHX3. In the adenoma group, co-occurrences related to the 10 genes were found between the gene pairs GNAQ-PDGFRB, KRAS-SOX9, LRP1B-KMT2D, and LRP1B-TP53. Co-occurrences gene pair means two genes in the pair co-mutate more often than expected. Similarly, mutually exclusive pair means two genes co-mutate less often than expected. However, no significant mutually exclusive gene pairs were found in the adenoma group. For the same 10 genes, more co-occurrence gene pairs were found: ARID1A-MUC16, ARID1A-MED12, FAT1-PIK3CD, FAT1-KIF1B, FBXW7-TTN, FBXW7-SPTA1, and GNAQ-AR. Furthermore, the mutually exclusive gene pair APC-MUC16 was found in the cancer group. Though correlated gene pairs were found in both groups, no common gene pair appeared in the two groups, indicating that the mutually exclusive and co-occurring oncogene mutations in adenoma patients might help in distinguishing between colorectal adenoma patients and colorectal cancer patients.
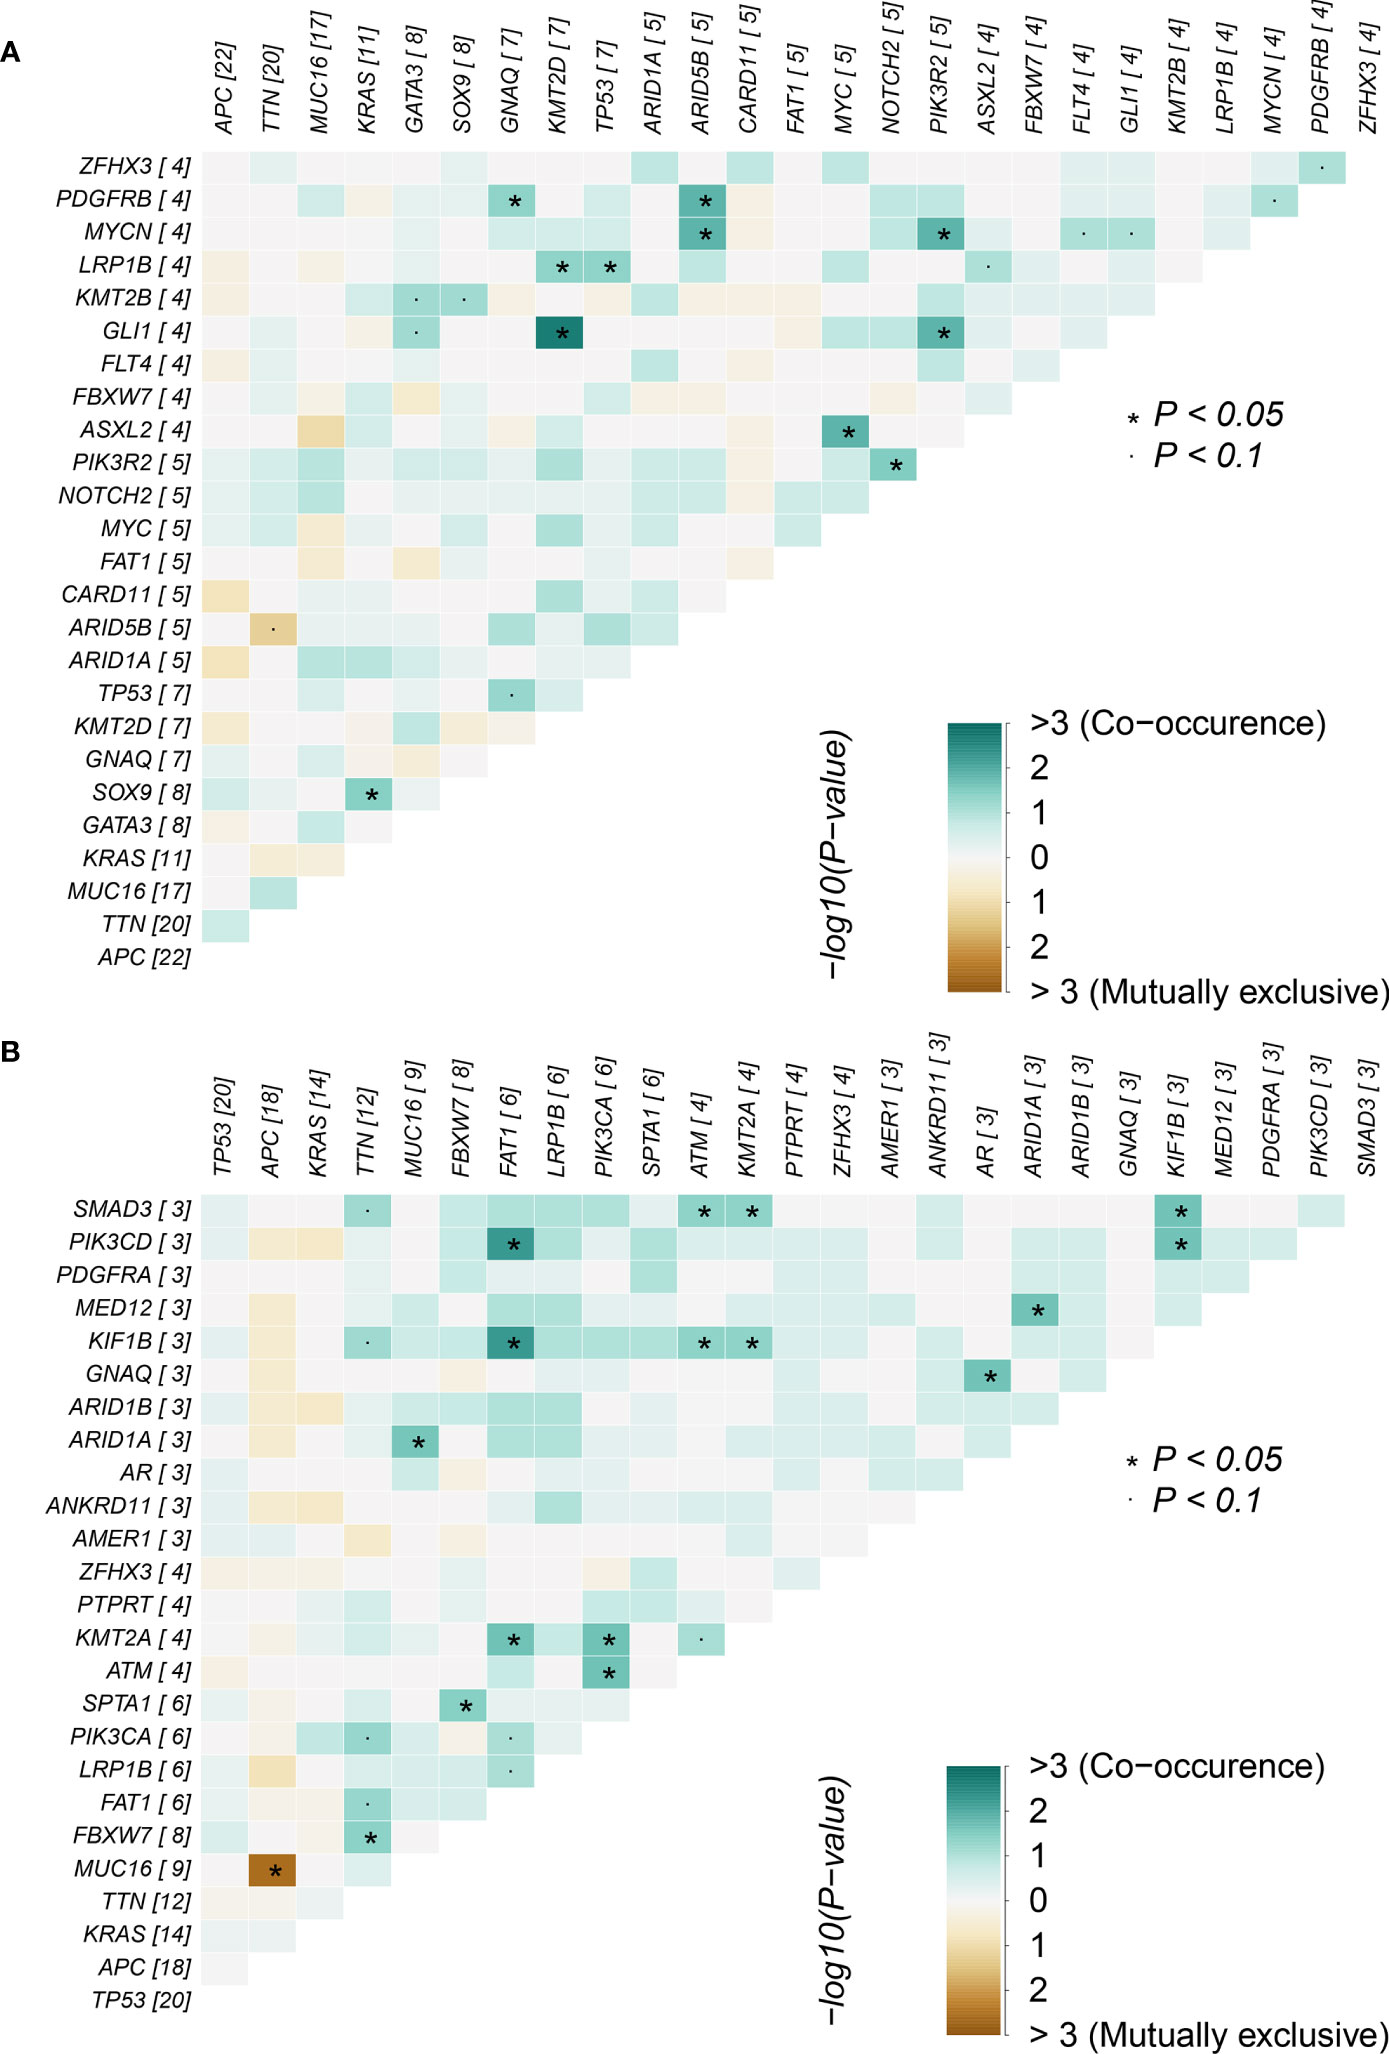
Figure 3 Mutually exclusive and co-occurring gene pairs in (A) colorectal adenoma samples and (B) colorectal cancer samples.
2.5 Detection of ETV6-NTRK3 fusions in colorectal cancer samples on DNA and RNA levels
We detected three fusions in three colorectal cancer samples on DNA level and one fusion in one colorectal adenoma sample on RNA level (Table 1). The fusions detected were all ETV6-NTRK3 fusion. This fusion has been reported in colorectal cancer patients (53–55). The additional fusion was detected only in RNA data, showing the RNA could complement the DNA on the detection of fusion.
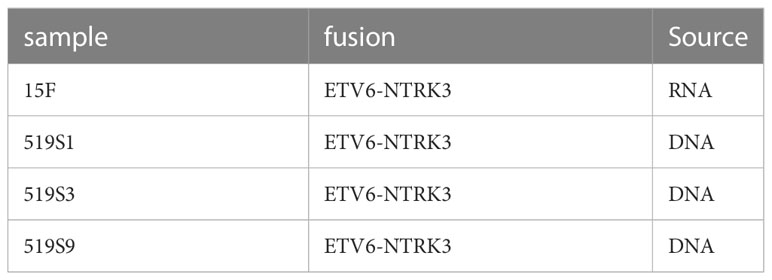
Table 1 Fusions detected in colorectal cancer samples and adenoma samples.
2.6 151 differentially expressed genes were found between cancer and adenoma samples
As the RNA of some samples did not meet requirements, RNA sequencing data from 19 colorectal cancer samples and 23 adenoma samples passed the quality control, and the expression profiles are listed in Supplementary Table 4. We plotted the principal coordinate analysis (PCoA) for the 19 colorectal cancer samples and TCGA samples after batch correction in Supplementary Figure 1 as the quality control procedure. We found no significant difference between the expression profiles of the selected cancer cohorts and those from TCGA.
We also plotted the PCoA for our cancer and adenoma cohorts. The PCoA showed the cancer samples and the adenoma samples could be distinguished, shown in Figure 4A (p = 0.001 using Adonis analysis). Differentially expressed gene (DEG) analysis was then applied to compare the expression profiles of colorectal adenoma and colorectal cancer, and DEGs are listed in Supplementary Table 5 (56). Compared with the RNA expression level of the adenoma samples, 151 genes with significantly different expressions were found in the cancer samples, with 99 (65.56%) upregulated genes and 52 (34.44%) downregulated genes. The top 10 downregulated and upregulated genes are shown in Figure 4B. The top downregulated gene, the Kruppel-like factor 4 (KLF4) gene, encodes a transcription factor that belongs to the Kruppel family. It is involved in the differentiation process of epithelial cells and is thought to control the G1-to-S transition of the cell cycle following DNA damage by mediating the tumor suppressor gene p53. It is also associated with secretory meningioma and epilepsy. KLF4 participates in signaling pathways regulating the pluripotency of stem cells and chemical carcinogenesis - receptor activation. Another downregulated gene, MSH3, takes part in pathways of platinum drug resistance, mismatch repair, and colorectal cancer, and it is related to colorectal cancer, endometrial cancer, and familial adenomatous polyposis. FGFR1, one of the upregulated genes, encodes a protein that belongs to the family of the fibroblast growth factor receptor, which is a key factor in many cancer-related pathways, such as the MAPK signaling pathway, Ras signaling pathway, and PI3K-Akt signaling pathway.
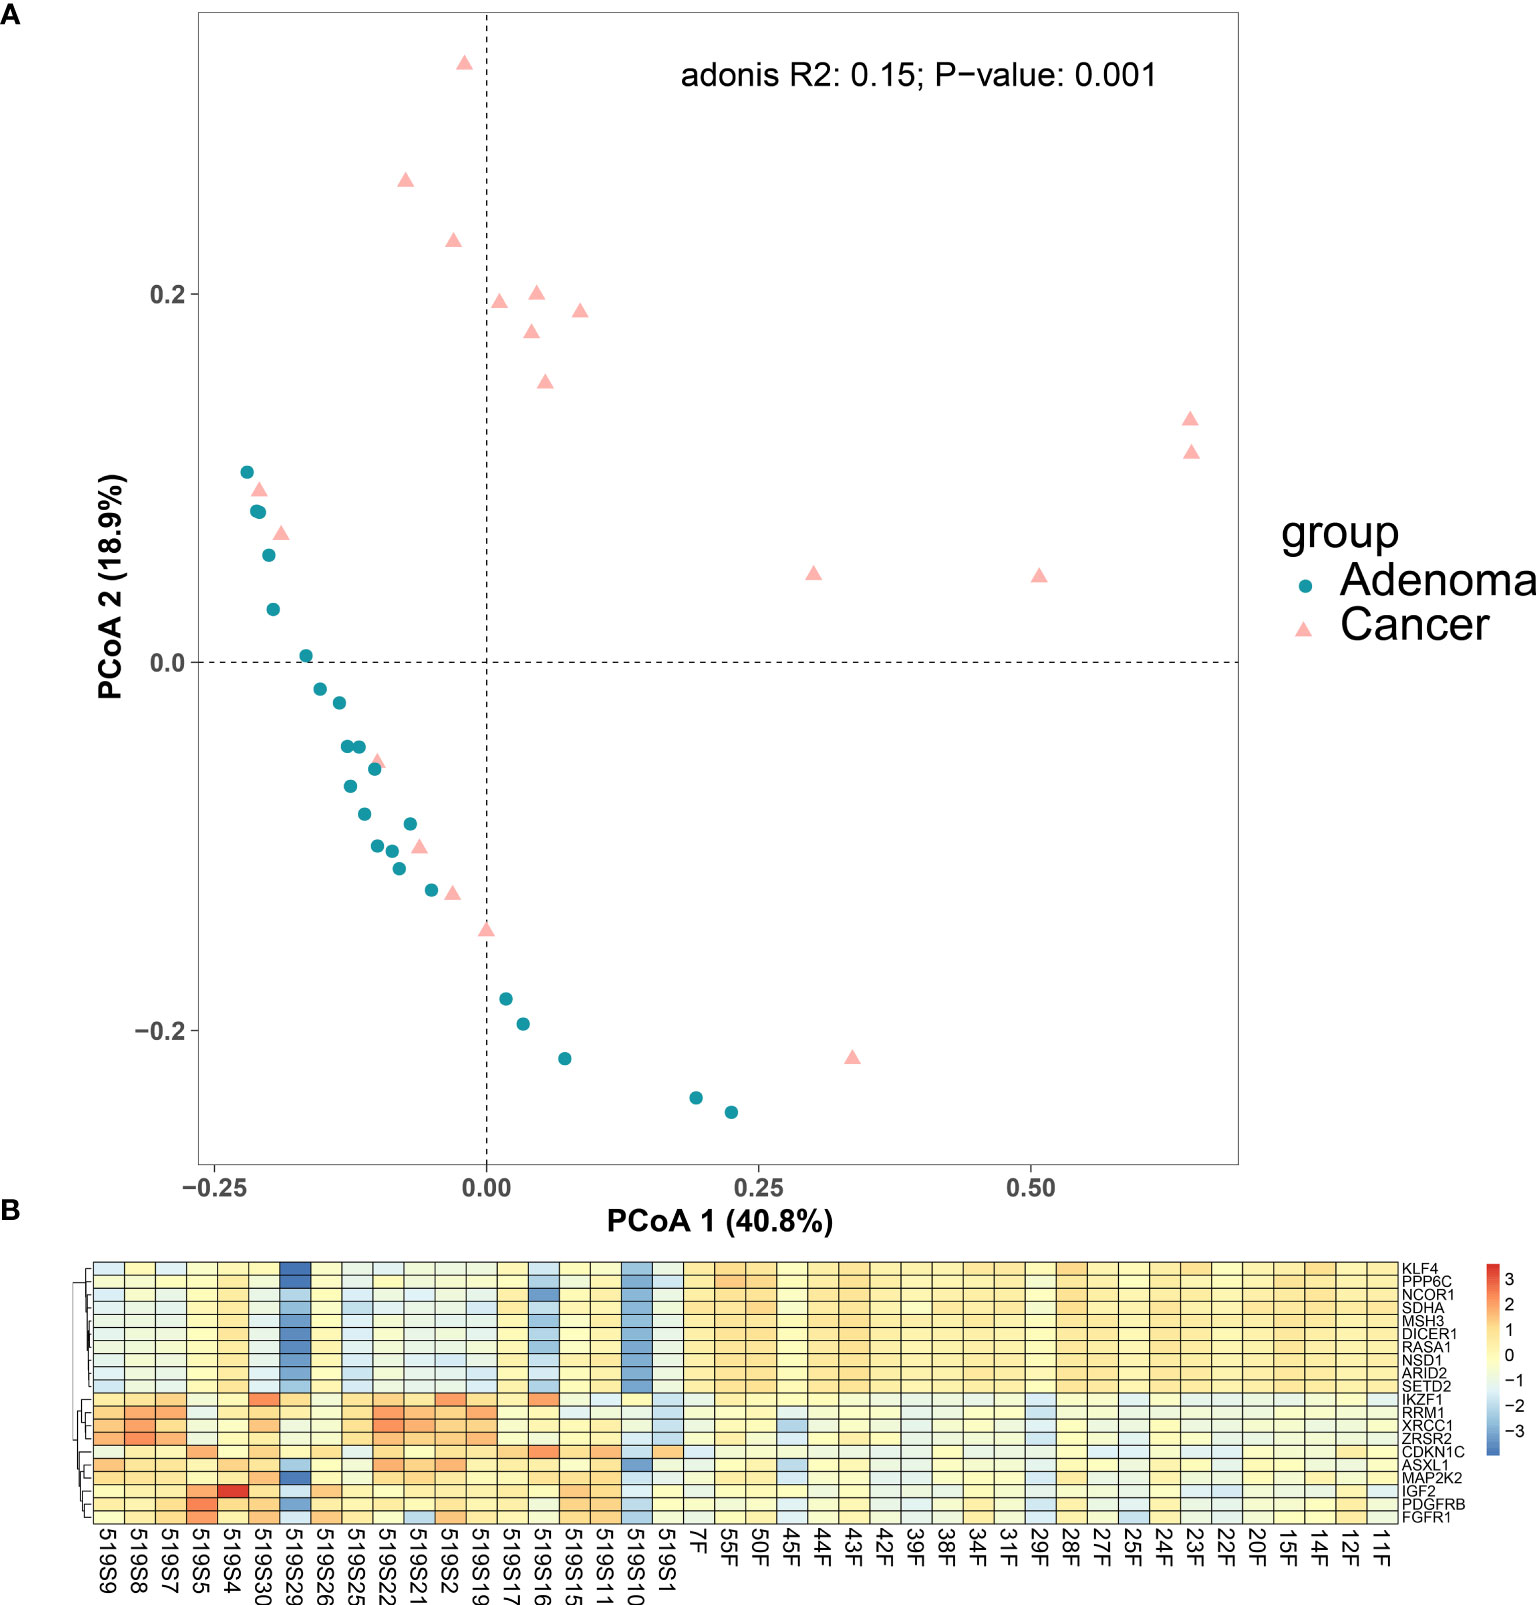
Figure 4 Differences between colorectal cancer group and adenoma group. (A) PCoA plot for the cancer group and the adenoma group. (B) Differentially expressed gene between the colorectal cancer group and the colorectal adenoma group. Top 10 differentially expressed genes in colorectal cancer samples (1–19 on the horizontal axis) compared with adenoma samples (20–42 on the horizontal axis).
An independent RNA-seq dataset, GSE164541 containing 5 colorectal cancer samples and 5 colorectal adenoma samples was collected to confirm our DEGs. The same DEG analysis were conducted as in our dataset. 849 DEGs were found in GSE164541 and supplied in Supplementary Table 6. 18 common DEGs were found. We performed a hypergeometric test (see Materials and Methods for details) to assess the significance of the overlap between the DEGs identified in two datasets. Our analysis showed that the probability of observing such an overlap by chance alone was 0.0004, indicating a significant enrichment of common DEGs between the two datasets.
2.7 Adenoma and cancer samples could be classified using mutation profile or expression profile
Because some genes were differentially mutated or expressed between cancer samples and adenoma samples in this study, and this observation has also been previously reported (57), this study further investigated whether cancer samples and adenoma samples could be distinguished using the currently available molecular markers. The mutation profiles covering 411 genes from 28 cancer samples and 26 adenoma samples were used to evaluate the performance of classification for mutation. The expression profiles covering the entire 519-gene panel from 19 cancer samples and 23 adenoma samples were used to evaluate the performance of classification for expression. Tenfold cross-validation was used for both datasets. Random forest (58), a classic classification method, was used to classify the cancer samples and adenoma samples. To prevent overfitting, we utilized the random forest algorithm for feature selection and set the maximum number of selected genes equal to the sample size with a step size of 10. Thus, we used 10, 20, 30 and 40 as the candidate gene numbers for both mutation profiles and expression profiles. The performance of the different gene numbers was evaluated using a random forest classifier. The accuracies using different number of genes for the mutation profiles and the expression profiles. were shown in Figure 5A.
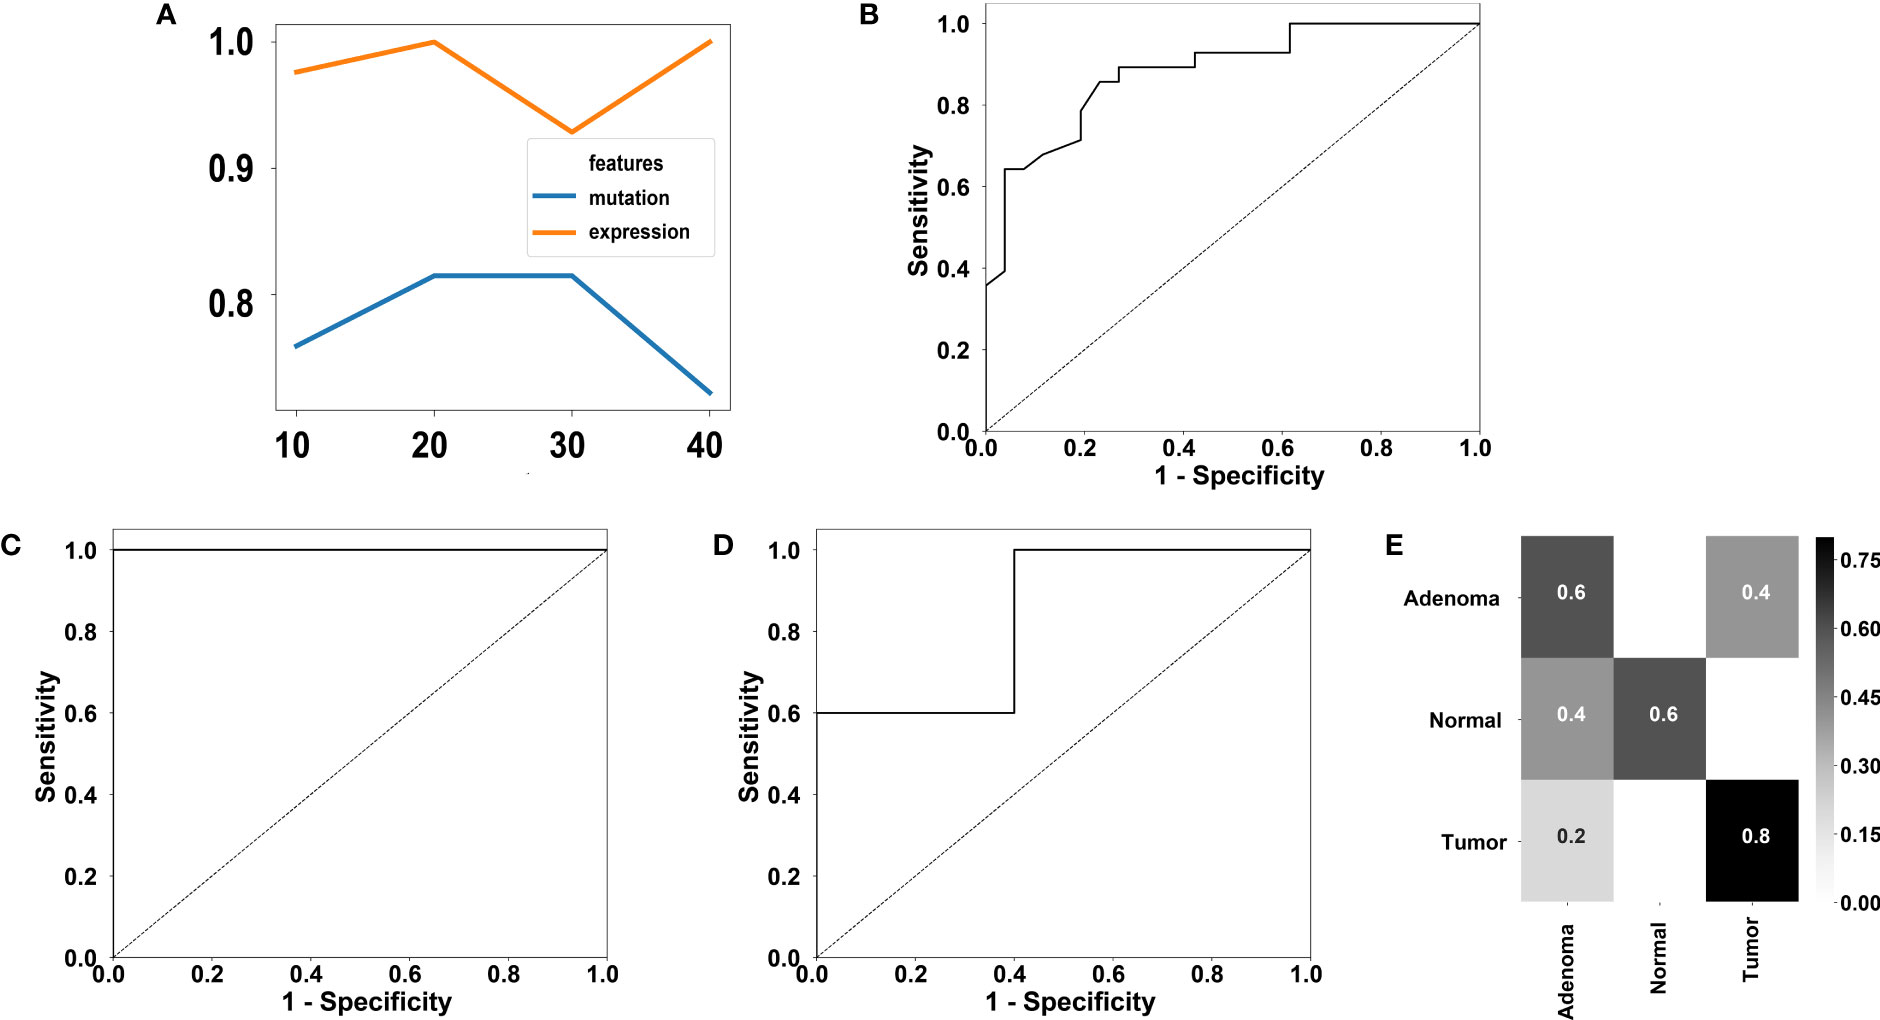
Figure 5 Performance of classification of colorectal adenoma and cancer using our 519-gene panel. (A) Accuracies using different gene number for mutation or expression profiles. (B) ROC using 20 genes for mutation profiles. The AUC is 0.88. (C) ROC using 20 genes for expression profiles. The AUC is 1.00. (D) ROC of the GSE16454 dataset containing 5 adenoma samples and 5 cancer samples. The AUC is 0.84. (E) Confusion matrix of a two-fold cross validation using the GSE164541 dataset utilizing the 20 informative genes discovered in our expression profiles.
For achieving the best accuracy for the mutation profiles, 20 is the optimal gene number. The receiver operating characteristic (ROC) using 20 genes for mutation profiles is displayed in Figure 5B. A high accuracy of 81.48% was achieved by the 20-gene set, which contained TP53, SOX9, CCDC6, ETV6, CLTC, AGK, EML4, CUL1, BRAF, FIP1L1, PAPSS1, TTN, EGFR, ETV5, BCL2, TPM3, GATA3, SPTA1, MUC16, and ARID1A. In the cross-validation of the 20-gene set, six adenoma samples were misclassified as cancer samples, and four cancer samples were misclassified as adenoma samples.
To achieve the best accuracy for the expression profiles, 20 is the optimal gene number. The ROC using 20 genes for expression profiles is displayed in Figure 5C. A high accuracy of 100% was achieved by the 20-gene set, which contained PPP6C, RASA1, MSH3, NSD1, BRD4, RYBP, NCOR1, SDHA, ARID2, EP300, ASXL2, REL, FOXP1, SETD2, MAP2K4, SDHC, DICER1, IGF2, SMAD2, and ASXL1. Note that only FOXP1 is not one of the DEGs.
We further validated the 20 gene set for expression profiles in an independent dataset. We trained a model using random forest based on the 20 genes from adenoma and cancer samples and tested the model performance on the independent RNA-seq dataset, GSE164541, which contains 5 colorectal adenoma samples and 5 colorectal cancer samples. The area under curve (AUC) of classifying the independent dataset reached 0.84 (Figure 5D), showing the robustness of the 20 genes in classifying colorectal adenoma and cancer samples.
Additionally, the GSE164541 dataset supplied another 5 normal samples. To investigate whether the 20 genes could help to distinguish the normal samples, we performed a twofold cross-validation for the GSE164541 dataset with only the 20 informative genes found in this study’s dataset. An accuracy of 66.7% was achieved on the GSE164541 dataset and the confusion matrix was displayed in Figure 5E, showing the 20 genes have the potential in distinguish the normal samples.
We demonstrated that the genes contained in the 519-gene panel were sufficient for determining sample malignancy. Thus, the 519-gene panel, which could capture both DNA and RNA sequences, might help to solve the problem of early screening and monitoring while also lowering costs.
2.8 Correlations between expression and mutation were discovered in adenoma samples
We further investigated whether there were correlations between mutations and expressions. Three pairs were found to be strongly correlated: mutation of GATA3 with expression of IDH1 (coefficient = 0.71, p-adj = 0.01), mutation of EML4 with expression of ROS1 (coefficient = -0.68, p-adj = 0.02) and mutation of EML4 and the expression of GATA1 (coefficient = -0.66, p-adj = 0.03). GATA3 encodes a protein that is important regulator to T-cell development and related to cancer (59, 60). EML4 is a gene that frequently involved in fusion events (61, 62). Based on our parallel capture technique, those findings might supply us new insight for the prevention and curation of colorectal cancer.
3 Materials and methods
3.1 Case collection
Individuals were diagnosed with colorectal cancer and did not receive any treatment before sample collection. Patients with hereditary nonpolyposis colorectal cancer and a history of colorectal cancer were excluded. Based on inclusion criteria in addition to similar sex and age, samples were collected from the Shanghai Changhai Hospital, Peking Union Medical College Hospital, Jiangmen Central Hospital, and Maoming People’s Hospital along with patients’ clinical information. For this study, all patients provided informed consent.
An additional RNA-seq expression dataset, GSE164541, was collected from the Gene Expression Omnibus database (GEO) to supply adjacent normal tissue, adenoma tissue, and primary colorectal cancer tissue for each of the five patients, forming a 15-sample dataset.
To obtain the expression profile from TCGA, read counts of colorectal samples were downloaded from https://dcc.icgc.org/releases/release_26.
3.2 DNA/RNA extraction
DNA and RNA were extracted from the obtained case samples. DNA was extracted from both tumor/adenoma and blood. RNA was only extracted from tumor/adenoma. The Quick DNA/RNA FFPE kit (ZYMO) was used for extraction from formalin-fixed paraffin-embedded (FFPE) sections. DNA quantification was conducted by Qubit dsDNA HS Analysis Kit (LIFE) and agarose gel electrophoresis, while RNA was quantified by Qubit RNA HS Assay Kit (LIFE) and RNA 6000 Pico Kit (Agilent). The construction of DNA and RNA libraries was accomplished using the ABclonal Rapid DNA Lib prep kit and KAPA Stranded RNA-Seq Kit with RiboErase HMR, according to the manufacturer’s protocol. Covaris s220 was used to physically cut 50–200-ng DNA, followed by A-tailing, adaptor ligation, and polymerase chain reaction amplification. The total amount of DNA and RNA libraries was 500 ng, and the mixing ratio was 10:1. The mixture was hybridized at 65°C for 16–18 h using hybridization probes from Boke, followed by the use of M270 streptavidin beads for 45 min for capture. Then 15 post-capture amplification cycles were carried out to obtain the captured library.
3.3 Next-generation sequencing and quality control
All samples were sequenced using a panel-based NGS system that contained 519 cancer-related genes and covered 1.8 Mb of the human genome (GRCh37/hg19) (see Supplementary Table 7 for details). A special capture technology called DNA&RNA Parallel Capture (P-Cap, patent authorization publication number: CN 110079594 B), which can obtain DNA and RNA sequences through a single capture operation, was used in the experiment. The final libraries were pooled and sequenced using the MGI-2000 sequencing platform with the paired-end 100-cycle kit. To ensure quality control, a sequencing depth of 100x was set for both DNA and RNA samples.
3.4 Somatic mutation calling
Mutations shown in matched blood samples were taken as germline mutations. The Microraptor (https://github.com/umich-brcf-bioinf-projects/microraptor) pipeline, which is based on GATK, was used to call somatic mutations. Trimmomatic was used to filter low-quality reads, and BWA mem was used for the mapping of reads. GATK SortSam, MarkDuplicates, CollectHsMetrics, BaseRecalibrator, ApplyBQSR, AnalyzeCovariates, CollectSequencingArtifactMetrics, Mutect2, GetPileupSummaries, CalculateContamination, FilterMutectCalls, and FilterByOrientationBias were used for mutation calling and filtrations.
3.5 Mutation analysis
Maftools (63) was used for multiple analysis in mutation profiles. For visualization of the mutations in samples, the oncoplot function was used. To discover the transitions/transversions relationships, the titv function was used. To determine the co-occurrence and mutually exclusive patterns in the mutations between genes, the somaticInteractions function was used, where Pair-wise Fisher’s Exact test were performed and Bonferroni correction was used to adjust the p-values. Based on the OncodriveCLUST algorithm, a function called oncodrive was used to detect the driver genes. Bonferroni correction was then used to adjust the p-values. The driver genes with FDR < 0.01 were displayed in this study.
3.6 Fusion detection
SEGF software (64) was used to detect the fusions in both DNA and RNA fastqs. The default parameters were used.
3.7 RNA expression profile calling
Mapsplice v12_07 was used to map the RNA reads onto the hg19 genome using default parameters. RSEM (v1.1.13) was used for quantification of gene and isoform abundance estimation according to TCGA GAF 2.1 files using default parameters.
3.8 Batch correction
To eliminate the batch effect, we used the combat function from sva package (65) for batch correction. Null model was used, which assumes equal variance across our samples and TCGA samples. After batch correction, negative values were replaced to zero.
3.9 Principal coordinate analysis and Adonis analysis
The dissimilarities between samples was first calculated using Bray-Curtis dissimilarity distance measure using vegdist function from vegan package (66). cmdscale function was then used to keep the first three principal coordinates. Bray-Curtis dissimilarity distance measure was chosen for the Adonis analysis using adonis2 function from vegan package.
3.10 Differentially expressed gene analysis
DEG analysis was performed using R package DESeq2 (56). Wald significance tests was used in DESeq function. Benjamini-Hochberg were used for controlling false discovery rate. The thresholds were set to log2 |fold change| > 1 and adjusted p-value < 0.01 for further analysis.
3.11 Hypergeometric test for assessing the significance of the overlap between the DEGs identified in two datasets
We employed the R function phyper to determine the significance of overlap between two sets of differentially expressed genes (DEGs). In our study, the parameters q=17, m=151, n=20827, and k=849 were used to define the size of each set and the level of overlap.
3.12 Classification for colorectal cancer and adenoma
Before classification, the expression data, the read counts were normalized for each sample. For mutation data, the mutation counts on each gene were used as features.
For gene selection, the scikit-learn package (67) was used to implement a 100-estimator random forest to get the importance scores of each gene. and the Gini impurity was used to measure the quality of a split. The feature number used by each estimator is square root of total feature.
For classification, we implement a 100-estimator random forest classification model with the same hyperparameters. The reason we chose random forest as the classification algorithm is that (a) each tree of random forest process a random subset of features and samples, alleviating the problem of overfitting; (b) the ensemble of trees could alleviate the curse of dimensionality.
3.13 Correlation calculation between mutations and expressions
The gene mutation profile was processed by indicator function, which will output whether the gene has mutation (output = 1) or not (output = 0). To decrease false discoveries, genes that mutated in less than 5 samples were excluded. Pearson correlation from scipy package (68) was used to calculate the correlation between the mutation of one gene and the expression of another gene. Benjamini & Hochberg method from statsmodels package (69) was used for false discovery.
4 Discussion
In this study, 54 FFPE samples were collected from patients with colorectal adenoma or colorectal cancer as well as the matched blood samples to explore the molecular characteristics of colorectal adenomas and the relationship to colorectal cancer. P-Cap was employed to capture DNA and RNA simultaneously, and the NGS results were analyzed. Mutations of the APC, TTN, MUC16, and KRAS genes were high in frequency in both colorectal adenoma and colorectal cancer samples. However, some differences were identified, such as the relatively high occurrences of mutations in SOX9 and ARID5B in the colorectal adenoma samples, and the relatively high mutation frequencies of TP53 and SPTA1 in the colorectal cancer samples.
The underlying driver genes of colorectal adenoma and colorectal cancer were identified by mining DNA sequencing data. GNAQ and KRAS were identified as driver genes in both colorectal adenoma and colorectal cancer samples. GNAQ was a potential driver in colorectal cancer. The mutated GNAQ gene is a proto-oncogene of uveal melanoma, and the activation of the pathway containing the mutated GNAQ may be the main cause of uveal melanoma (70, 71). KRAS is an important “switch” in intracellular signaling and is most closely related to the occurrence and development of tumors; it is also a drug target. The activate mutation of KRAS is one driving factor in metastatic progression and has been reported in a number of studies. The mutated KRAS can drive the invasion and maintenance of metastasis of colorectal cancer, and it may also be a potential biomarker and therapeutic target for metastatic colorectal cancer (72, 73).
Our finding of the additional fusion detected only in RNA data highlights the complementary roles of DNA and RNA in the detection of fusion events. Unlike DNA, RNA can reveal information on splicing patterns and post-transcriptional modifications that can affect gene expression and alter the protein structure and function. Thus, we could detect additional fusion in RNA (74). Moreover, as previously reported by Hechtman et al., DNA plays a crucial role in detecting fusions, which could complement RNA-based detection methods (75). Therefore, the combination of DNA and RNA sequencing can offer a more comprehensive and accurate characterization of fusion events in cancer, which can promote the development of targeted therapies and improve the prognosis for patients.
Since there were differences in both mutation profiles and expression profiles between the adenoma group and the cancer group, a classification model was designed to distinguish between colorectal adenoma samples and colorectal cancer samples, and it performed well. It is worth noting that the model trained on the expression profile performed better than the model trained on the mutation profile. RNA seems to be more informative regarding sources of tissue, which has been addressed by other studies (3, 19, 20, 76, 77). In the future, the sample amount should be enlarged to verify the classification model proposed in this study. Although some previous studies also used random forest in small datasets that contained less than 100 samples (78, 79), our classification model might not be robust since our study’s dataset does not meet the requirement of event per variable. In addition, more efforts should be made to simplify the panel for the expression profile to detect colorectal cancer more inexpensively. Lin et al. developed a 20-gene panel using only mutation profiles for classifying adenoma and cancer at an accuracy of 85.46%, which is 3.98% higher than the accuracy of our proposed model (81.48%) (23). The feature used in their work was the severe consequences for each gene, whereas we used a simpler feature, the mutation count for each gene. We also found that TP53 and SOX9 were both in our 20-gene mutation gene set and their 20-gene set. Furthermore, it is possible to use the interaction term between mutations, such as co-occurrence and mutually exclusive relationships. However, since the interaction term affects the number of parameters, the model must be carefully designed. Though our model performed slightly worse than the model by Lin et al. within only mutation profiles, our method could still supply high classification accuracy from expression profiles, which also provided insights from the RNA level. In the future, it might be possible to achieve better prediction by integrating more types of patients’ data, such as histopathological images and microbes, as demonstrated in colorectal and other cancers (80–84).
In this study, we investigated correlations between mutations and expressions to gain insights into colorectal cancer prevention and curation. Our results showed strong correlations between three pairs of mutations and expressions: mutation of GATA3 with the expression of IDH1, mutation of EML4 with the expression of ROS1, and mutation of EML4 with the expression of GATA1. These findings provide new insights into the molecular mechanisms that underlie colorectal cancer development and progression, especially in relation to gene-gene interactions. Moreover, our parallel capture technique offers an efficient and reliable way to investigate these correlations, which can lead to the discovery of new biomarkers and therapeutic targets. Compared to separate capture technique, our technique minimizes the differences between the tissues for DNA sequencing and RNA sequencing caused by heterogeneity (39). Taking advantage of this technique, we could generate more accurate results in analysis requiring both DNA and RNA, such as correlation analysis. Further studies are needed to validate our findings and to explore the clinical implications of these novel insights.
In conclusion, using the proposed 519-gene DNA and RNA P-Cap sequencing platform, mutation and expression profiles both revealed the molecular characteristics and correlations of these characteristics between colorectal adenoma and colorectal cancer. These molecular characteristics, especially the expression profiles, can be used as early monitoring indicators to predict the occurrence and development of colorectal adenoma to cancer. The findings of this study will be valuable for developing molecular prevention and surveillance programs for colorectal cancer. Our results are based on a cross-comparison, and we will continue to follow the prognosis of patients in the cohort to further explore the risk of cancer development in adenoma patients with similar genetic alterations to those of colorectal cancer patients. Should the cancer risk of adenoma patients with these mutations increase, further attention and monitoring of progress will be done. In the future, it will be helpful to study colorectal adenoma and colorectal cancer using single cell techniques (85–89), as these diseases are both very heterogeneous.
Data availability statement
The datasets presented in this study can be found in online repositories. The names of the repository/repositories and accession number(s) can be found below: https://www.ncbi.nlm.nih.gov/, PRJNA783877.
Ethics statement
This study was approved by the Ethics Committee of Peking Union Medical College Hospital (Ethical No. HS-1686), the Ethics Committee of Shanghai Changhai Hospital (Ethical No. CHEC2018-174) and the Ethics Committee of NanFang Hospital of Southern Medical University (Ethical No. NFEC-2018-157). The participants [legal guardian/next of kin] provided written informed consent to participate in this study. The patients/participants provided their written informed consent to participate in this study.
Author contributions
GT, ZL, and YB conceived the project. PP, JL, and XL implemented the experiments. BW, CX, and YH analyzed the data. XS, HY, and LFC prepared the figures. XT, HW, and LYC prepared the data and performed literature search. PP, JL, and BW wrote the manuscript. All authors contributed to the article and approved the submitted version.
Conflict of interest
The authors BW, XS, XL, CX, LFC, and LYC was employed by the company Geneis Beijing Co., Ltd. The authors YH, HW, and GT was employed by the company Boke Biotech Co., Ltd.
The remaining authors declare that the research was conducted in the absence of any commercial or financial relationships that could be construed as a potential conflict of interest.
Publisher’s note
All claims expressed in this article are solely those of the authors and do not necessarily represent those of their affiliated organizations, or those of the publisher, the editors and the reviewers. Any product that may be evaluated in this article, or claim that may be made by its manufacturer, is not guaranteed or endorsed by the publisher.
Supplementary material
The Supplementary Material for this article can be found online at: https://www.frontiersin.org/articles/10.3389/fonc.2023.1067849/full#supplementary-material
References
1. Cronin KA, Lake AJ, Scott S, Sherman RL, Noone A, Howlader N, et al. Annual report to the nation on the status of cancer, part I: national cancer statistics. Wiley-Blackwell Online Open (2018) 124(13):2785–800. doi: 10.1002/cncr.31551
2. Siegel RL, Miller KD, Jemal A. Cancer statistics, 2020. CA: A Cancer J Clin (2020) 70(1):7–30. doi: 10.3322/caac.21590
3. He B, Zhang Y, Zhou Z, Wang B, Liang Y, Lang J, et al. A neural network framework for predicting the tissue-of-Origin of 15 common cancer types based on RNA-seq data. Front bioengineering Biotechnol (2020) 8:737. doi: 10.3389/fbioe.2020.00737
4. Gao J, Zhang L, Yu G, Qu G, Li Y, Yang X. Model with the GBDT for colorectal adenoma risk diagnosis. Curr Bioinf (2020) 15(9):971–9. doi: 10.2174/1574893614666191120142005
5. Han Y, Cheng L, Sun W. Analysis of protein-protein interaction networks through computational approaches. Protein Pept Lett (2020) 27(4):265–78. doi: 10.2174/0929866526666191105142034
6. Xia Y, Li X, Sun W. Applications of recombinant adenovirus-p53 gene therapy for cancers in the clinic in China. Curr Gene Ther (2020) 20(2):127–41. doi: 10.2174/1566523220999200731003206
7. Peng P, Luan Y, Sun P, Wang L, Zeng X, Wang Y, et al. Prognostic factors in stage IV colorectal cancer patients with resection of liver and/or pulmonary metastases: a population-based cohort study. Front Oncol (2022) 12:850937. doi: 10.3389/fonc.2022.850937
8. Chen S, Zhao Y, Shen F, Long D, Yu T, Lin X. Introduction of exogenous wildtype p53 mediates the regulation of oncoprotein 18/stathmin signaling via nuclear factorkappaB in nonsmall cell lung cancer NCIH1299 cells. Oncol Rep (2019) 41(3):2051–9. doi: 10.3892/or.2019.6964
9. Chen S, Chen Y, Yu L, Hu X. Overexpression of SOCS4 inhibits proliferation and migration of cervical cancer cells by regulating JAK1/STAT3 signaling pathway. Eur J Gynaecological Oncol (2021) 42(3):554–60. doi: 10.31083/j.ejgo.2021.03.2416
10. Fearon ER, Vogelstein B. A genetic model for colorectal tumorigenesis. Cell (1990) 61(5):759–67. doi: 10.1016/0092-8674(90)90186-I
11. Cheng L, Qi C, Yang H, Lu M, Cai Y, Fu T, et al. gutMGene: a comprehensive database for target genes of gut microbes and microbial metabolites. Nucleic Acids Res (2021) 50(D1):D795–800. doi: 10.1093/nar/gkab786
12. Hong J, Lin X, Hu X, Wu X, Fang W. A five-gene signature for predicting the prognosis of colorectal cancer. Curr Gene Ther (2021) 21(4):280–9. doi: 10.2174/1566523220666201012151803
13. Shi X, Young S, Cai K, Yang J, Morahan G. Cancer susceptibility genes: update and systematic perspectives. Innovation (Camb) (2022) 3(5):100277. doi: 10.1016/j.xinn.2022.100277
14. He B, Wang K, Xiang J, Bing P, Tang M, Tian G, et al. DGHNE: network enhancement-based method in identifying disease-causing genes through a heterogeneous biomedical network. Briefings Bioinf (2022) 23(6):bbac405. doi: 10.1093/bib/bbac405
15. Druliner BR, Wang P, Bae T, Baheti S, Slettedahl S, Mahoney D, et al. Molecular characterization of colorectal adenomas with and without malignancy reveals distinguishing genome, transcriptome and methylome alterations. Sci Rep (2018) 8(1):3161. doi: 10.1038/s41598-018-21525-4
16. Qu KY, Gao F, Guo F, Zou Q. Taxonomy dimension reduction for colorectal cancer prediction. Comput Biol Chem (2019) 83:107160. doi: 10.1016/j.compbiolchem.2019.107160
17. Cienfuegos-Jimenez O, Vazquez-Garza E, Rojas-Martinez A. CAR-NK cells for cancer therapy: molecular redesign of the innate antineoplastic response. Curr Gene Ther (2021) 22(4):303–18. doi: 10.2174/1566523222666211217091724
18. Song Z, Chen X, Shi Y, Huang R, Wang W, Zhu K, et al. Evaluating the potential of T cell receptor repertoires in predicting the prognosis of resectable non-small cell lung cancers. Mol Ther Methods Clin Dev (2020) 18:73–83. doi: 10.1016/j.omtm.2020.05.020
19. Liu H, Qiu C, Wang B, Bing P, Tian G, Zhang X, et al. Evaluating DNA methylation, gene expression, somatic mutation, and their combinations in inferring tumor tissue-of-Origin. Front Cell Dev Biol (2021) 9:619330. doi: 10.3389/fcell.2021.619330
20. He B, Lang J, Wang B, Liu X, Lu Q, He J, et al. TOOme: a novel computational framework to infer cancer tissue-of-Origin by integrating both gene mutation and expression. Front bioengineering Biotechnol (2020) 8:394. doi: 10.3389/fbioe.2020.00394
21. Sahu R, Pattanayak SP. Strategic developments & future perspective on gene therapy for breast cancer: role of mTOR and Brk/PTK6 as molecular targets. Curr Gene Ther (2020) 20(4):237–58. doi: 10.2174/1566523220999200731002408
22. Wang X, Zheng Z, Zhu H, Yu Q, Huang S, Lu X, et al. Timing to achieve the best recurrence-free survival after neoadjuvant chemoradiotherapy in locally advanced rectal cancer: experience in a large-volume center in China. Int J colorectal Dis (2021) 36(5):1007–16. doi: 10.1007/s00384-020-03829-y
23. Lin SH, Raju GS, Huff C, Ye Y, Gu J, Chen JS, et al. The somatic mutation landscape of premalignant colorectal adenoma. Gut (2018) 67(7):1299–305. doi: 10.1136/gutjnl-2016-313573
24. Gong D, Wu L, Zhang J, Mu G, Yu. H. Hepatology: detection of colorectal adenomas with a real-time computer-aided system (ENDOANGEL): a randomised controlled study. Lancet Gastroenterol Hepatol (2020) 5(4):352–61. doi: 10.1016/S2468-1253(19)30413-3
25. Sandler RS, Halabi S, Baron JA, Budinger S, Paskett E, Keresztes R, et al. A randomized trial of aspirin to prevent colorectal adenomas in patients with previous. Eur J Gastroenterol (2003) 15(5):579–80. doi: 10.1097/00042737-200305000-00032
26. Okabayashi K, Ashrafian H, Hasegawa H, Yoo JH, Patel VM, Harling L, et al. Body mass index category as a risk factor for colorectal adenomas: a systematic review and meta-analysis. Am J Gastroenterol (2012) 107(8):1175–85. doi: 10.1038/ajg.2012.180
27. Yang J, Qiu J, Wang K, Zhu L, Fan J, Zheng D, et al. Using molecular functional networks to manifest connections between obesity and obesity-related diseases. Oncotarget (2017) 8(49):85136–49. doi: 10.18632/oncotarget.19490
28. Komor MA, Linda JB, Gergana B, Bolijn AS, Delis V, Christian R, et al. Consensus molecular subtype classification of colorectal adenomas. J Pathol (2018) 246(3):266–76. doi: 10.1002/path.5129
29. Sabates-Bellver J, Van D, Palo MD, Cattaneo E, Maake C, Rehrauer H, et al. Transcriptome profile of human colorectal adenomas. Mol Cancer Res (2007) 5(12):1263–75. doi: 10.1158/1541-7786.MCR-07-0267
30. Graham LD, Pedersen SK, Brown GS, Ho T, Molloy PL. Colorectal neoplasia differentially expressed (CRNDE), a novel gene with elevated expression in colorectal adenomas and adenocarcinomas. Genes Cancer (2011) 2(8):829–40. doi: 10.1177/1947601911431081
31. Cheng L, Hu Y, Sun J, Zhou M, Jiang Q. DincRNA: a comprehensive web-based bioinformatics toolkit for exploring disease associations and ncRNA function. Bioinformatics (2018) 34(11):1953–6. doi: 10.1093/bioinformatics/bty002
32. Shen XJ, Rawls JF, Randall TA, Burcall L, Mpande C, Jenkins N, et al. Molecular characterization of mucosal adherent bacteria and associations with colorectal adenomas. Gut Microbes (2010) 1(3):138–47. doi: 10.4161/gmic.1.3.12360
33. Zhao T, Hu Y, Zang T, Cheng L. MRTFB regulates the expression of NOMO1 in colon. Proc Natl Acad Sci U.S.A. (2020) 117(14):7568–9. doi: 10.1073/pnas.2000499117
34. Han SW, Hwang-Phill K, Jong-Yeon S, Eun-Goo J, Won-Chul L, Kyung-Hun L, et al. Targeted sequencing of cancer-related genes in colorectal cancer using next-generation sequencing. PloS One (2013) 8(5):e64271. doi: 10.1371/journal.pone.0064271
35. Yang J, Hagen J, Guntur KV, Allette K, Schuyler S, Ranjan J, et al. Et al. a next generation sequencing based approach to identify extracellular vesicle mediated mRNA transfers between cells. BMC Genomics (2017) 18(1):987. doi: 10.1186/s12864-017-4359-1
37. Beaubier N, Bontrager M, Huether R, Igartua C, Lau D, Tell R, et al. Integrated genomic profiling expands clinical options for patients with cancer. Nat Biotechnol (2019) 37(11):1351–60. doi: 10.1038/s41587-019-0259-z
38. Li W, Guo L, Liu Y, Dong L, Yang L, Chen L, et al. Potential unreliability of uncommon ALK, ROS1, and RET genomic breakpoints in predicting the efficacy of targeted therapy in NSCLC. J Thorac Oncol Off Publ Int Assoc Study Lung Cancer (2021) 16(3):404–18. doi: 10.1016/j.jtho.2020.10.156
39. Dagogo-Jack I, Shaw AT. Tumour heterogeneity and resistance to cancer therapies. Nat Rev Clin Oncol (2018) 15(2):81–94. doi: 10.1038/nrclinonc.2017.166
40. Song Z, Xu C, He Y, Li F, Wang W, Zhu Y, et al. Et al. simultaneous detection of gene fusions and base mutations in cancer tissue biopsies by sequencing dual nucleic acid templates in unified reaction. Clin Chem (2020) 66(1):178–87. doi: 10.1373/clinchem.2019.308833
41. Chakravarty D, Gao J, Phillips SM, Kundra R, Zhang H, Wang J, et al. OncoKB: a precision oncology knowledge base. JCO Precis Oncol (2017) 2017:PO.17.00011. doi: 10.1200/PO.17.00011
42. Forbes SA, Bindal N, Bamford S, Cole C, Kok CY, Beare D, et al. COSMIC: mining complete cancer genomes in the catalogue of somatic mutations in cancer. Nucleic Acids Res (2011) 39(Database issue):D945–950. doi: 10.1093/nar/gkq929
43. Tomczak K, Czerwińska P, Wiznerowicz M. The cancer genome atlas (TCGA): an immeasurable source of knowledge. Contemp Oncol (Poznan Poland) (2015) 19(1a):A68–77. doi: 10.5114/wo.2014.47136
44. Nieuwenhuis MH, Vasen HF. Correlations between mutation site in APC and phenotype of familial adenomatous polyposis (FAP): a review of the literature. Crit Rev oncology/hematology (2007) 61(2):153–61. doi: 10.1016/j.critrevonc.2006.07.004
45. Laken SJ, Petersen GM, Gruber SB, Oddoux C, Ostrer H, Giardiello FM, et al. Et al. familial colorectal cancer in ashkenazim due to a hypermutable tract in APC. Nat Genet (1997) 17(1):79–83. doi: 10.1038/ng0997-79
46. Xu Z, Xiang L, Wang R, Xiong Y, Zhou H, Gu H. Bioinformatic analysis of immune significance of RYR2 mutation in breast cancer. Biomed Res Int (2021) 2021:8072796. doi: 10.1155/2021/8072796
47. Nakayama M, Oshima M. Mutant p53 in colon cancer. J Mol Cell Biol (2019) 11(4):267–76. doi: 10.1093/jmcb/mjy075
48. Donehower LA, Soussi T, Korkut A, Liu Y, Schultz A, Cardenas M, et al. Integrated analysis of TP53 gene and pathway alterations in the cancer genome atlas. Cell Rep (2019) 28(5):1370–1384.e1375. doi: 10.1016/j.celrep.2019.07.001
49. Silwal-Pandit L, Langerød A, Børresen-Dale AL. TP53 mutations in breast and ovarian cancer. Cold Spring Harbor Perspect Med (2017) 7(1):a026252. doi: 10.1101/cshperspect.a026252
50. He B, Dai C, Lang J, Bing P, Tian G, Wang B, et al. A machine learning framework to trace tumor tissue-of-origin of 13 types of cancer based on DNA somatic mutation. Biochim Biophys Acta (BBA) - Mol Basis Dis (2020) 1866(11):165916. doi: 10.1016/j.bbadis.2020.165916
51. Shirian FI, Ghorbani M, Khamseh ME, Imani M, Panahi M, Alimohammadi A, et al. Up-regulation of sex-determining region y-box 9 (SOX9) in growth hormone-secreting pituitary adenomas. BMC Endocr Disord (2021) 21(1):50. doi: 10.1186/s12902-021-00720-x
52. Reyes-León A, Ramírez-Martínez M, Fernández-García D, Amaro-Muñoz D, Velázquez-Aragón JA, Salas-Labadía C, et al. Variants in ARID5B gene are associated with the development of acute lymphoblastic leukemia in Mexican children. Ann Hematol (2019) 98(10):2379–88. doi: 10.1007/s00277-019-03730-x
53. Zhang Z, Pang J, Chen L, Chen J, Li J, Liu H, et al. Pan-tropomyosin receptor kinase immunohistochemistry is a feasible routine screening strategy for NTRK fusions in mismatch repair-deficient colorectal carcinomas. Hum Pathol (2022) 129:21–31. doi: 10.1016/j.humpath.2022.08.001
54. Silvertown JD, Lisle C, Semenuk L, Knapp C, Jaynes J, Berg D, et al. Prevalence of NTRK fusions in Canadian solid tumour cancer patients. Mol diagnosis Ther (2023) 27(1):87–103. doi: 10.1007/s40291-022-00617-y
55. Wu S, Liu Y, Shi X, Zhou W, Zeng X. Elaboration of NTRK-rearranged colorectal cancer: integration of immunoreactivity pattern, cytogenetic identity, and rearrangement variant. Digestive liver Dis Off J Ital Soc Gastroenterol Ital Assoc Study Liver (2023), S1590-8658(23)00578-9. doi: 10.1016/j.dld.2023.04.019
56. Love MI, Huber W, Anders S. Moderated estimation of fold change and dispersion for RNA-seq data with DESeq2. Genome Biol (2014) 15(12):550. doi: 10.1186/s13059-014-0550-8
57. Kim N, Gim J-A, Lee BJ, Choi Bi, Park SB, Yoon HS, et al. RNA-Sequencing identification and validation of genes differentially expressed in high-risk adenoma, advanced colorectal cancer, and normal controls. Funct Integr Genomics (2021) 21(3):513–21. doi: 10.1007/s10142-021-00795-8
58. Breiman LI, Friedman JH, Stone CJ, Olshen RA, et al. Classification and regression trees. Biometrics, (1984) 40(3):358. doi: 10.2307/2530946
59. Liu S, Cao X, Li J, Liu J. ZNF503 combined with GATA3 is a prognostic factor in triple-negative breast cancer. Biomarkers Biochem Indic exposure response susceptibility to chemicals (2023) 17:1–11. doi: 10.1080/1354750X.2023.2201665
60. DiDonna SC, Nagornyuk A, Adhikari N, Takada M, Takaku M. P4HTM: a novel downstream target of GATA3 in breast cancer. Res square (2023), rs.3.rs-2622989. doi: 10.21203/rs.3.rs-2622989/v1
61. Li B, Qu H, Zhang J, Pan W, Liu M, Yan X, et al. Genomic characterization and outcome evaluation of kinome fusions in lung cancer revealed novel druggable fusions. NPJ Precis Oncol (2021) 5(1):81. doi: 10.1038/s41698-021-00221-z
62. Guo W, Liang J, Zhang D, Huang X, Lv Y. Lung adenocarcinoma harboring complex EML4-ALK fusion and BRAF V600E co-mutation responded to alectinib. Medicine (2022) 101(40):e30913. doi: 10.1097/MD.0000000000030913
63. Mayakonda A, Lin DC, Assenov Y, Plass C, Koeffler HP. Maftools: efficient and comprehensive analysis of somatic variants in cancer. Genome Res (2018) 28(11):1747–56. doi: 10.1101/gr.239244.118
64. Xu H, Wu X, Sun D, Li S, Zhang S, Teng M, et al. SEGF: a novel method for gene fusion detection from single-end next-generation sequencing data. Genes (Basel) (2018) 9(7):331. doi: 10.3390/genes9070331
65. Leek JT, Johnson WE, Parker HS, Jaffe AE, Storey JD. The sva package for removing batch effects and other unwanted variation in high-throughput experiments. Bioinformatics (2012) 28(6):882–3. doi: 10.1093/bioinformatics/bts034
66. Oksanen J, Guillaume Blanchet F, Friendly M, Kindt R, Legendre P, McGlinn PR, et al. vegan: Community Ecology Package. R package version 2.5-5. (2019) https://CRAN.R-project.org/package=vegan
67. Swami A, Jain R. Scikit-learn: Machine Learning in Python. J Mach Learn Res, (2013), 12(10):2825–2830. doi: 10.1524/auto.2011.0951
68. Virtanen P, Gommers R, Oliphant TE, Haberland M, Reddy T, Cournapeau D, et al. Et al. SciPy 1.0: fundamental algorithms for scientific computing in Python. Nat Methods (2020) 17(3):261–72. doi: 10.1038/s41592-019-0686-2
69. Seabold S, Perktold J. Statsmodels: econometric and statistical modeling with Python. Proceedings of the 9th Python in Science Conference (2010). doi: 10.25080/Majora-92bf1922-011
70. Feng X, Arang N, Rigiracciolo DC, Lee JS, Gutkind JS. A platform of synthetic lethal gene interaction networks reveals that the GNAQ uveal melanoma oncogene controls the hippo pathway through FAK. Cancer Cell (2019) 35(3):457–472.e455. doi: 10.1016/j.ccell.2019.01.009
71. Van Raamsdonk CD, Griewank KG, Crosby MB, Garrido MC, Vemula S, Wiesner T, et al. Mutations in GNA11 in uveal melanoma. N Engl J Med, (2010) 363(23):2191–9. doi: 10.1056/NEJMoa1000584
72. Boutin AT, Liao WT, Wang M, Hwang SS, Depinho RA. Oncogenic kras drives invasion and maintains metastases in colorectal cancer. Genes Dev (2017) 31(4):370–82. doi: 10.1101/gad.293449.116
73. Huang D, Sun W, Zhou Y, Li P, Chen F, Chen H, et al. Mutations of key driver genes in colorectal cancer progression and metastasis. Cancer Metastasis Rev (2018) 37(1):173–87. doi: 10.1007/s10555-017-9726-5
74. Marchio C, Scaltriti M, Ladanyi M, Iafrate AJ, Bibeau F, Dietel M, et al. ESMO recommendations on the standard methods to detect NTRK fusions in daily practice and clinical research. Ann Oncol Off J Eur Soc Med Oncol (2019) 30(9):1417–27. doi: 10.1093/annonc/mdz204
75. Hechtman JF, Benayed R, Hyman DM, Drilon A, Zehir A, Frosina D, et al. Pan-trk immunohistochemistry is an efficient and reliable screen for the detection of NTRK fusions. Am J Surg Pathol (2017) 41(11):1547–51. doi: 10.1097/PAS.0000000000000911
76. Liu X, Li L, Peng L, Wang B, Lang J, Lu Q, et al. Predicting cancer tissue-of-Origin by a machine learning method using DNA somatic mutation data. Front Genet (2020) 11:674. doi: 10.3389/fgene.2020.00674
77. Liang Y, Wang H, Yang J, Li X, Dai C, Shao P, et al. A deep learning framework to predict tumor tissue-of-Origin based on copy number alteration. Front bioengineering Biotechnol (2020) 8:701. doi: 10.3389/fbioe.2020.00701
78. Hanko M, Grendár M, Snopko P, Opšenák R, Šutovský J, Benčo M, et al. Random forest-based prediction of outcome and mortality in patients with traumatic brain injury undergoing primary decompressive craniectomy. World Neurosurg (2021) 148:e450–8. doi: 10.1016/j.wneu.2021.01.002
79. Hong W, Zhou X, Jin S, Lu Y, Pan J, Lin Q, et al. A comparison of XGBoost, random forest, and nomograph for the prediction of disease severity in patients with COVID-19 pneumonia: implications of cytokine and immune cell profile. Front Cell infection Microbiol (2022) 12:819267. doi: 10.3389/fcimb.2022.819267
80. Yang J, Ju J, Guo L, Ji B, Shi S, Yang Z, et al. Prediction of HER2-positive breast cancer recurrence and metastasis risk from histopathological images and clinical information via multimodal deep learning. Comput Struct Biotechnol J (2022) 20:333–42. doi: 10.1016/j.csbj.2021.12.028
81. Yang M, Yang H, Ji L, Hu X, Tian G, Wang B, et al. A multi-omics machine learning framework in predicting the survival of colorectal cancer patients. Comput Biol Med (2022) 146:105516. doi: 10.1016/j.compbiomed.2022.105516
82. Yuan X, Wang Z, Li C, Lv K, Tian G, Tang M, et al. Bacterial biomarkers capable of identifying recurrence or metastasis carry disease severity information for lung cancer. Front Microbiol (2022) 13:1007831. doi: 10.3389/fmicb.2022.1007831
83. Huang K, Lin B, Liu J, Liu Y, Li J, Tian G, et al. Predicting colorectal cancer tumor mutational burden from histopathological images and clinical information using multi-modal deep learning. Bioinformatics (2022) 38(22):btac641. doi: 10.1093/bioinformatics/btac641
84. Yao Y, Lv Y, Tong L, Liang Y, Xi S, Ji B, et al. ICSDA: a multi-modal deep learning model to predict breast cancer recurrence and metastasis risk by integrating pathological, clinical and gene expression data. Briefings Bioinf (2022) 23(6):bbac448c. doi: 10.1093/bib/bbac448
85. Zhu L, Zhang J, Zhang Y, Lang J, Xiang J, Bai X, et al. NAIGO: an improved method to align PPI networks based on gene ontology and graphlets. Front bioengineering Biotechnol (2020) 8:547. doi: 10.3389/fbioe.2020.00547
86. Xu J, Cai L, Liao B, Zhu W, Yang J. CMF-impute: an accurate imputation tool for single-cell RNA-seq data. Bioinformatics (2020) 36(10):3139–47. doi: 10.1093/bioinformatics/btaa109
87. Wang Z, Ding H, Zou Q. Identifying cell types to interpret scRNA-seq data: how, why and more possibilities. Briefings Funct Genomics (2020) 19(4):286–91. doi: 10.1093/bfgp/elaa003
88. Qi R, Ma A, Ma Q, Zou Q. Clustering and classification methods for single-cell RNA-sequencing data. Briefings Bioinf (2020) 21(4):1196–208. doi: 10.1093/bib/bbz062
Keywords: colorectal adenoma, colorectal cancer, multi-omics, random forest, monitor, screening
Citation: Pan P, Li J, Wang B, Tan X, Yin H, Han Y, Wang H, Shi X, Li X, Xie C, Chen L, Chen L, Bai Y, Li Z and Tian G (2023) Molecular characterization of colorectal adenoma and colorectal cancer via integrated genomic transcriptomic analysis. Front. Oncol. 13:1067849. doi: 10.3389/fonc.2023.1067849
Received: 15 October 2022; Accepted: 21 June 2023;
Published: 21 July 2023.
Edited by:
Li Min, Capital Medical University, ChinaReviewed by:
Tonghui Ma, Genetron Health Inc, ChinaYingwei Hu, Johns Hopkins University, United States
Marianna Caterino, University of Naples Federico II, Italy
Copyright © 2023 Pan, Li, Wang, Tan, Yin, Han, Wang, Shi, Li, Xie, Chen, Chen, Bai, Li and Tian. This is an open-access article distributed under the terms of the Creative Commons Attribution License (CC BY). The use, distribution or reproduction in other forums is permitted, provided the original author(s) and the copyright owner(s) are credited and that the original publication in this journal is cited, in accordance with accepted academic practice. No use, distribution or reproduction is permitted which does not comply with these terms.
*Correspondence: Geng Tian, dGlhbmdlbmdAYm9rZWJpb3RlY2guY29t; Zhaoshen Li, bGkuemhhb3NoZW5AaG90bWFpbC5jb20=; Yu Bai, YmFpeXUxOTk4QGhvdG1haWwuY29t
†These authors have contributed equally to this work