 Wei You
 Yitao Mao
 Xiao Jiao1
 Dongcui Wang
- 1Department of Radiology, Xiangya Hospital, Central South University, Changsha, China
- 2National Engineering Research Center of Personalized Diagnostic and Therapeutic Technology, Xiangya Hospital, Central South University, Changsha, China
- 3National Clinical Research Center for Geriatric Disorders, Xiangya Hospital, Central South University, Changsha, China
- 4Molecular Imaging Research Center, Central South University, Changsha, China
Background and Purpose: Radiomics features and The Visually AcceSAble Rembrandt Images (VASARI) standard appear to be quantitative and qualitative evaluations utilized to determine glioma grade. This study developed a preoperative model to predict glioma grade and improve the efficacy of clinical strategies by combining these two assessment methods.
Materials and Methods: Patients diagnosed with glioma between March 2017 and September 2018 who underwent surgery and histopathology were enrolled in this study. A total of 3840 radiomic features were calculated; however, using the least absolute shrinkage and selection operator (LASSO) method, only 16 features were chosen to generate a radiomic signature. Three predictive models were developed using radiomic features and VASARI standard. The performance and validity of models were evaluated using decision curve analysis and 10-fold nested cross-validation.
Results: Our study included 102 patients: 35 with low-grade glioma (LGG) and 67 with high-grade glioma (HGG). Model 1 utilized both radiomics and the VASARI standard, which included radiomic signatures, proportion of edema, and deep white matter invasion. Models 2 and 3 were constructed with radiomics or VASARI, respectively, with an area under the receiver operating characteristic curve (AUC) of 0.937 and 0.831, respectively, which was less than that of Model 1, with an AUC of 0.966.
Conclusion: The combination of radiomics features and the VASARI standard is a robust model for predicting glioma grades.
Introduction
Glioma, one of the most common central nervous system tumors (CNS), has a five-year survival rate of less than 5% and is widely recognized as a highly malignant tumor (1, 2). According to the WHO classification of brain tumors, pathology and clinical practices typically divide gliomas into low and high grades (3, 4). The prognosis of glioma patients would be improved by timely and accurate preoperative diagnosis (2). The primary treatment for gliomas is surgical resection followed by radiotherapy or chemotherapy (5). As a non-invasive technique, MRI will likely be utilized in the clinical setting to detect glioma and its clinical grade early and reduce misdiagnosis (6). When developing clinical strategies for patients suspected of having glioma, conventional MRI sequences, such as T1-weighted, contrast-enhanced T1-weighted MR images, T2-weighted, and fluid-attenuated inversion recovery (7) are frequently employed.
Recent neoplasia research (8–10) has extensively used radiomics as a promising method for evaluating tumor characteristics. This semiautomatic method can quantify the high-dimensional imaging features of glioma by extracting the radiomic features from conventional medical images and combining these features with other clinical information to design a machine-learning model, which will improve the accuracy and efficiency of clinical decisions (11–14). In contrast to the tumor phenotype and microenvironment provided by clinical reports and histopathology, this information is based on intensity, shape, size, volume, and texture (15). Park et al. (16) extracted radiomic features from multiparametric MRI to predict LGGs and a subgroup of LGGs without enhancement. In the internal validation set, the area under the receiver operating characteristic curve (AUC) was 0.85 and 0.82, indicating the best performance. Mao et al. (17) predicted glioma grade using an artificial neural network model based on image data. The model had a means accuracy of 90.32%, sensitivity of 87.86%, and specificity of 92.49%. With the exponential growth of medical image analysis, radiomics is increasingly used to detect cancer, evaluate prognosis and treatment, and monitor tumor status. Glioma grade has been the subject of much research; however, it is still of utmost importance because of its relevance to clinical treatment and pre-surgical strategies.
Visually AcceSAble Rembrandt Images (VASARI) features of glioma have 25 qualitative features for human gliomas in particular (18). On standard pre- and post-contrast-enhanced MRI, these features represent common characteristics of primary cerebral neoplasia and are described using standardized terminology. Chen et al. (19) combined radiomics with qualitative features (VASARI annotations and T2-FLAIR mismatch signs) to predict molecular subtypes in patients with lower-grade glioma. The AUC of the model containing radiomics and qualitative features was higher than the AUC of the model containing radiomics alone, with 0.8623 versus 0.6557. Cao et al. (20) demonstrated that the AUC of the IDH1 mutation predictive model with VASARI features alone was approximately 0.827 in the training group; however, in the fusion model with optimal VASARI and radiomics features, the AUC improved to 0.879, with an accuracy of 0.771, exceeding that of the model with VASARI alone (approximately 0.726). Therefore, a fusion model combining radiomics and VASARI features would better predict glioma grade than either model alone.
Our study aimed to determine the impact of VASARI features on the basics of radiomics and whether the introduction of VASARI features adds predictive value to glioma grade. The research was conducted exclusively at Xiangya Hospital.
Materials and methods
Patients
The Medical Ethics Committee of our institution provided Ethical approval, followed by the informed consent principle. From March 2017 to September 2018, 102 patients who met the following criteria were enrolled in this study: pathologic diagnosis of glioma without prior treatment and MR data free of severe artifacts. Medical records were extracted from an institutional database. Our institutional Ethics Committee and Review Board approved this retrospective study. Written informed consent was waived owing to the retrospective nature of this investigation. Additional information regarding the patient recruitment procedure and exclusion criteria is presented in Figure 1.
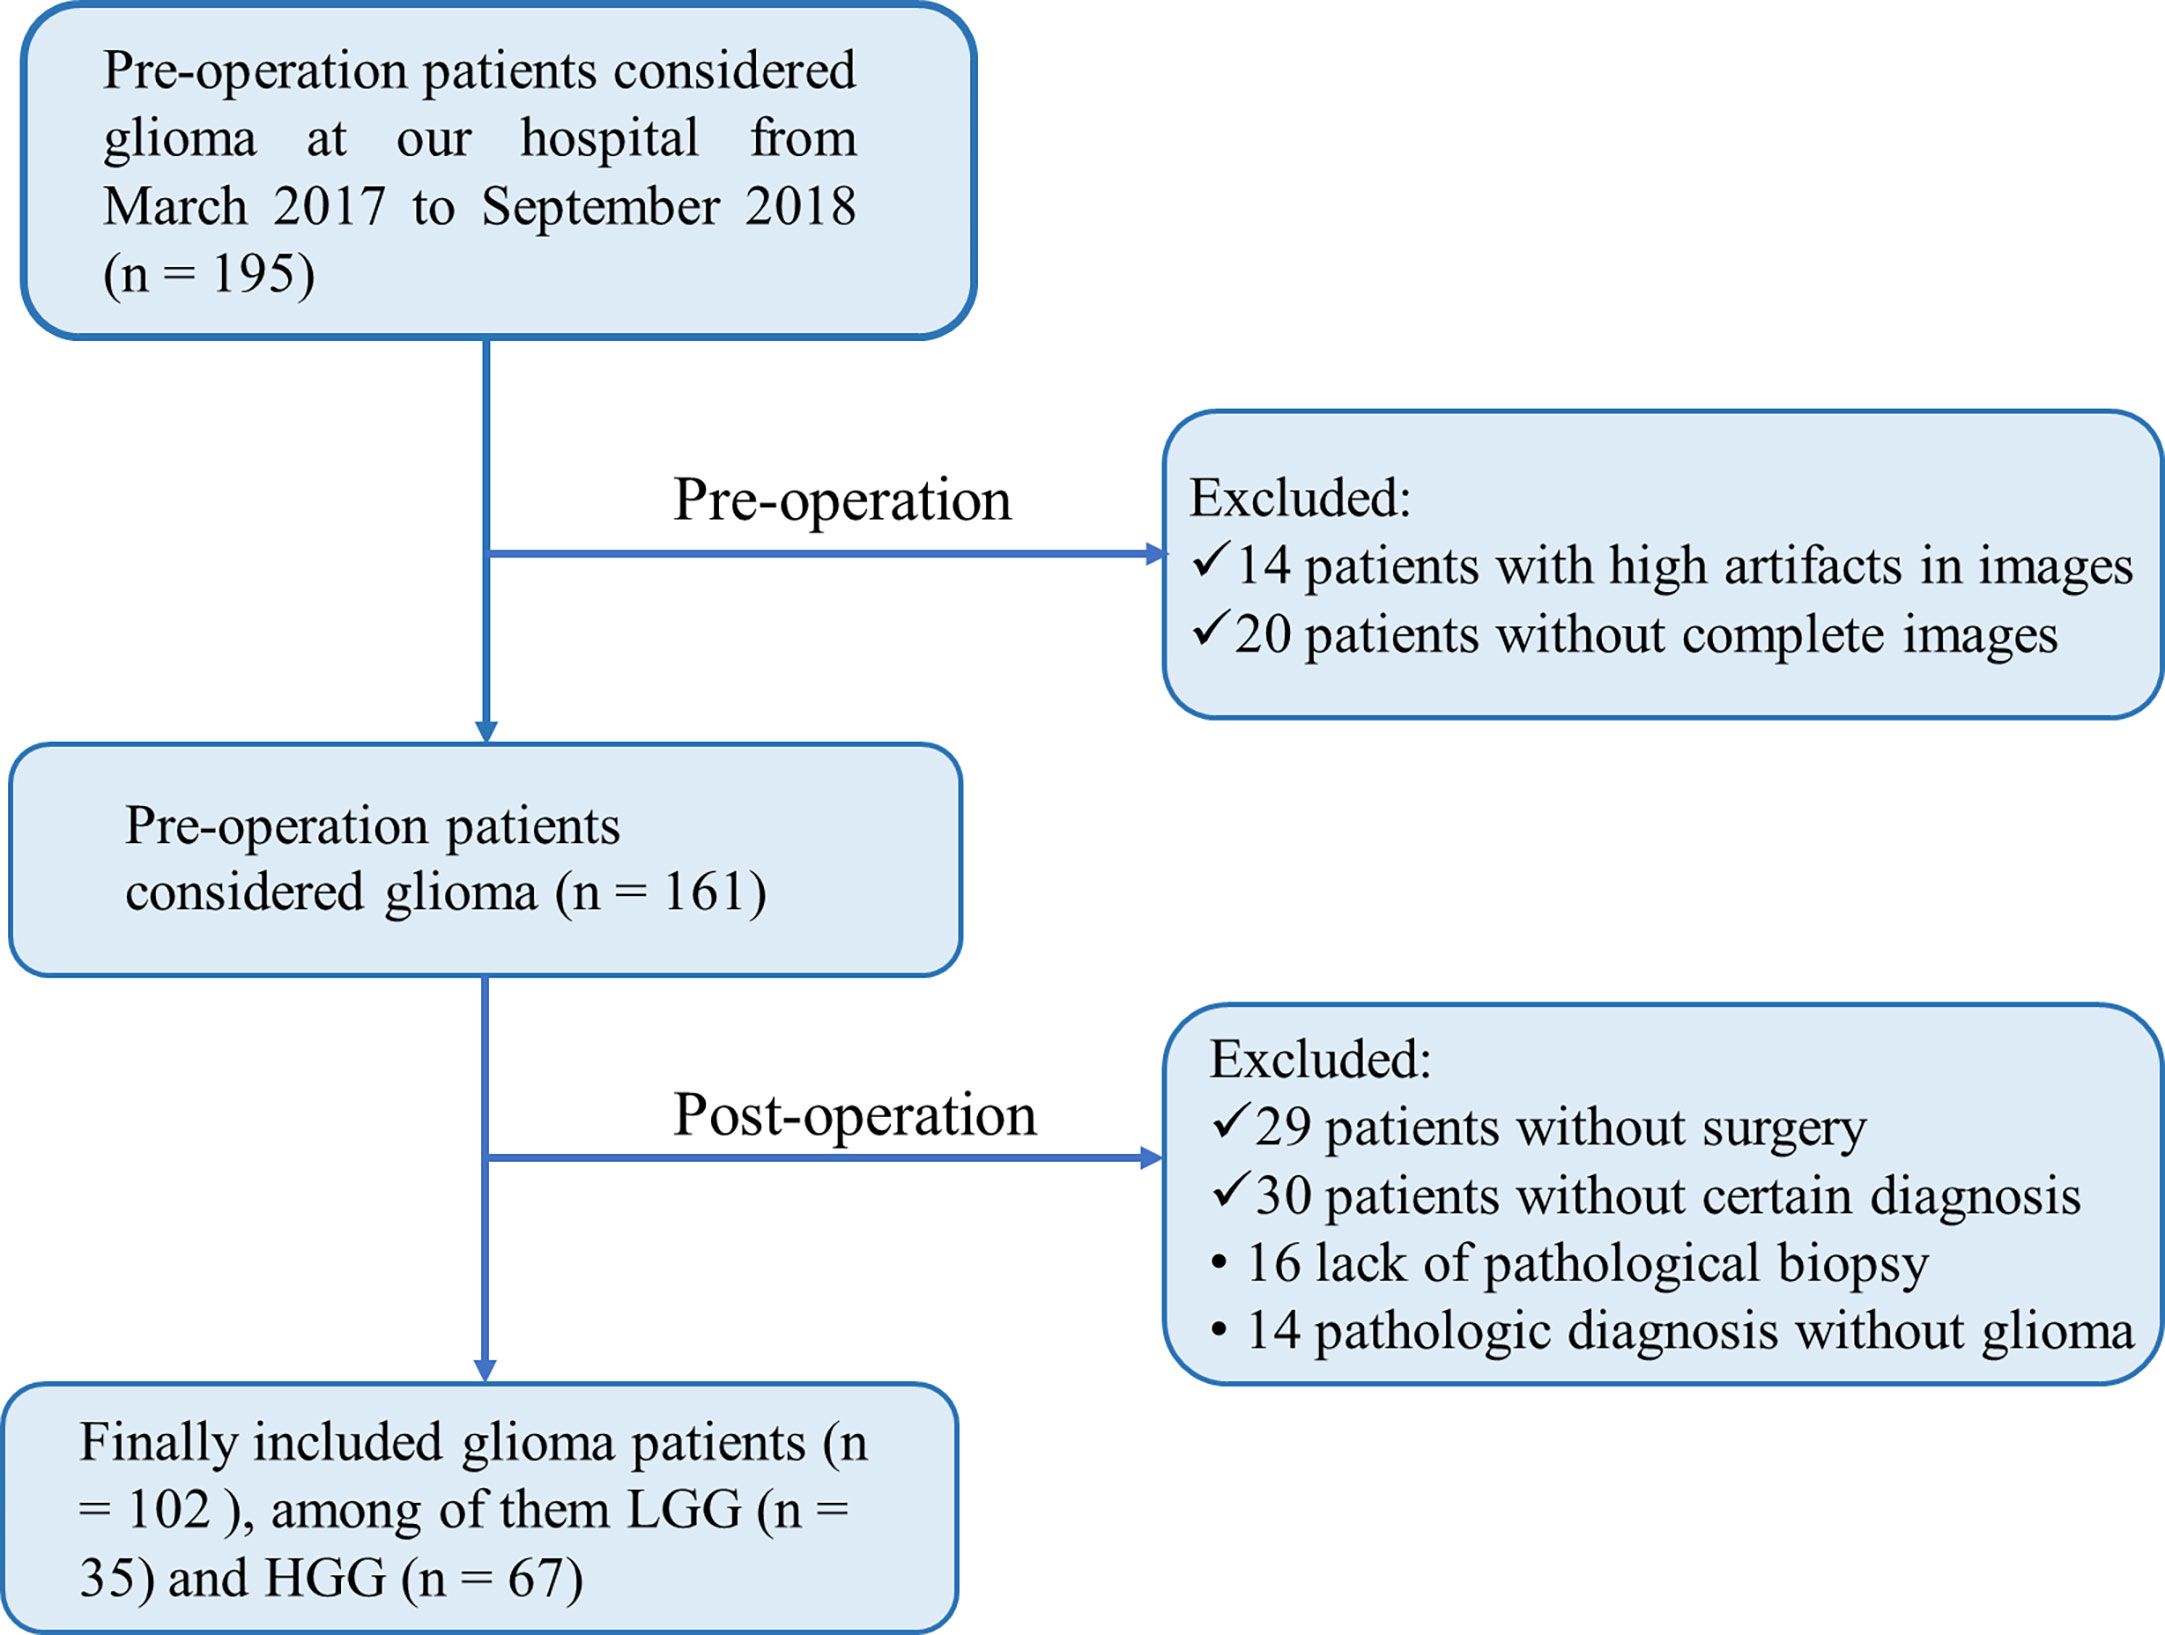
Figure 1 Flowchart of inclusion and exclusion process for patients to be enrolled.
Pathological re-assessment
The paraffin-embedded surgical specimens were re-assessed by two experienced pathologists at our institution (with over 10 and 15 years of experience, respectively) in tumor imaging diagnosis of the central nervous system (CNS), using the 2021 WHO classification of CNS tumors (4).
Image acquisition
Untreated glioma patients underwent MRI using a 3.0-T imaging unit (Siemens, Erlangen, Germany) and a 64-channel receiver head coil. In the transverse plane, spoiled gradient-recalled images were used to acquire T1-weighted anatomic images (T1WI), T2-weighted anatomic images (T2WI), and fluid-attenuated inversion recovery (FLAIR). Dynamic gadodiamide (SFDA approval number J20100063, produced by GE Healthcare Ireland) high-resolution, three-dimensional magnetization-prepared rapid acquisition with gradient-echo sequences (3D-T1-MPRAGE) were used to perform 10 ml contrast material-enhanced MRI on patients.
Image segmentation
Segmentation of regions of interest (ROI) was performed on the T1WI, T2WI, FLAIR, and contrast-enhanced 3D-T1-MPRAGE images. Using ITK-SNAP (21) (http://www.itksnap.org), two experienced radiologists (reader 1 and 2, with more than ten years of experience in neuroimaging) manually delineated the tumor boundaries slice-by-slice. The two radiologists were blinded to the patient information, including radiological and clinicopathological data. Fifty patients were randomly selected to evaluate the inter-observer (reader 1 versus reader 2) and intra-observer (reader 1 twice at intervals of four weeks) correlation coefficient (ICC). Generally, consistency was indicated by an ICC greater than 0.75. For the randomly selected 50 patients, the first segmentation of reader 1 was used. The ROI contouring work of the remaining patients was completed only by reader 1. The tumor ROIs were manually delineated on T1WI, T2WI, FLAIR, and contrast-enhanced 3D-T1-MPRAGE images, and only the axial direction was involved in ROI contouring.
Radiomic feature selection
The radiomic features were extracted using PyRadiomics in Python (version. 3.7, https://www.python.org/). Extracted features included Shape, first-order intensity statistics, Gray Level Co-occurrence Matrix, Gray Level Size Zone Matrix, Gray Level Run Length Matrix, Gray Level Dependence Matrix, logarithm, and Wavelet. Features with ICC values less than or equal to 0.75 were supposed to be excluded from further analyses. Using the least absolute shrinkage and selection operator (LASSO) method (22), the most relevant radiomics features associated with glioma grading were determined. Z-score normalization was used as a preprocessing step for LASSO. Then, the weighted average method with the respective LASSO coefficients was used to linearly combine the most relevant features into a single index called radiomic signature (Rad-score). This Rad-score was deemed an independent variable, along with other image-related VASARI variables.
Clinical feature selection
Univariate and multivariate logistic regression were used to select the most relevant predictors (including Rad-score and the VASARI features) for high-grade glioma, with a p-value of 0.10 (for univariate logistic regression) and 0.05 (for multivariate logistic regression) as the significance level, respectively. In this study, logistic regression was utilized because its outputs were probabilities, which allowed subsequent calibration analysis, nomogram plotting, and decision curve analysis, which are required to comprehensively assess the performance of a predictive model. Two neuroradiologists assessed all VASARI imaging features on standard pre- and post-contrast-enhanced MRI with 8 and 12 years of experience on the open-source picture archiving and communication system (PACS) workstation. Disagreements were addressed through discussions.
Model assessment and validation
In this study, we assessed four aspects of a predictive model, i.e., robustness, discrimination, accuracy, and clinical applicability. The robustness of the model was evaluated by 10-fold nested cross-validation (with an outer loop of ten folds for test cohorts and an inner loop of nine folds for training and validation cohorts). The folds in this cross-validation were stratified, that is, similarly distributed for the positive and negative samples.
The area under the curve (AUC) of the receiver operating characteristic (ROC) curves was used as the performance index. The standard deviation of the ten AUCs was then calculated to assess the robustness (stability) of the model. The discrimination performance of the model was evaluated solely based on the AUC itself. The calibration curve assessed the accuracy of the model, which indicated the degree of agreement between the observed probabilities and model-predicted probabilities using a bootstrap method (1000 resampling iterations). The Hosmer-Lemeshow test was conducted to determine if the level of agreement was statistically significant (23). Clinical applicability was evaluated using a decision curve analysis, which quantitatively suggested whether the model would result in a net benefit for those patients who use it in clinical practice compared to arbitrary decisions (i.e., treat all patients or treat none) (24).
Statistical analysis
All statistical analyses were conducted with R software version 4.0.2 (http://www.Rproject.org) using the following packages: “glmnet,” “rms,” “pROC,” “rmda,” and “broom.” The “glmnet” was used to execute the LASSO method. A nomogram was created using the “rms” function. The AUCs of different ROC curves were compared using the deLong test (25) in “pROC” package. Calibration was assessed using R software, with the “calibrate” function in R package “rms”. The Hosmer-Lemeshow test (23) was used to determine the significance of the calibration curve. All statistical tests were two-sided, and the p-value of statistical significance was set to 0.05, except for the univariate logistic regression used to screen out potential variables, for which the p-value was set to 0.10. The workflow of this study is illustrated in Figure 2.
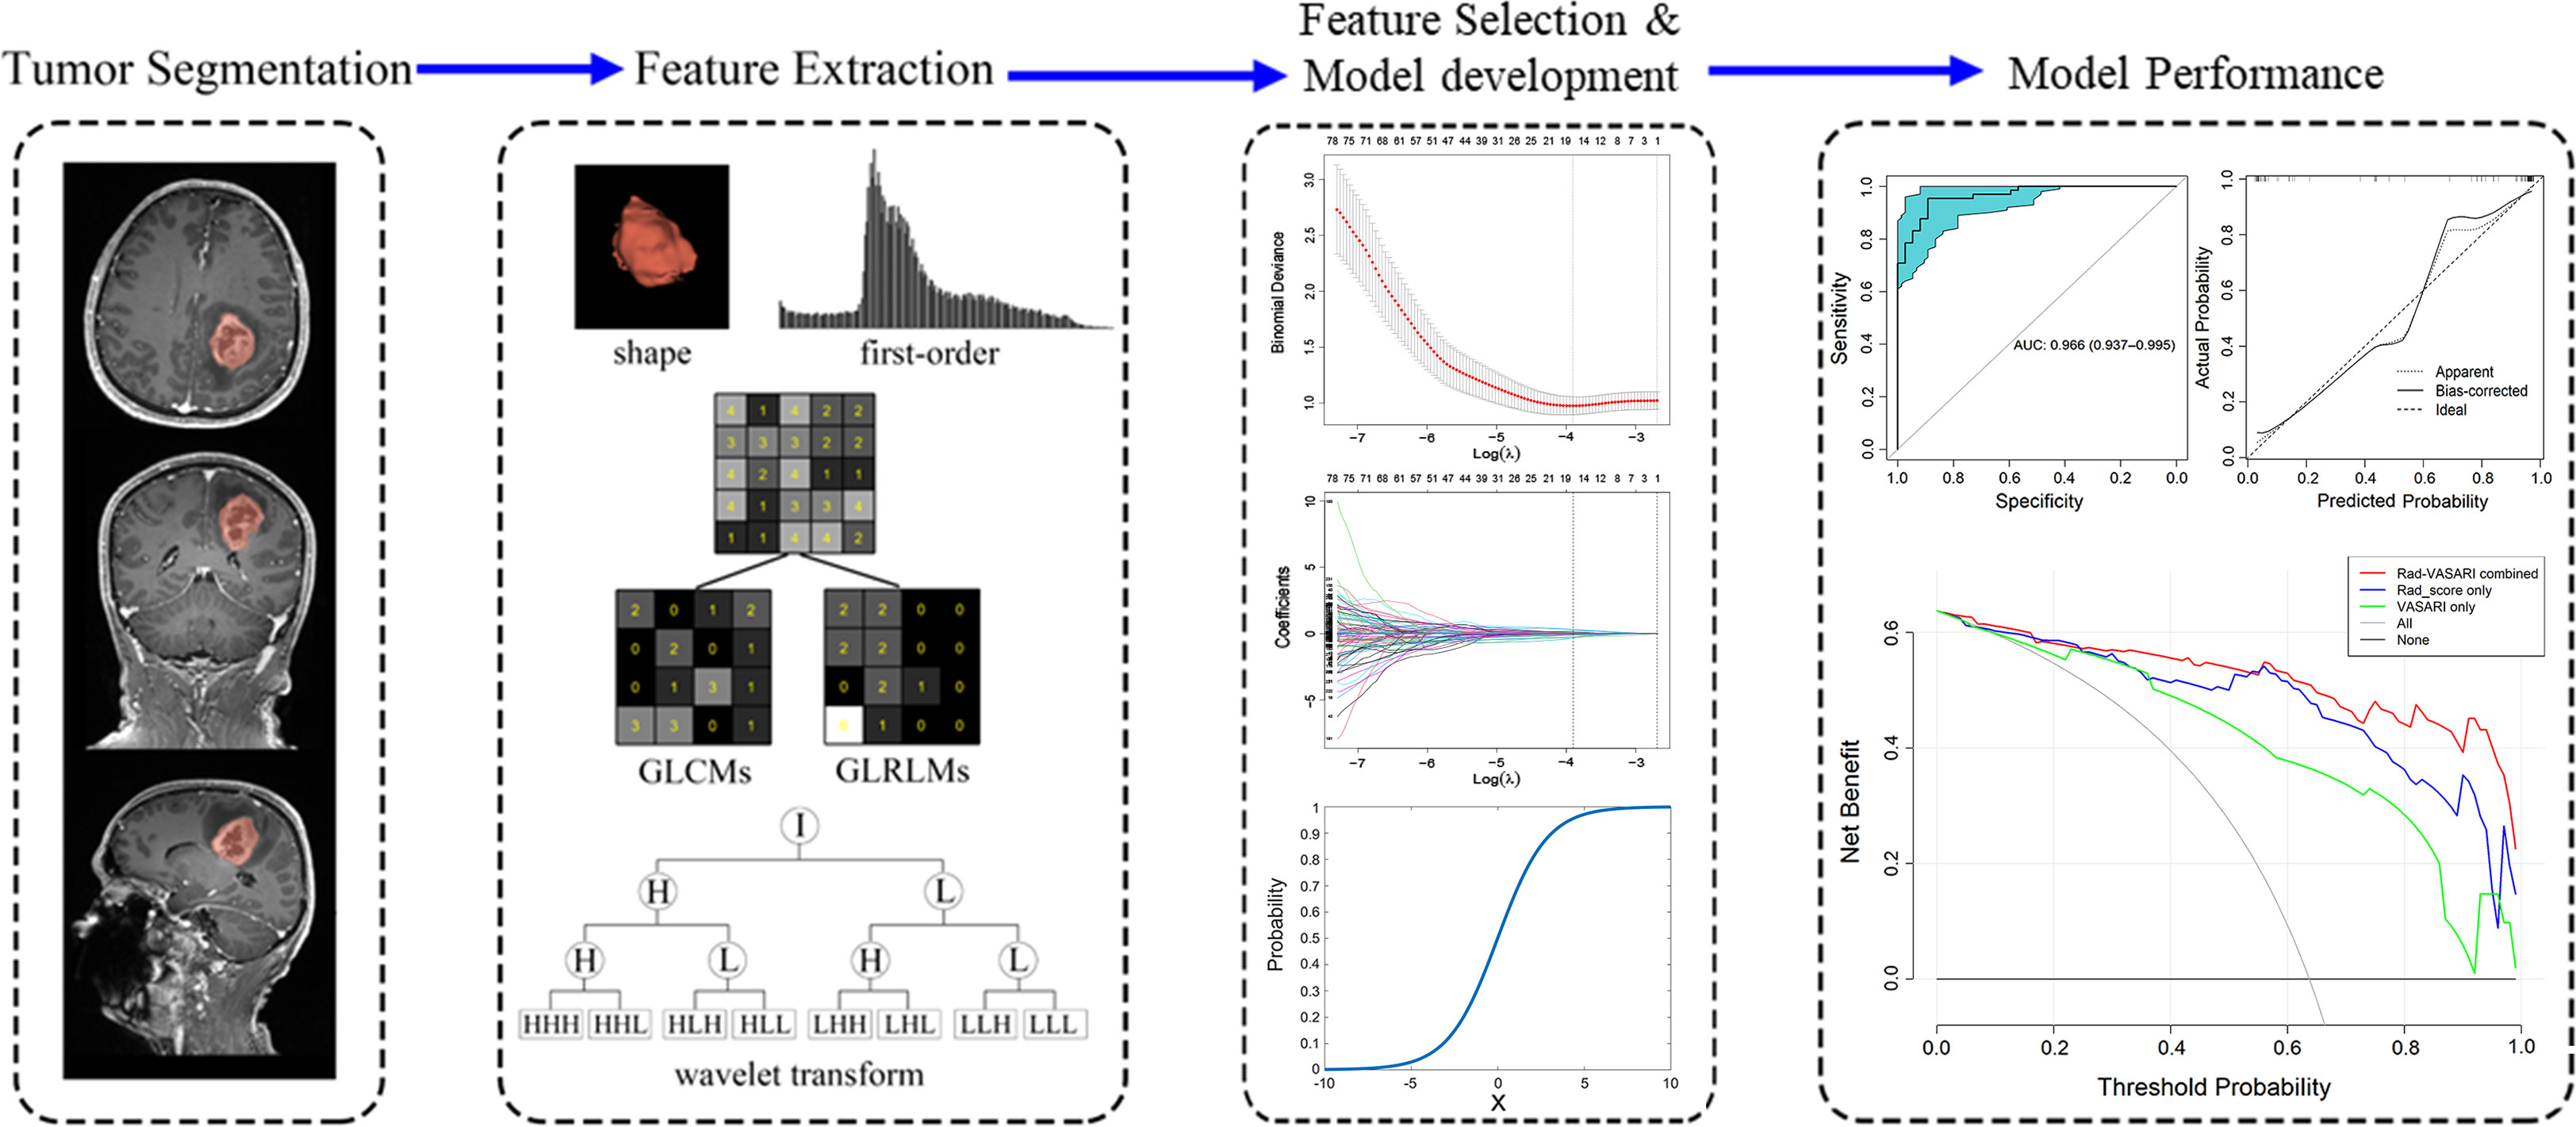
Figure 2 Workflow for the method section. Firstly, tumor segmentation was depicted on the MRI images. Secondly, five categories of radiomic features were extracted from the tumor, including shape, first-order, gray level co-occurrence matrix (GLCM), gray level run-length matrix (GLRLM), and wavelet transform. Thirdly, the least absolute shrinkage and selection operator (LASSO) method was used on feature selection, with model development shown. Finally, the ROC, calibration curve and decision curve analysis was used to assess the model performance.
Results
Patient characteristics
Our study included 102 patients, with 37 in LGG group (I/II 2/35) and 65 in HGG group (III/IV, 26/39). Table 1 summarizes the VASARI features, Rad-score, and age and gender ratio for LGG and HGG groups.
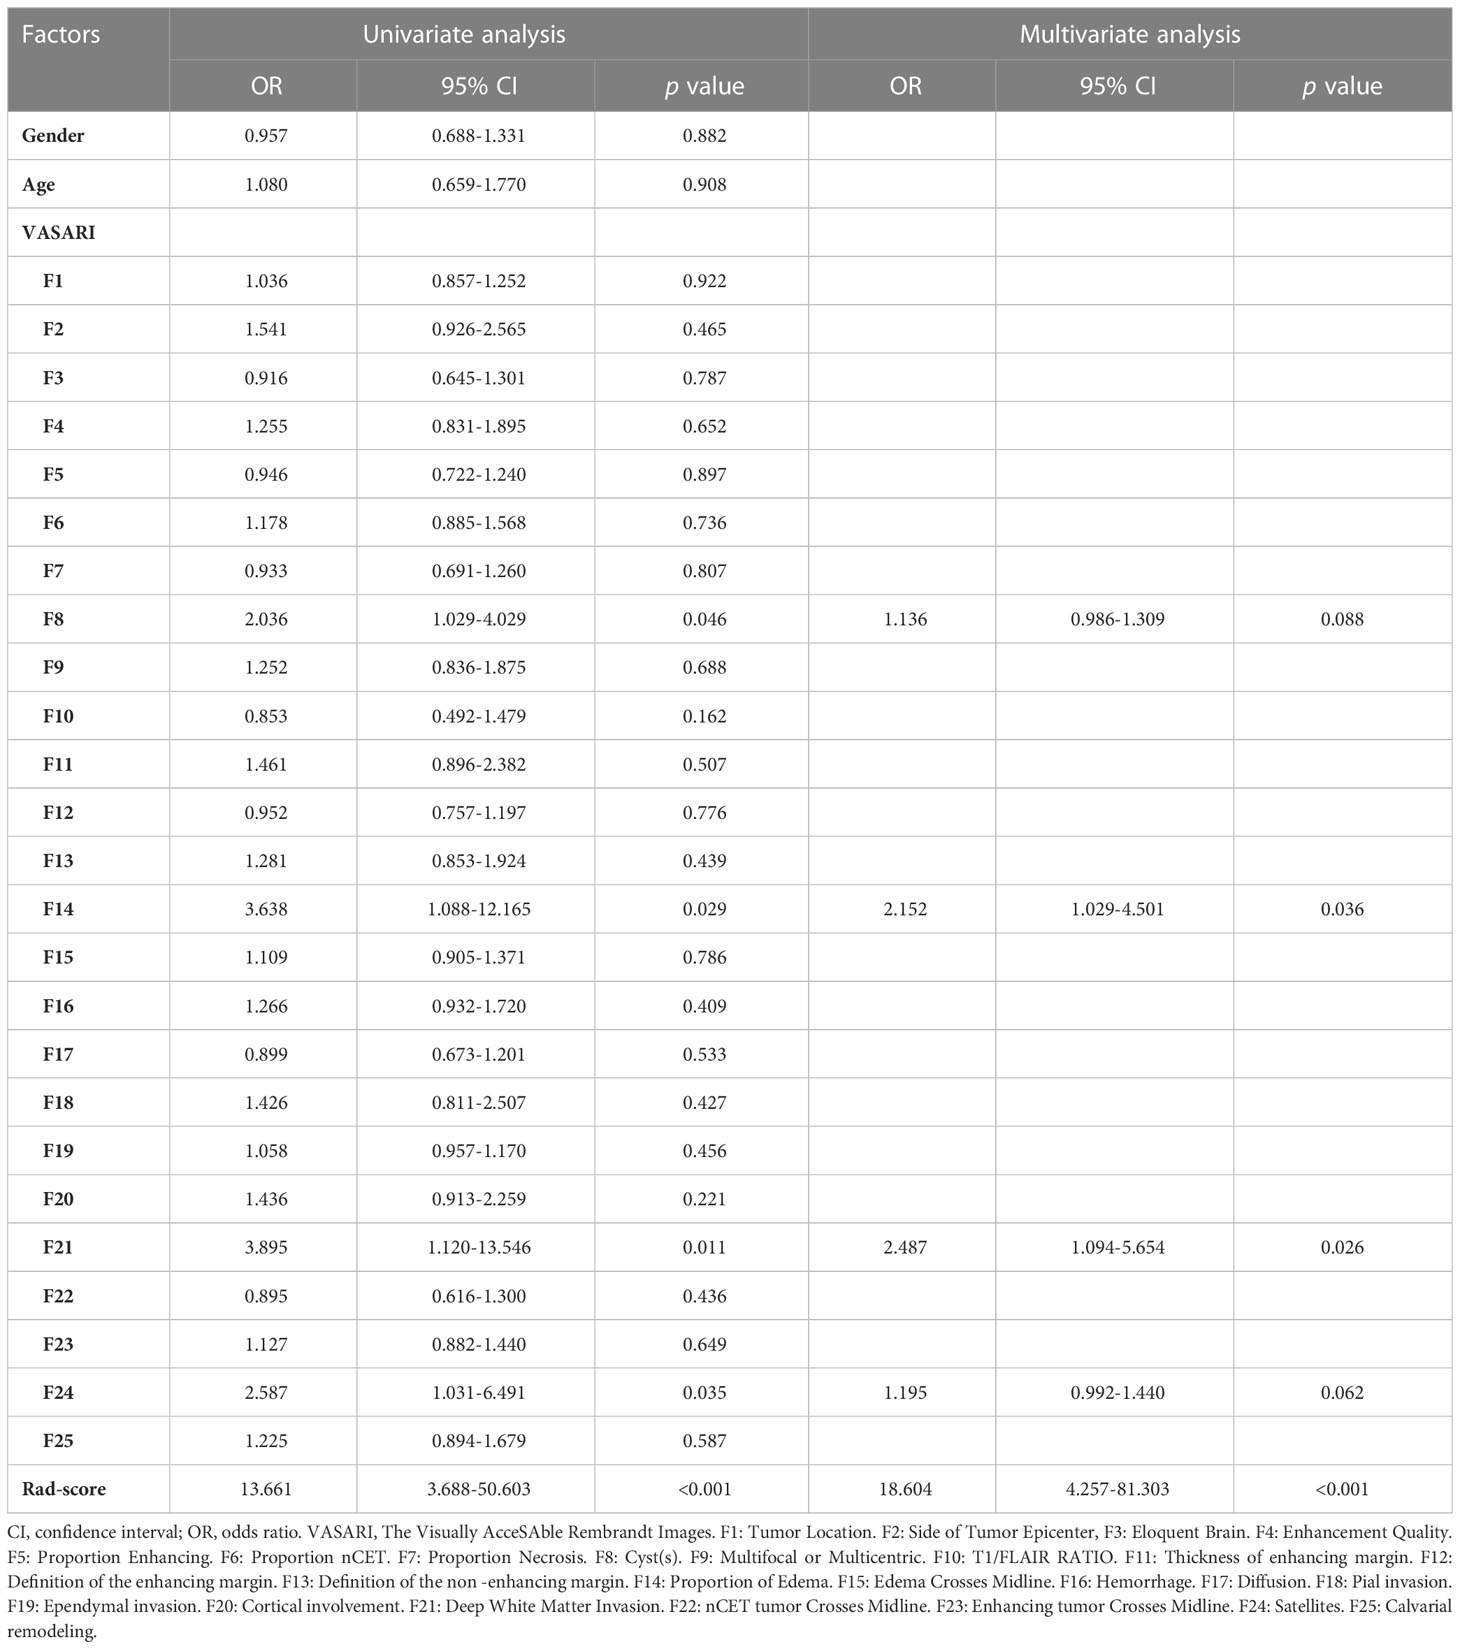
Table 1 The results of binary logistic regression analysis for predictive models.
Radiomic feature extraction
A total of 3840 features from T1WI, T2WI, FLAIR, and contrast-enhanced 3D-T1-MPRAGE images were extracted using Pyradiomics, including shape (14 features), first-order intensity statistics (18 features), Gray Level Co-occurrence Matrix (22 features), Gray Level Size Zone Matrix (16 features), Gray Level Run Length Matrix (16 features), Gray Level Dependence Matrix (14 features), logarithm (172 features), and wavelet (688 features). All features had high ICCs (0.8491 0.9807). Using LASSO logistic regression on the entire cohort, only 16 features survived based on the minimum criterion; the remaining features were omitted because their coefficients were compressed to zero per the LASSO minimum criterion (Figure 2, Feature Selection). The remaining 16 features are listed in Table 2. The Rad-score is then calculated as the linear sum of these 16 non-zero coefficient weighted features (26).
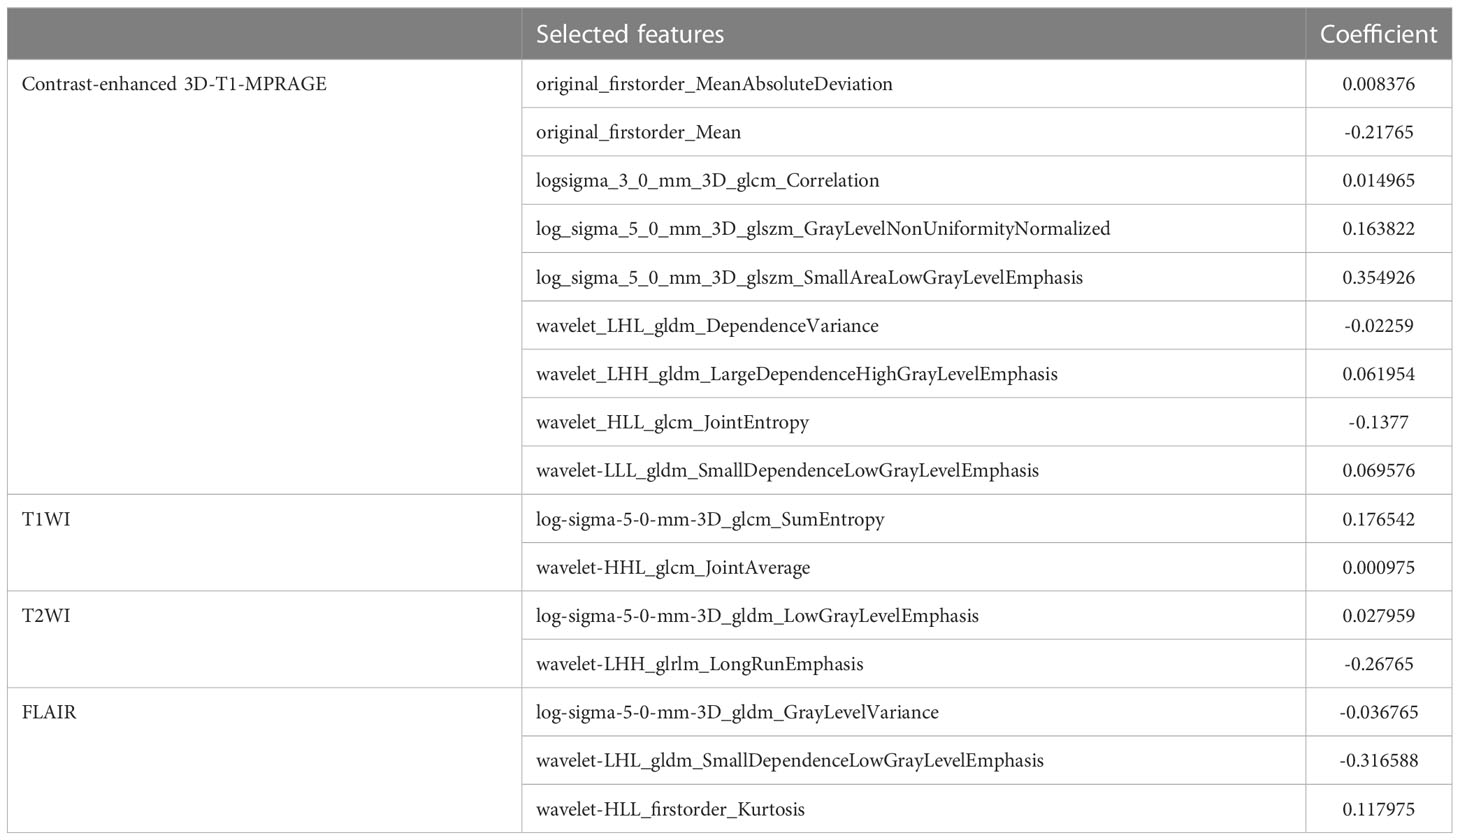
Table 2 Selected radiomic features and its coefficients.
Construction of predictive models
The results of univariate and multivariate logistic regression analyses are presented in Table 1. As final predictors, three variables remained: edema proportion, deep white matter invasion, and Rad-score. Note that the percentages of edema and deep white matter invasion are VASARI features. Based on the outcomes of logistic regression, three predictive models were developed. Model 1 was constructed with all three final predictors; Model 2 was constructed with Rad-score alone, and Model 3 was constructed with the remaining two VASARI variables after Rad-score was omitted.
Model performance
Robustness
The 10-fold nested cross-validation was performed to assess the performance stability of the model. Figure 3 depicts the performance of the three models in 10-fold nested cross-validation. The ten iterations for the test cohort had standard deviations of 0.0362, 0.0458, and 0.0355 for models 1, 2, and 3, respectively. Thus, all three models were relatively stable throughout the ten repetitions in terms of AUC.
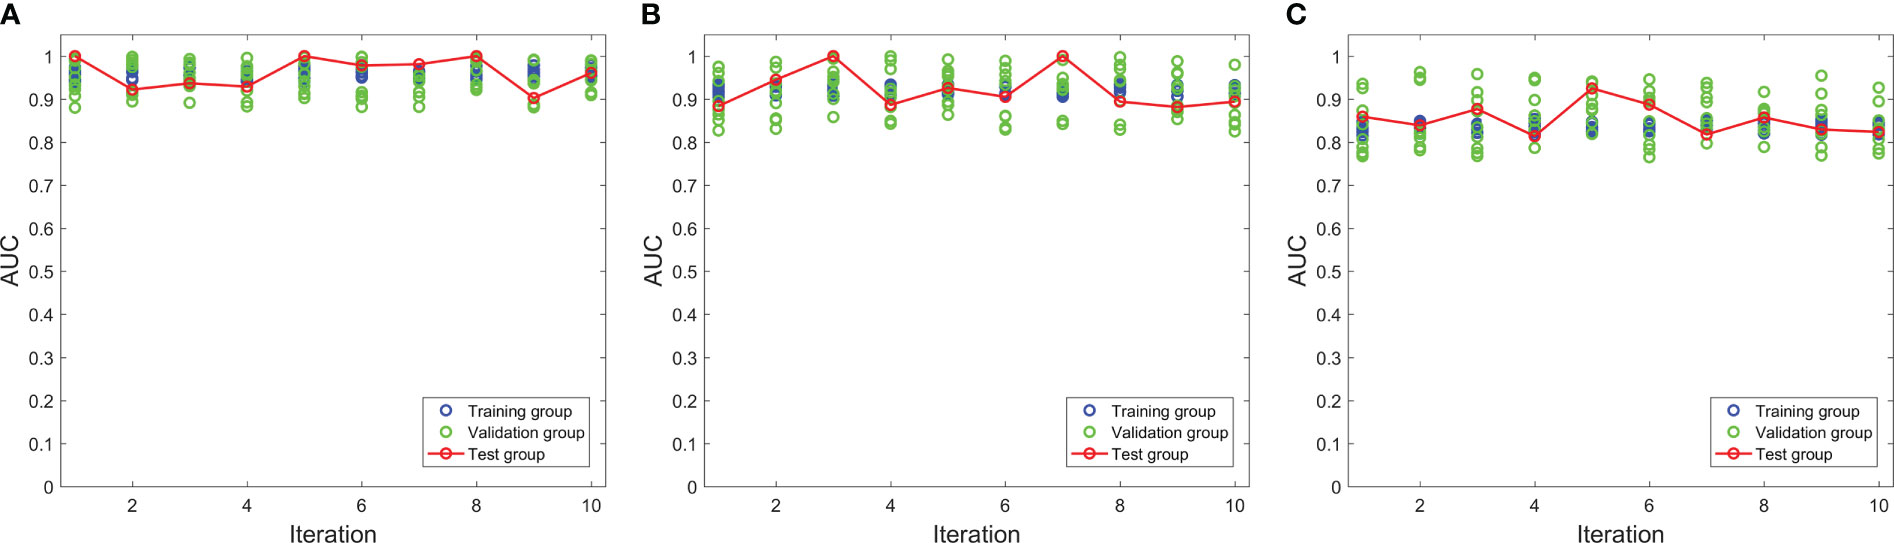
Figure 3 The performances of three models in the nested cross-validation. (A–C) represent model 1, model 2 and model 3 respectively.
Discrimination
ROC curve indicates the discriminatory ability of a diagnostic/predictive model. Figure 4 displays the ROC curve analyses of the three models. Model 1, Model 2, and Model 3 had AUCs of these ROC curves for predicting glioma grade of 0.966 (95% CI: 0.937–0.995), 0.937 (95% CI: 0.889–0.985), and 0.831 (95% CI: 0.745–0.917), respectively. Table 3 displays the remaining indices of ROC curves, including the sensitivity, specificity, positive predictive value, negative predictive value, and accuracy.
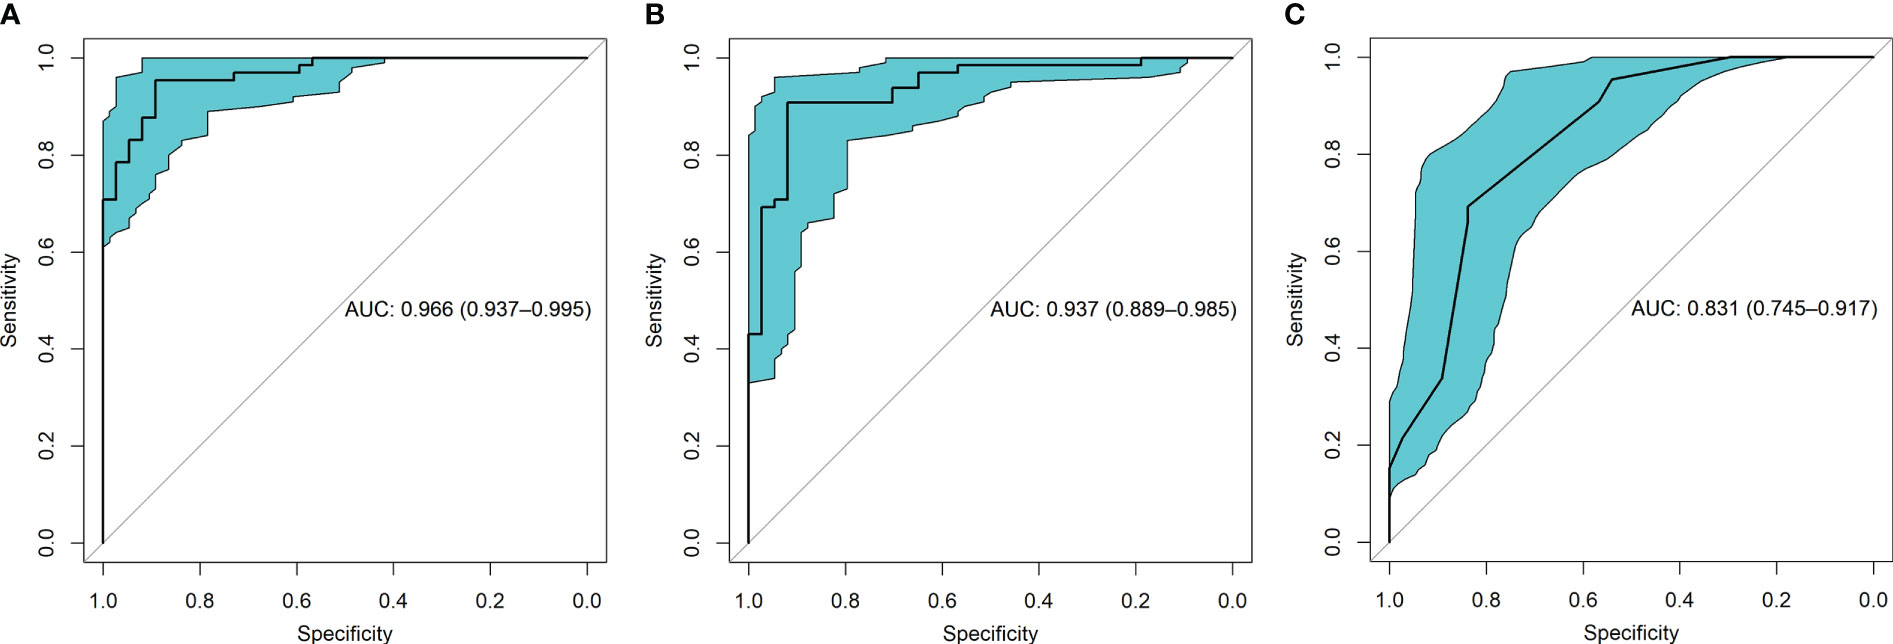
Figure 4 The receiver operating characteristic (ROC) curves for the three models were shown. (A) presented the ROC of model 1 which combined radiomic and VASARI features, with the area under the curve (AUC) of 0.966. (B) displayed the ROC of model 2 including radiomic alone, with the AUC of 0.937. (C) presented the ROC of model 3 including VASARI features alone, with the AUC of 0.831.
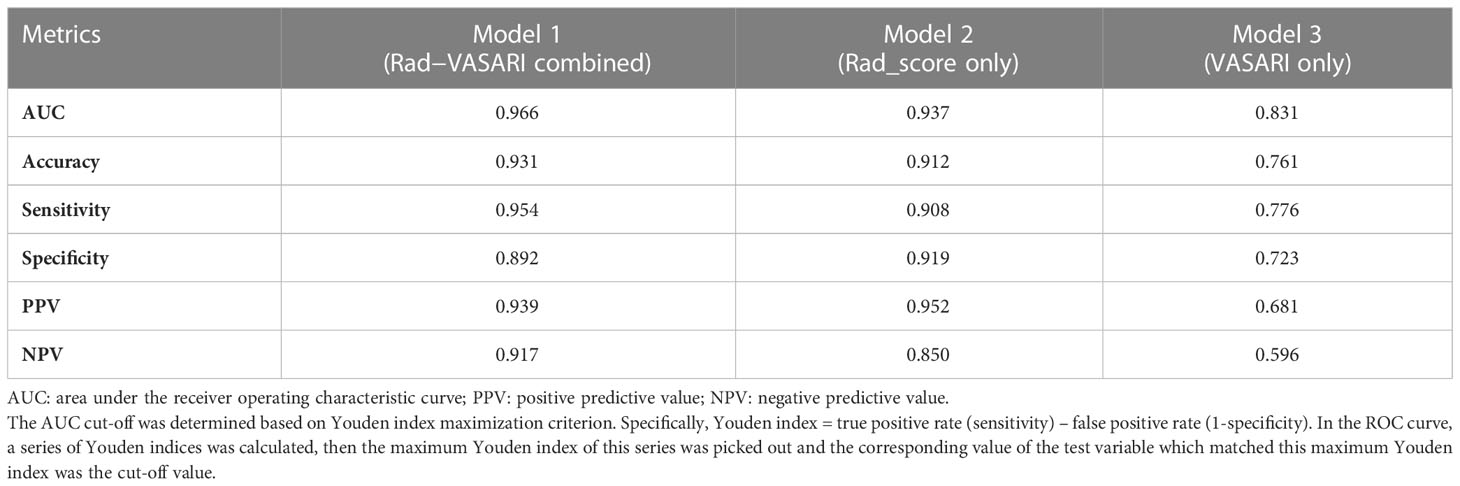
Table 3 Performance of the three predictive models.
Accuracy
The accuracy refers to the consistency between the predicted and observed values, which is reflected in the calibration curve. The calibration curves of the three models demonstrated a good agreement between the predicted and observed probabilities of HGG (Figure 5). All these curves failed to reach statistical significance according to the Hosmer-Lemeshow test (all p > 0.05), indicating that there is good agreement with the ideal diagonal line (i.e., good fitting between the predicted and the observed HGG probability). Because all three calibration curves were statistically well-fitted and exhibited no discernible deviation from the ideal line, we could not select the best-fitted curve.
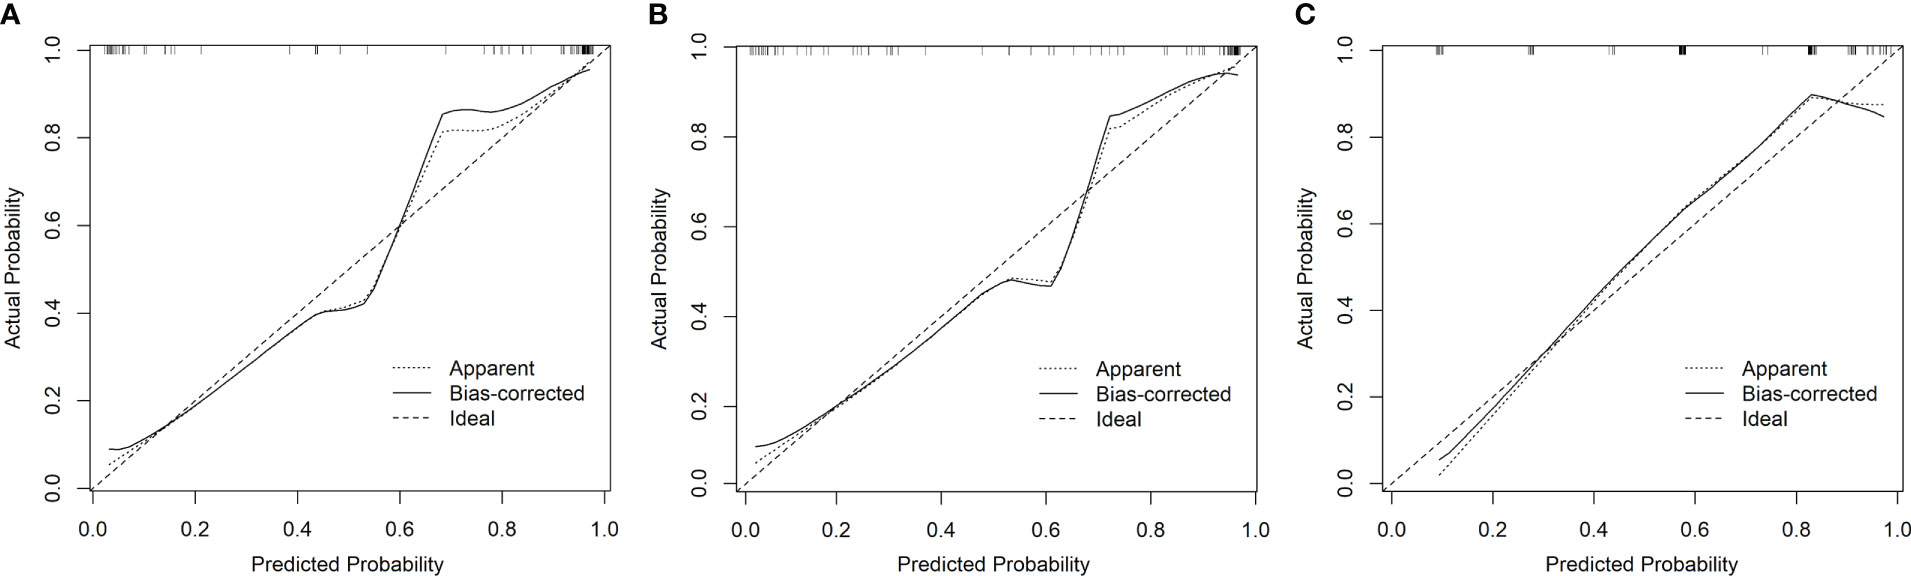
Figure 5 The calibration curves of the three models showed good consistency between the predicted probability of HGG and the observed probability of HGG (A model 1, B model 2, and C model 3).
Clinical applicability
Figure 6 depicts the decision curves of the models. These models are separated from the “treat all” or “treat none” lines, indicating that they may have clinical utility. However, Model 1 appears to have the highest position, indicating that using Model 1 to grade glioma would provide patients with the greatest net benefit compared with Models 2 and 3. Regarding glioma grading, our results indicate that Model 1 (combining radiomics and VASARI variables) is the optimal model among the three models and could be the preferable model for regular clinical practice. Figure 7 depicts the nomogram of model 1 to facilitate its clinical application.
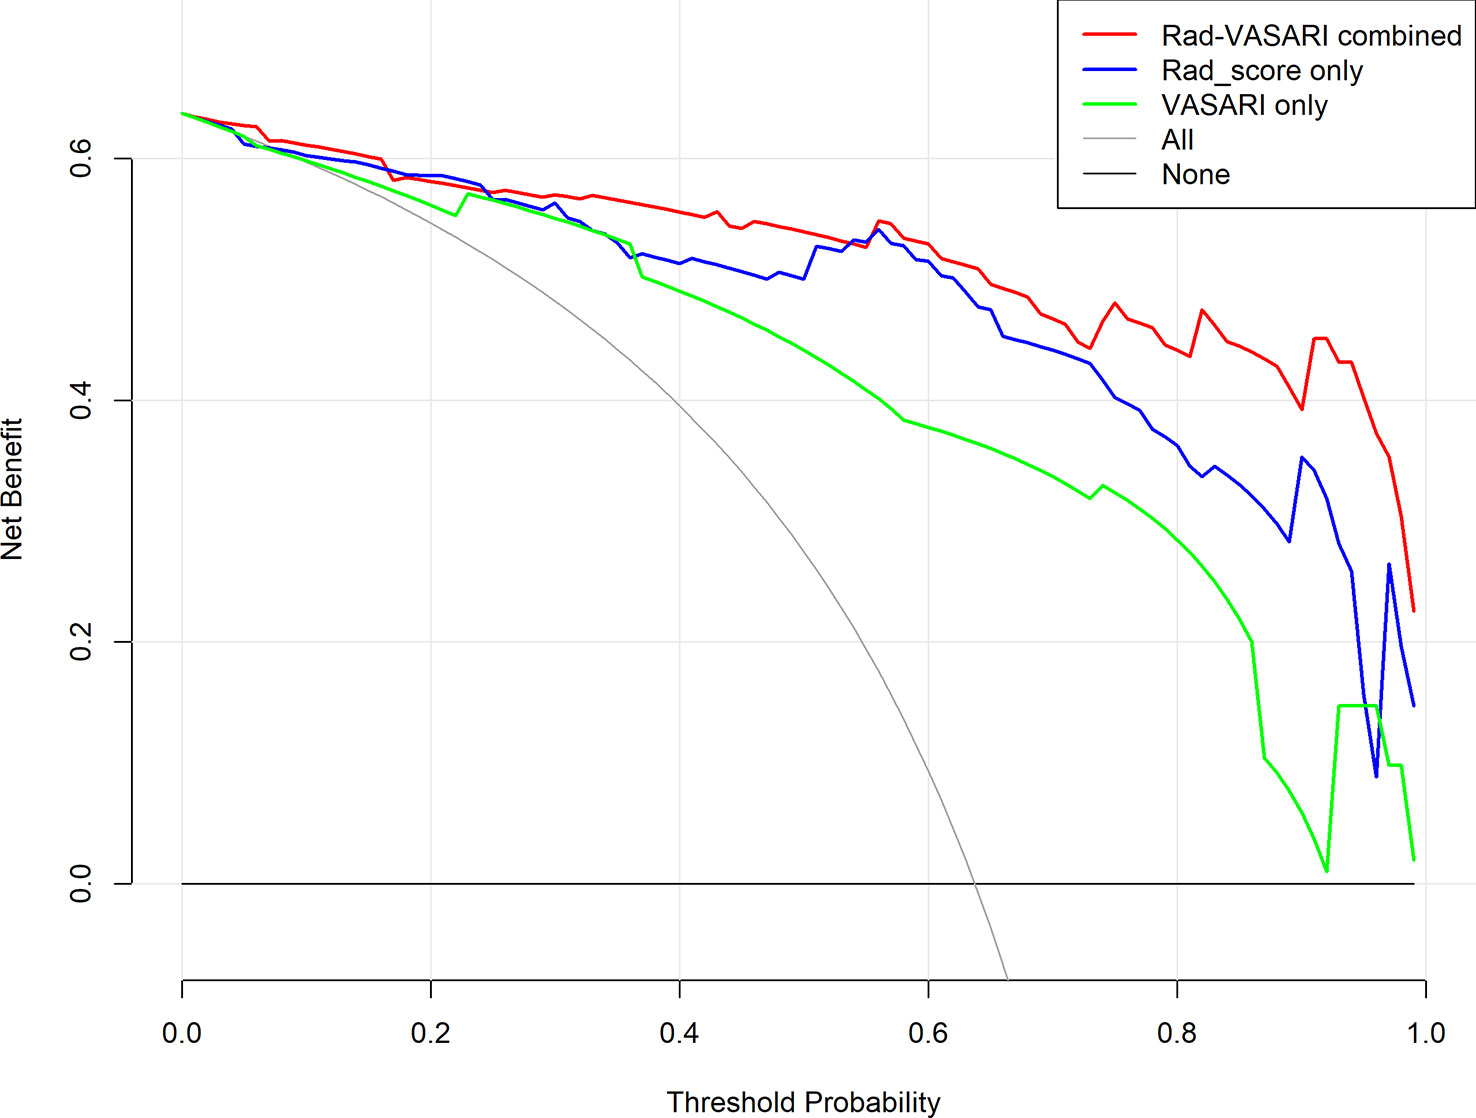
Figure 6 Decision curves for the three models. Red, combined radiomic and VASARI features model; blue, radiomic model; green, VASARI features model.
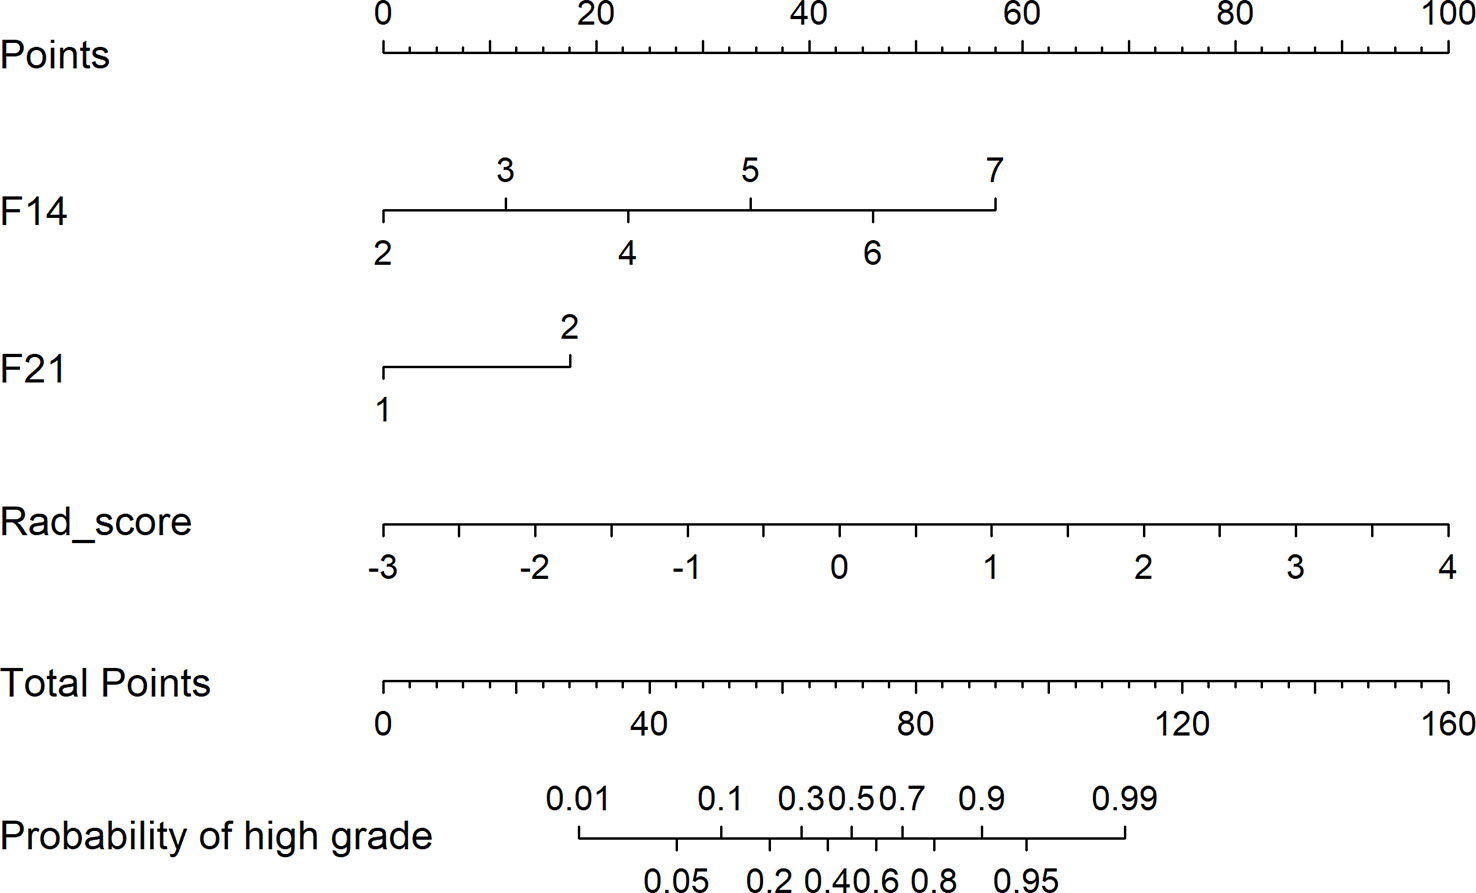
Figure 7 The nomogram of Model 1 combined radiomic and VASARI features.
Discussion
In this study, we developed a predictive model for glioma grade before surgery and histopathology. This model, constructed using radiomics and two VASARI features, performed well in distinguishing LGG from HGG patients. The performance of the model was comprehensively evaluated based on its discrimination, calibration, and clinical utility. The 10-fold nested cross-validation also confirmed the stability and robustness of the model. In addition, our study suggests that radiomics and VASARI could be used to independently predict glioma grade.
With only 102 patients enrolled, the conventional method of dividing the samples into training and testing cohorts was insufficient to evaluate the robustness of our model. Our study evaluated the robustness of the predictive models using 10-fold cross-validation. There have been published radiomics studies with validation cohorts as small as 20–30 patients, making the performance of such models questionable owing to the risks of overfitting and high instability (27). Meanwhile, the external validation cohort sample size should ideally be between 25%–40% of the training cohort (27), although it is common for published studies to violate this requirement. Wang et al. (28) recruited 85 patients and divided them into a training cohort (n = 56) and a validation cohort (n = 29) to develop a radiomics nomogram for glioma grade prediction. The authors discovered that the radiomics nomogram had an excellent C-index of 0.971 in the training cohort and 0.961 in the validation cohort. Given the limited number of samples and the disparity between HGG and LGG, separating the data into training and validation datasets would further reduce the sample size, resulting in highly unstable performance. For a limited cohort, nested cross-validation could be a preferable method to assess whether the selected features are stable across the different folds and to avoid circularity bias while measuring prediction performance (29–31). Our study provided additional information on nested cross-validation from the dividing cohort to AUC scores, enhancing the credibility and confirming the robustness of our models by presenting a transparently detailed procedure.
Regarding the clinical features we selected, the proportion of edema and deep white matter invasion were two key indicators of the malignant behavior of glioma. First, the incidence of peritumoral edema (PTE) is significantly associated with glioma morbidity and mortality. According to previous studies, the average or overall survival of patients with significant edema (> 10 mm) was reduced by more than half compared to those with minor edema (32, 33). In a previous study, Wu et al. (33) hypothesized that edema shape resulting from the extent of edema also influences patient survival. Patients with an irregular edema shape (such as a radial or finger-like shape) tended to have a worse prognosis than those with round edema. In addition, Jeong et al. (34) found that amplification of the epidermal growth factor receptor (EGFR) plays a significant role in the formation of PTE and causes the volume of edema to increase, thereby negatively affecting overall survival. Some studies have indicated that HMGB1 suppression and LINC00665 expression are closely associated with PTE (35, 36).
The deep white matter invasion that we selected to represent malignant glioma was also significant in a previous study. Tumor location, a crucial parameter for patient care, correlates strongly with molecular subtypes, histopathological characteristics, clinical presentation and surgery, surgical management, glioma malignancy level, and prognosis (37–42). Roux et al. (38) presented probabilistic maps based on clinical presentations and survival analysis. Their results demonstrated that tumors in the deep location and eloquent brain regions were more likely to be associated with poor prognosis and shorter overall survival than those in the superficial location distant from the eloquent area.
Invasion along the white matter tracts is an important clinicopathological characteristic of gliomas, indicative of poor therapeutic prognosis (37, 43). Our study utilized the VASARI standard and combined it with contrast-enhanced 3D-T1-MPRAGE radiomics for analysis, which should be superior to using VASARI alone because radiomics analysis should be more objective, accurate, and reliable as a quantitative method. As a non-invasive diagnostic method, radiomic features extracted from images reflect cellular behaviors in the intratumoral microenvironment, which correlates with the prognosis of the tumor (44–46). Heterogeneity, an important parameter of the clinicopathological characteristics of gliomas, is associated with the degree of malignant behavior (47). For instance, tumors with more aggressive behavior may indicate higher heterogeneity, whereas tumors with more favorable behavior tend to exhibit less heterogeneity. Our study filtered kurtosis and entropy-related radiomic features using the LASSO method, indicating greater heterogeneity. According to a previous study (48), kurtosis and entropy are significant indicators of glioma heterogeneity. Spatial and temporal vascular anomalies, which result from hypoxia and acidosis within the tumor caused by angiogenesis, are primary contributors to tumor heterogeneity (47). The models in our study were consistent with those in previous research, suggesting that kurtosis and entropy reflect greater heterogeneity and a worse prognosis. Among the most relevant 16 radiomic features (Table 2), nine features were derived from contrast-enhanced 3D-T1-MPRAGE, two were derived from T1WI, two were derived from T2WI, and three were derived from FLAIR, indicating that 3D-T1-MPRAGE could be the essential sequence and exerted the largest contribution for identifying the glioma grade.
Our study had several limitations. First, the small sample size was insufficient to maintain the stability of the results. Therefore, we utilized nested cross-validation to confirm the validity of the predictive model. Second, our study lacked the molecular subtype for the samples, while the molecular phenotype is crucial for the prognosis of glioma (49, 50). Future medical imaging research should focus on the molecular characteristics of glioma, which could aid in more accurate subtype prediction and the development of individual treatment strategies.
Conclusion
This study demonstrates the significance of a predictive model combining radiomics features with VASARI standard for glioma grade analysis before surgical intervention. This non-invasive imaging-centered strategy would aid in advancing clinical research and guiding individualized treatment for patients with high-grade glioma.
Data availability statement
The raw data supporting the conclusions of this article will be made available by the authors, without undue reservation.
Ethics statement
Written informed consent was obtained from the individual(s) for the publication of any potentially identifiable images or data included in this article.
Author contributions
WY, YM, XJ, PL, and WL contributed to conception and design of the study. WY and XJ organized the database, finished image segmentation and evaluated clinical features. DW extracted radiomic features. JL was responsible to the data collection in prior. WY and YM processed the pictures and tables, and performed the statistical analysis. PL also joined the pictures processing. WY wrote the first draft of the manuscript. YM wrote sections of the manuscript. All authors contributed to manuscript revision, read, and approved the submitted version.
Conflict of interest
The authors declare that the research was conducted in the absence of any commercial or financial relationships that could be construed as a potential conflict of interest.
Publisher’s note
All claims expressed in this article are solely those of the authors and do not necessarily represent those of their affiliated organizations, or those of the publisher, the editors and the reviewers. Any product that may be evaluated in this article, or claim that may be made by its manufacturer, is not guaranteed or endorsed by the publisher.
References
1. Rafique Z, Awan MW, Iqbal S, Usmani NN, Kamal MM, Arshad W, et al. Diagnostic accuracy of magnetic resonance spectroscopy in predicting the grade of glioma keeping histopathology as the gold standard. Cureus (2022) 14(2):1–10. doi: 10.7759/cureus.22056
2. Munir S, Khan SA, Hanif H, Khan M. Diagnostic accuracy of magnetic resonance imaging in detection of intra-axial gliomas. Pak J Med Sci (2021) 37(1):125–30. doi: 10.12669/pjms.37.1.2489
3. Louis DN, Perry A, Reifenberger G, von Deimling A, Figarella-Branger D, Cavenee WK, et al. The 2016 world health organization classification of tumors of the central nervous system: A summary. Acta Neuropathol (2016) 131(6):803–20. doi: 10.1007/s00401-016-1545-1
4. Louis DN, Perry A, Wesseling P, Brat DJ, Cree IA, Figarella-Branger D, et al. The 2021 who classification of tumors of the central nervous system: A summary. Neuro Oncol (2021) 23(8):1231–51. doi: 10.1093/neuonc/noab106
5. Yang K, Wu Z, Zhang H, Zhang N, Wu W, Wang Z, et al. Glioma targeted therapy: Insight into future of molecular approaches. Mol Cancer (2022) 21(1):1–32. doi: 10.1186/s12943-022-01513-z
6. Ujjwal Baid SG, Mohan S, Bilello M, Calabrese E, Colak E, Kalpathy-Cramer J, et al. The rsna-Asnr-Miccal brats 2021 benchmark on brain tumor segmentation and radiogenomic classification. Comput Vision Pattern Recognition (2021) 1–19. doi: 10.48550/arXiv.2107.02314
7. Nakamoto T, Takahashi W, Haga A, Takahashi S, Kiryu S, Nawa K, et al. Prediction of malignant glioma grades using contrast-enhanced T1-weighted and T2-weighted magnetic resonance images based on a radiomic analysis. Sci Rep (2019) 9(1):1–12. doi: 10.1038/s41598-019-55922-0
8. Kumar V, Gu Y, Basu S, Berglund A, Eschrich SA, Schabath MB, et al. Radiomics: The process and the challenges. Magn Reson Imaging (2012) 30(9):1234–48. doi: 10.1016/j.mri.2012.06.010
9. Lambin P, Leijenaar RTH, Deist TM, Peerlings J, de Jong EEC, van Timmeren J, et al. Radiomics: The bridge between medical imaging and personalized medicine. Nat Rev Clin Oncol (2017) 14(12):749–62. doi: 10.1038/nrclinonc.2017.141
10. Baid U, Rane SU, Talbar S, Gupta S, Thakur MH, Moiyadi A, et al. Overall survival prediction in glioblastoma with radiomic features using machine learning. Front Comput Neurosci (2020) 14:61. doi: 10.3389/fncom.2020.00061
11. Wang J, Yi X, Fu Y, Pang P, Deng H, Tang H, et al. Preoperative magnetic resonance imaging radiomics for predicting early recurrence of glioblastoma. Front Oncol (2021) 11:769188. doi: 10.3389/fonc.2021.769188
12. Yang F, Xie Y, Tang J, Liu B, Luo Y, He Q, et al. Uncovering a distinct gene signature in endothelial cells associated with contrast enhancement in glioblastoma. Front Oncol (2021) 11:683367. doi: 10.3389/fonc.2021.683367
13. Choi YS, Ahn SS, Kim DW, Chang JH, Kang S-G, Kim EH, et al. Incremental prognostic value of adc histogram analysis over mgmt promoter methylation status in patients with glioblastoma. Radiology (2016) 281(1):175–84. doi: 10.1148/radiol.2016151913
14. Li Y, Ammari S, Lawrance L, Quillent A, Assi T, Lassau N, et al. Radiomics-based method for predicting the glioma subtype as defined by tumor grade, idh mutation, and 1p/19q codeletion. Cancers (Basel) (2022) 14(7):1–26. doi: 10.3390/cancers14071778
15. Robert J, Gillies PEK, Hricak H. Radiomics: Images are more than pictures, they are data. Radiology (2016) 278(2):563–77. doi: 10.1148/radiol.2015151169
16. Park YW, Choi YS, Ahn SS, Chang JH, Kim SH, Lee SK. Radiomics mri phenotyping with machine learning to predict the grade of lower-grade gliomas: A study focused on nonenhancing tumors. Korean J Radiol (2019) 20(9):1381–9. doi: 10.3348/kjr.2018.0814
17. Mao Y, Liao W, Cao D, Zhao L, Wu X, Kong L, et al. An artificial neural network model for glioma grading using image information. Zhong Nan Da Xue Xue Bao Yi Xue Ban (2018) 43(12):1315–22. doi: 10.11817/j.issn.1672-7347.2018.12.006
18. Verduin M, Primakov S, Compter I, Woodruff HC, van Kuijk SMJ, Ramaekers BLT, et al. Prognostic and predictive value of integrated qualitative and quantitative magnetic resonance imaging analysis in glioblastoma. Cancers (Basel) (2021) 13(4):1–19. doi: 10.3390/cancers13040722
19. Sun C, Fan L, Wang W, Wang W, Liu L, Duan W, et al. Radiomics and qualitative features from multiparametric mri predict molecular subtypes in patients with lower-grade glioma. Front Oncol (2021) 11:756828. doi: 10.3389/fonc.2021.756828
20. Park YW, Han K, Ahn SS, Bae S, Choi YS, Chang JH, et al. Prediction of Idh1-mutation and 1p/19q-codeletion status using preoperative Mr imaging phenotypes in lower grade gliomas. AJNR Am J Neuroradiol (2018) 39(1):37–42. doi: 10.3174/ajnr.A5421
21. Baid U, Talbar S, Rane S, Gupta S, Thakur MH, Moivadi A, et al. Deep learning radiomics algorithm for gliomas (drag) model: A novel approach using 3d Unet based deep convolutional neural network for predicting survival in gliomas. Brainlesion: Glioma, multiple sclerosis, stroke and traumatic brain injuries. Lecture Notes in Computer Science (2019) 369–79.
22. Sauerbrei W, Royston P, Binder H. Selection of important variables and determination of functional form for continuous predictors in multivariable model building. Stat Med (2007) 26(30):5512–28. doi: 10.1002/sim.3148
23. Kramer AA, Zimmerman JE. Assessing the calibration of mortality benchmarks in critical care: The hosmer-lemeshow test revisited. Crit Care Med (2007) 35(9):2052–6. doi: 10.1097/01.CCM.0000275267.64078.B0
24. Vickers AJ, Cronin AM, Elkin EB, Gonen M. Extensions to decision curve analysis, a novel method for evaluating diagnostic tests, prediction models and molecular markers. BMC Med Inform Decis Mak (2008) 8:1–17. doi: 10.1186/1472-6947-8-53
25. DeLong ER, DeLong DM, Clarke-Pearson DL. Comparing the areas under two or more correlated receiver operating characteristic curves: A nonparametric approach. Biometrics (1988) 44(3):837–45. doi: 10.2307/2531595
26. Huang YQ, Liang CH, He L, Tian J, Liang CS, Chen X, et al. Development and validation of a radiomics nomogram for preoperative prediction of lymph node metastasis in colorectal cancer. J Clin Oncol (2016) 34(18):2157–64. doi: 10.1200/JCO.2015.65.9128
27. Papanikolaou N, Matos C, Koh DM. How to develop a meaningful radiomic signature for clinical use in oncologic patients. Cancer Imaging (2020) 20(1):1–10. doi: 10.1186/s40644-020-00311-4
28. Wang Q, Li Q, Mi R, Ye H, Zhang H, Chen B, et al. Radiomics nomogram building from multiparametric mri to predict grade in patients with glioma: A cohort study. J Magn Reson Imaging (2019) 49(3):825–33. doi: 10.1002/jmri.26265
29. Kohavi R ed. A study of cross-validation and bootstrap for accuracy estimation and model selection, in: International Joint Conference on Artificial Intelligence. San Francisco, CA, United States: Morgan Kaufmann (1995).
30. Varoquaux G, Raamana PR, Engemann DA, Hoyos-Idrobo A, Schwartz Y, Thirion B. Assessing and tuning brain decoders: Cross-validation, caveats, and guidelines. Neuroimage (2017) 145:166–79. doi: 10.1016/j.neuroimage.2016.10.038
31. Fleuren LM, Dam TA, Tonutti M, de Bruin DP, Lalisang RCA, Gommers D, et al. Predictors for extubation failure in COVID-19 patients using a machine learning approach. Crit Care (2021) 25(1):448. doi: 10.1186/s13054-021-03864-3
32. Schoenegger K, Oberndorfer S, Wuschitz B, Struhal W, Hainfellner J, Prayer D, et al. Peritumoral edema on mri at initial diagnosis: An independent prognostic factor for glioblastoma? Eur J Neurol (2009) 16(7):874–8. doi: 10.1111/j.1468-1331.2009.02613.x
33. Wu CX, Lin GS, Lin ZX, Zhang JD, Chen L, Liu SY, et al. Peritumoral edema on magnetic resonance imaging predicts a poor clinical outcome in malignant glioma. Oncol Lett (2015) 10(5):2769–76. doi: 10.3892/ol.2015.3639
34. Jeong KH, Song YJ, Han JY, Kim KU. Relationship between cytogenetic complexity and peritumoral edema in high-grade astrocytoma. Ann Lab Med (2016) 36(6):583–9. doi: 10.3343/alm.2016.36.6.583
35. Hong B, Muili K, Bolyard C, Russell L, Lee TJ, Banasavadi-Siddegowda Y, et al. Suppression of Hmgb1 released in the glioblastoma tumor microenvironment reduces tumoral edema. Mol Ther Oncolytics (2019) 12:93–102. doi: 10.1016/j.omto.2018.11.005
36. Chen W, Hong L, Hou C, Zong G, Zhang J. Up-regulation of Linc00665 contributes to the progression of glioma and correlates with its mri characteristics. Am J Transl Res (2022) 14(5):2988–3002.
37. Zhang S, Su X, Kemp GJ, Yang X, Wan X, Tan Q, et al. Two patterns of white matter connection in multiple gliomas: Evidence from probabilistic fiber tracking. J Clin Med (2022) 11(13):1–12. doi: 10.3390/jcm11133693
38. Roux A, Roca P, Edjlali M, Sato K, Zanello M, Dezamis E, et al. Mri atlas of idh wild-type supratentorial glioblastoma: Probabilistic maps of phenotype, management, and outcomes. Radiology (2019) 293(3):633–43. doi: 10.1148/radiol.2019190491
39. Woo P, Ho J, Lam S, Ma E, Chan D, Wong WK, et al. A comparative analysis of the usefulness of survival prediction models for patients with glioblastoma in the temozolomide era: The importance of methylguanine methyltransferase promoter methylation, extent of resection, and subventricular zone location. World Neurosurg (2018) 115:375–85. doi: 10.1016/j.wneu.2018.04.059
40. Awad AW, Karsy M, Sanai N, Spetzler R, Zhang Y, Xu Y, et al. Impact of removed tumor volume and location on patient outcome in glioblastoma. J Neurooncol (2017) 135(1):161–71. doi: 10.1007/s11060-017-2562-1
41. Pallud J, Roux A, Zanello M. Relationship between tumour location and preoperative seizure incidence depends on glioma grade of malignancy. Epileptic Disord (2016) 18(1):107–8. doi: 10.1684/epd.2016.0799
42. Paldor I, Pearce FC, Drummond KJ, Kaye AH. Frontal glioblastoma multiforme may be biologically distinct from non-frontal and multilobar tumors. J Clin Neurosci (2016) 34:128–32. doi: 10.1016/j.jocn.2016.05.017
43. Aabedi AA, Young JS, Chang EF, Berger MS, Hervey-Jumper SL. Involvement of white matter language tracts in glioma: Clinical implications, operative management, and functional recovery after injury. Front Neurosci (2022) 16:932478. doi: 10.3389/fnins.2022.932478
44. Mao Y, Pei Q, Fu Y, Liu H, Chen C, Li H, et al. Pre-treatment computed tomography radiomics for predicting the response to neoadjuvant chemoradiation in locally advanced rectal cancer: A retrospective study. Front Oncol (2022) 12:850774. doi: 10.3389/fonc.2022.850774
45. He Z, Mao Y, Lu S, Tan L, Xiao J, Tan P, et al. Machine learning-based radiomics for histological classification of parotid tumors using morphological MRI: A comparative study. Eur Radiol (2022) 32(12):8099–110. doi: 10.1007/s00330-022-08943-9
46. Wesdorp NJ, Hellingman T, Jansma EP, van Waesberghe JTM, Boellaard R, Punt CJA, et al. Advanced analytics and artificial intelligence in gastrointestinal cancer: A systematic review of radiomics predicting response to treatment. Eur J Nucl Med Mol Imaging (2021) 48(6):1785–94. doi: 10.1007/s00259-020-05142-w
47. Yip C, Landau D, Kozarski R, Ganeshan B, Thomas R, Michaelidou A, et al. Primary esophageal cancer: Heterogeneity as potential prognostic biomarker in patients treated with definitive chemotherapy and radiation therapy. Radiology (2014) 270(1):141–8. doi: 10.1148/radiol.13122869
48. Ditmer A, Zhang B, Shujaat T, Pavlina A, Luibrand N, Gaskill-Shipley M, et al. Diagnostic accuracy of mri texture analysis for grading gliomas. J Neurooncol (2018) 140(3):583–9. doi: 10.1007/s11060-018-2984-4
49. Hrapșa I, Florian IA, Șușman S, Farcaș M, Beni L, Florian IS. External validation of a convolutional neural network for idh mutation prediction. Medicina (Kaunas) (2022) 58(4):526. doi: 10.3390/medicina58040526
Keywords: nomogram, glioma grade, radiomics, VASARI, high-grade glioma, pre-operation diagnosis
Citation: You W, Mao Y, Jiao X, Wang D, Liu J, Lei P and Liao W (2023) The combination of radiomics features and VASARI standard to predict glioma grade. Front. Oncol. 13:1083216. doi: 10.3389/fonc.2023.1083216
Received: 28 October 2022; Accepted: 07 March 2023;
Published: 22 March 2023.
Edited by:
Abhishek Mahajan, The Clatterbridge Cancer Centre, United KingdomReviewed by:
Ujjwal Raghunandan Baid, Shri Guru Gobind Singhji Institute of Engineering and Technology, IndiaCarole Sudre, University College London, United Kingdom
Copyright © 2023 You, Mao, Jiao, Wang, Liu, Lei and Liao. This is an open-access article distributed under the terms of the Creative Commons Attribution License (CC BY). The use, distribution or reproduction in other forums is permitted, provided the original author(s) and the copyright owner(s) are credited and that the original publication in this journal is cited, in accordance with accepted academic practice. No use, distribution or reproduction is permitted which does not comply with these terms.
*Correspondence: Weihua Liao, b3V3ZW5saWFvQDE2My5jb20=
†These authors have contributed equally to this work