 Peng Chen
 Feng Bi
 Lian Jian
 Xiaoping Yu
- Department of Diagnostic Radiology, Hunan Cancer Hospital and the Affiliated Cancer Hospital of Xiangya School of Medicine, Central South University, Changsha, Hunan, China
Background: Immune checkpoint blockade (ICB) and anti-angiogenic drug combination has prolonged the survival of patients with advanced renal cell carcinoma (RCC). However, not all patients receive clinical benefits from this intervention. In this study, we aimed to establish a promising immune-related prognostic model to stratify the patients responding to ICB and anti-angiogenic drug combination and facilitate the development of personalized therapies for patients with RCC.
Materials and methods: Based on clinical annotations and RNA-sequencing (RNA-seq) data of 407 patients with advanced RCC from the IMmotion151 cohort, nine immune-associated differentially expressed genes (DEGs) between responders and non-responders to atezolizumab (anti-programmed death-ligand 1 antibody) plus bevacizumab (anti-vascular endothelial growth factor antibody) treatment were identified via weighted gene co-expression network analysis. We also conducted single-sample gene set enrichment analysis to develop a novel immune-related risk score (IRS) model and further estimate the prognosis of patients with RCC by predicting their sensitivity to chemotherapy and responsiveness to immunotherapy. IRS model was further validated using the JAVELIN Renal 101 cohort, the E-MTAB-3218 cohort, the IMvigor210 and GSE78220 cohort. Predictive significance of the IRS model for advanced RCC was assessed using receiver operating characteristic curves.
Results: The IRS model was constructed using nine immune-associated DEGs: SPINK5, SEMA3E, ROBO2, BMP5, ORM1, CRP, CTSE, PMCH and CCL3L1. Advanced RCC patients with high IRS had a high risk of undesirable clinical outcomes (hazard ratio = 1.91; 95% confidence interval = 1.43–2.55; P < 0.0001). Transcriptome analysis revealed that the IRS-low group exhibited significantly high expression levels of CD8+ T effectors, antigen-processing machinery, and immune checkpoints, whereas the epithelial–mesenchymal transition pathway was enriched in the IRS-high group. IRS model effectively differentiated the responders from non-responders to ICB combined with angiogenesis blockade therapy or immunotherapy alone, with area under the curve values of 0.822 in the IMmotion151 cohort, 0.751 in the JAVELIN Renal 101 cohort, and 0.776 in the E-MTAB-3218 cohort.
Conclusion: IRS model is a reliable and robust immune signature that can be used for patient selection to optimize the efficacy of ICB plus anti-angiogenic drug therapies in patients with advanced RCC.
1 Introduction
RCC is the 12th most common solid tumor that accounted for > 400,000 new diagnoses and approximately 175,000 cancer-associated deaths worldwide in 2018 (1). Approximately 25% of RCC cases are diagnosed at an advanced stage (2). Clear cell RCC (ccRCC) is the most frequent histological subtype, accounting for approximately 75% of all renal tumors (3). Approximately 20% of patients with metastatic RCC (mRCC) have sarcomatoid elements. Sarcomatoid RCC (sRCC) is a rare subtype of RCC characterized by aggressive biology with rapid metastasis, unsatisfactory clinical outcomes, and limited efficacy of anti-angiogenic therapies (4–6).
Loss or mutation of the von Hippel-Lindau (VHL) gene is one of the primary characteristics of ccRCC that leads to the constitutive activation of the hypoxia-inducible factor, which further activates the vascular endothelial growth factor (VEGF) and increases angiogenesis in the ccRCC tumor microenvironment (7–12). Targeting the VEGF pathway with receptor tyrosine kinase inhibitors (TKIs), such as sunitinib, or anti-VEGF monoclonal antibodies, such as bevacizumab, is the first-line treatment for locally advanced or metastatic RCC (13, 14). However, almost all patients develop drug resistance over time, and particular patient subgroups, including those with sRCC and/or those expressing the programmed death-ligand 1 (PD-L1), hardly benefit from VEGF pathway blockade (15–17). Therefore, it is necessary to explore novel therapeutic targets and drug combinations for patients with mRCC (18, 19).
Intervention with immune checkpoint inhibitors (ICIs), such as anti-PD-L1 antibody atezolizumab, has induced durable responses and improved the survival of patients with mRCC (16, 20). T cell-mediated tumor cytotoxicity of atezolizumab can be strengthened by counteracting the VEGF-mediated immunosuppressive effect via the addition of bevacizumab (21). Owing to variable hypervascularity, immune cell infiltration, and PD-L1 expression in ccRCC, blocking the VEGF pathway and PD-L1 axis as a combination therapy has significantly prolonged the overall survival (OS) of patients with mRCC. A phase 2 study revealed that in a subset of patients with mRCC with PD-L1 expression, compared to sunitinib as a single drug, atezolizumab combined with bevacizumab significantly increased progression-free survival (PFS) and percentage of patients achieving an objective response, indicating the complementary activity of bevacizumab and atezolizumab in patients with mRCC (20). To reduce the financial burden and side effects of tumor therapy, it is necessary to develop effective strategies to select a subgroup of patients who can achieve optimal improvement with a specific combination therapy for mRCC.
In this study, we aimed to correlate the clinical annotation with molecular mechanisms by comprehensively analyzing the multi-omics information of 407 patients with advanced RCC from a randomized global phase III trial (IMmotion151). We also established a novel and promising prognostic model composed of nine immunotherapy-associated genes to accurately stratify a subset of patients with advanced RCC who can benefit from anti-angiogenic combined with ICB (atezolizumab plus bevacizumab) therapy. Moreover, our model can be used to develop personalized treatment strategies for patients with advanced RCC.
2 Materials and methods
2.1 Collection and processing of data
To determine the correlation between the immune-related risk score (IRS) and efficacy of cancer therapy, five immunotherapeutic cohorts with available RNA-seq data and clinicopathological parameters were included in this study: (1) IMmotion151 cohort, advanced patients with RCC treated with atezolizumab plus bevacizumab (22), (2) JAVELIN Renal 101 trial, advanced patients with RCC treated with the combination of avelumab (anti-PD-L1) + axitinib (TKI targeting VEGF receptors) vs. sunitinib (multitarget TKI) (23), (3) E-MTAB-3218 dataset, patients with mRCC treated with nivolumab (anti-PD-1 ICI) (24), (4) IMvigor210 cohort, patients with advanced urothelial cancer treated with atezolizumab (25), and (5) GSE78220 cohort, patients with metastatic melanoma treated with pembrolizumab (anti-PD-1 antibody) (26).
All data from the IMmotion151 cohort is deposited in the European Genome-Phenome Archive under the accession number EGAS00001004353, and we obtained it according to Hoffmann-La Roche policy. Clinical response information and normalized RNA-seq data were acquired from the supplementary material of Choueiri et al. (23). Original data of E-MTAB-3218 dataset were downloaded from https://www.ebi.ac.uk/biostudies/arrayexpress/studies/E-MTAB-3218?accession=E-MTAB-3218# (24). Additionally, RNA-seq and clinical data for the IMvigor210 cohort were obtained from http://research-pub.gene.com/IMvigor210CoreBiologies. Raw data were normalized using the “DEseq2” R package and further transformed into TPM values. RNA-seq data (FPKM-normalized) and the clinical phenotypes of 28 melanoma patients in the GSE78220 cohort were downloaded from https://www.ncbi.nlm.nih.gov/geo/query/acc.cgi?acc=GSE78220. Additionally, well-recognized immune-related genes were downloaded from http://www.gsea-msigdb.org/gsea/msigdb/index.jsp (27).
Above datasets merely contain anonymized and de-identified patient information. Secondary analysis of de-identified data was confirmed exempt from review by the medical ethics committee of Hunan Cancer Hospital and the Affiliated Cancer Hospital of Xiangya School of Medicine as it was classified as negligible risk research. Thus, our study was exempt from the ethical review or the patient consent.
2.2 Establishment of a weighted gene co-expression network (WGCNA)
WGCNA is a widespread systematic algorithm used to generate gene modules with similar expression patterns and determine the correlations between modules and clinical traits (28). In this study, we screened the immune-related gene expression profiles in the IMmotion151 cohort and further identified a correlation network including significant clinical characteristics and genes using the “WGCNA” R package. We also developed an adjacency matrix to characterize the correlation strength between the nodes, which was further changed to a topological overlap matrix. Subsequently, modules containing more than 30 genes were identified via hierarchical clustering. To compare the co-expression levels, modules were clustered based on their correlation with module eigengenes (MEs). When the correlation of MEs > 0.80, module merging was performed, indicating that the expression profiles of the modules were similar (29). Pearson’s correlation coefficient was used to assess the correlations between the modules and various clinicopathological parameters. Finally, gene significance (GS) and module membership (MM) were used to quantify the relationships between the genes and the clinicopathological characteristics in the module. Hub genes were considered as those with MM > 0.8 and GS > 0.2 (29).
2.3 Identification of significant immune-related differentially expressed genes (DEGs) between responders and non-responders
Based on the results of WGCNA analysis, 269 immunotherapy-associated genes in the turquoise module were selected for further analysis. Meanwhile, DEGs between the patients with complete response (CR) and those with progressive disease (PD) in the IMmotion151 cohort were identified using the “ggplot2” R package (29). Nine immune-related genes significantly affecting the patient responsiveness to immunotherapy were ultimately identified using the intersection of the above two kinds of genes and used to construct an IRS model.
2.4 Functional and pathway enrichment analyses
Gene ontology (GO) and Kyoto Encyclopedia of Genes and Genomes (KEGG) analyses were conducted using the “clusterProfiler” R package to identify the DEG-associated signaling pathways and biological processes (30, 31). Pathways with a nominal P < 0.05 and false-discovery rate (FDR) < 0.05 were considered to be statistically significant.
2.5 Establishment and validation of an IRS model
Given the individual heterogeneity and intricacy of the clinical outcomes of advanced RCC cases treated with ICB combined with anti-angiogenic drugs, we formulated a scoring system, termed as the IRS model, using the ssGSEA algorithm on the basis of the mRNA expression levels of the identified nine immunotherapy-related genes in a single sample to quantify the prognostic level of each patients with mRCC for in-depth analysis.
Optimal cut-off point identified by the “surv-cutpoint” function of the “survminer” R package stratified all advanced RCC cases in the IMmotion151 cohort into high- or low-risk subgroups. In this approach, different values are grouped as cut-off values for statistical testing, and the result with the lowest P value is considered as the optimal cut-off point that corresponds to the most significant association with the clinical outcome.
A heat map was constructed to visualize the IRS distribution and clinicopathological parameters. Survival analysis between high- and low-risk group were conducted using Kaplan–Meier curves with log-rank test and the “survival” R package (32). Hazard ratios (HRs) and the corresponding 95% confidence intervals (CIs) were estimated.
Area under the curve (AUC) values of the receiver operating characteristic (ROC) curves established using the “survival ROC” R package were used to evaluate the predictive efficiency of the IRS model (33). In addition, to test the robustness of our IRS model, we verified its predictive capability using other external independent datasets: JAVELIN Renal 101, E-MTAB-3218, IMvigor210, and GSE78220 cohorts.
An identical median value based on the IMmotion151 cohort was also applied to the validation groups, effectively categorizing all patients into high- and low-risk groups.
2.6 Correlations between IRS and common biological processes
We further determined the correlations between IRS and subsequent biological processes. Mariathasan et al. (25) curated multiple gene sets associated with specific biological pathways, including (1) CD8+ T-effector signature (34), (2) antigen processing machinery (35), (3) epithelial–mesenchymal transition (EMT) biomarkers (26, 36, 37), (4) immune checkpoints (25).
2.7 Correlation between IRS and drug sensitivity
RNA-seq data of approximately 1000 tumor cell lines, AUC values for evaluating the efficacy of antineoplastic drugs in tumor cell lines, and targets or pathways of drugs were downloaded from the Genomics of Drug Sensitivity in Cancer (GDSC; https://www.cancerrxgene.org/) (38). Spearman correlation coefficient was used to evaluate the correlation between drug sensitivity and the IRS model, and |Rs| > 0.2 and P-value < 0.05 were considered to be significant.
3 Results
3.1 Use of WGCNA to screen immunotherapy-related genes
All immune-related genes from GSEA are listed in Supplementary Table 1. After we intersected the above immune-related genes with the RNA-seq data of 407 patients with advanced RCC from the IMmotion151 cohort, 942 immune-related genes were identified and further subjected to WGCNA analysis (Supplementary Table 2). In line with the standard scale-free network distribution, the soft threshold power value was determined to be three (Supplementary Figure 1). Based on this dissimilarity, a dendrogram of all the gene clusters was formulated, which displayed 10 different modules (Figure 1A). Correlations among all clinical modules are illustrated in Figures 1B, C. We further assessed the correlations between MEs and clinical traits, including PD-L1 IHC, MSKCC risk score, PFS, objective response, metastatic status, and sarcomatoid histology. Turquoise module was most significantly associated with the objective response of patients with mRCC to atezolizumab plus bevacizumab (r = 0.45, P < 0.0001) (Figure 1D), indicating that genes in the turquoise module potentially exert a crucial effect on the clinical outcome of atezolizumab plus bevacizumab interventions. This turquoise module was further analyzed, and the genes in this module were found to be significantly correlated to the efficacy of atezolizumab plus bevacizumab therapy (r = 0.76, P < 0.0001) (Figure 1E).
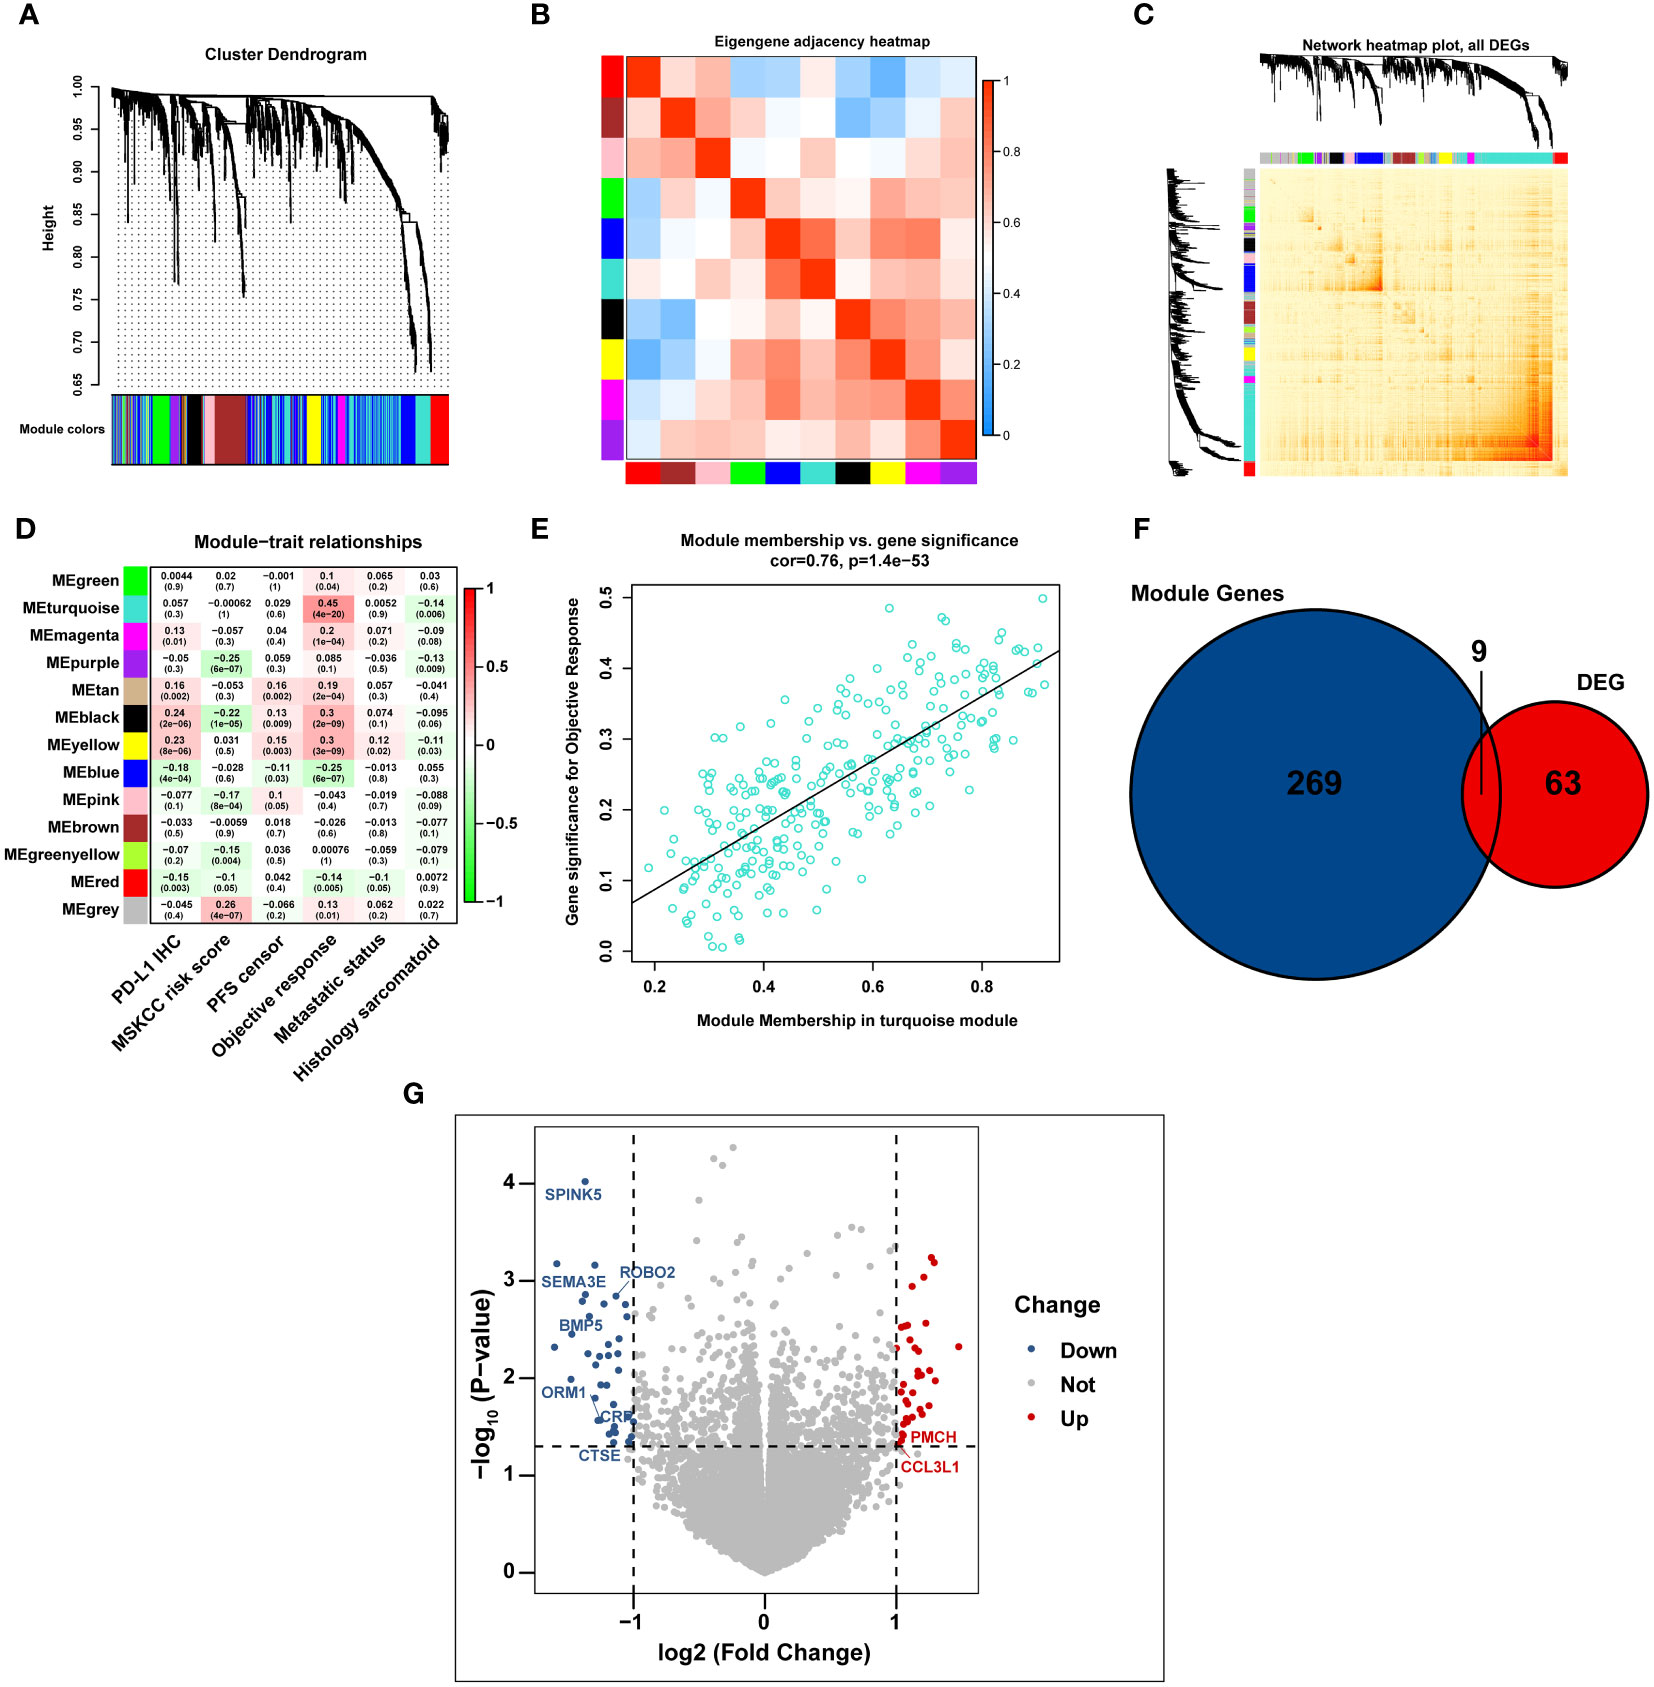
Figure 1 The immunotherapy-related genes are identified by WGCNA analysis. (A) Cluster dendrogram representing immune-related genes clustering based on different metrics. (B, C) Heatmap depicting the correlation coefficient in the modules. (D) Heatmap displaying the correlation between the module eigengenes and multiple clinical parameters in RCC. (E) Scatter plot exhibiting the correlation coefficient in the turquoise module. (F) Venn diagram illustrating the intersection of immune-related genes and immunotherapy-related DEGs in IMmotion150 cohort. (G) Volcano plot depicting immunotherapy-related DEGs between responders and non-responders.
We analyzed the gene expression profiles of 23 responders (patients with CR) and 75 non-responders (patients PD) in the IMmotion151 cohort, and identified 72 DEGs associated with the effects of atezolizumab plus bevacizumab (│log2FC│ > 1, P < 0.05, FDR < 0.05) (Supplementary Table 3). Moreover, we cross-referenced the above 72 DEGs and all genes in the turquoise module to select a total of nine DEGs, including seven downregulated DEGs in responders (serine protease inhibitor Kazal type 5 [SPINK5], semaphorin 3E [SEMA3E], roundabout guidance receptor 2 [ROBO2], bone morphogenetic protein 5 [BMP5], orosomucoid 1 [ORM1], C-reactive protein [CRP], and cathepsin E [CTSE]; log2FC < 1; P < 0.05) and two up-regulated DEGs in responders (promelanin-concentrating hormone (PMCH) and C-C motif chemokine ligand 3-like 1 [CCL3L1]; log2FC > 1; P < 0.05) (Figures 1F, G).
3.2 Biological functions of DEGs associated with the efficacy of atezolizumab plus bevacizumab therapy
We further identified the mRNA expression profiles of the above nine genes in mRCC and found that, compared with the responders to atezolizumab plus bevacizumab therapy in the IMmotion151 cohort, the expression levels of seven genes (SPINK5, SEMA3E, ROBO2, BMP5, ORM1, CRP, and CTSE) were significantly increased and those of two genes (PMCH and CCL3L1) were decreased in the non-responders (P < 0.05) (Figure 2A). GO analysis of the nine DEGs linked them to neutrophil-mediated immunity, leukocyte migration, acute inflammatory response, humoral immune response, and cell chemotaxis (Figure 2B; Supplementary Table 4), most of which were associated with the modulation of immunity and immunotherapy. Similarly, KEGG pathway analysis revealed that these DEGs were correlated with cytokine–cytokine receptor interactions, complement and coagulation cascades, antigen processing and presentation, and neutrophil extracellular trap formation (Figure 2C; Supplementary Table 5), indicating their significance and conferring the basis to investigate a potential association between these genes and immunophenotypes.
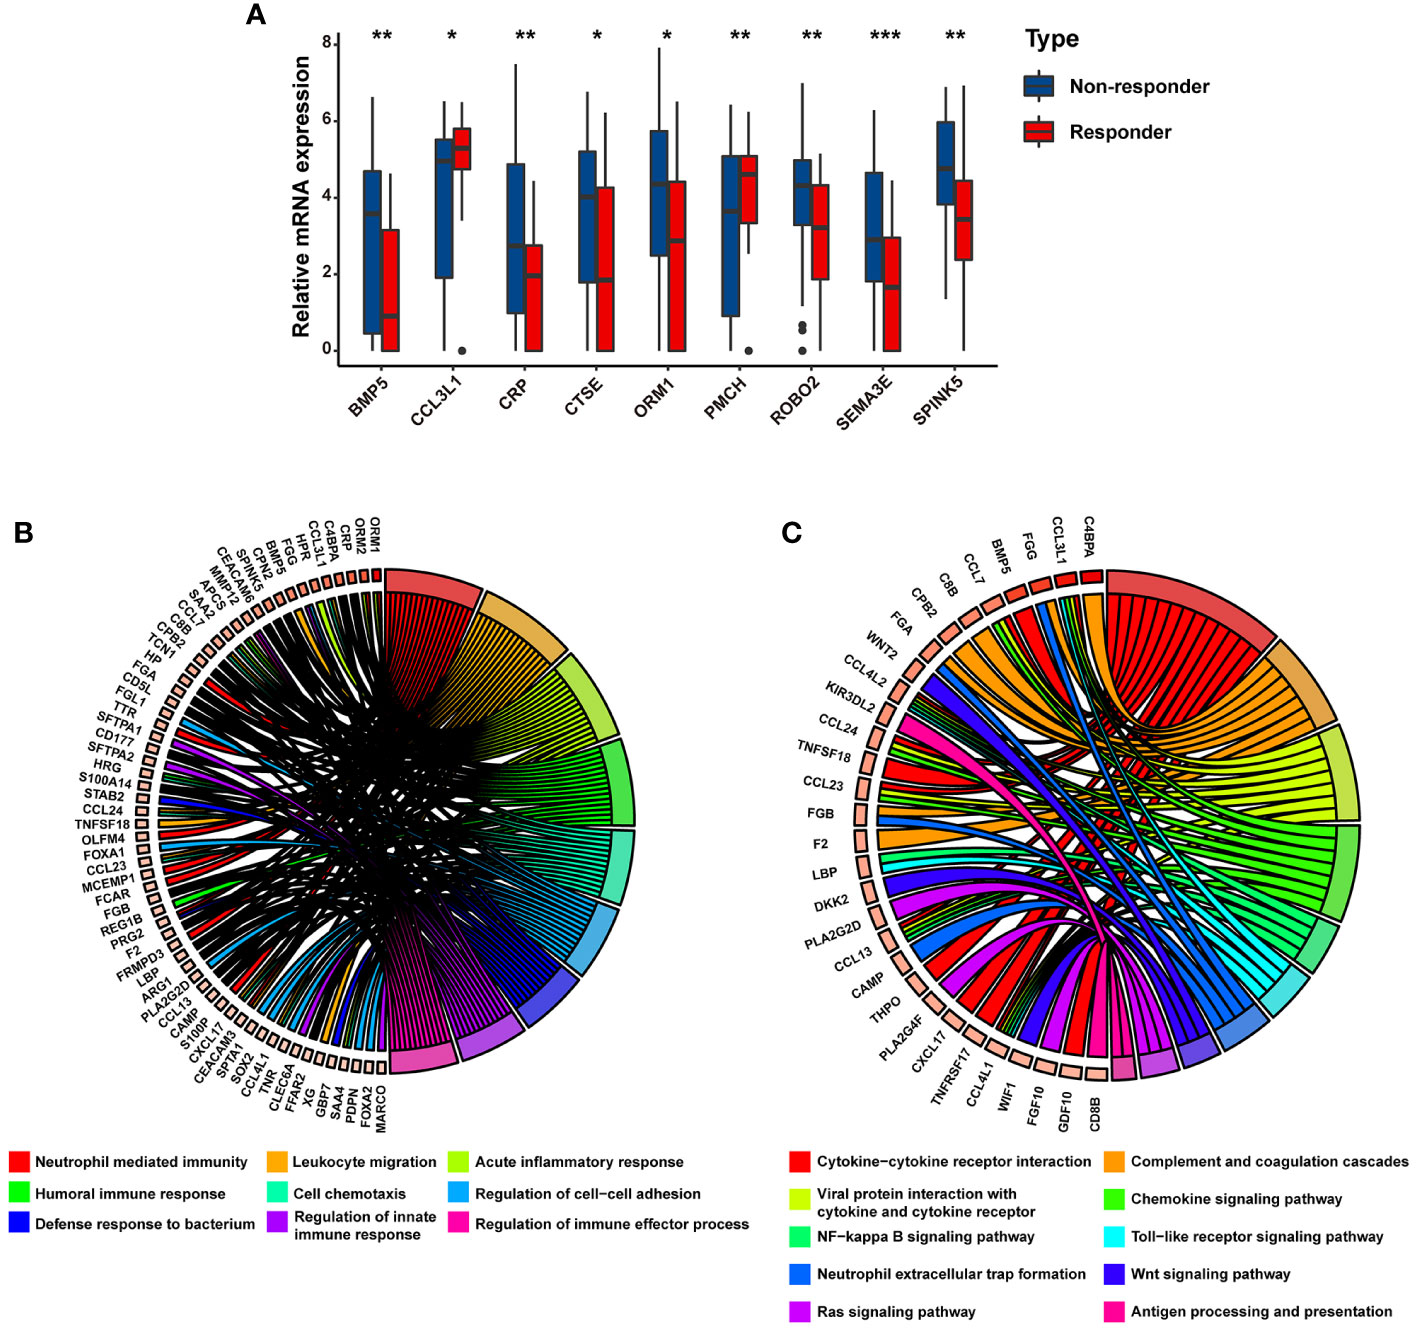
Figure 2 The potential biological processes associated with immunotherapy-related DEGs are determined by functional analysis. (A) Bar charts representing the expression levels of immunotherapy-related DEGs between responders and non-responders. Circular plot representing the potential biological pathways related to immunotherapy-related DEGs based on (B) GO analysis and (C) KEGG analysis. * p<0.05, ** p<0.01, *** p<0.001.
3.3 Differences in the biological roles and clinical outcomes of IRS-high and -low groups
Based on the strength of the optimal cut-off point (–0.46), 407 individuals with mRCC were stratified into high- and low-risk groups (high: IRS > –0.46 and low: IRS < –0.46) (Supplementary Table 6). To investigate the potential mechanism of the impact of IRS on atezolizumab plus bevacizumab therapy for mRCC, a combined heat map was constructed to visually demonstrate the correlations between IRS and multiple clinicopathological parameters, including PD-L1 IHC, MSKCC risk score, objective response, metastatic status, and sarcomatoid histology, in the high and low IRS groups. We compared the high and low IRS groups in the IMmotion151 cohort and found that more patients in the IRS-low group had positive PD-L1 IHC results than those in the IRS-high group. Metastatic tumors were primarily distributed in the IRS-high cluster, whereas the proportion of sarcomatoid histological subtypes in the IRS-low group was greater than that in the IRS-high group. Additionally, patients with low IRS were primarily characterized by a higher expression of CD8+ T-effectors, antigen-processing machinery, and immune checkpoint signatures in the IRS-low group than in the IRS-high group. Conversely, patients in the IRS-high group showed relatively high expression levels of EMT-associated genes (Figure 3A). We further assessed the clinical outcomes of patients treated with atezolizumab plus bevacizumab in the IRS-high and -low groups. Survival analysis revealed that short PFS in patients with high IRS (HR = 1.91; 95% CI = 1.43–2.55; P < 0.0001) (Figure 3B).
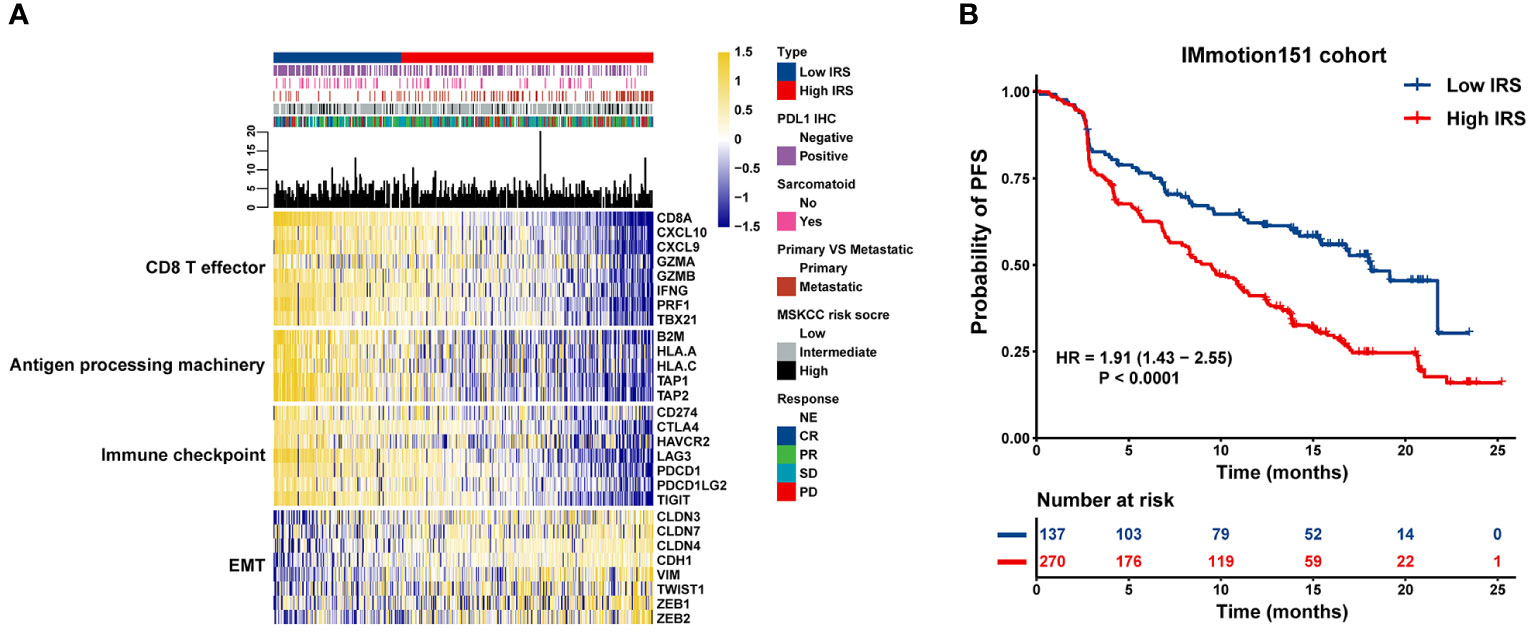
Figure 3 Association between transcriptional signatures, clinical outcome to atezolizumab plus bevacizumab and the IRS model. (A) Heatmap displaying the IRS distribution grouped by transcriptional signatures. (B) Kaplan-Meier curves of PFS in mRCC patients with high or low IRS in the IMmotion151 cohort.
Furthermore, IRS was significantly higher in the SD/PD group than in the CR/PR group (Figure 4A), indicating that IRS was negatively associated with the magnitude of response to atezolizumab plus bevacizumab in mRCC. Compared to tumors that were negative for PD-L1 IHC, tumors that were positive for PD-L1 IHC exhibited lower IRS (Figure 4B). We also observed enrichment of metastatic tumors (Figure 4C) and sarcomatoid histological subtypes (Figure 4D) in the IRS-high group. These findings suggest that the IRS can predict the efficacy of atezolizumab plus bevacizumab.
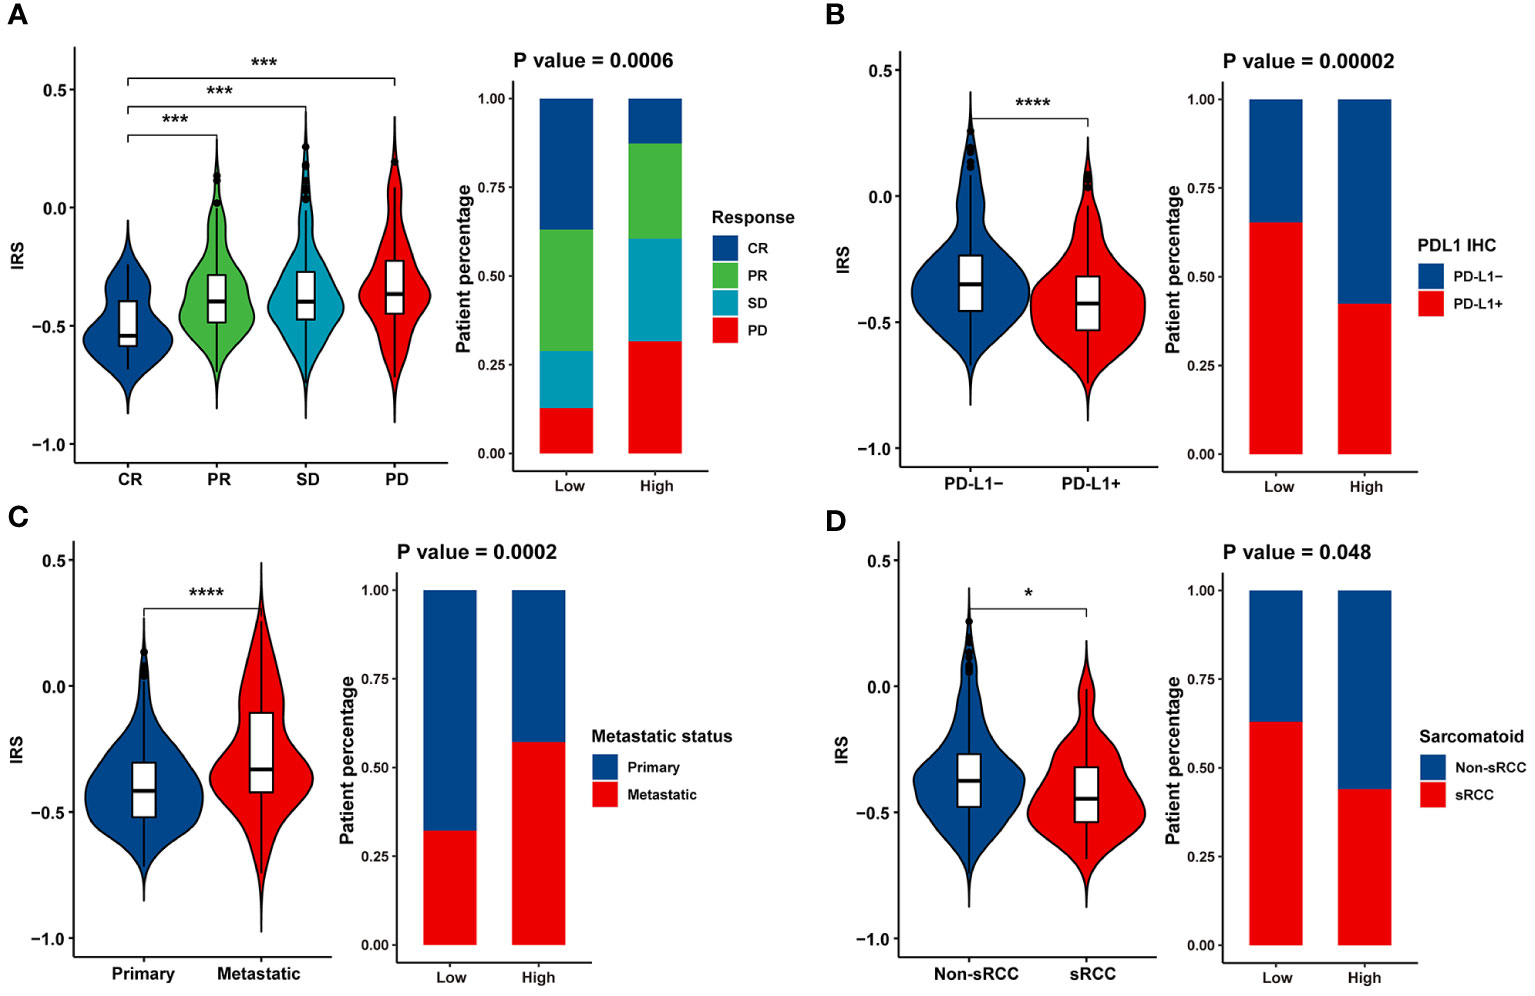
Figure 4 Association between clinicopathological parameters and the IRS model. Violin plot and bar chart howing the correlation between the IRS and (A) response to Atezolizumab + Bevacizumab, (B) PD-L1 expression, (C) metastatic status and (D) histological subtype. * p<0.05, *** p<0.001, **** p<0.0001.
3.4 Validation of the IRS model with multiple immunotherapy datasets
ROC curve was used to determine the ability of the IRS model to distinguish between immunotherapy responders and non-responders. The IRS model displayed a satisfactory performance to differentiate responders from non-responders, with an AUC of 0.822 (95% CI = 0.782–0.863) in the IMmotion151 cohort (Figure 5A). We also selected two external independent datasets: the JAVELIN Renal 101 cohort (patients with mRCC treated with a combination of avelumab and axitinib) and the E-MTAB-3218 cohort (patients with mRCC treated with nivolumab). When assessing survival prediction, we found that the AUC of our IRS model was 0.751 (95% CI = 0.699–0.803) in the JAVELIN Renal 101 cohort (Figure 5B) and 0.776 (95% CI = 0.684–0.868) in the E-MTAB-3218 cohort (Figure 5C). Additionally, we validated our model in the IMvigor210 cohort (patients with advanced urothelial cancer who received atezolizumab therapy) and GSE78220 (patients with metastatic melanoma who received pembrolizumab therapy), with AUC of 0.902 (95% CI = 0.868–0.936) (Supplementary Figure 2A) and 0.879 (95% CI = 0.7437–1) (Supplementary Figure 2B), respectively. Therefore, our results highlight that IRS has a favorable capability to stratify a subset of patients who will benefit from immunotherapy.
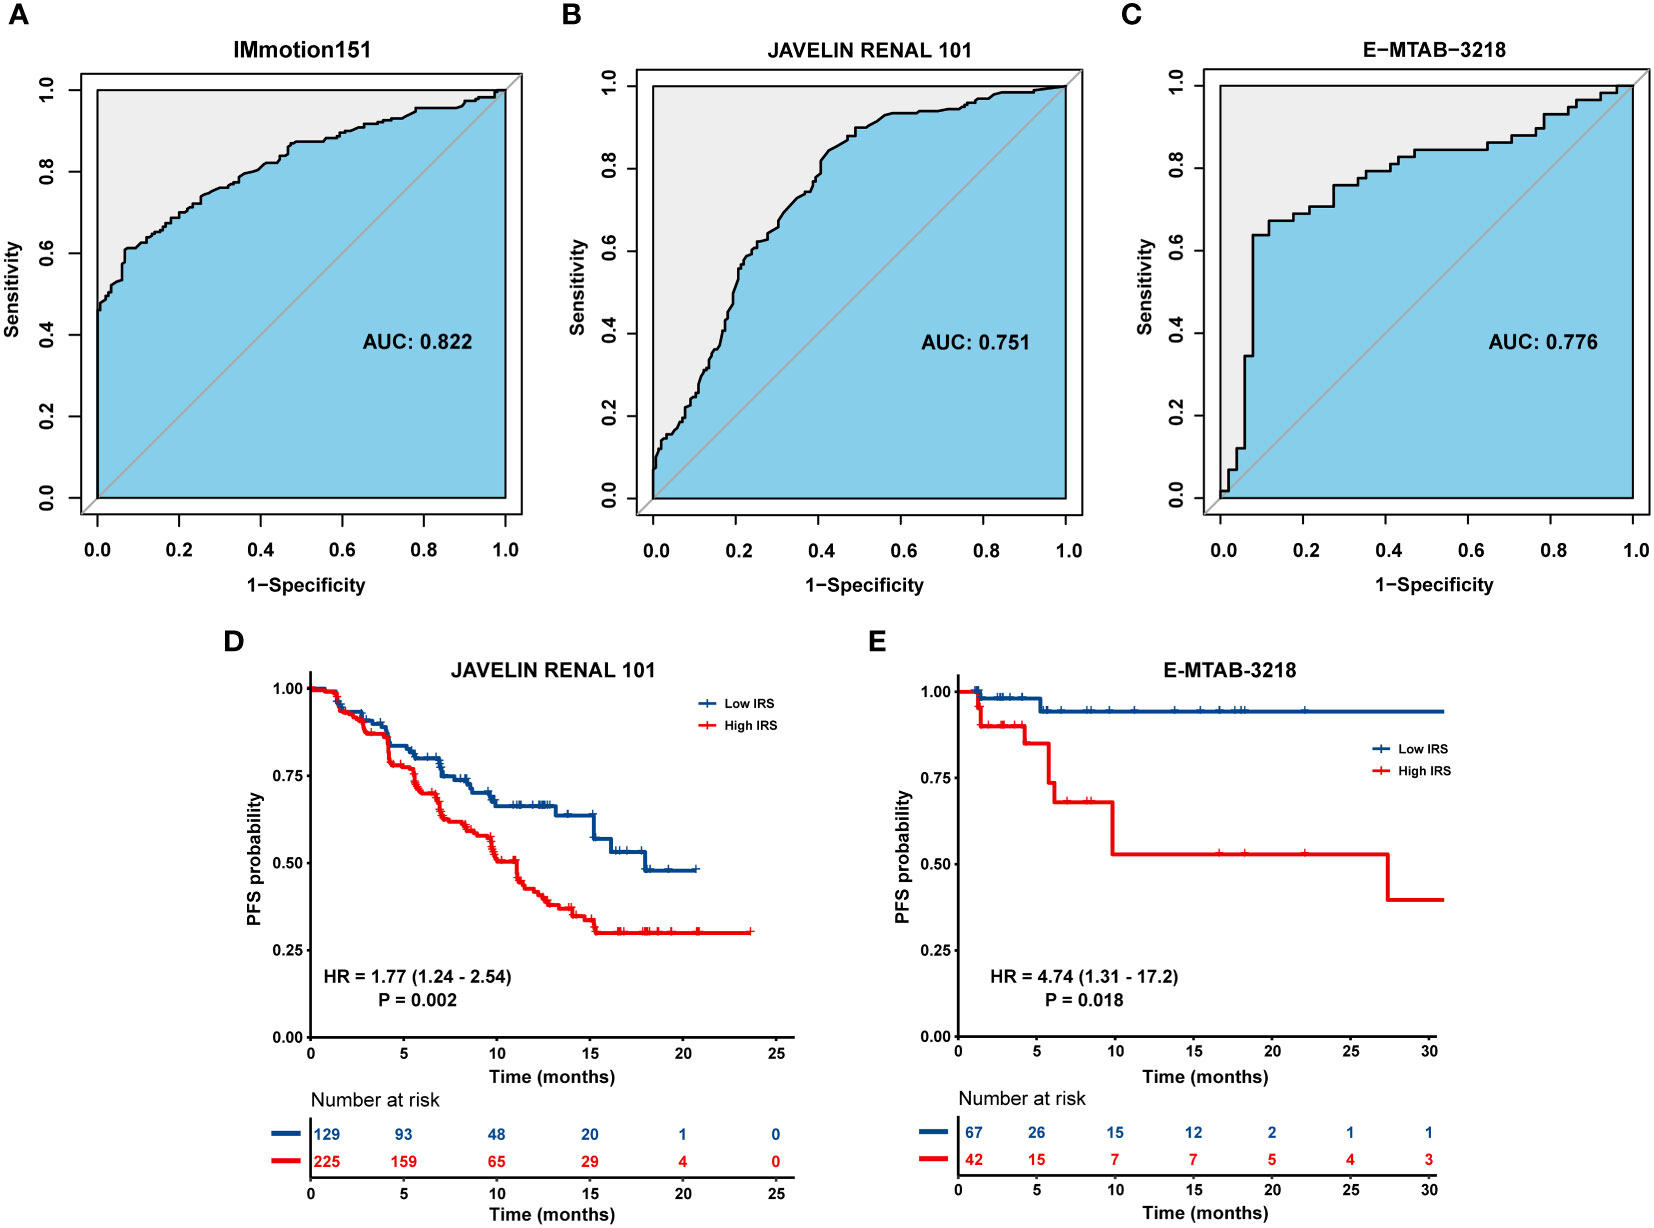
Figure 5 Validation of the IRS in multiple immunotherapy datasets. ROC curve displaying the predictive power of the IRS in (A) IMmotion151 cohort, (B) JAVELIN Renal 101 cohort and (C) E-MTAB-3218 cohort. Kaplan-Meier curves of PFS in tumor patients with high or low IRS in (D) JAVELIN Renal 101 cohort and (E) E-MTAB-3218 cohort.
Patients with high IRS exhibited an inferior prognosis compared to those with low IRS in the JAVELIN Renal 101 cohort (HR = 1.77; 95% CI = 1.24–2.54; P = 0.002) (Figure 5D) and E-MTAB-3218 cohort (HR = 4.74; 95% CI = 1.31–17.2; P = 0.018) (Figure 5E). Similarly, patients in IRS-high group were characterized with a shorter OS than those in IRS-low group in the IMvigor210 cohort (HR = 2.59; 95% CI = 1.87–3.58; P < 0.001) (Supplementary Figure 2C) and GSE78220 cohort (HR = 4.22; 95% CI = 1.11–16.0; P = 0.034) (Supplementary Figure 2D).
3.5 Correlation between IRS and anti-tumor chemotherapy efficacy
A total of 26 correlated pairs between the IRS model and drug sensitivity in the GDSC database were analyzed using Spearman’s correlation analysis (38). There was significant correlation between drug sensitivity and IRS in 11 pairs, including CGP-082996, CGP-60474, and bicalutamide (Rs < –0.2, P < 0.05). In contrast, 15 pairs, including sunitinib, sorafenib, and temsirolimus (Rs > 0.2, P < 0.05), were characterized by significant correlation between drug resistance and the IRS model (Figure 6A). In addition, drugs whose sensitivity correlated with low IRS primarily targeted chromatin histone acetylation, p53 pathway, phosphoinositide 3-kinase (PI3K)/mammalian target of rapamycin (MTOR) signaling and protein stability, and degradation signaling pathways. However, drugs whose sensitivity was linked to high IRS mostly targeted the AKT2, IKK2, CDK2, and chromatin histone methylation signaling pathways (Figure 6B). Collectively, these results indicate that our IRS model is also associated with chemotherapy response in RCC.
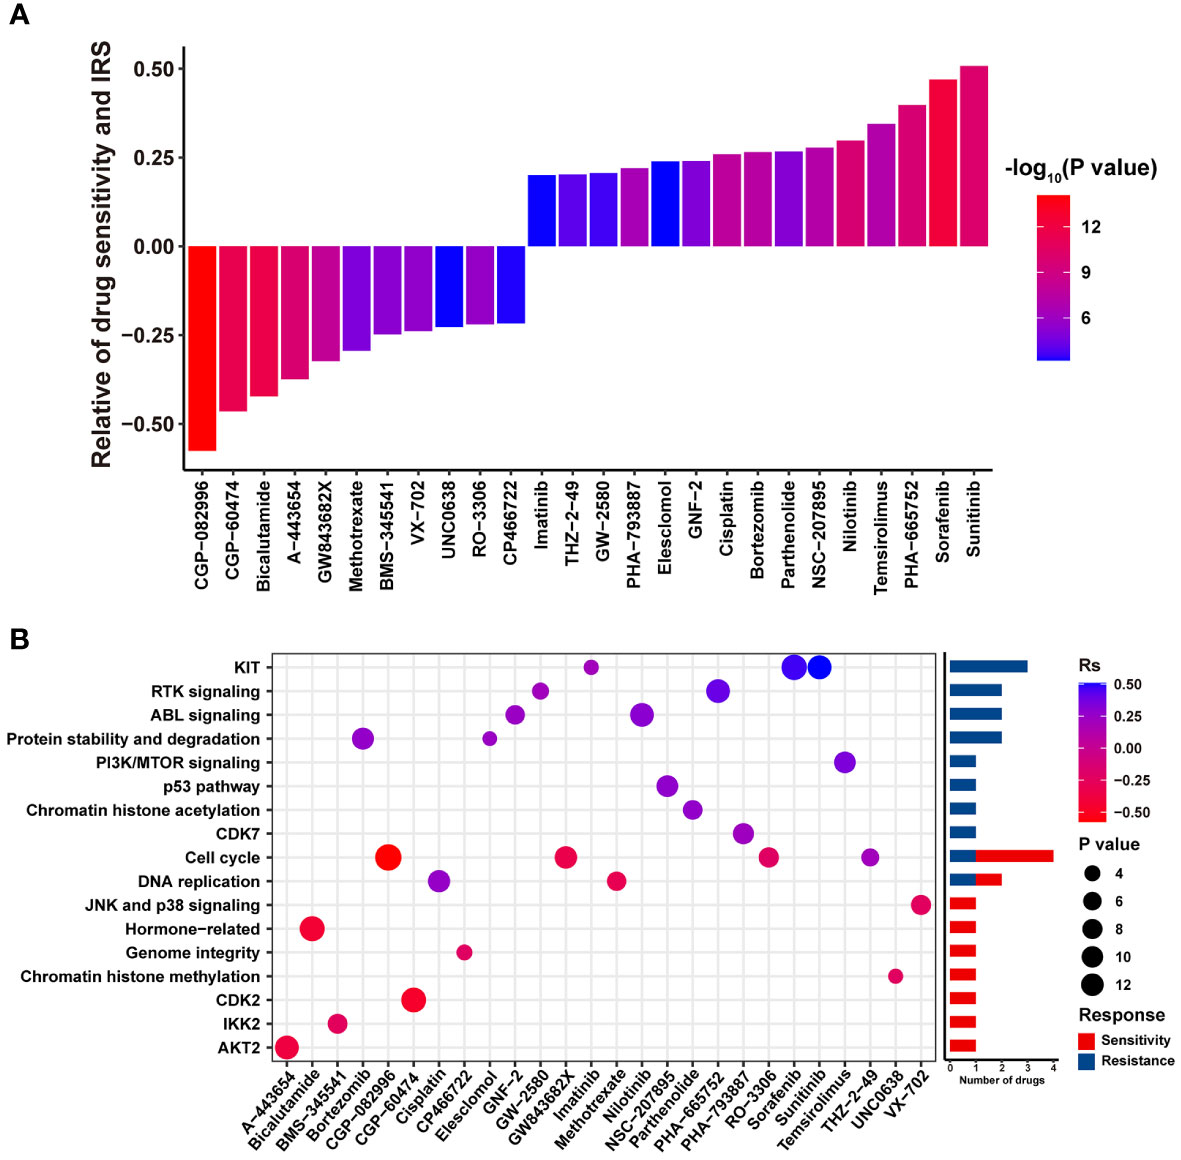
Figure 6 The potential relationship between the IRS model and efficacy of antitumor chemotherapy. (A) Box diagram displaying the correlation between the IRS and drug sensitivity. Rs > 0 or Rs < 0 indicated drug resistance or drug sensitivity, respectively. (B) Dot plot summarizing the signal pathways related to drugs that were resistant or sensitive to the IRS.
4 Discussion
In our study, specific promising gene biomarkers were determined by investigating RNA-Seq data from the IMmotion151 cohort. Currently, The Cancer Genome Atlas (TCGA) and Gene Expression Omnibus (GEO) databases are considered as data sources for developing RCC prognosis prediction models in the majority of publications, which fails to effectively promote the prediction accuracy of immunotherapy in RCC. Thus, we extracted mRCC cases from the IMmotion151 cohort to conduct this study, which avoided the potential effect of non-locally advanced RCC on risk prediction models and scoring systems.
We established an immune-related risk score model to evaluate the efficacy of atezolizumab plus bevacizumab in patients with mRCC and further verified our model based on multiple cohorts. Our report demonstrated that in the IMmotion151 cohort, mRCC cases with low IRS were associated with a favorable prognosis and effective responsiveness to atezolizumab plus bevacizumab. Hub genes significantly associated with the efficacy of atezolizumab plus bevacizumab in the turquoise module were initially identified using WGCNA. Nine immunotherapy-related DEGs were confirmed following the overlap of hub genes and DEGs between patients with PD and CR.
Among the nine immunotherapy-related DEGs (SPINK5, SEMA3E, ROBO2, BMP5, ORM1, CRP, CTSE, PMCH, and CCL3L1), differential analysis showed that SPINK5 was significantly overexpressed in head and neck squamous cell carcinoma (HNSCC) samples compared to that in normal tissues, and SPINK5 expression levels were positively associated with Treg cells in the tumor microenvironment (39). SEMA3E triggered macrophages-mediated inflammation (40). Inflammation contributes greatly to tumorigenesis and tumor development (41), indicating that SEMA3E potentially accelerates tumor progression by regulating chronic inflammation, which is a hallmark of various malignancies (42). ROBO2 belongs to the ROBO family and is a conserved transmembrane receptor protein that is primarily located in the nervous system, vascular endothelial cells, and muscle cells (43). SLIT2/ROBO2-mediated PI3K-γ activation accelerated microglia/macrophage chemotaxis and tumor-supportive polarization, thus enhancing macrophage invasion and diminishing efficacy of chemotherapy and immunotherapy in gliomas (44). BMP5 is recognized as a secreted growth factor and a member of the transforming growth factor-beta superfamily, which exerts crucial effects on the pathogenesis of inflammatory and autoimmune disorders, including Keshan disease (45) and autoimmune encephalomyelitis (46), BMP5 triggered keratin expression in adherent bone marrow cells, thereby contributing to the progression of chronic cutaneous neoplasms (47). ORM1 is linked to tumor immunity, including antigen processing and presentation, T-cell receptor signaling, and cytokine-cytokine receptor interactions. Specifically, ORM1 potentially acts as an inhibitory factor to protect tumor cells from attack by the immune system, thereby leading to the immune escape of tumors (48). CRP is a biomarker of systemic inflammation and can be generated by RCC cells (49). Increased CRP levels are linked to the infiltration of immunosuppressive cells, including regulatory T (Treg) cells and tumor-associated macrophages, and thus predict undesirable outcomes in patients (50–52). CTSE is associated with lipid metabolism. CTSE participates in antigen processing and modulates the processing of antigenic peptides during MHC class II-mediated antigen presentation (53). Some studies have demonstrated that CTSE is overexpressed in tumor tissues than in normal tissues in various types of cancer, such as bladder cancer (53), pancreatic cancer (54), and hepatocellular carcinoma (55). PMCH functions as a neuromodulator of neuronal function that regulates goal-directed behavior (56). Downregulation of PMCH in ccRCC is significantly associated with advanced TNM stage, distant metastasis, and undesirable outcomes (57). CCL3L1 belongs to the CC chemokine family, which exerts an anti-tumor effect by inducing multiple immune cells, including CD8+ T cells and immature dendritic cells (58). However, CCL3L1 overexpression is also involved in the progression of glioblastoma (59). Therefore, the characteristics of CCL3L1 in RCC should be further explored. Thus, the correlation between certain immunotherapy-related DEGs and immunotherapy may provide promising targets for immune checkpoint inhibitors in RCC treatment.
Notably, these genes were primarily associated with inflammation and immune responses. Inflammation is a well-known hallmark of tumor progression. Various inflammatory signaling cascades are closely related to tumorigenesis and the development of RCC, particularly the VHL (60), mTOR, tumor necrosis factor (TNF), and signal transducer and activator of transcription pathways (60–63). Additionally, inflammation-associated factors, TNF-α, CXCR4 and CCR3, are significantly correlated with the prognosis and staging of RCC cases (64). Inhibition of pro-inflammatory pathways may be an effective strategy to retard the development of RCC. For example, LY294002, which targets the PI3K/AKT pathway, is potentially conducive to the prognosis of patients with RCC (65). Immunotherapy with nivolumab combined with ipilimumab has great potential for the treatment of RCC (66).
It has been demonstrated that kidney stone disease (KSD) is linked to RCC and RCC is more frequent among individuals with kidney stones (67–70). KSD is primarily composed of monohydrate (COM) crystals (71). COM crystals triggers renal cell injury through inducing reactive oxygen species overproduction and accelerating oxidative DNA damage (71, 72). Oxidative DNA damage exerts crucial effects on inflammation and the initiation and development of RCC (73, 74).
A recent study demonstrated that COM crystals accelerate the process of EMT, strengthen the invasion ability, cell-aggregate formation, chemoresistance to cisplatin, and secretion of VEGF, and trigger the overexpression of oncogene TPX2 and the downregulation of tumor suppressor genes, including PTEN, VHL, and ARID1A, which are conventional inflammation-associated factors, ultimately exhibiting several carcinogenic characteristics in non-cancerous renal cells (70). Thus, there is a potential and sophisticated crosstalk between KSD, RCC, and inflammation.
The validation in additional four dependent cohorts demonstrated that the risk model exhibited satisfactory and robust prediction efficiency. The diagnosis and treatment of individuals with tumors will benefit from the validity and rationality of constructing a model based on big data algorithms. A risk model incorporating nine genes has generally been studied for multiple tumors; however, there are no reports on immunotherapy-related risk models for RCC. Patients with mRCC with low-risk scores showed improved PFS and could benefit from the dual combination of nivolumab plus ipilimumab, as evaluated by the IRS model, whereas cases in the high-risk group displayed numerically inferior results for PFS with nivolumab + ipilimumab. In this study, patients with mRCC with low risk scores were enriched in the CD8+ T effector, antigen processing machinery, and immune checkpoint pathways. In contrast, patients with high-risk scores displayed greater expression of EMT-related genes. These results provide a molecular explanation for the better prognosis of favorable-risk cases with therapeutic regimens comprising nivolumab + ipilimumab. Previous studies have shown that ICIs block inhibitory immune receptors and activate dysfunctional T cells, including CD8+ T cells. CD8+ T effectors in the adaptive immune system exert a potent anti-tumor immune response and form the cornerstone of tumor immunotherapy (75). The antigen-processing machinery exerts a vital impact on the synthesis and expression of HLA class I tumor antigen-derived peptide complexes that trigger the identification and elimination of malignant cells mediated via cognate T cells (76).
We performed a thorough molecular analysis of 407 samples from patients with advanced RCC who underwent atezolizumab plus bevacizumab therapy and further established the first prognostic model to accurately distinguish responders from non-responders based on a randomized global Phase III clinical trial IMmotion151 cohort. Specifically, patient-reported outcomes (PROs) in IMmotion151 suggest a lower overall treatment burden with atezolizumab plus bevacizumab than with sunitinib in patients with treatment-naïve mRCC and provide further evidence for the clinical benefit of this regimen. A report evaluated PROs in the phase III IMmotion151 trial and demonstrated that compared with sunitinib in patients with mRCC, those receiving atezolizumab plus bevacizumab therapy were characterized by a lower overall therapy burden, including longitudinal and time to deterioration for core and RCC symptoms and their interference with daily life, therapy side effects, and health-related quality of life (77). Another study indicated that although a clinical benefit was revealed in atezolizumab plus bevacizumab based on PFS analysis, the final analysis exhibited a similar median OS in patients treated with atezolizumab plus bevacizumab and sunitinib. Biomarker analysis demonstrated that sunitinib improved the median OS in patients whose tumors were characterized by a higher prevalence of angiogenesis; conversely, atezolizumab plus bevacizumab displayed a trend of improved OS in tumors with poor angiogenesis, but T-effector/proliferative, proliferative, or small nucleolar RNA transcriptomic profiles. These results potentially provide guidance for the individualized treatment of patients with mRCC (78).
This study has some limitations. Owing to the limited number of patients receiving immunotherapy and the complexity and difficulty in collecting clinical tissues from patients with advanced RCC treated with immunotherapy, we failed to conduct external verification based on our own dataset. Nevertheless, we validated our IRS model using four additional public immunotherapy cohorts to overcome this disadvantage. Moreover, our IRS model comprised nine immunotherapy-related DEGs. The biological properties and potential molecular mechanisms of these genes in mRCC need to be explored to facilitate the widespread clinical application of IRS models.
5 Conclusion
In conclusion, we identified the most significant immunotherapy-associated genes in patients with advanced RCC from the IMmotion151 cohort and developed a novel and promising immunotherapy prediction model and scoring system to estimate the responsiveness of patients with advanced RCC to atezolizumab plus bevacizumab therapy. Our model can further aid in patient stratification and development of personalized therapies for patients with untreated advanced RCC.
Data availability statement
The original contributions presented in the study are included in the article/Supplementary Material. Further inquiries can be directed to the corresponding author.
Ethics statement
Five datasets analyzed in our report merely contain anonymized and de-identified patient information. Secondary analysis of de-identified data was confirmed exempt from review by the medical ethics committee of Hunan Cancer Hospital and the Affiliated Cancer Hospital of Xiangya School of Medicine as it was classified as negligible risk research. Thus, our study was exempt from the ethical review or the patient consent.
Author contributions
XY and PC designed/planned the study and wrote the paper. PC performed computational modeling, acquired, and analyzed data. PC, FB, WT, and LJ performed imaging analysis. PC, FB, WT, LJ, and XY participated in discussion of related data. XY and PC drafted the manuscript. All authors contributed to the article and approved the submitted version.
Acknowledgments
The authors of this study have no contribution to data collection of the IMmotion151 cohort, the JAVELIN Renal 101 cohort, the E-MTAB-3218 cohort, the IMvigor210 cohort and GSE78220. We would like to thank above database for their share.
Conflict of interest
The authors declare that the research was conducted in the absence of any commercial or financial relationships that could be construed as a potential conflict of interest.
Publisher’s note
All claims expressed in this article are solely those of the authors and do not necessarily represent those of their affiliated organizations, or those of the publisher, the editors and the reviewers. Any product that may be evaluated in this article, or claim that may be made by its manufacturer, is not guaranteed or endorsed by the publisher.
Supplementary material
The Supplementary Material for this article can be found online at: https://www.frontiersin.org/articles/10.3389/fonc.2023.1127448/full#supplementary-material
Supplementary Figure 1 | The scale-free fit index and the mean connectivity of the soft-thresholding powers.
Supplementary Figure 2 | Validation of the IRS in the IMvigor210 cohort and GSE78220. ROC curve displaying the predictive power of the IRS in (A) IMvigor210 cohort, (B) and GSE78220 cohort. Kaplan-Meier curves of OS in tumor patients with high or low IRS in (C) IMvigor210 cohort and (D) GSE78220 cohort.
Abbreviations
ICB, Immune-checkpoint blockade; RCC, renal cell carcinoma; RNA-seq, RNA-sequencing; mRCC, metastatic RCC; sRCC, Sarcomatoid RCC; TKIs, tyrosine kinase inhibitors; DEGs, differentially expressed genes; WGCNA, Weighted Gene Co-expression Network; MEs, module eigengenes; IRS, immune-related risk score; ssGSEA, single sample gene set enrichment analysis; ROC, receiver operating characteristic; EMT, epithelial-mesenchymal transition; AUC, area under the curve; ICIs, immune checkpoint inhibitors; OS, overall survival; PFS, progression-free survival; GO, Gene ontology; KEGG, Kyoto Encyclopedia of Genes and Genomes; GDSC, Genomics of Drug Sensitivity in Cancer; GS, gene significance; MM, module membership; HR, Hazard ratio; 95% CI, 95% confidence interval; SD, stable disease; PD, progressive disease; CR, complete response; PR, partial response.
References
1. Bray F, Ferlay J, Soerjomataram I, Siegel RL, Torre LA, Jemal A. Global cancer statistics 2018: GLOBOCAN estimates of incidence and mortality worldwide for 36 cancers in 185 countries. CA Cancer J Clin (2018) 68(6):394–424. doi: 10.3322/caac.21492
2. Dabestani S, Thorstenson A, Lindblad P, Harmenberg U, Ljungberg B, Lundstam S. Renal cell carcinoma recurrences and metastases in primary non-metastatic patients: A population-based study. World J Urol (2016) 34(8):1081–6. doi: 10.1007/s00345-016-1773-y
3. Linehan WM, Ricketts CJ. The cancer genome atlas of renal cell carcinoma: Findings and clinical implications. Nat Rev Urol (2019) 16(9):539–52. doi: 10.1038/s41585-019-0211-5
4. Lebacle C, Pooli A, Bessede T, Irani J, Pantuck AJ, Drakaki A. Epidemiology, biology and treatment of sarcomatoid RCC: current state of the art. World J Urol (2019) 37(1):115–23. doi: 10.1007/s00345-018-2355-y
5. Mouallem NE, Smith SC, Paul AK. Sarcomatoid renal cell carcinoma: Biology and treatment advances. Urol Oncol (2018) 36(6):265–71. doi: 10.1016/j.urolonc.2017.12.012
6. Iacovelli R, Ciccarese C, Bria E, Bracarda S, Porta C, Procopio G, et al. Patients with sarcomatoid renal cell carcinoma - re-defining the first-line of treatment: A meta-analysis of randomised clinical trials with immune checkpoint inhibitors. Eur J Cancer (2020) 136:195–203. doi: 10.1016/j.ejca.2020.06.008
7. Gnarra JR, Tory K, Weng Y, Schmidt L, Wei MH, Li H, et al. Mutations of the VHL tumour suppressor gene in renal carcinoma. Nat Genet (1994) 7(1):85–90. doi: 10.1038/ng0594-85
8. Linehan WM, Lerman MI, Zbar B. Identification of the von hippel-lindau (VHL) gene. Its role Renal cancer JAMA (1995) 273(7):564–70. doi: 10.1001/jama.1995.03520310062031
9. Latif F, Tory K, Gnarra J, Yao M, Duh FM, Orcutt ML, et al. Identification of the von hippel-lindau disease tumor suppressor gene. Science (1993) 260(5112):1317–20. doi: 10.1126/science.8493574
10. Choueiri TK, Kaelin WG Jr. Targeting the HIF2-VEGF axis in renal cell carcinoma. Nat Med (2020) 26(10):1519–30. doi: 10.1038/s41591-020-1093-z
11. Wolf MM, Kimryn Rathmell W, Beckermann KE. Modeling clear cell renal cell carcinoma and therapeutic implications. Oncogene (2020) 39(17):3413–26. doi: 10.1038/s41388-020-1234-3
12. Hsieh JJ, Purdue MP, Signoretti S, Swanton C, Albiges L, Schmidinger M, et al. Renal cell carcinoma. Nat Rev Dis Primers (2017) 3:17009. doi: 10.1038/nrdp.2017.9
13. Motzer RJ, Nosov D, Eisen T, Bondarenko I, Lesovoy V, Lipatov O, et al. Tivozanib versus sorafenib as initial targeted therapy for patients with metastatic renal cell carcinoma: Results from a phase III trial. J Clin Oncol (2013) 31(30):3791–9. doi: 10.1200/jco.2012.47.4940
14. Clark JI, Wong MKK, Kaufman HL, Daniels GA, Morse MA, McDermott DF, et al. Impact of sequencing targeted therapies with high-dose interleukin-2 immunotherapy: An analysis of outcome and survival of patients with metastatic renal cell carcinoma from an on-going observational IL-2 clinical trial: PROCLAIM(SM). Clin Genitourin Cancer (2017) 15(1):31–41.e4. doi: 10.1016/j.clgc.2016.10.008
15. Choueiri TK, Figueroa DJ, Fay AP, Signoretti S, Liu Y, Gagnon R, et al. Correlation of PD-L1 tumor expression and treatment outcomes in patients with renal cell carcinoma receiving sunitinib or pazopanib: Results from COMPARZ, a randomized controlled trial. Clin Cancer Res (2015) 21(5):1071–7. doi: 10.1158/1078-0432.Ccr-14-1993
16. Motzer RJ, Escudier B, McDermott DF, George S, Hammers HJ, Srinivas S, et al. Nivolumab versus everolimus in advanced renal-cell carcinoma. N Engl J Med (2015) 373(19):1803–13. doi: 10.1056/NEJMoa1510665
17. Motzer RJ, Tannir NM, McDermott DF, Arén Frontera O, Melichar B, Choueiri TK, et al. Nivolumab plus ipilimumab versus sunitinib in advanced renal-cell carcinoma. N Engl J Med (2018) 378(14):1277–90. doi: 10.1056/NEJMoa1712126
18. Rooney MS, Shukla SA, Wu CJ, Getz G, Hacohen N. Molecular and genetic properties of tumors associated with local immune cytolytic activity. Cell (2015) 160(1-2):48–61. doi: 10.1016/j.cell.2014.12.033
19. Motzer RJ, Banchereau R, Hamidi H, Powles T, McDermott D, Atkins MB, et al. Molecular subsets in renal cancer determine outcome to checkpoint and angiogenesis blockade. Cancer Cell (2020) 38(6):803–17.e4. doi: 10.1016/j.ccell.2020.10.011
20. McDermott DF, Huseni MA, Atkins MB, Motzer RJ, Rini BI, Escudier B, et al. Clinical activity and molecular correlates of response to atezolizumab alone or in combination with bevacizumab versus sunitinib in renal cell carcinoma. Nat Med (2018) 24(6):749–57. doi: 10.1038/s41591-018-0053-3
21. Chen DS, Mellman I. Oncology meets immunology: The cancer-immunity cycle. Immunity (2013) 39(1):1–10. doi: 10.1016/j.immuni.2013.07.012
22. Rini BI, Powles T, Atkins MB, Escudier B, McDermott DF, Suarez C, et al. Atezolizumab plus bevacizumab versus sunitinib in patients with previously untreated metastatic renal cell carcinoma (IMmotion151): A multicentre, open-label, phase 3, randomised controlled trial. Lancet (2019) 393(10189):2404–15. doi: 10.1016/s0140-6736(19)30723-8
23. Motzer RJ, Robbins PB, Powles T, Albiges L, Haanen JB, Larkin J, et al. Avelumab plus axitinib versus sunitinib in advanced renal cell carcinoma: Biomarker analysis of the phase 3 JAVELIN renal 101 trial. Nat Med (2020) 26(11):1733–41. doi: 10.1038/s41591-020-1044-8
24. Choueiri TK, Fishman MN, Escudier B, McDermott DF, Drake CG, Kluger H, et al. Immunomodulatory activity of nivolumab in metastatic renal cell carcinoma. Clin Cancer Res (2016) 22(22):5461–71. doi: 10.1158/1078-0432.Ccr-15-2839
25. Mariathasan S, Turley SJ, Nickles D, Castiglioni A, Yuen K, Wang Y, et al. TGFβ attenuates tumour response to PD-L1 blockade by contributing to exclusion of T cells. Nature (2018) 554(7693):544–8. doi: 10.1038/nature25501
26. Hugo W, Zaretsky JM, Sun L, Song C, Moreno BH, Hu-Lieskovan S, et al. Genomic and transcriptomic features of response to anti-PD-1 therapy in metastatic melanoma. Cell (2016) 165(1):35–44. doi: 10.1016/j.cell.2016.02.065
27. Hänzelmann S, Castelo R, Guinney J. GSVA: Gene set variation analysis for microarray and RNA-seq data. BMC Bioinf (2013) 14:7. doi: 10.1186/1471-2105-14-7
28. Langfelder P, Horvath S. WGCNA: An r package for weighted correlation network analysis. BMC Bioinf (2008) 9:559. doi: 10.1186/1471-2105-9-559
29. Zhang Z, Chen P, Xie H, Cao P. Overexpression of GINS4 is associated with tumor progression and poor survival in hepatocellular carcinoma. Front Oncol (2021) 11:654185. doi: 10.3389/fonc.2021.654185
30. The Gene Ontology Consortium. Expansion of the Gene Ontology knowledgebase and resources. Nucleic Acids Res (2017) 45(D1):D331–8. doi: 10.1093/nar/gkw1108
31. Ogata H, Goto S, Sato K, Fujibuchi W, Bono H, Kanehisa M. KEGG: Kyoto encyclopedia of genes and genomes. Nucleic Acids Res (1999) 27(1):29–34. doi: 10.1093/nar/27.1.29
32. Rizvi AA, Karaesmen E, Morgan M, Preus L, Wang J, Sovic M, et al. Gwasurvivr: An r package for genome-wide survival analysis. Bioinformatics (2019) 35(11):1968–70. doi: 10.1093/bioinformatics/bty920
33. Heagerty PJ, Zheng Y. Model predictive accuracy and ROC curves. Biometrics (2005) 61(1):92–105. doi: 10.1111/j.0006-341X.2005.030814.x
34. Rosenberg JE, Hoffman-Censits J, Powles T, van der Heijden MS, Balar AV, Necchi A, et al. Atezolizumab in patients with locally advanced and metastatic urothelial carcinoma who have progressed following treatment with platinum-based chemotherapy: A single-arm, multicentre, phase 2 trial. Lancet (2016) 387(10031):1909–20. doi: 10.1016/s0140-6736(16)00561-4
35. Şenbabaoğlu Y, Gejman RS, Winer AG, Liu M, Van Allen EM, de Velasco G, et al. Tumor immune microenvironment characterization in clear cell renal cell carcinoma identifies prognostic and immunotherapeutically relevant messenger RNA signatures. Genome Biol (2016) 17(1):231. doi: 10.1186/s13059-016-1092-z
36. Damrauer JS, Hoadley KA, Chism DD, Fan C, Tiganelli CJ, Wobker SE, et al. Intrinsic subtypes of high-grade bladder cancer reflect the hallmarks of breast cancer biology. Proc Natl Acad Sci U.S.A. (2014) 111(8):3110–5. doi: 10.1073/pnas.1318376111
37. Hedegaard J, Lamy P, Nordentoft I, Algaba F, Høyer S, Ulhøi BP, et al. Comprehensive transcriptional analysis of early-stage urothelial carcinoma. Cancer Cell (2016) 30(1):27–42. doi: 10.1016/j.ccell.2016.05.004
38. Yang W, Soares J, Greninger P, Edelman EJ, Lightfoot H, Forbes S, et al. Genomics of drug sensitivity in cancer (GDSC): A resource for therapeutic biomarker discovery in cancer cells. Nucleic Acids Res (2013) 41(Database issue):D955–61. doi: 10.1093/nar/gks1111
39. Liu D, Zhou LQ, Cheng Q, Wang J, Kong WJ, Zhang SL. Developing a pyroptosis-related gene signature to better predict the prognosis and immune status of patients with head and neck squamous cell carcinoma. Front Genet (2022) 13:988606. doi: 10.3389/fgene.2022.988606
40. Schmidt AM, Moore KJ. The semaphorin 3E/PlexinD1 axis regulates macrophage inflammation in obesity. Cell Metab (2013) 18(4):461–2. doi: 10.1016/j.cmet.2013.09.011
41. Pikarsky E, Porat RM, Stein I, Abramovitch R, Amit S, Kasem S, et al. NF-kappaB functions as a tumour promoter in inflammation-associated cancer. Nature (2004) 431(7007):461–6. doi: 10.1038/nature02924
42. Toledano S, Nir-Zvi I, Engelman R, Kessler O, Neufeld G. Class-3 semaphorins and their receptors: Potent multifunctional modulators of tumor progression. Int J Mol Sci (2019) 20(3):556. doi: 10.3390/ijms20030556
43. Jiang Z, Liang G, Xiao Y, Qin T, Chen X, Wu E, et al. Targeting the SLIT/ROBO pathway in tumor progression: Molecular mechanisms and therapeutic perspectives. Ther Adv Med Oncol (2019) 11:1758835919855238. doi: 10.1177/1758835919855238
44. Geraldo LH, Xu Y, Jacob L, Pibouin-Fragner L, Rao R, Maissa N, et al. SLIT2/ROBO signaling in tumor-associated microglia and macrophages drives glioblastoma immunosuppression and vascular dysmorphia. J Clin Invest (2021) 131(16):e141083. doi: 10.1172/jci141083
45. He S, Tan W, Wang S, Wu C, Wang P, Wang B, et al. Genome-wide study reveals an important role of spontaneous autoimmunity, cardiomyocyte differentiation defect and anti-angiogenic activities in gender-specific gene expression in keshan disease. Chin Med J (Engl) (2014) 127(1):72–8.
46. Eixarch H, Calvo-Barreiro L, Costa C, Reverter-Vives G, Castillo M, Gil V, et al. Inhibition of the BMP signaling pathway ameliorated established clinical symptoms of experimental autoimmune encephalomyelitis. Neurotherapeutics (2020) 17(4):1988–2003. doi: 10.1007/s13311-020-00885-8
47. Park H, Lad S, Boland K, Johnson K, Readio N, Jin G, et al. Bone marrow-derived epithelial cells and hair follicle stem cells contribute to development of chronic cutaneous neoplasms. Nat Commun (2018) 9(1):5293. doi: 10.1038/s41467-018-07688-8
48. Wu X, Lv D, Cai C, Zhao Z, Wang M, Chen W, et al. A TP53-associated immune prognostic signature for the prediction of overall survival and therapeutic responses in muscle-invasive bladder cancer. Front Immunol (2020) 11:590618. doi: 10.3389/fimmu.2020.590618
49. Jabs WJ, Busse M, Krüger S, Jocham D, Steinhoff J, Doehn C. Expression of c-reactive protein by renal cell carcinomas and unaffected surrounding renal tissue. Kidney Int (2005) 68(5):2103–10. doi: 10.1111/j.1523-1755.2005.00666.x
50. Sim SH, Messenger MP, Gregory WM, Wind TC, Vasudev NS, Cartledge J, et al. Prognostic utility of pre-operative circulating osteopontin, carbonic anhydrase IX and CRP in renal cell carcinoma. Br J Cancer (2012) 107(7):1131–7. doi: 10.1038/bjc.2012.360
51. Abuhelwa AY, Bellmunt J, Kichenadasse G, McKinnon RA, Rowland A, Sorich MJ, et al. C-reactive protein provides superior prognostic accuracy than the IMDC risk model in renal cell carcinoma treated with Atezolizumab/Bevacizumab. Front Oncol (2022) 12:918993. doi: 10.3389/fonc.2022.918993
52. Hu H, Yao X, Xie X, Wu X, Zheng C, Xia W, et al. Prognostic value of preoperative NLR, dNLR, PLR and CRP in surgical renal cell carcinoma patients. World J Urol (2017) 35(2):261–70. doi: 10.1007/s00345-016-1864-9
53. Elbadawy M, Usui T, Mori T, Tsunedomi R, Hazama S, Nabeta R, et al. Establishment of a novel experimental model for muscle-invasive bladder cancer using a dog bladder cancer organoid culture. Cancer Sci (2019) 110(9):2806–21. doi: 10.1111/cas.14118
54. Ye H, Li T, Wang H, Wu J, Yi C, Shi J, et al. TSPAN1, TMPRSS4, SDR16C5, and CTSE as novel panel for pancreatic cancer: A bioinformatics analysis and experiments validation. Front Immunol (2021) 12:649551. doi: 10.3389/fimmu.2021.649551
55. Xue F, Yang L, Dai B, Xue H, Zhang L, Ge R, et al. Bioinformatics profiling identifies seven immune-related risk signatures for hepatocellular carcinoma. PeerJ (2020) 8:e8301. doi: 10.7717/peerj.8301
56. Yang T, Kasagi S, Takahashi A, Mizusawa K. Effects of background color and feeding status on the expression of genes associated with body color regulation in the goldfish carassius auratus. Gen Comp Endocrinol (2021) 312:113860. doi: 10.1016/j.ygcen.2021.113860
57. Wang Y, Yang J, Zhang Q, Xia J, Wang Z. Extent and characteristics of immune infiltration in clear cell renal cell carcinoma and the prognostic value. Transl Androl Urol (2019) 8(6):609–18. doi: 10.21037/tau.2019.10.19
58. van Deventer HW, Serody JS, McKinnon KP, Clements C, Brickey WJ, Ting JP. Transfection of macrophage inflammatory protein 1 alpha into B16 F10 melanoma cells inhibits growth of pulmonary metastases but not subcutaneous tumors. J Immunol (2002) 169(3):1634–9. doi: 10.4049/jimmunol.169.3.1634
59. Kouno J, Nagai H, Nagahata T, Onda M, Yamaguchi H, Adachi K, et al. Up-regulation of CC chemokine, CCL3L1, and receptors, CCR3, CCR5 in human glioblastoma that promotes cell growth. J Neurooncol (2004) 70(3):301–7. doi: 10.1007/s11060-004-9165-3
60. Wang SS, Gu YF, Wolff N, Stefanius K, Christie A, Dey A, et al. Bap1 is essential for kidney function and cooperates with vhl in renal tumorigenesis. Proc Natl Acad Sci U.S.A. (2014) 111(46):16538–43. doi: 10.1073/pnas.1414789111
61. Liu W, Yan B, Yu H, Ren J, Peng M, Zhu L, et al. OTUD1 stabilizes PTEN to inhibit the PI3K/AKT and TNF-alpha/NF-kappaB signaling pathways and sensitize ccRCC to TKIs. Int J Biol Sci (2022) 18(4):1401–14. doi: 10.7150/ijbs.68980
62. Cuadros T, Trilla E, Sarró E, Vilà MR, Vilardell J, de Torres I, et al. HAVCR/KIM-1 activates the IL-6/STAT-3 pathway in clear cell renal cell carcinoma and determines tumor progression and patient outcome. Cancer Res (2014) 74(5):1416–28. doi: 10.1158/0008-5472.Can-13-1671
63. Wu H, He D, Biswas S, Shafiquzzaman M, Zhou X, Charron J, et al. mTOR activation initiates renal cell carcinoma development by coordinating ERK and p38MAPK. Cancer Res (2021) 81(12):3174–86. doi: 10.1158/0008-5472.Can-20-3979
64. Díaz-Montero CM, Rini BI, Finke JH. The immunology of renal cell carcinoma. Nat Rev Nephrol (2020) 16(12):721–35. doi: 10.1038/s41581-020-0316-3
65. Sourbier C, Lindner V, Lang H, Agouni A, Schordan E, Danilin S, et al. The phosphoinositide 3-kinase/Akt pathway: A new target in human renal cell carcinoma therapy. Cancer Res (2006) 66(10):5130–42. doi: 10.1158/0008-5472.Can-05-1469
66. Motzer RJ, Rini BI, McDermott DF, Arén Frontera O, Hammers HJ, Carducci MA, et al. Nivolumab plus ipilimumab versus sunitinib in first-line treatment for advanced renal cell carcinoma: Extended follow-up of efficacy and safety results from a randomised, controlled, phase 3 trial. Lancet Oncol (2019) 20(10):1370–85. doi: 10.1016/s1470-2045(19)30413-9
67. Cheungpasitporn W, Thongprayoon C, O'Corragain OA, Edmonds PJ, Ungprasert P, Kittanamongkolchai W, et al. The risk of kidney cancer in patients with kidney stones: A systematic review and meta-analysis. Qjm (2015) 108(3):205–12. doi: 10.1093/qjmed/hcu195
68. van de Pol JAA, van den Brandt PA, Schouten LJ. Kidney stones and the risk of renal cell carcinoma and upper tract urothelial carcinoma: the Netherlands cohort study. Br J Cancer (2019) 120(3):368–74. doi: 10.1038/s41416-018-0356-7
69. Chung SD, Liu SP. Lin HC. a population-based study on the association between urinary calculi and kidney cancer. Can Urol Assoc J (2013) 7(11-12):E716–21. doi: 10.5489/cuaj.366
70. Peerapen P, Boonmark W, Putpeerawit P, Thongboonkerd V. Calcium oxalate crystals trigger epithelial-mesenchymal transition and carcinogenic features in renal cells: a crossroad between kidney stone disease and renal cancer. Exp Hematol Oncol (2022) 11(1):62. doi: 10.1186/s40164-022-00320-y
71. Vinaiphat A, Aluksanasuwan S, Manissorn J, Sutthimethakorn S, Thongboonkerd V. Response of renal tubular cells to differential types and doses of calcium oxalate crystals: Integrative proteome network analysis and functional investigations. Proteomics (2017) 17(15-16). doi: 10.1002/pmic.201700192
72. Kittikowit W, Waiwijit U, Boonla C, Ruangvejvorachai P, Pimratana C, Predanon C, et al. Increased oxidative DNA damage seen in renal biopsies adjacent stones in patients with nephrolithiasis. Urolithiasis (2014) 42(5):387–94. doi: 10.1007/s00240-014-0676-x
73. Guo E, Wu C, Ming J, Zhang W, Zhang L, Hu G. The clinical significance of DNA damage repair signatures in clear cell renal cell carcinoma. Front Genet (2020) 11:593039. doi: 10.3389/fgene.2020.593039
74. Srinivas US, Tan BWQ, Vellayappan BA, Jeyasekharan AD. ROS and the DNA damage response in cancer. Redox Biol (2019) 25:101084. doi: 10.1016/j.redox.2018.101084
75. Raskov H, Orhan A, Christensen JP, Gögenur I. Cytotoxic CD8(+) T cells in cancer and cancer immunotherapy. Br J Cancer (2021) 124(2):359–67. doi: 10.1038/s41416-020-01048-4
76. Maggs L, Sadagopan A, Moghaddam AS, Ferrone S. HLA class I antigen processing machinery defects in antitumor immunity and immunotherapy. Trends Cancer (2021) 7(12):1089–101. doi: 10.1016/j.trecan.2021.07.006
77. Atkins MB, Rini BI, Motzer RJ, Powles T, McDermott DF, Suarez C, et al. Patient-reported outcomes from the phase III randomized IMmotion151 trial: Atezolizumab + bevacizumab versus sunitinib in treatment-naïve metastatic renal cell carcinoma. Clin Cancer Res (2020) 26(11):2506–14. doi: 10.1158/1078-0432.Ccr-19-2838
78. Motzer RJ, Powles T, Atkins MB, Escudier B, McDermott DF, Alekseev BY, et al. Final overall survival and molecular analysis in IMmotion151, a phase 3 trial comparing atezolizumab plus bevacizumab vs sunitinib in patients with previously untreated metastatic renal cell carcinoma. JAMA Oncol (2022) 8(2):275–80. doi: 10.1001/jamaoncol.2021.5981
Keywords: renal cell carcinoma, IMmotion151, checkpoint blockade, antiangiogenesis, responsiveness, prognosis
Citation: Chen P, Bi F, Tan W, Jian L and Yu X (2023) A novel immune-related model to predict prognosis and responsiveness to checkpoint and angiogenesis blockade therapy in advanced renal cancer. Front. Oncol. 13:1127448. doi: 10.3389/fonc.2023.1127448
Received: 19 December 2022; Accepted: 28 February 2023;
Published: 14 March 2023.
Edited by:
Aristotle Bamias, National and Kapodistrian University of Athens, GreeceReviewed by:
Muhammad Khan, Guangzhou Medical University Cancer Hospital, ChinaXi Chen, The Second Affiliated Hospital of Kunming Medical University, China
Copyright © 2023 Chen, Bi, Tan, Jian and Yu. This is an open-access article distributed under the terms of the Creative Commons Attribution License (CC BY). The use, distribution or reproduction in other forums is permitted, provided the original author(s) and the copyright owner(s) are credited and that the original publication in this journal is cited, in accordance with accepted academic practice. No use, distribution or reproduction is permitted which does not comply with these terms.
*Correspondence: Xiaoping Yu, eXV4aWFvcGluZ0BobmNhLm9yZy5jbg==