 Xinjiang Ding
 Tao Yao2
 Yuanxing Liu
- 1Division of Hepatobiliary and Pancreatic Surgery, Department of Surgery, First Affiliated Hospital, School of Medicine, Zhejiang University, Hangzhou, China
- 2College of Life Science, Zhejiang Chinese Medicine University, Hangzhou, China
- 3School of Medicine, Zhejiang University, Hangzhou, China
Background: Available treatments for hepatocellular carcinoma (HCC), a common human malignancy with a low survival rate, remain unsatisfactory. Macropinocytosis (MPC), a type of endocytosis that involves the non-specific uptake of dissolved molecules, has been shown to contribute to HCC pathology; however, its biological mechanism remains unknown.
Methods: The current study identified 27 macropinocytosis-related genes (MRGs) from 71 candidate genes using bioinformatics. The R software was used to create a prognostic signature model by filtering standardized mRNA expression data from HCC patients and using various methods to verify the reliability of the model and indicate immune activity.
Results: The prognostic signature was constructed using seven MPC-related differentially expressed genes, GSK3B, AXIN1, RAC1, KEAP1, EHD1, GRB2, and SNX5, through LASSO Cox regression. The risk score was acquired from the expression of these genes and their corresponding coefficients. HCC patients in the discovery and validation cohorts were stratified, and the survival of low-risk score patients was improved in both cohorts. Time-dependent ROC analysis indicated that the model’s prediction reliability was the highest in the short term. Subsequent immunologic analysis, including KEGG, located the immune action pathway of the differentially expressed genes in the direction of the cancer pathway, etc. Immune infiltration and immune checkpoint tests provided valuable guidance for future follow-up experiments.
Conclusion: A risk model with MRGs was constructed to effectively predict HCC patient prognoses and suggest changes in the immune microenvironment during the disease process. The findings should benefit the development of a prognostic stratification and treatment strategy for HCC.
Introduction
Primary liver cancer is a common malignancy associated with high mortality, with hepatocellular carcinoma (HCC) accounting for 85% to 90% of cases. HCC is the fourth most frequent cause of tumor grade and the second leading cause of all cancer-related deaths worldwide (1). The traditional treatments for HCC include surgery, radiofrequency ablation, chemotherapy, and liver transplantation, but their efficacy is limited. In recent years, significant progress in the development of targeted molecular therapies and immunotherapeutic agents has improved HCC patient survival (2). However, these treatment options are often impacted by tumor heterogeneity and may lead to the occurrence of drug resistance (3, 4). Thus, there is a need for strategies that effectively predict treatment prognosis. This would aid in the development of more targeted treatments and inform the need for adjuvant therapies to prevent tumor recurrence and metastasis (5).
Recent advances in gene sequencing technology have exposed the genetic makeup of multiple diseases, including HCC, by identifying diverse genes and pathways involved in different pathological processes, signal transduction pathways, and nutrient absorption processes. Macropinocytosis (MPC) is an actin-driven endocytic process that is biologically distinct from other types of endocytosis, such as clathrin-mediated (6). The dysregulation of MPC is involved in immune responses, tumor progression, and cell death during various diseases, including HCC (7). Tumor growth relies on nutrients such as glucose and glutamine (Gln). When they become limited in the tumor microenvironment, tumor cells use MPC to scavenge extracellular nutrients to support their growth (8). Reusing proteins extracted from the extracellular microenvironment establishes tumor cell superiority by bypassing de novo synthesis, which is most common when tumors are facing nutritional deficiencies (9). Tumor cells also use MPC to obtain necrotic cell residue and tissue debris. Recent studies have shown that reusing carbohydrates, lipids, and nucleotides from cell debris is an important method of acquiring nutrients (10, 11). As a result, it is important to identify MPC-related genes (MRGs) and analyze their functions during HCC. MPC and its molecular signaling pathways are shown to play a critical role in the development of cancer (12). Cancer cells expressing MRGs under nutrient deficiency stress can use MPC to induce tumor growth. Meanwhile, dysregulation of MPC and specified drug interventions can induce methuosis, a unique form of non-apoptotic cell death (13). However, the biological mechanism of MPC during HCC remains unclear. Thus, understanding the impact of MRGs on HCC patient survival is of considerable interest (14).
The current study compared MRG expression in normal and HCC tissue samples from public databases and used differentially expressed MRGs to construct a prediction signature model. In addition, immunity function enrichment and immune-related pathways were explored to discern the association between MPC and the tumor microenvironment and inform novel immunotherapeutic strategies for HCC (14).
Materials and methods
Public data collection
Genetic information and matched clinical parameters, including patient age, identification number, tumor clinical stage, and survival data from 40 normal and 374 HCC samples, were obtained from The Cancer Genome Atlas (TCGA) database (https://portal.gdc.cancer.gov/repository). Identity information and clinicopathological characteristics from 273 HCC samples were obtained as a validation cohort from the International Cancer Genome Consortium (ICGC) portal (https://dcc.icgc.org/releases/current/Projects/LIRI-JP). Furthermore, we got the identity information and clinicopathological characteristics of HCC samples from the International Cancer Genome Consortium (ICGC) portal (https://dcc.icgc.org/releases/current/Projects/LIRI-JP) as the main validation cohort and obtained gene expression data and corresponding clinicopathological features from the Gene Expression Omnibus (GEO) database (https://www.ncbi.nlm.nih.gov/geo/, ID: GSE14520) database for the secondary validation cohort. Before the subsequent analysis, we use the “sva” package of R to minimize the gene expression data batch effect between different databases and different batches.
We searched and obtained some relevant literature related to macropinocytosis from PubMed and manually extracted these 71 candidate MRGs. We attach the article catalog and 71 candidate MRGs in Supplementary Document 1.
Identification of differentially expressed MRGs
The “limma” package of the Bioconductor in R software was used to compare the expression of MRGs from the TCGA between tumor and normal samples and to identify differentially expressed macropinocytosis-related genes (DEMRGs) (Supplementary List 1). DEMRGs with a p-value of <0.05 were considered significant.
Construction and validation of a signature DEMRG prognostic model
The Least absolute shrinkage and selection operator (LASSO) Cox regression analysis with the “glmnet” package in R was used to screen for DEMRG expression and establish a prognostic model. Shrinkage of the regression coefficient (β) removed genes with a zero regression coefficient and reserved genes with a non-zero weight (15). The risk score of each HCC sample was determined using standardized HCC mRNA expression data (EXP) with a linear combination of the regression coefficients from the LASSO model. The risk score was the summation of the multiplied βs using DEMRG signal data [RS = ∑ EXP (mRNA) * coefficients], allowing an MPC-related prognostic model (MRPM) to be constructed. The HCC samples were divided into a low-risk score (LRS) and high-risk score (HRS) clusters using the med-cutoff RS with the “pheatmap” package in R. To determine whether samples in the two groups were well separated, principal component analysis (PCA) was conducted using the “ggplot2” package.
Independent risk factors and overall survival (OS) of the two groups were determined to evaluate the DEMRG forecasting value using univariate and multivariate Cox regression models and the log-rank test, respectively. A time-dependent receiver operating characteristic (ROC) curve was performed on each independent cohort to assess the ability of the MRPM to predict OS using the “time-ROC,” “survminer,” and “survival” packages (14). The ICGC and GEO cohorts were also used to verify the model in the same way to make it more convincing.
HCC tissue specimens
Tissue samples, including 12 from HCC patients, were obtained from the First Affiliated Hospital of Zhejiang University School of Medicine after surgery, then quickly frozen and stored in −80°C freezers. All patients provided informed consent for their tissues to be used for research, and related procedures were conducted in accordance with the 2013 revised Declaration of Helsinki.
Fluorescence quantitative real-time PCR
The RNA from the filtered HCC sample was extracted with TRIzol® reagent (15596018, Life Technologies) according to the manufacturer’s protocol. A spectrometer was used to detect the RNA concentration, the MultiScribeTM Reverse Transcriptase (4311235, Invitrogen) was used to carry out reverse transcription, and cDNA was used for the SYBR Green Master Mix (4367659, Applied BiosystemsTM) qRT-PCR. The 2−ΔΔCt method was used to determine the relative abundance of RNA by comparing the levels with a housekeeping gene such as GADPH. Related primer sequences are provided in Supplementary Document 2.
Other statistics
A protein–protein interaction (PPI) network was created using the Search Tool for the Retrieval of Interacting Genes (STRING) Protein–Protein Interaction Networks Functional Enrichment Analysis (https://cn.string-db.org/), and a protein correlation network was plotted using the “igraph” and “reshape2” R packages to show interactions between the DEMRGs. Analysis of DEMRG immune function enrichment was evaluated using Gene Ontology (GO) with the “clusterProfiler” in R, and important biochemical relationships between the DEMGs were assessed using the Kyoto Encyclopedia of Genes and Genomes (KEGG). Single-sample gene set enrichment analysis (ssGSEA) was performed to determine the scores of infiltrating immunocytes and the activity of immunological pathways between the LRS and HRS groups using the “gsva” package (14). Kaplan–Meier survival curves and a log-rank test were performed to measure the predictive performance of the prognostic MRG signature (16).
All statistical analyses were performed using the R Project for Statistical Computing (version 4.1.2) and GraphPad Prism 9. Statistical significance was considered for data with a p-value <0.05, a false discovery rate (FDR) <0.05, and a |log2FoldChange| >1.
Results
DEMRG identification
The expression levels of 71 MRGs were compared between normal and tumor samples from the TCGA. Using the established criteria, 27 DEMRGs were obtained, of which 25 (CDC42, KRAS, ARF6, GSK3B, AXIN1, WNT3A, LRP6, PAK1, EXOC4, EHD2, RAC1, TP53, KEAP1, EHD1, EHD4, NEK3, SRC, GRB2, GAB1, CTBP1, RAB34, SNX1, SNX5, CD46, and VAV2) were upregulated and two (NFE2L2 and EHD3) were downregulated. The DEMRG expression levels are listed in Figure 1A. PPI networks were developed to determine the functional connectivity and interactions of the expressed proteins. The interaction score was set to 0.4 to obtain medium confidence (Figure 1B). ARF6, RAC1, VAV2, PAK1, SRC, GRB2, KRAS, and CDC42 were defined as pivotal genes. All DEMRGs and their interaction network are shown in Figure 1C.
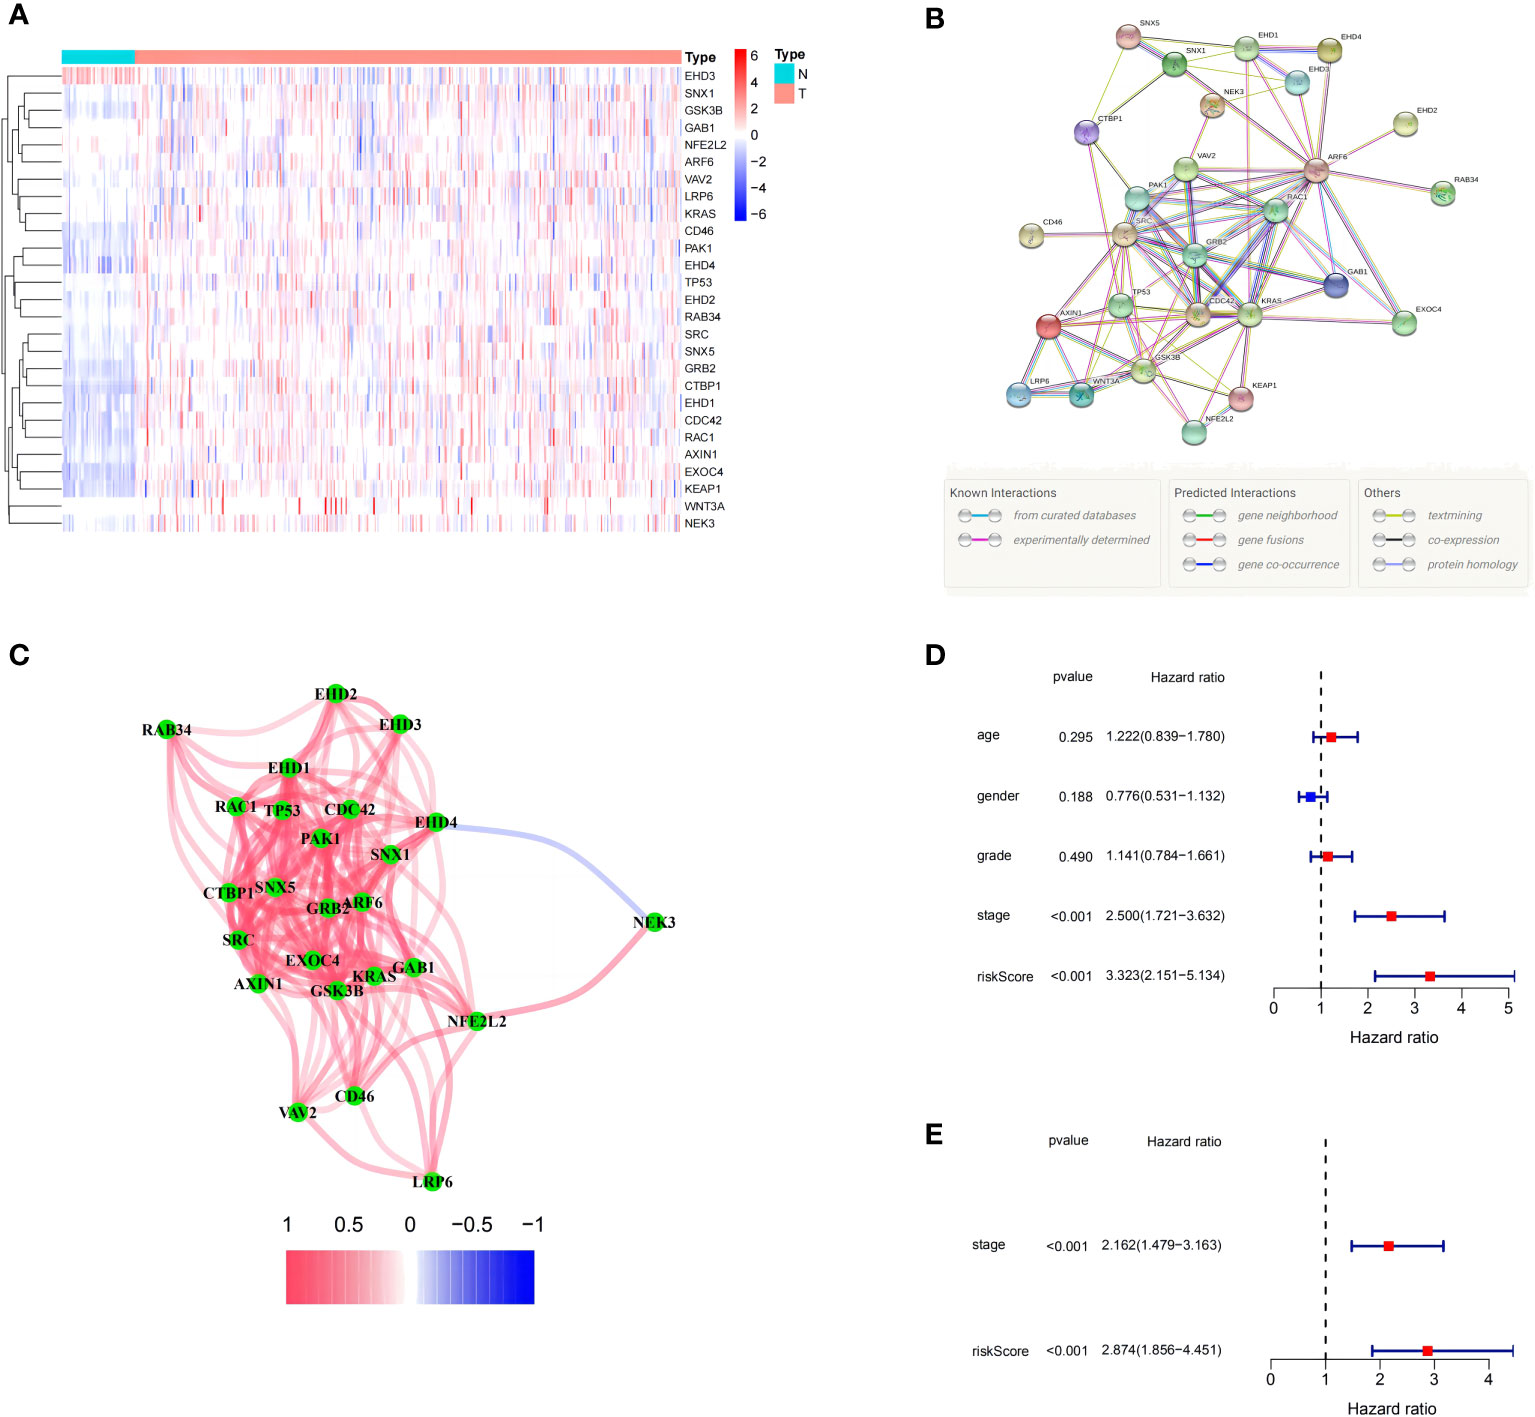
Figure 1 Expression of the 27 differentially expressed macropinocytosis-related genes (DEMRGs) and their interactions. (A) Heatmap (blue: low expression level; red: high expression level) of the DEMRGs between the non-tumor (N, blue) and tumor (T, red) samples. (B) The PPI network showing the interactions of the DEMRGs (interaction score = 0.4). (C) The correlation network of the DEMRGs (red line: positive correlation; blue line: negative correlation. The depth of the colors reflects the strength of the association). (D, E) Univariate and multivariate Cox regression analyses for the risk score. (D) Univariate analysis for the TCGA cohort. (E) Multivariate analysis for the TCGA cohort.
Construction and validation of the signature DEMRG prognostic model
The HCC samples with intact survival information were obtained from the TCGA to assess the relationship between the DEMRGs and patient prognosis. There were 12 standard conforming genes, namely, CDC42, PSD4, GSK3B, AXIN1, PAK1, RAC1, KEAP1, EHD1, SRC, GRB2, SNX5, and AKT1, among which 11 genes, CDC42, GSK3B, AXIN1, PAK1, RAC1, KEAP1, EHD1, SRC, GRB2, SNX5, and AKT1, had a hazard ratio (HR) >1. Meanwhile, PSD4 was associated with an HR <1.
LASSO Cox regression was then used to generate a seven-gene signature model based on cross-validation with GSK3B, AXIN1, RAC1, KEAP1, EHD1, GRB2, and SNX5. The following formula was used to calculate the risk score: RS = 0.0606 * EXP (GSK3B) + 0.0326 * EXP (AXIN1) + 0.2757 * EXP (RAC1) + 0.2323 * EXP (KEAP1) + 0.0852 * EXP (EHD1) + 0.2713 * EXP (GRB2) + 0.3377 * EXP (SNX5). Using the med-cutoff score, the HCC samples were separated into the LRS and HRS groups (Figure 2A). According to PCA, the samples were well differentiated into the two clusters and distributed in discrete directions (Figure 2B). LRS patients had a longer survival time than those in the HRS group (p < 0.001) (Figure 2C). A volcano plot identified the significant DEMRGs in the two RS groups (Figure 2D). To determine the ability of the model to predict OS, Kaplan–Meier curves were developed to compare different survival years between the two groups. LRS HCC patients were found to have longer OS than HRS patients (p < 0.001) (Figure 2E). The RS-constructed predictive signature model was assessed using time-dependent ROC analysis, and the areas under the ROC curve (AUCs) were 0.736, 0.670, and 0.648 at 1, 2, and 3 years, respectively (Figure 2F). Considering that the AUC of 2 and 3 years is not high enough, this suggests that the survival prediction ability of the model for the TCGA cohort at these time points is not as good as that of 1 year, so we have analyzed the ROC curve of approximately 1 year (9 and 15 months). As we expected, the AUC of the three-time points in Supplementary Figure 1 is at a good level. Perhaps, in the TCGA cohort, the model has the best prediction level at approximately 1 year, and this shows that the short-term prediction value of the model for the TCGA is more worthy of our attention.
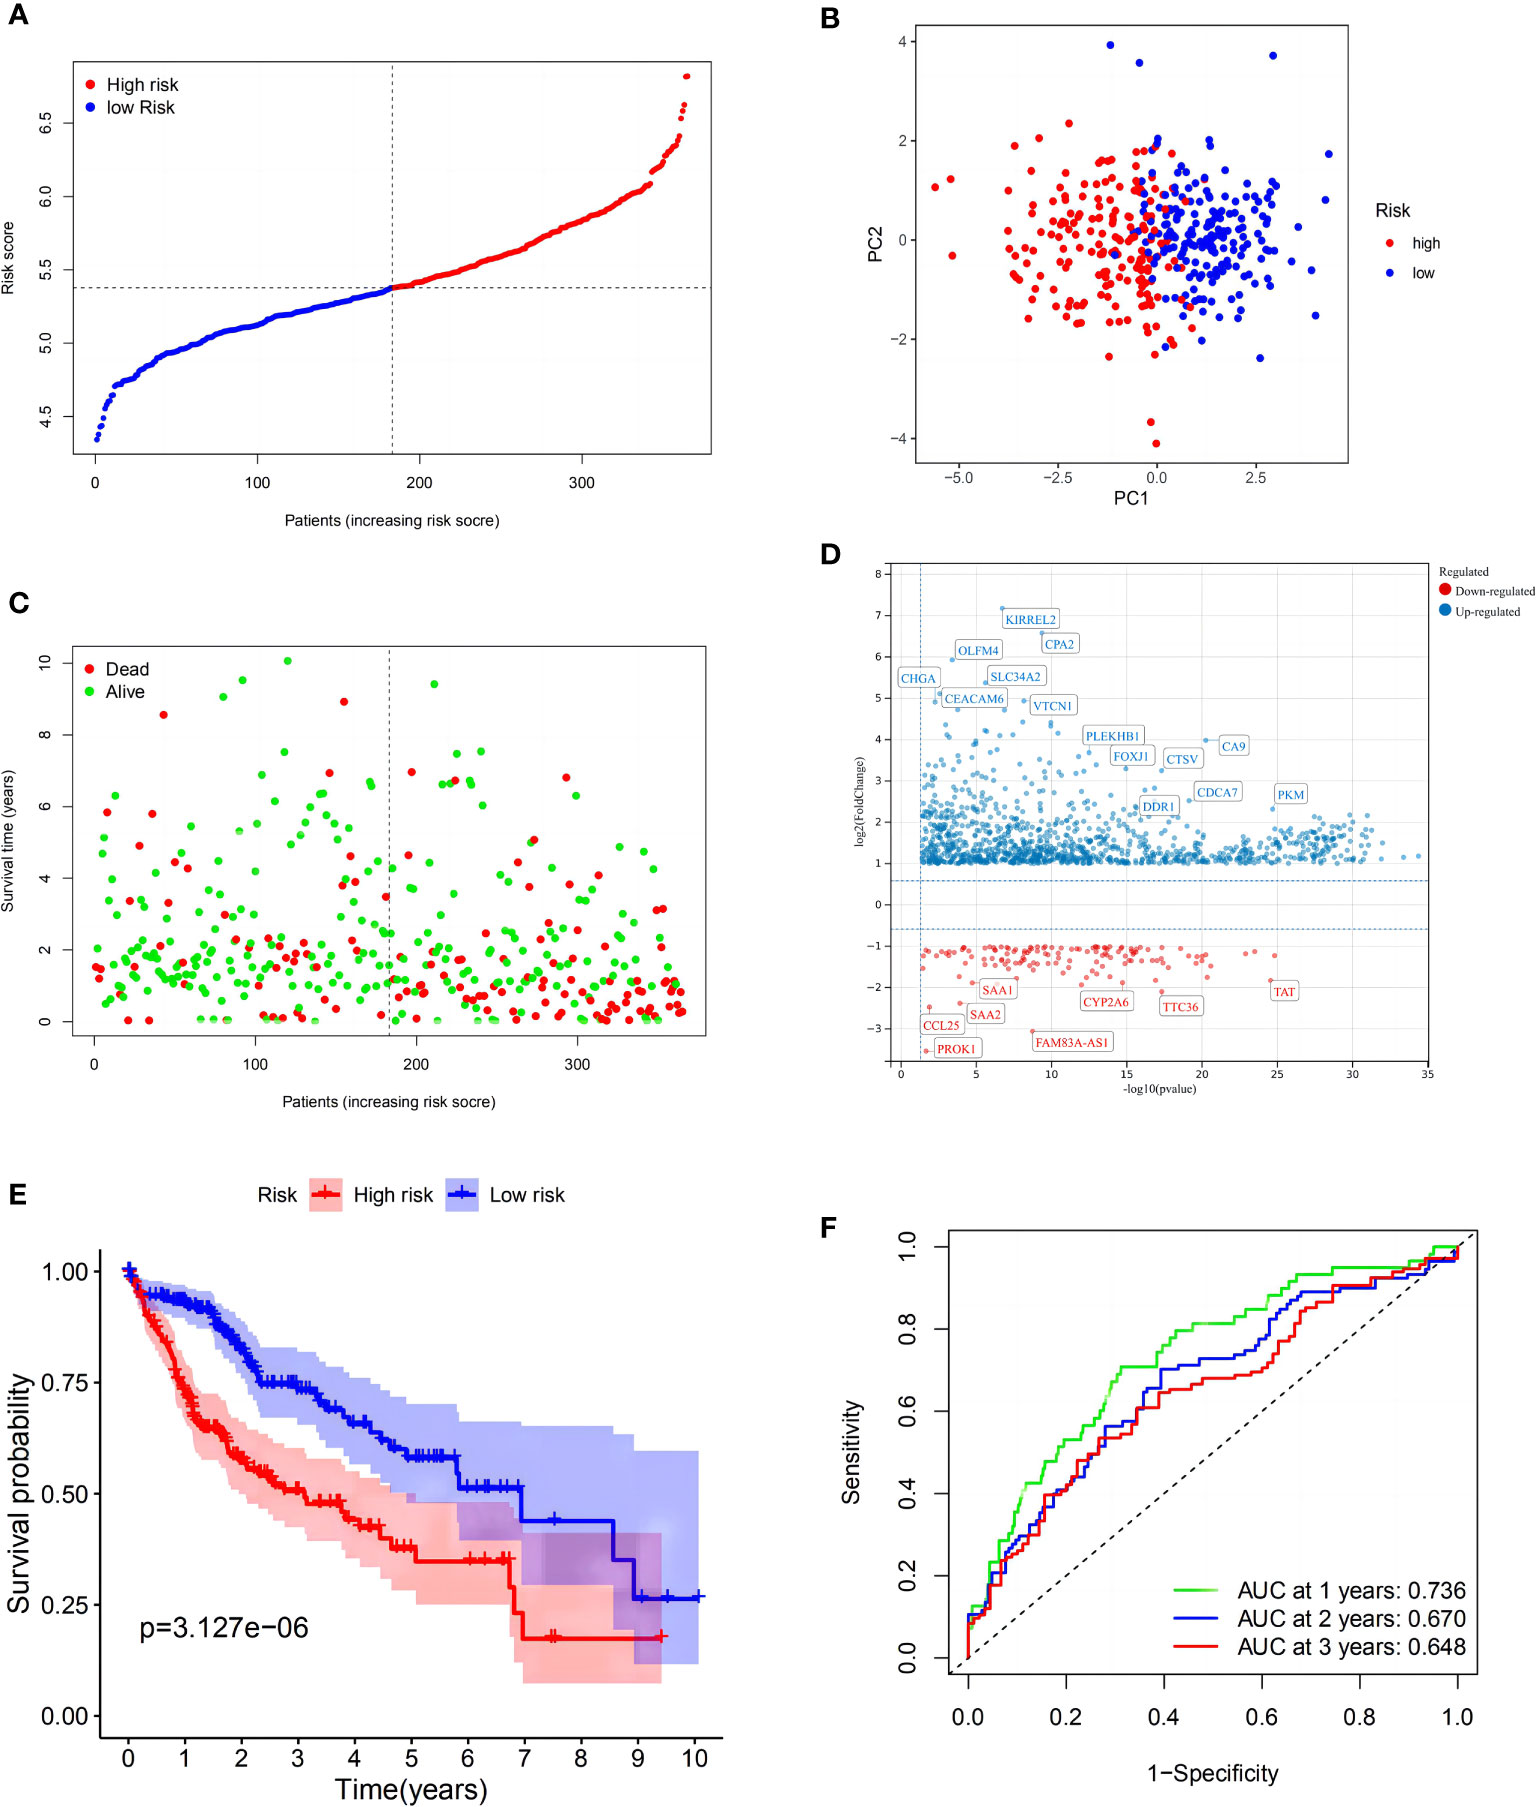
Figure 2 Construction of the risk signature in The Cancer Genome Atlas (TCGA) cohort. (A) Distribution of patients based on the risk score. (B) PCA plot for hepatocellular carcinomas (HCCs) based on the risk score. (C) The survival status for each patient (low-risk population: on the left side of the dotted line; high-risk population: on the right side of the dotted line). (D) Volcano plot showing the significant DEGs with FDR <0.05 and |log2FC| >1 between two macropinocytosis score groups. (E) Kaplan–Meier curves for OS of patients in the high- and low-risk groups (blue: low-risk group; red: high-risk group). (F) ROC curves showing the predictive efficiency of the risk score.
To verify these results, 273 HCC samples from the ICGC were also separated into two groups (Figure 3A). The PCA revealed identical results (Figure 3B). As described above, HCC samples in the LRS group had longer survival (p < 0.01) than those in the HRS group (Figures 3C, D). These findings indicated that the model also showed strong forecasting competence in the ICGC. The ICGC AUCs at 1-, 2-, and 3-year OS were 0.715, 0.710, and 0.715, respectively (Figure 3E). Interestingly, the model indicated that the validation cohort had a better survival rate and discrimination ability than the TCGA cohort. In the GEO validation cohort, we applied the same statistical method to validate our model, and the resulting figures are shown in Supplementary Figure 2, which have also achieved good results, providing support for the reliability of the model.
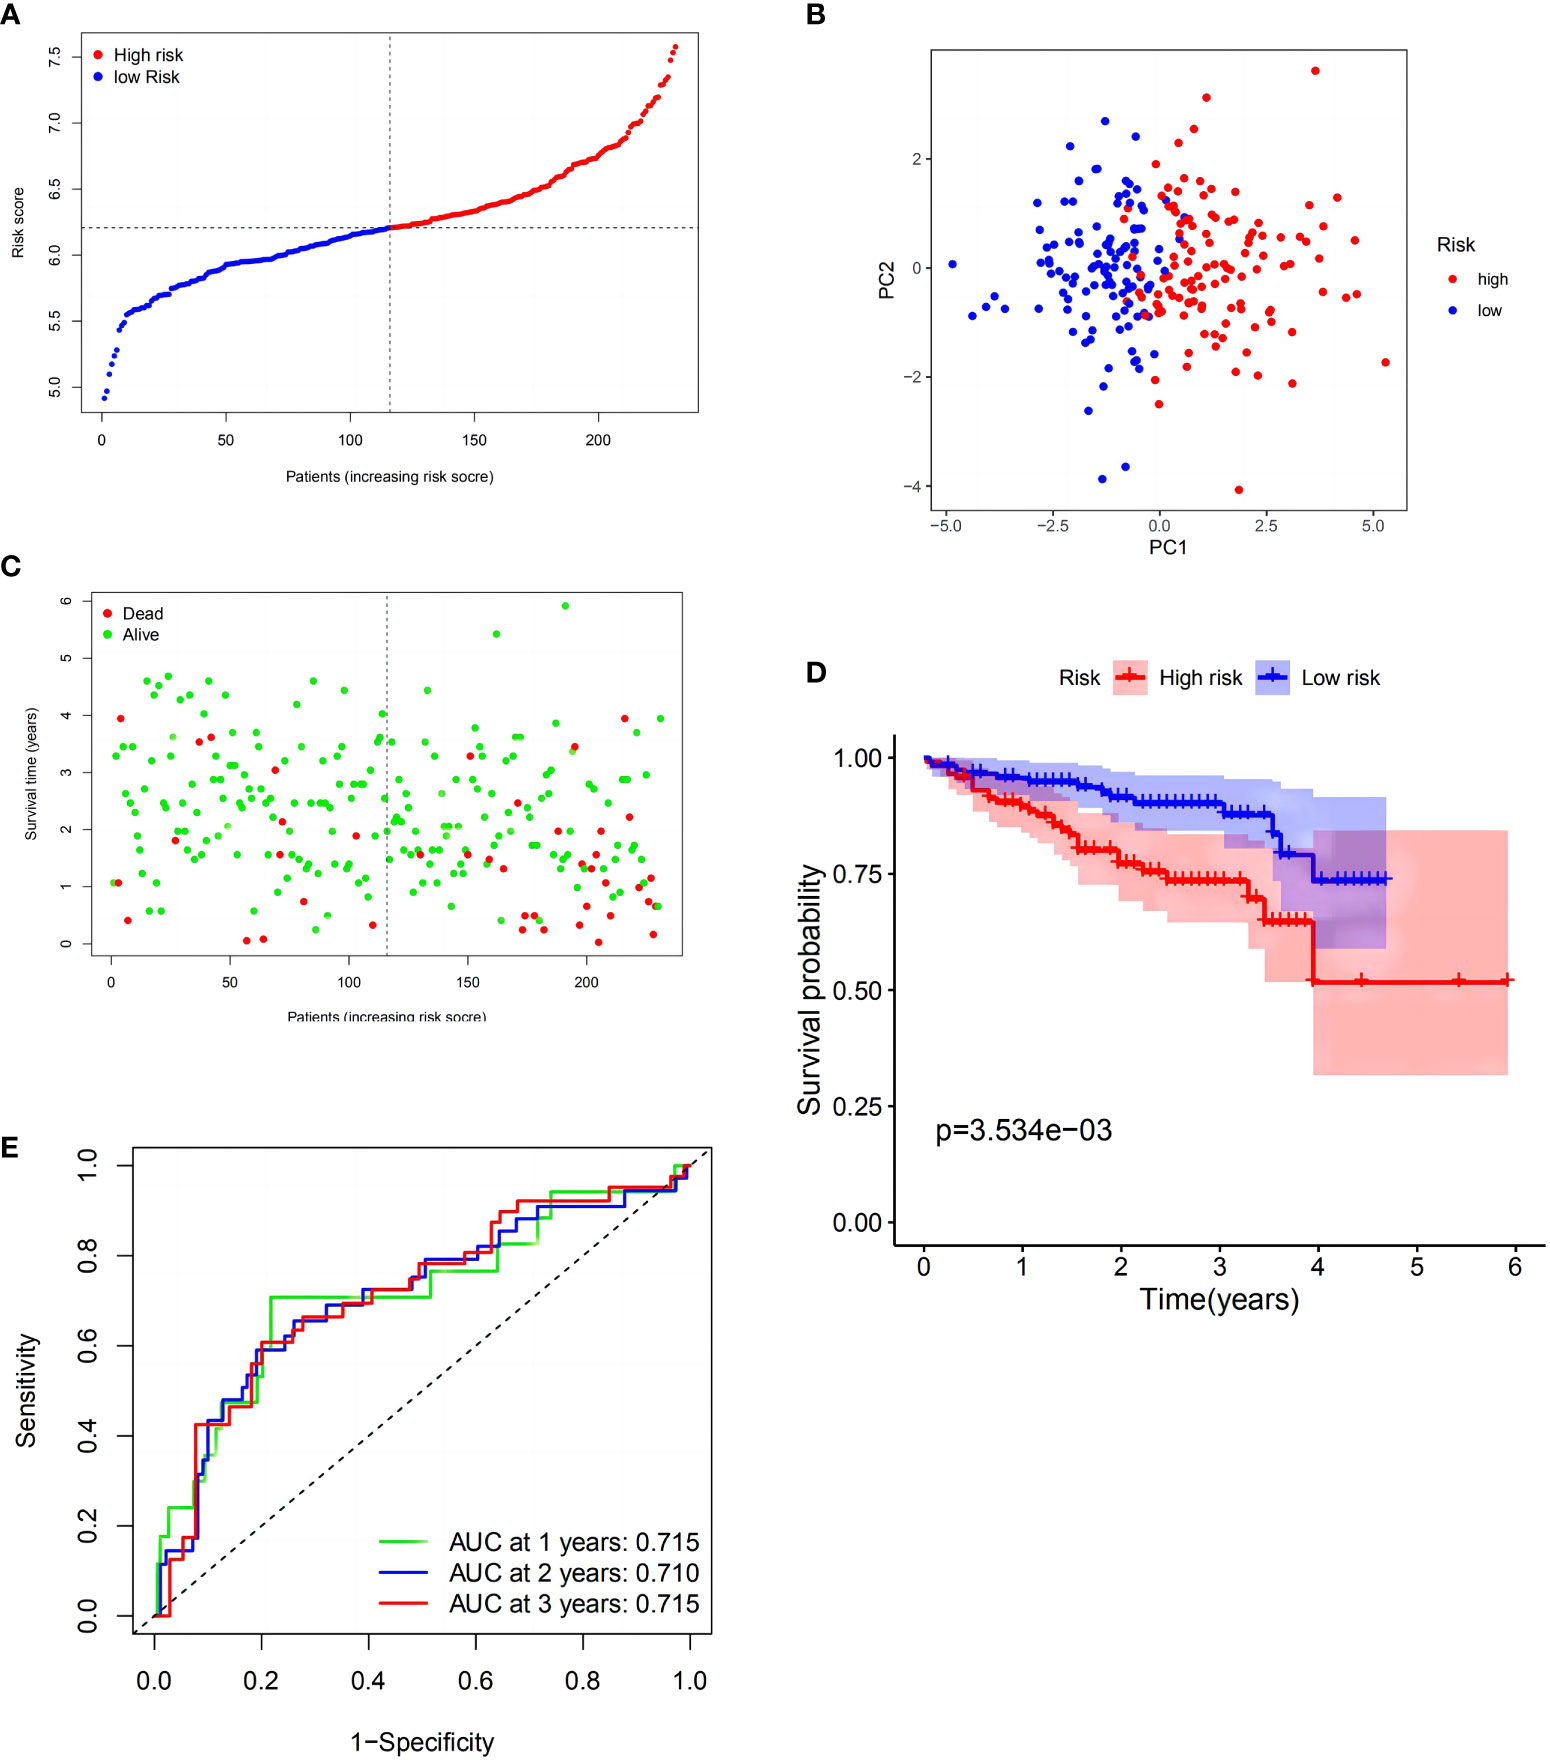
Figure 3 Validation of the risk model in the International Cancer Genome Consortium (ICGC) cohort. (A) Distribution of patients in the ICGC cohort based on the median risk score in the TCGA cohort. (B) PCA plot for HCCs. (C) Survival status for each patient (low-risk population: on the left side of the dotted line; high-risk population: on the right side of the dotted line). (D) Kaplan–Meier curves comparingOS between the low- and high-risk groups. (E) Time-dependent ROC curves for HCCs.
The independent prognostic role of the MRPM
After constructing the MRPM for the HRS and LRS groups, we created a clinical information table of the patients from the TCGA, including THEIR age, gender, tumor grade, and TNM staging (the missing information was deleted). Analysis of clinical data revealed that a higher risk score was strongly correlated with both the TNM staging and tumor histologic grade (Supplementary Table 1). Meanwhile, univariate and multivariate Cox regression analyses of data from the TCGA showed that the tumor TNM staging (p < 0.001) and RS (p < 0.001) were prominent IPFs for HCC patients (Figures 1D, E).
Model-based enrichment analysis
KEGG indicated that the differentially expressed DEMRGs were chiefly mapped to “pathways in cancer,” “cell cycle,” and “human T-cell leukemia virus-1 infection” (Figures 4A, B), while GO functional analyses found that the DEMRGs were enriched in “mitotic cell cycle,” “leukocyte-mediated immunity,” and “cell division” (Figures 4C, D). These findings indicated that differences in the OS of patients in each risk group may be related to differences in the immune response or cell cycle.
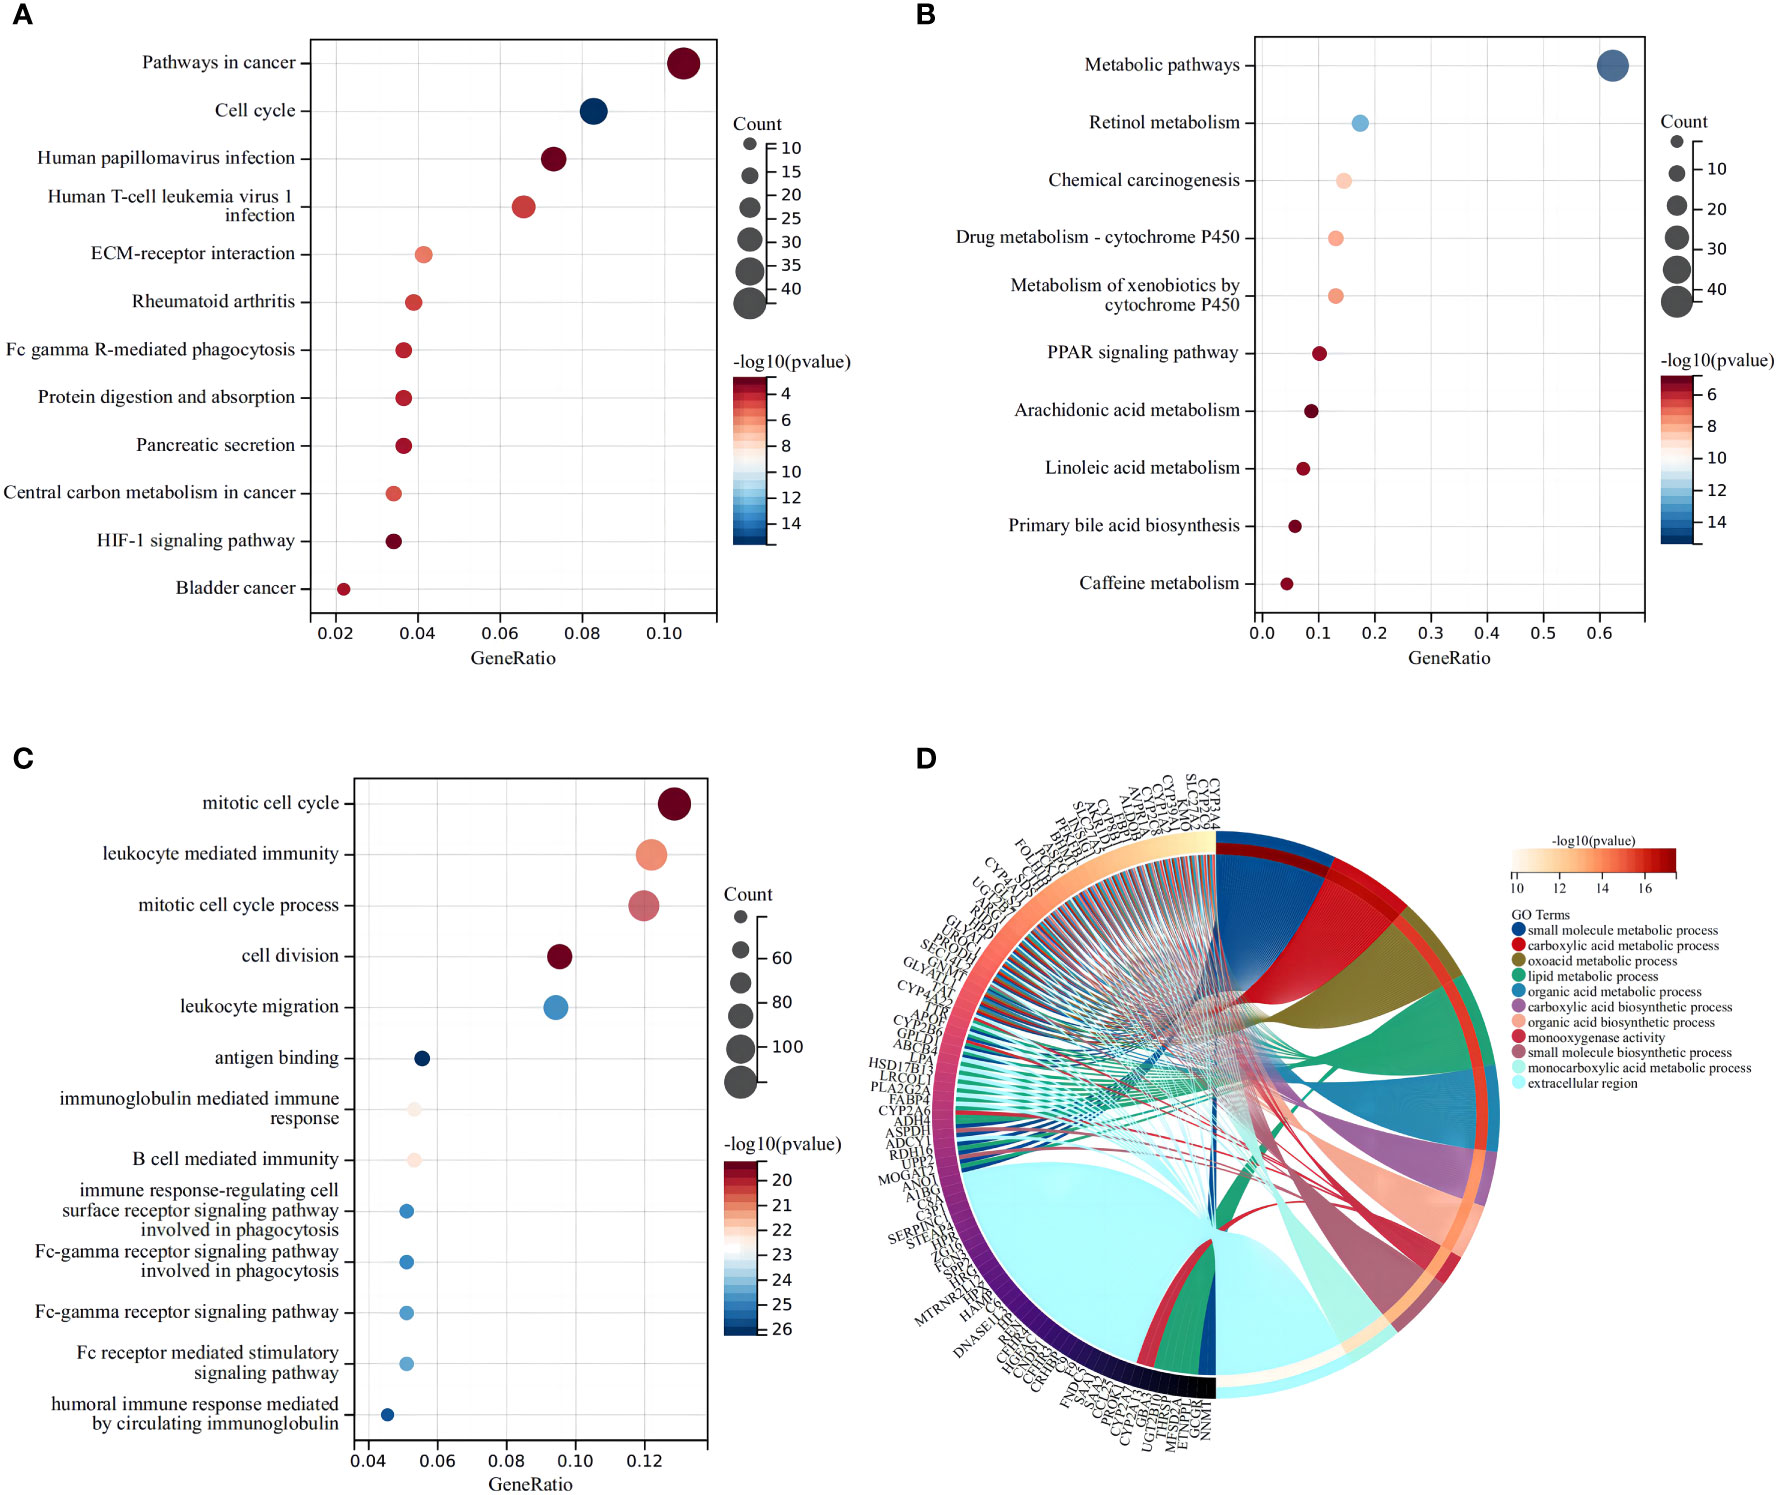
Figure 4 Functional analysis based on the differentially expressed genes between the two risk groups in the TCGA cohort. The larger bubble and the longer bar mean that more genes were enriched, and the increasing depth of red means that the differences were more obvious. (A) Bubble graph for the high expression of KEGG pathways in the TCGA cohort. (B) Bubble graph for the low expression of KEGG pathways in the TCGA cohort. (C) Bubble graph for the high expression of GO enrichment in the TCGA cohort. (D) Circular plot for the low expression of GO enrichment in the TCGA cohort.
Immune status of HCC patients in each subgroup
A more in-depth functional analysis of the type of infiltrating immunocytes and the activity of the immunological pathways in the two databases was conducted using ssGSEA. In the TCGA (Figure 5A), the LRS patients had lower levels of immunocyte enrichment, macrophages, and Tfh cells than the HRS patients. While the type II interferon response was stronger in the LRS group, other pathways, including MHC class I, checkpoint, and antigen-presenting cell (APC) co-stimulation, were more active in the HRS group (Figure 5B). Meanwhile, in the ICGC cohort, macrophage, Th2 cell, and dendritic cell (DC) infiltration were lower in the LRS group. Except for the type II interferon response, other immunological pathways, such as MHC class I, human leukocyte antigen (HLA), checkpoint, and APC co-stimulation, were also lower in the LRS group than in the HRS group (Figures 5C, D). These results were consistent with the TCGA cohort, further supporting the reliability of the results and suggesting that the poorer survival of HRS HCC patients may result, in part, from an immunosuppressive microenvironment.
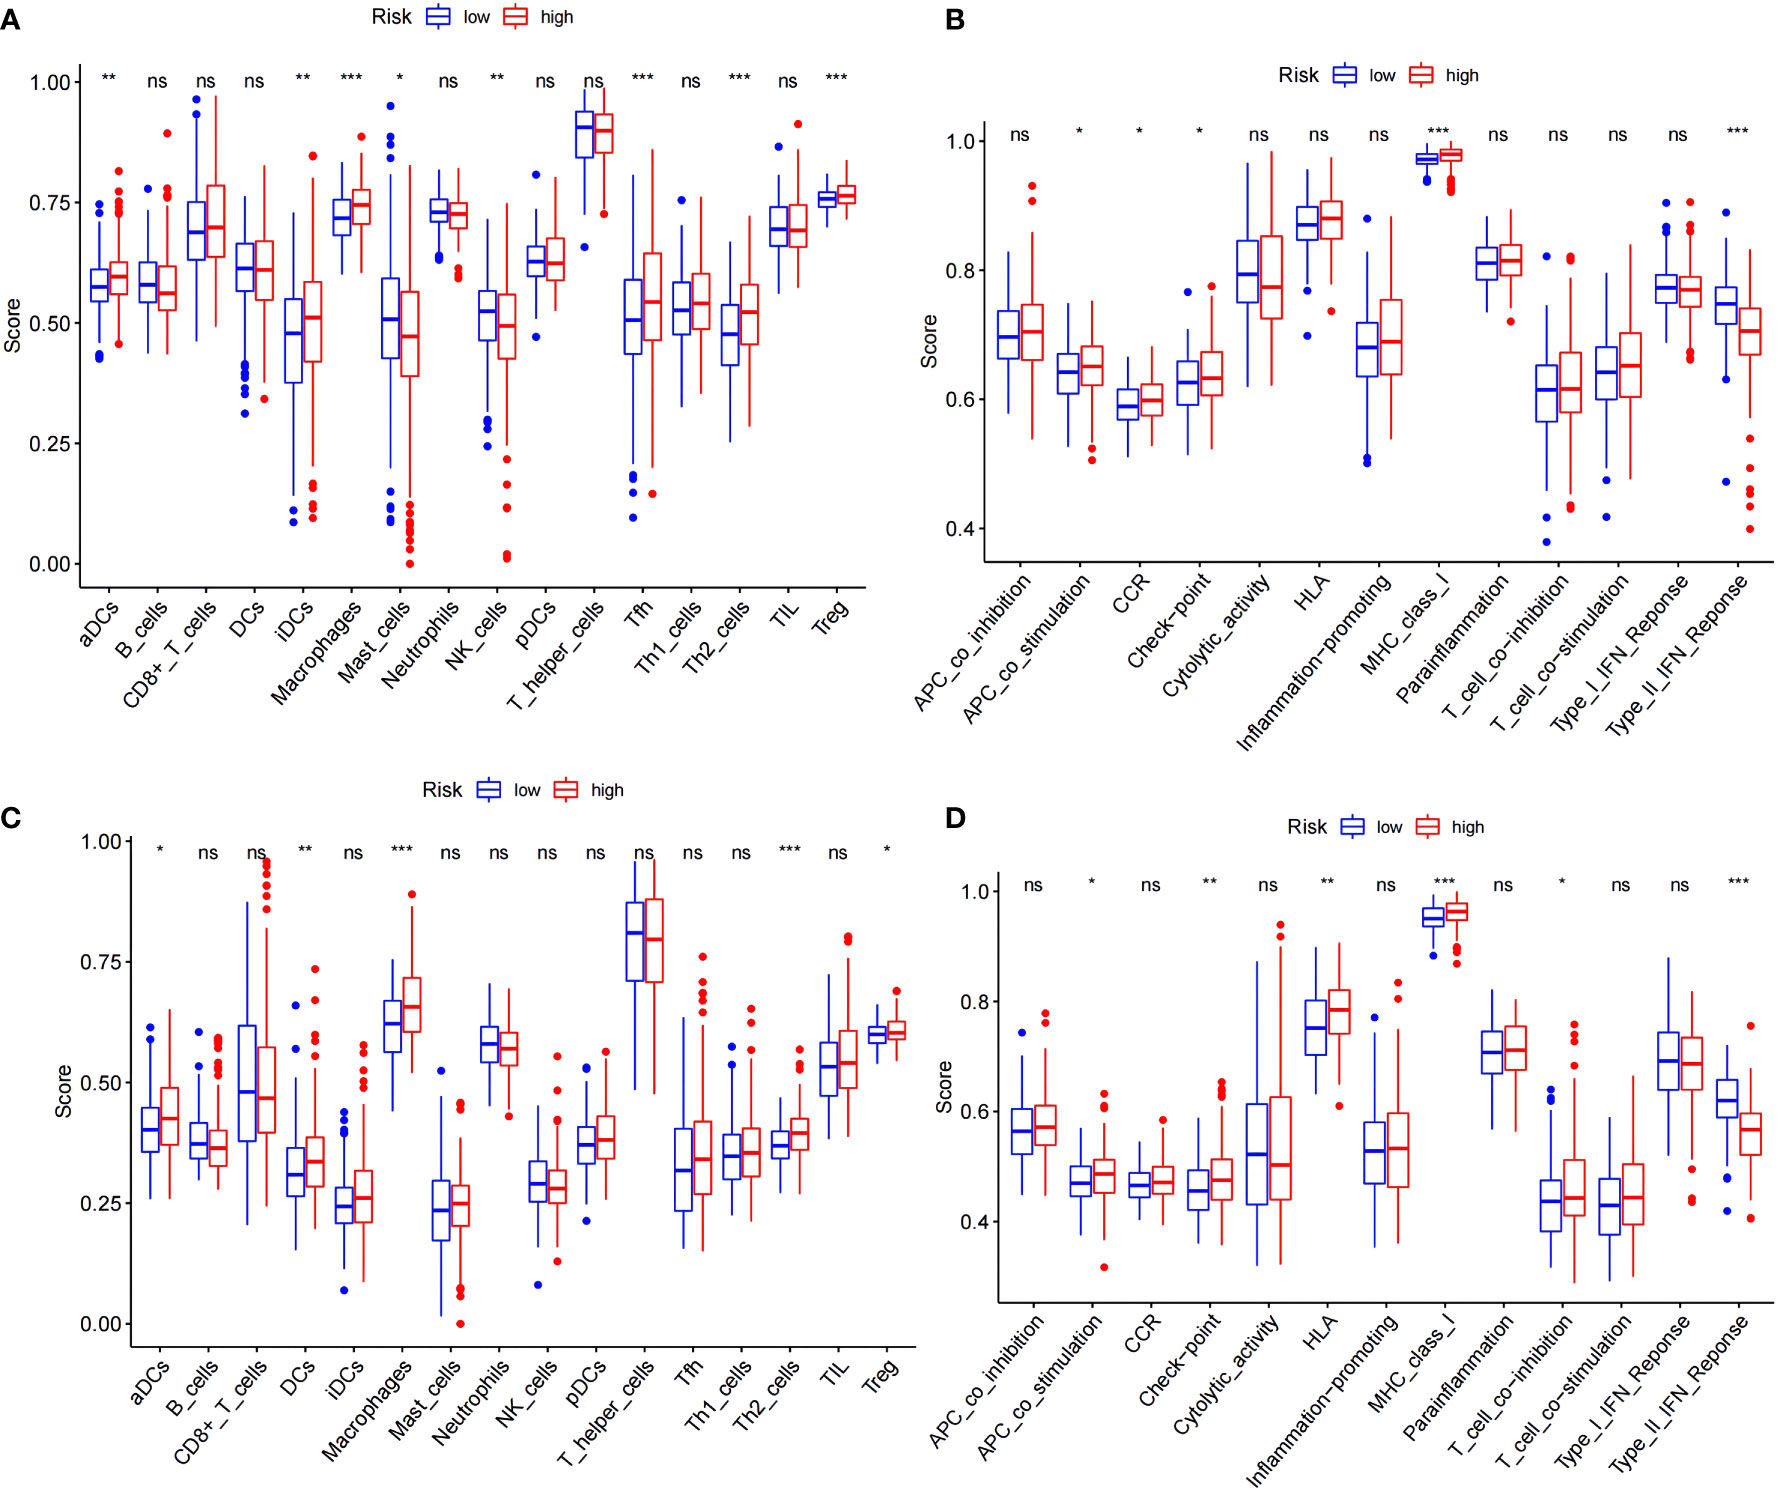
Figure 5 Comparison of the ssGSEA scores for immune cells and immune pathways. (A, B) Comparison of the enrichment scores of 16 types of immune cells and 13 immune-related pathways between the low- (blue box) and high-risk (red box) groups in the TCGA cohort. (C, D) Comparison of tumor immunity between the low- (blue box) and high-risk (red box) groups in the ICGC cohort. *p < 0.05; **p < 0.01; ***p < 0.001. ns: No significant difference.
Immune checkpoint gene expression was also compared between the HRS and LRS groups since the expression levels of immune checkpoints are important indicators of the success of immunotherapy for multiple cancers (Figure 6; Supplementary List 2). The expression of cytotoxic T lymphocyte-associated protein 4 (CTLA-4), lymphocyte activation gene-3 (LAG-3), the V-domain Ig suppressor of T-cell activation (VISTA), and the T-cell immunoreceptor with Ig and ITIM domains (TIGIT) were slightly lower in the LRS samples than in the HRS samples (p < 0.05), suggesting that the reduced survival of the HRS group may be associated with an immunosuppressive microenvironment and supporting the verification results described above.
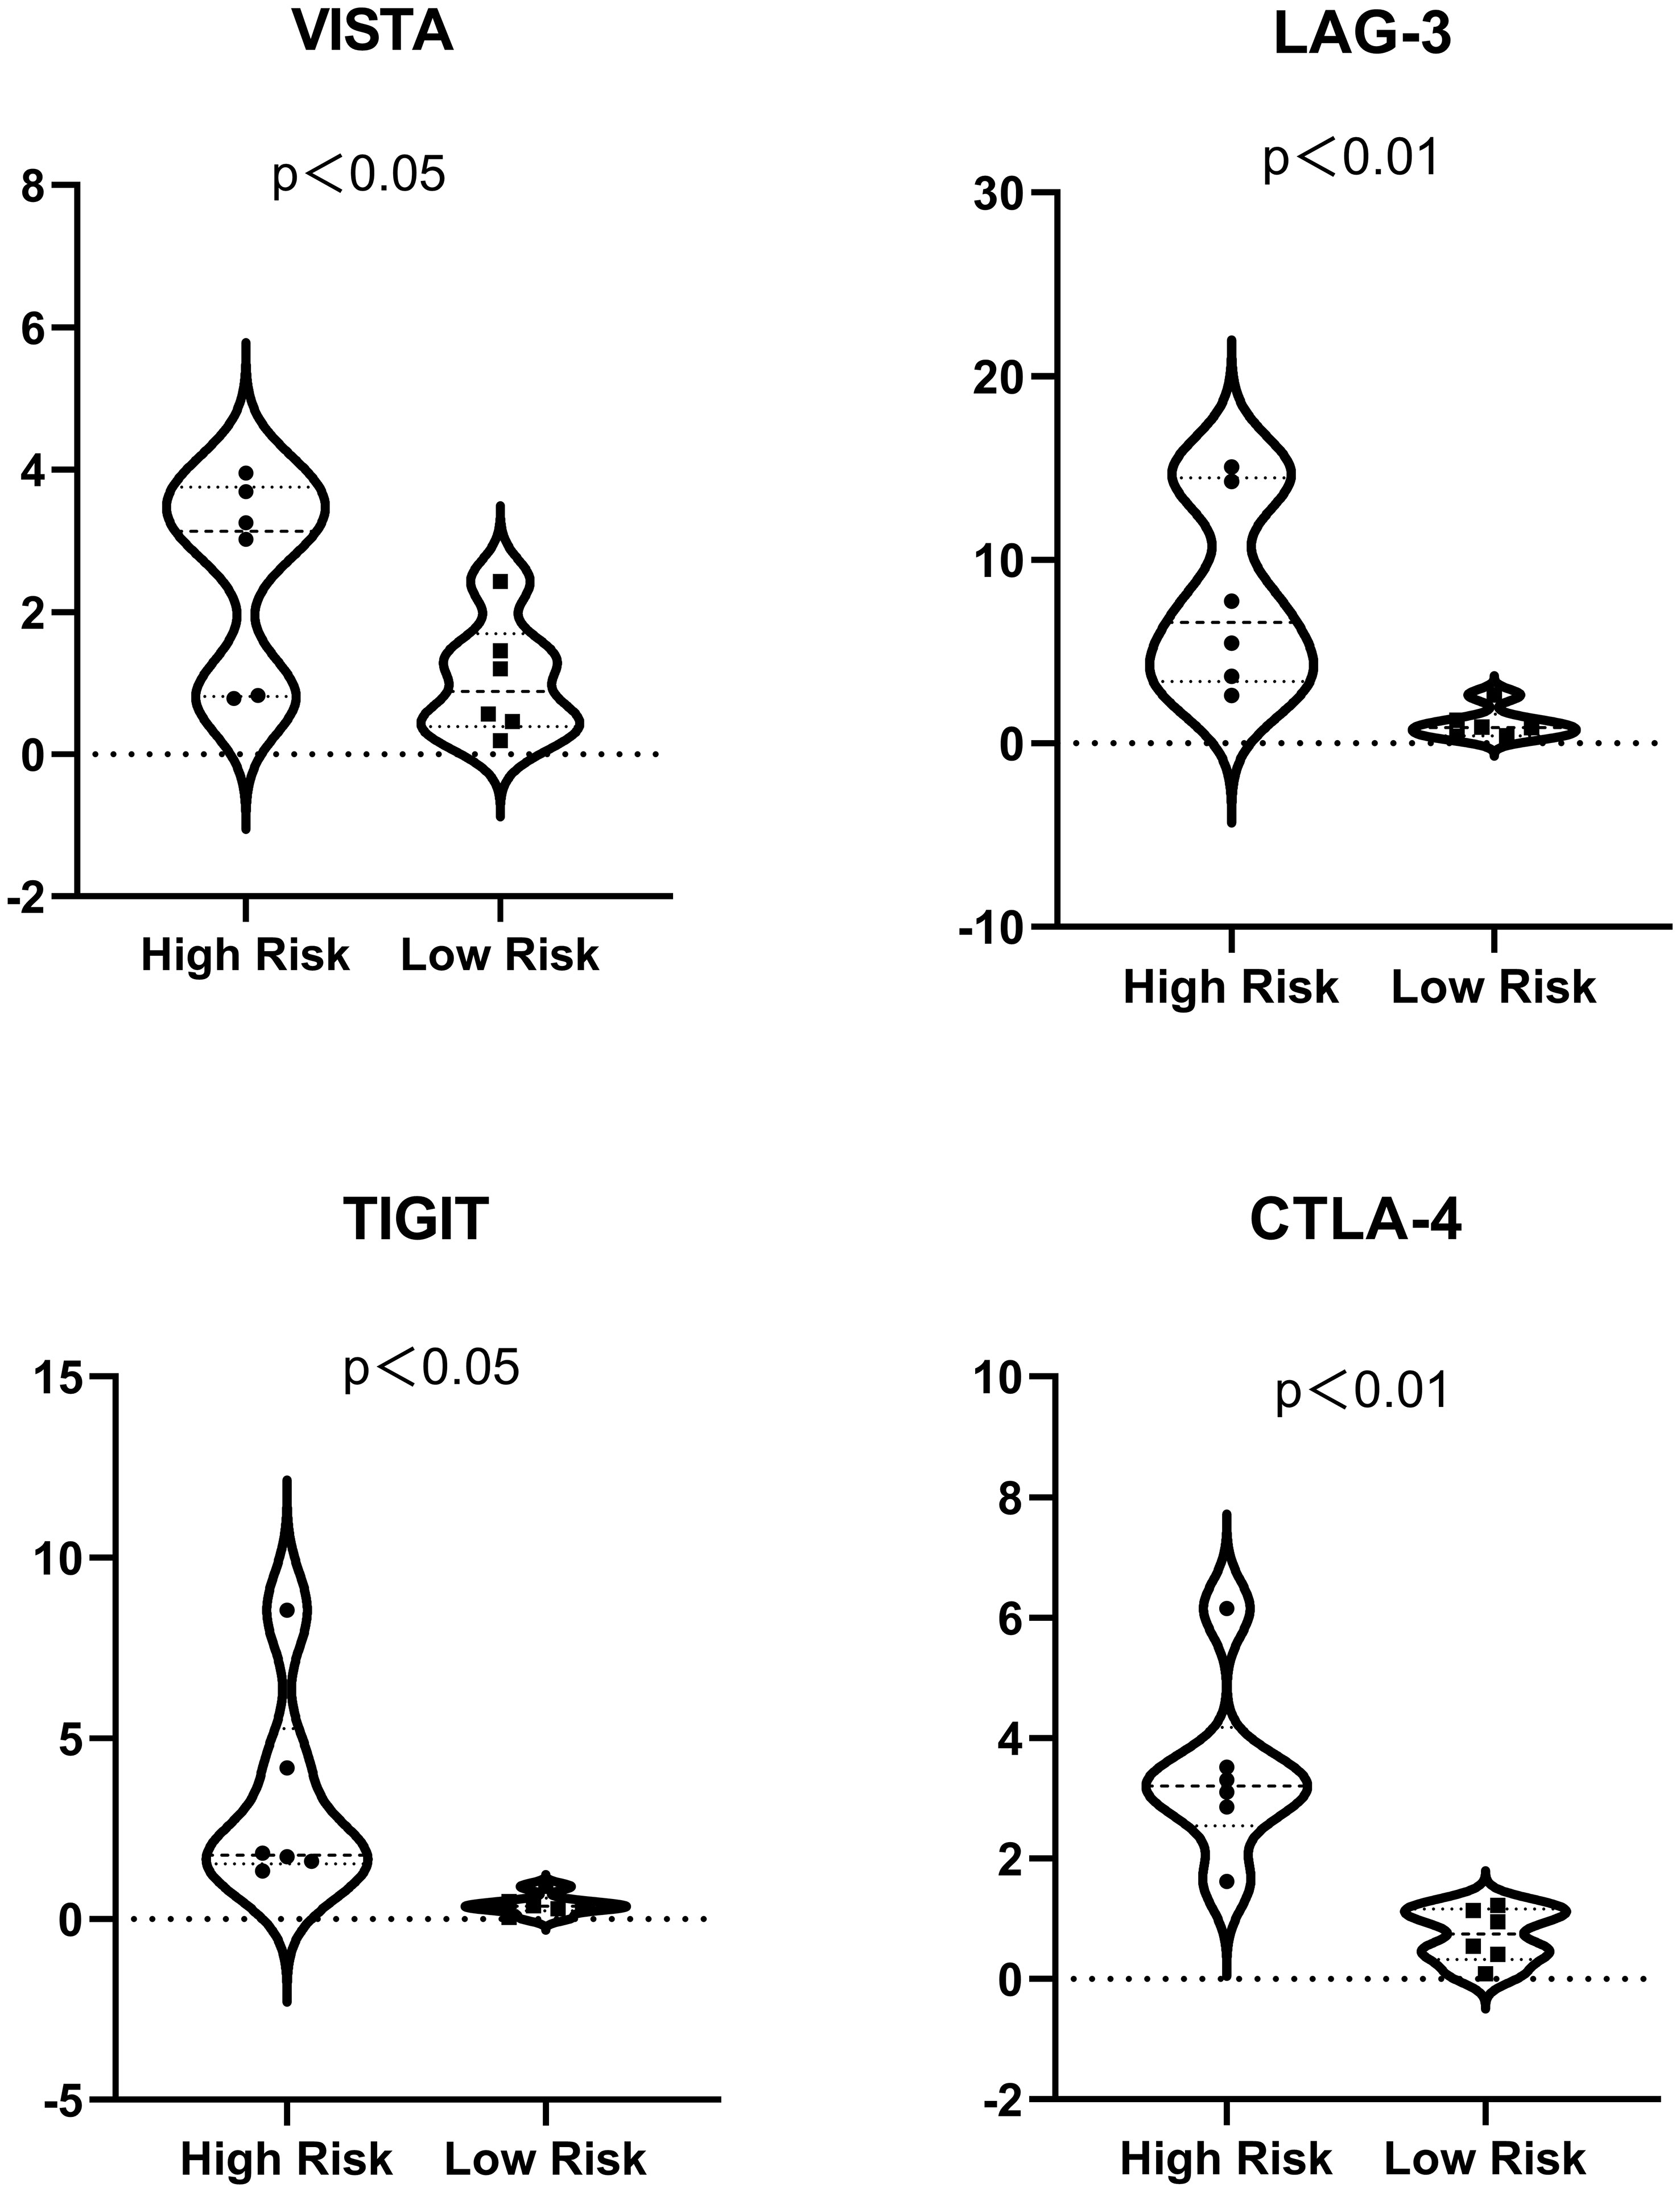
Figure 6 Expression of immune checkpoints (VISTA, LAG-3, TIGIT, and CTLA-4) in the high- and low-risk samples. For ease of reading, the unit of the vertical axis is 1/1,000.
Discussion
In recent years, progress in sequencing technology has exposed the genetic landscape of HCC (6) and shown that dysregulated gene expression is associated with several biological processes, including signal transduction, nutrient absorption, and antigen uptake. These involve different pathways, of which MPC dysregulation is closely linked with the growth, immune response, and death of HCC cells (7). Recent studies have identified a correlation between HCC and MPC.
A recent study found that, through the HIF/EHD2 pathway, hypoxia induces extensive HCC cell MPC, allowing the tumor to acquire exocytic nutrients and prolong survival (7). Hypoxia-inducible factor (HIF) mediates HCC cell adaptation and spread. Eps15 homology-domain containing protein 2 (EHD2), a membrane-ruffling transcription factor, activates HIF-1 and initiates MPC. Knocking out HIF-1 or EHD2 inhibits hypoxia-induced MPC and prevents hypoxic HCC cells from salvaging nutrients required for cell growth. In mice, HCC development and MPC are inhibited by EHD2 somatic or germline deletion or by using HIF-1 or MPC inhibitors. These findings provide a novel direction for liver cancer research. Coincidentally, EHD1 was one of the seven DEMRGs selected in the current study. All four EHD family members, EHD1–EHD4, are dynamin-related ATPases involved in regulating specific endocytic transport steps through direct and indirect binding to actin filaments (17). The KEGG analyses conducted by our study showed that the differential risk genes we obtained were also considerably enriched in the HIF-1 pathway. These findings make it clear that MPC plays an important role in regulating tumor growth, dissemination, and antitumor responses. Strategies aimed at modifying MPC status in HCC patients may greatly improve their prognosis.
A recent study by Byun et al. found that sorafenib induces MPC, which mitigates sorafenib−induced ferroptosis and confers drug resistance (18). Sorafenib, a multiple tyrosine and downstream serine/threonine kinase inhibitor that triggers apoptosis and prevents angiogenesis and cancer cell proliferation, was the first targeted drug for HCC to be approved worldwide (19). In HCC samples, sorafenib was shown to inactivate mitochondrial function through PI3K–RAC1–PAK1 signaling and to amplify HCC cell MPC. Ferroptosis, a form of cell death that occurs through the lethal accretion of lipid-based reactive oxygen species, is closely associated with the development of HCC (20, 21). In recent years, medications have been developed that specifically target HCC cell ferroptosis (22). However, MPC inhibits ferroptosis by restocking depleted endocellular cysteine, causing HCC cells to develop resistance to sorafenib (18). MPC differs from other types of endocytosis in part due to its susceptibility to inhibitors of Na+/H+ exchange. Amiloride, a guanidinium-containing pyrazine derivative, is extensively used as a sodium–hydrogen exchanger (NHE) inhibitor. NHEs are membrane transporters that mediate the electroneutral exchange of hydrogen efflux and sodium influx to regulate intracellular pH (23). NHE inhibition reduces cytosolic pH, thus causing sensitive changes in GTPases that promote actin remodeling and selectively block MPC. Thus, targeting MPC may prevent the development of sorafenib resistance and improve the efficacy of this drug against HCC.
For patients with advanced HCC, current targeted therapeutic drugs such as sorafenib and lenvatinib showed only limited survival benefits with many potential side effects (24). Just recently, after the great success of the IMbrave150 clinical trial in 2019, the relevant research on various immune checkpoint inhibitors (ICIs) has attracted the attention of researchers (24). The complex immune microenvironment of HCC provides further potential advantages for ICI-based therapies in HCC.
As we all know, after anti-programmed cell death protein 1/programmed cell death ligand 1 (PD-1/PD-L1) got satisfying results in most cancers, CTLA-4 has also made breakthroughs in the immunotherapy of various tumors. Engagement of LAG-3 by its ligands can contribute to the immune escape of tumor cells by mediating downstream signaling to affect T-cell immune activity. Therefore, blockages of the LAG-3-related inhibitory signaling are promising for the development of new therapies (25). VISTA can blunt the activity of antitumor cells and strengthen the power of protumor cells. After inhibition of other immune checkpoints, VISTA’s expression profile will increase, which indicates that VISTA could constitute a new complementary target in immunotherapy (26). TIGIT is mainly expressed on tumor-infiltrating cytotoxic T cells, NK cells, etc., contributing to local suppression of immune surveillance via interacting with CD155. Several preclinical studies have supported the use of TIGIT blockade for the treatment of some advanced malignant tumors (27).
Our model classifies HCC patients into HRS and LRS groups according to the relative expression of seven genes. The results show that there is a significant difference in the expression of CTLA-4/LAG-3/TIGIT/VISTA between the two groups, suggesting that the mechanism of the effect of macropinocytosis on the progression of HCC may be related to these immune checkpoints, which are promising targets for antitumor immunotherapy. Therefore, our model can provide new ideas for the innovation of immunotherapy regimens. We can conduct clinical trials in the future when the conditions are mature. In future studies, a comparison of the antitumor effect of two regimens (immunodrugs alone and immunodrugs combined with macropinocytosis inhibitors) in HCC patients may provide new insights.
It is well known that immunotherapy brings hope for improving the survival rate of HCC patients, but at the same time, a relative proportion of patients will develop drug resistance during immunotherapy, which has a significant impact on the prognosis of these patients. Among them, the drug resistance of HCC patients is mainly divided into primary drug resistance without initial response and secondary drug resistance after the initial control. At present, studies have found that the drug resistance of immunotherapy is related to a variety of potential mechanisms, including downregulation of tumor immunogenic antigen expression or impaired antigen presentation, mutation or deletion of genes related to signaling pathway (interferon-γ, WNT/β-catenin, etc.), immunosuppressive tumor microenvironment (TME), and generation of alternative immune checkpoints. Among them, TIM-3, LAG-3, and TIGIT are currently the hottest alternative immune checkpoint targets. Therefore, we associate that our risk model may be used to monitor the drug resistance of HCC patients after immunotherapy and evaluate the severity of drug resistance. After all, we have not found biomarkers that can well predict drug resistance reactions.
The current study has some limitations. First, some variables, including ethnicity, HCC cause, patient-related imaging data, and serum indicators, had high levels of missing data so they were not included in the datasets. The cause of HCC differs by geographic region and race, requiring different methods of prognosis and treatment (28). The specificity and sensitivity of prognostic models are improved with more imaging data and markers (16). Second, although the model we have constructed has been well verified in multiple public databases, there are some differences in different databases, such as the reliability and the best scope of application of the model. We should deepen our understanding of the molecular function of MPC and explore more genes that may be related to MPC in order to improve the reliability and applicability of MRPM. Thus, future studies should verify the findings of the current study with additional risk and associated genes to expand the current molecular understanding of MPC. A prospective study is also needed to validate the results of the current retrospective study (15).
Conclusion
This study used a panel of seven DEMRGs and clinical characteristics to build a prognostic model and validated the findings with data from a second database. The findings demonstrated strong discriminative power to predict HCC patient survival, showing promising prediction value and the ability to serve as a reference for the clinical stratification of HCC. The findings also partially confirmed the relevancy between the model and immunity, informing the development of new immunotherapeutic strategies to treat this disease (14).
Data availability statement
The datasets presented in this study can be found in online repositories. The names of the repository/repositories and accession number(s) can be found in the article/Supplementary Material.
Ethics statement
Written informed consent was obtained from the individual(s) for the publication of any potentially identifiable images or data included in this article.
Author contributions
All authors contributed to the conception and design of the study. Data collection and analysis were performed by XD. TY reviewed the literature and prepared the material. The first draft of the manuscript was written by XD. All authors commented on the subsequent versions of the manuscript. All authors contributed to the article and approved the submitted version.
Funding
This work was supported by the National Natural Science Foundation of China (grant numbers 81970543 and 81570591).
Acknowledgments
We would like to thank the National Natural Science Foundation of China for their economic support, Charlesworth Author Services for polishing the language of the manuscript, and Haohua Lu (Department of Urology, Sir Run Shaw Hospital, School of Medicine, Zhejiang University) for providing ideas for some program codes.
Conflict of interest
The authors declare that the research was conducted in the absence of any commercial or financial relationships that could be construed as a potential conflict of interest.
Publisher’s note
All claims expressed in this article are solely those of the authors and do not necessarily represent those of their affiliated organizations, or those of the publisher, the editors and the reviewers. Any product that may be evaluated in this article, or claim that may be made by its manufacturer, is not guaranteed or endorsed by the publisher.
Supplementary material
The Supplementary Material for this article can be found online at: https://www.frontiersin.org/articles/10.3389/fonc.2023.1143013/full#supplementary-material
Abbreviations
APC, antigen-presenting cell; AUC, area under ROC curve; CTLA-4, cytotoxic T lymphocyte-associated protein 4; DCs, dendritic cells; DEMRGs, differentially expressed macropinocytosis-related genes; EHD, Eps15 homology-domain containing protein; EXP, expression data; GO, Gene Ontology; HCC, hepatocellular carcinoma; HIF, hypoxia-inducible factor; HLA, human leucocyte antigen; HRS, high-risk score; ICI, immune checkpoint inhibitor; ICGC, International Cancer Genome Consortium; OS, overall survival; KEGG, Kyoto Encyclopedia of Genes and Genomes; LAG-3, lymphocyte activation gene-3; LASSO, least absolute shrinkage and selection operator; LRS, low-risk score; MPC, macropinocytosis; MRG, macropinocytosis-related gene; MRPM, macropinocytosis-related prognostic model; NHE, sodium–hydrogen exchanger; PCA, principal component analysis; PPI, protein–protein interaction; ROC, receiver operating characteristic; ssGSEA, single-sample gene set enrichment analysis; STRING, Search Tool for the Retrieval of Interacting Genes; TCGA, The Cancer Genome Atlas Program; TIGIT, T-cell immunoglobulin and ITIM domain; VISTA, V-domain Ig suppressor of T-cell activation.
References
1. Villanueva A. Hepatocellular carcinoma. N Engl J Med (2019) 380:1450–62. doi: 10.1056/NEJMra1713263
2. Greten TF, Lai CW, Li G, Staveley-O'Carroll KF. Targeted and immunebased therapies for hepatocellular carcinoma. Gastroenterol (2019) 156:510–24. doi: 10.1053/j.gastro.2018.09.051
3. Gao Q, Wang XY, Zhou J, Fan J. Multiple carcinogenesis contributes to the heterogeneity of HCC. Nat Rev Gastroenterol Hepatol (2015) 12(1):13. doi: 10.1038/nrgastro.2014.6-c1
4. Nakagawa S, Wei L, Song WM, Higashi T, Ghoshal S, Precision Liver Cancer Prevention Consortium, et al. Molecular liver cancer prevention in cirrhosis by organ transcriptome analysis and lysophosphatidic acid pathway inhibition. Cancer Cell (2016) 30(6):879–90. doi: 10.1016/j.ccell.2016.11.004
5. Petrizzo A, Mauriello A, Tornesello ML, Buonaguro FM, Tagliamonte M, Buonaguro L, et al. Cellular prognostic markers in hepatitis-related hepatocellular carcinoma. Infect Agent Cancer (2018) 13:10. doi: 10.1186/s13027-018-0183-8
6. Zhang MS, Cui JD, Lee D, Yuen VW-H, Chiu DK-C, Goh CC. Regulated portals of entry into the cell. Nature (2003) 422:37–44. doi: 10.1038/nature01451
7. Misty SZ, Jane DC, Lee D, Buonaguro FM, Tagliamonte M, Buonaguro L, et al. Hypoxia-induced macropinocytosis represents a metabolic route for liver cancer. Nat Commun (2022) 13(1):954. doi: 10.1038/s41467-022-28618-9
8. Finicle BT, Jayashankar V, Edinger AL. Nutrient scavenging in cancer. Nat Rev Cancer (2018) 18(10):619–33. doi: 10.1038/s41568-018-0048-x
9. Kamphorst JJ, Nofal M, Commisso C, Hackett SR, Lu W, Grabocka E, et al. Human pancreatic cancer tumors are nutrient poor and tumor cells actively scavenge extracellular protein. Cancer Res (2015) 75:544–53. doi: 10.1158/0008-5472.CAN-14-2211
10. Jayashankar V, Edinger AL. Macropinocytosis confers resistance to therapies targeting cancer anabolism. Nat Commun (2020) 11(1):1121. doi: 10.1038/s41467-020-14928-3
11. Kim SM, Nguyen TT, Ravi A, Kubiniok P, Finicle BT, Jayashankar V, et al. PTEN deficiency and AMPK activation promote nutrient scavenging and anabolism in prostate cancer cells. Cancer Discov (2018) 8(7):866–83. doi: 10.1158/2159-8290.CD-17-1215
12. Kay RR. Macropinocytosis: Biology and mechanisms. Cells Dev (2021) 168:203713. doi: 10.1016/j.cdev.2021.203713
13. Song S, Zhang Y, Ding T, Ji N, Zhao H. The dual role of macropinocytosis in cancers: Promoting growth and inducing methuosis to participate in anticancer therapies as targets. Front Oncol (2021) 10:570108. doi: 10.3389/fonc.2020.570108
14. Deng M, Sun S, Zhao R, Guan R, Zhang Z, Li S, et al. The pyroptosis-related gene signature predicts prognosis and indicates immune activity in hepatocellular carcinoma. Mol Med (2022) 28(1):16. doi: 10.1186/s10020-022-00445-0
15. Deng T, Hu B, Jin C, Tong Y, Zhao J, Shi Z, et al. A novel ferroptosis phenotype-related clinical-molecular prognostic signature for hepatocellular carcinoma. J Cell Mol Med (2021) 25(14):6618–33. doi: 10.1111/jcmm.16666
16. Wan S, Lei Y, Li M, Wu B. A prognostic model for hepatocellular carcinoma patients based on signature ferroptosis-related genes. Hepatol Int (2022) 16(1):112–24. doi: 10.1007/s12072-021-10248-w
17. Naslavsky N, Caplan S. EHD proteins: key conductors of endocytic transport. Trends Cell Biol (2011) 21:122–31. doi: 10.1016/j.tcb.2010.10.003
18. Byun J-K, Lee S, Kang GW, Lee YR, Park SY, Song IS, et al. Macropinocytosis is an alternative pathway of cysteine acquisition and mitigates sorafenib-induced ferroptosis in hepatocellular carcinoma. J Exp Clin Cancer Res (2022) 41(1):98. doi: 10.1186/s13046-022-02296-3
19. Llovet JM, Ricci S, Mazzaferro V, Hilgard P, Gane E, Blanc JF, et al. Sorafenib in advanced hepatocellular carcinoma. N Engl J Med (2008) 359(4):378–90. doi: 10.1056/NEJMoa0708857
20. Yang WS, SriRamaratnam R, Welsch ME, Shimada K, Skouta R, Viswanathan VS, et al. Regulation of ferroptotic cancer cell death by GPX4. Cell (2014) 156:317–31. doi: 10.1016/j.cell.2013.12.010
21. Dixon SJ, Lemberg KM, Lamprecht MR, Skouta R, Zaitsev EM, Gleason CE, et al. Ferroptosis: an iron-dependent form of nonapoptotic cell death. Cell (2012) 149:1060–72. doi: 10.1016/j.cell.2012.03.042
22. Sun X, Ou Z, Chen R, Niu X, Chen D, Kang R, et al. Activation of the p62-Keap1-NRF2 pathway protects against ferroptosis in hepatocellular carcinoma cells. Hepatol (2016) 63:173–84. doi: 10.1002/hep.28251
23. Koivusalo M, Welch C, Hayashi H, Scott CC, Kim M, Alexander T, et al. Amiloride inhibits macropinocytosis by lowering submembranous pH and preventing Rac1 and Cdc42 signaling. J Cell Biol (2010) 188(4):547–63. doi: 10.1083/jcb.200908086
24. Liu JKH, Irvine AF, Jones RL, Samson A. Immunotherapies for hepatocellular carcinoma. Cancer Med (2022) 11(3):571–91. doi: 10.1002/cam4.4468
25. Tian J, Liu Y, Zhang T, Yue L, Xiao Y, Guo C, et al. LAG-3 is a promising inhibitory immune checkpoint for antitumor immunotherapy. Expert Rev Anticancer Ther (2022) 22(3):289–96. doi: 10.1080/14737140.2022.2039124
26. Mortezaee K, Majidpoor J, Najafi S. VISTA immune regulatory effects in bypassing cancer immunotherapy: Updated. Life Sci (2022) 310:121083. doi: 10.1016/j.lfs.2022.121083
27. Ge Z, Peppelenbosch MP, Sprengers D, Kwekkeboom J. TIGIT, the next step towards successful combination immune checkpoint therapy in cancer. Front Immunol (2021) 12:699895. doi: 10.3389/fimmu.2021.699895
Keywords: macropinocytosis, hepatocellular carcinoma, prognosis, tumor microenvironment, survival
Citation: Ding X, Yao T, Liu X, Fan Z and Liu Y (2023) A macropinocytosis-related gene signature predicts the prognosis and immune microenvironment in hepatocellular carcinoma. Front. Oncol. 13:1143013. doi: 10.3389/fonc.2023.1143013
Received: 12 January 2023; Accepted: 06 March 2023;
Published: 30 March 2023.
Edited by:
Zhigang Ren, First Affiliated Hospital of Zhengzhou University, ChinaReviewed by:
Johann Matschke, Essen University Hospital, GermanyXiaozai Xie, The First Affiliated Hospital of Wenzhou Medical University, China
Xinhua Song, Capital Medical University, China
Copyright © 2023 Ding, Yao, Liu, Fan and Liu. This is an open-access article distributed under the terms of the Creative Commons Attribution License (CC BY). The use, distribution or reproduction in other forums is permitted, provided the original author(s) and the copyright owner(s) are credited and that the original publication in this journal is cited, in accordance with accepted academic practice. No use, distribution or reproduction is permitted which does not comply with these terms.
*Correspondence: Yuanxing Liu, bGl1eXVhbnhpbmdAemp1LmVkdS5jbg==