 Jiahui Zhou1†
 Sheng Yang2,3†
 Dawei Zhu1†Hao Li1†Xinsheng Miao1Menghui Gu1Wei Xu1
 Yan Zhang1Wei Tang1Renbin Shen1Jianhua Zha1
 Jianhua Zhu1*Zheng Yuan1*Xinhua Gu1*
- 1Department of Gastrointestinal Surgery, The Affiliated Suzhou Hospital of Nanjing Medical University, Suzhou Municipal Hospital, Gusu School, Nanjing Medical University, Suzhou, China
- 2Department of Colorectal Surgery, The First Affiliated Hospital of Nanjing Medical University, Nanjing, China
- 3Colorectal Institute of Nanjing Medical University, Nanjing, China
Anoikis and epithelial-mesenchymal transition (EMT) are significant phenomena occurring in distant metastasis of colon adenocarcinoma (COAD). A comprehensive understanding of their crosstalk and the identification of key genes are vital for treating the distant metastasis of COAD. The objective of this study was to design and validate accurate prognostic predictors for COAD patients based on the anoikis and EMT processes. We obtained gene signatures from various databases and performed univariate and multivariate Cox regression analyses, principal component analysis (PCA). The COAD patients were categorized into the worst prognosis group, the Anoikis Potential Index (API) Low + EMT Potential Index (EPI) High group and the others group. Then we utilized gene set enrichment analysis (GSEA) to identify differentially expressed genes and to establish a prognostic risk model. The model classified patients into high- or low-risk groups, with patients in the high-risk group displaying worse survival status. A nomogram was established to predict overall survival rates, demonstrating high specificity and sensitivity. Additionally, we connected the risk model to the tumor microenvironment (TME) using single-sample GSEA and the MCP counter tool, as well as evaluated the sensitivity to common chemotherapeutic drugs, such as Gefitinib and Gemcitabine. Lastly, cell and tissue experiments suggested a positive correlation among anoikis resistance, EMT, and liver/lung metastasis of COAD. This is the first study to comprehensively analyze the crosstalk between anoikis and EMT and offers new therapeutic targets for COAD metastasis patients.
Introduction
According to the statistics presented by the American Cancer Society (2023), COAD ranks third in terms of the incidence and mortality rate of all cancers, irrespective of gender. It affects young individuals and poses a serious health risk to the public (1). It has been reported that Stage I patients can attain a 5-year survival rate (after surgical resection) of ≥90%, while the patients with distant metastasis showed a 5-year survival rate of only 11%, despite the application of adjuvant chemotherapy, targeted drugs, or immunotherapy (2, 3). This has necessitated the need to thoroughly understand and urgently address the problem of COAD metastasis.
EMT is a phenomenon where epithelial cells can acquire a mesenchymal phenotype, which is first observed in embryonic development. Once EMT is activated, tumor cells undergo many changes, such as their dissociation with tight junctions, disruption of apical-basal polarity, and remodeling of cytoskeletal structures, all of which contribute to the movement of cells from their primary location, invasion of neighboring tissues, survival during the circulation process, and the eventual formation of metastatic foci at distant sites (4, 5). Several studies have reported an association between EMT and COAD metastasis. Wang et al. revealed that the THZ1 could promote EMT by inhibiting the degradation of Snail, which in turn increased colorectal cancer liver metastasis (6). Xiang et al. demonstrated that Snail could facilitate the formation of M2-macrophages by secreting CXCL2, which finally promoted the lung metastasis of colorectal cancer (7).
Epithelial cells increase their survival rate by attaching to the ECM. In addition, they undergo apoptosis after they get detached from the ECM, which is defined as the anoikis phenomenon (8). It was noted that the tumor cells acquire resistance to anoikis, where even when they get detached from the ECM they cannot undergo apoptosis easily, invade the surrounding tissues, and subsequently metastasize distantly (9). Many recent studies have highlighted the correlation between anoikis and COAD metastasis. Wei et al. reported that simultaneous inhibition of PDK1 and STAS3-Y705 enhanced the anoikis process, which further inhibited colorectal cancer liver metastasis (10). Xu et al. demonstrated that CPT1A-mediated FAO activation promoted anoikis resistance in colorectal cancer cells and improved lung metastasis (11).
Both the EMT and anoikis phenomena occur during the invasive stage of primary tumors and undergo a few crosstalks (12). It was observed that up-regulated Claudin-1 reduced E-cadherin expression via ZEB-1 modulation, attenuating the invasive ability, and anoikis of COAD cells (13). Up-regulated miR-450a was reported to inhibit EMT, promote anoikis, and thus inhibit the migration and invasion capacities of ovarian cancer cells (14). The deletion of 4.1N facilitated EMT, anoikis resistance, and consequently the metastasis of epithelial ovarian cancer cells (15). Therefore, the co-analysis of EMT and anoikis could help to identify the genes that play key roles in COAD metastasis.
This study comprehensively and substantively described the interaction between anoikis and EMT. We divided COAD patients into the worst prognosis group and the others groups by univariate and multivariate Cox regression analysis and PCA. We then used GSEA to identify differentially expressed genes and to establish a prognostic risk model containing NAT1, CDKN2A, and PCOLCE2 with high specificity and sensitivity. In addition, we linked the risk model to the TME and assessed the sensitivity to common chemotherapeutic drugs. Finally, cell and tissue experiments further demonstrated the correlation between anokis, EMT and COAD metastasis. Figure 1 depicts the flowchart used in this study.
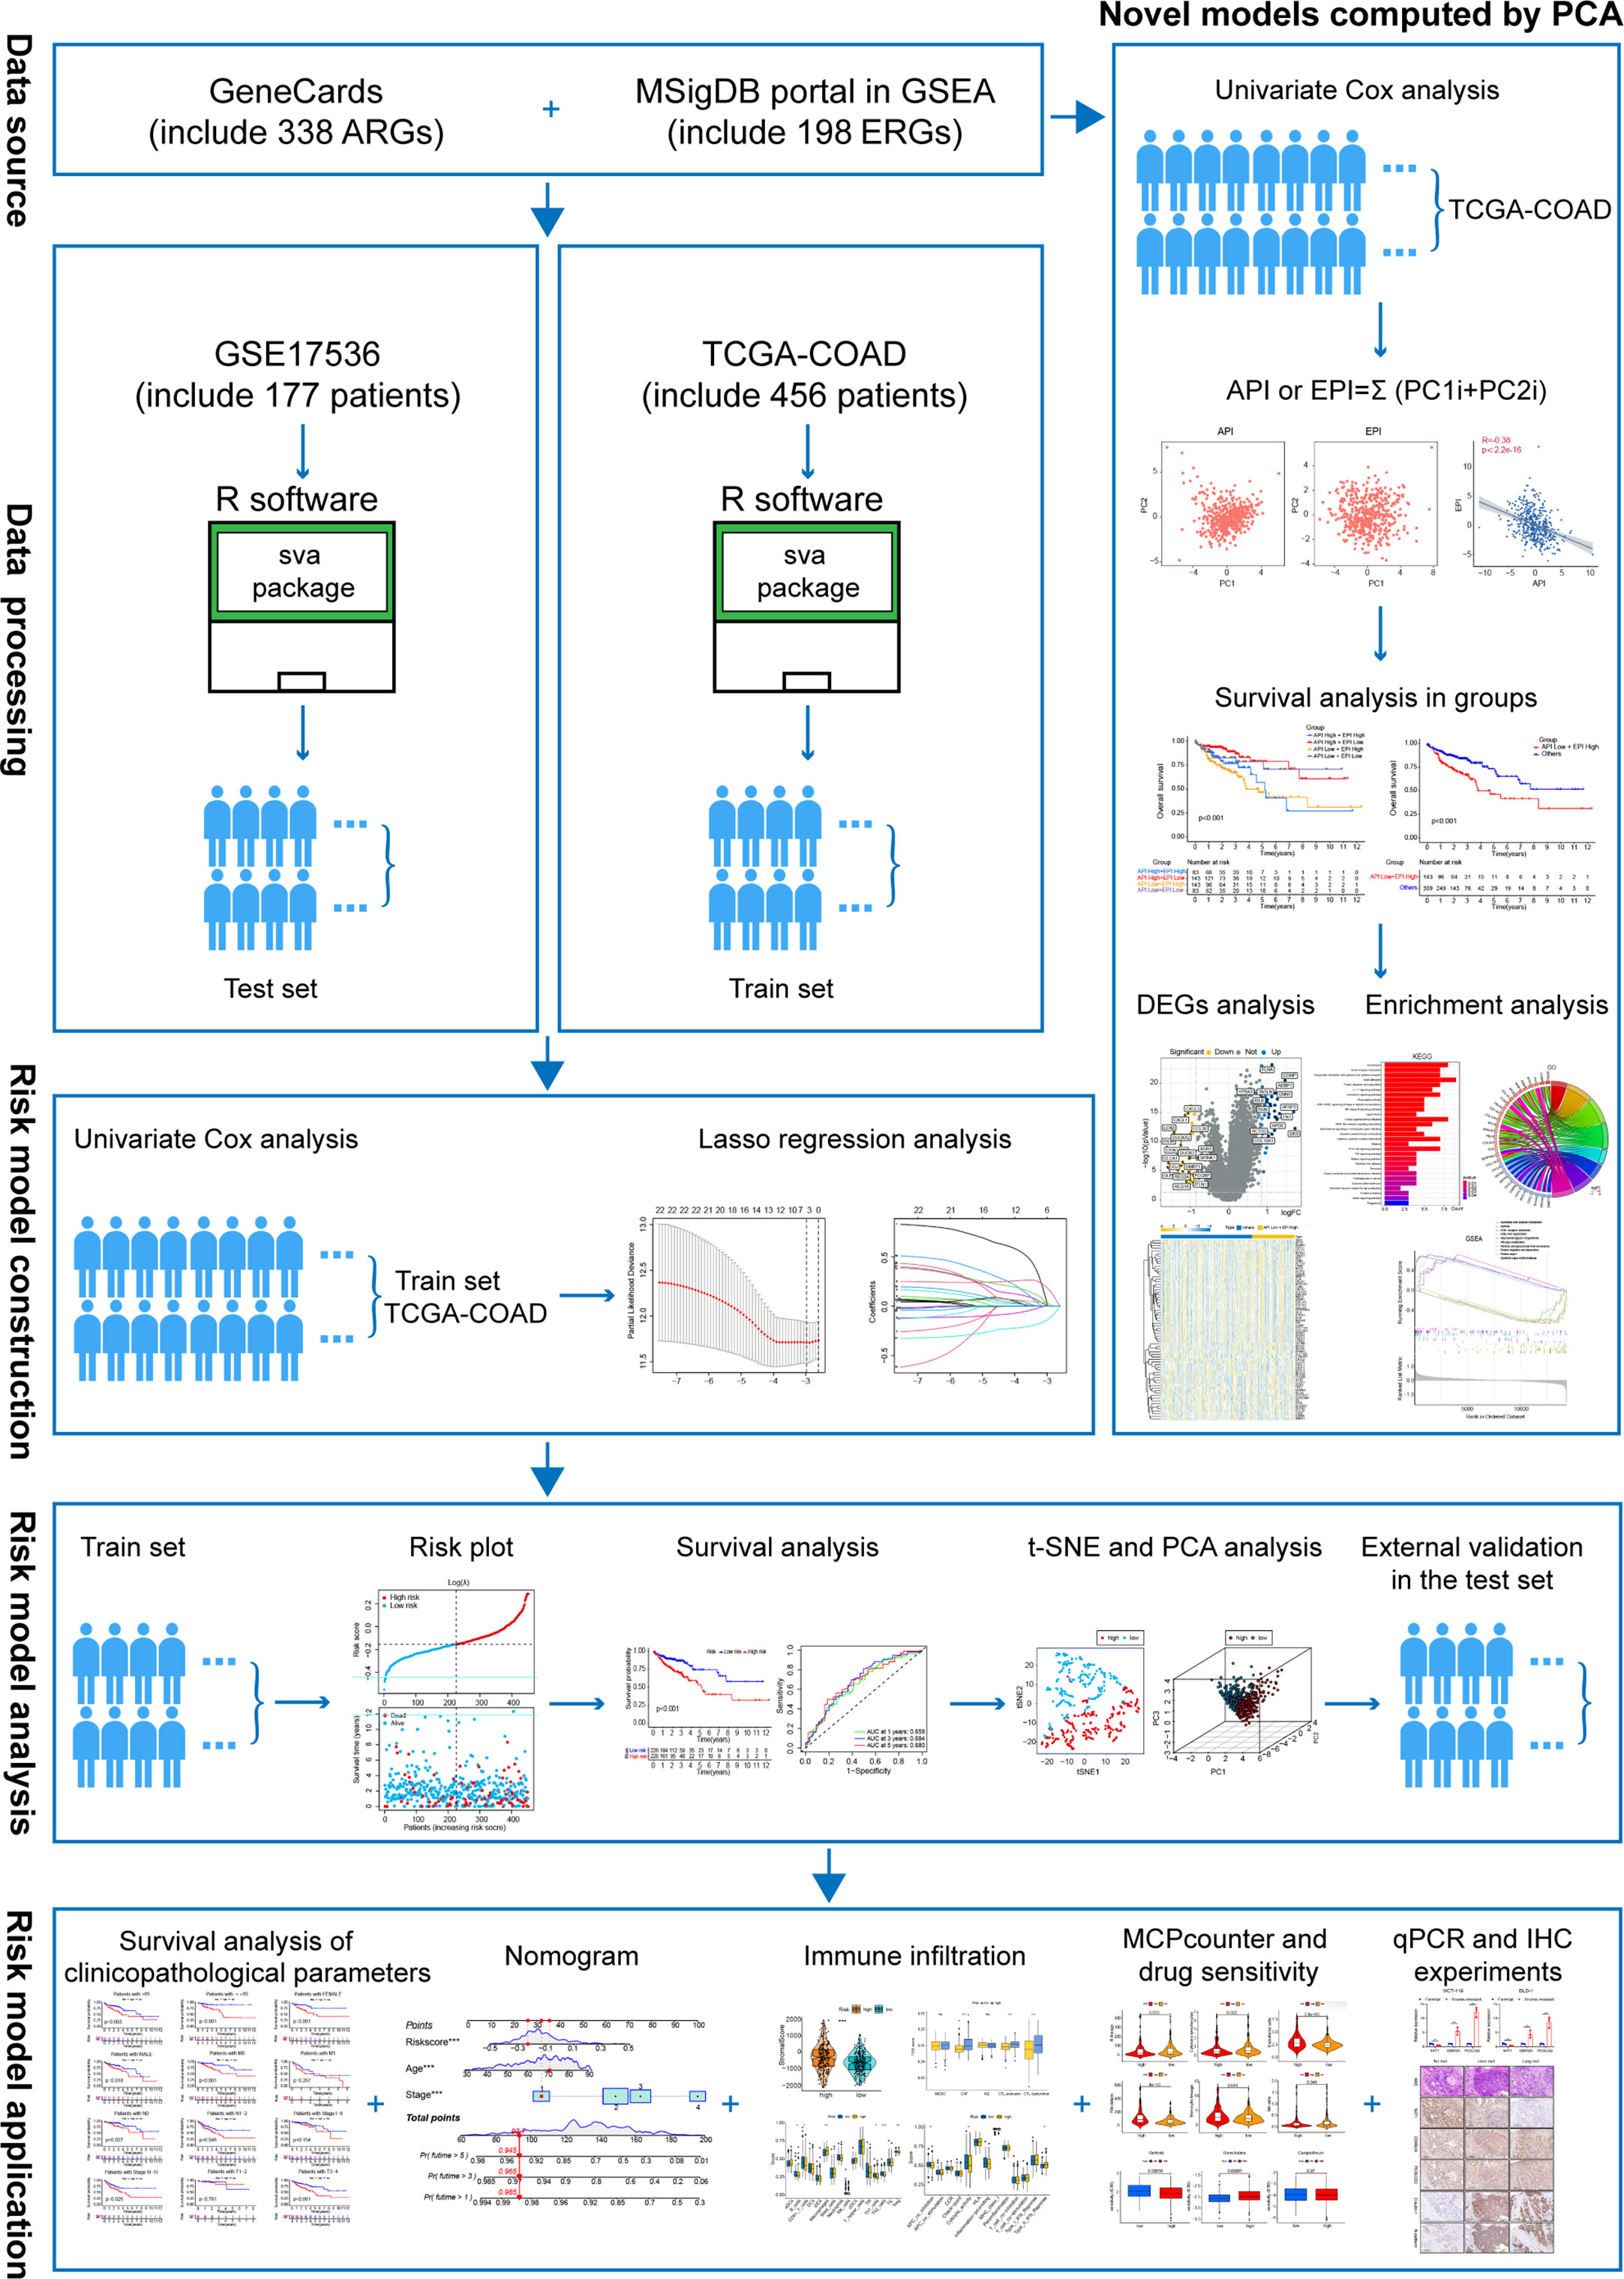
Figure 1 The flowchart of overall study methods and results.
Materials and methods
Data sources and analysis
A total of 338 ARGs (anoikis-linked genes) were obtained from GeneCards (https://www.genecards.org/), and the genes showing a relevance score of >1 were chosen in the study. The EMT signature containing 198 genes (EMT-related genes, i.e., ERGs) was derived from the MSigDB portal in GSEA (http://software.broadinstitute.org/gsea/msigdb). The genetic information and clinically-relevant data from The Cancer Genome Atlas (TCGA) database (https://portal.gdc.cancer.gov/repository) was acquired for 459 COAD patients. Meanwhile, gene expression matrices containing 317 ARGs and 195 ERGs were extracted independently using R language software, and the ‘limma’ software was used to analyze the variations between the two. Thereafter, 152 DEGs for ARGs (diff-ARGs) and 125 DEGs for ERGs (diff-ERGs) were selected based on the following screening criteria: |FC|>1.5 and p<0.05. The ‘Rcircos’ software was applied to map the location of anoikis and EMT-related genes on human chromosomes. The data associated with the somatic mutations, genome mutations, and Copy number variations (CNV) in COAD were also derived from TCGA.
Survival analysis
In this study, univariate and multivariate Cox regression analyses were carried out with the help of the ‘survival’’ package. The Kaplan Meier (KM) curves were plotted to compare the differences (variations) in overall survival (OS) between different groups. The logarithmic rank test was employed to determine the P-value between different groups. Furthermore, the time-dependent receiver operating characteristic (ROC) curves were assessed using the ‘survivalROC’ packets. The area under the ROC curve (AUC) value was used to evaluate the prognostic performance of the ROC curve.
Computational models of anoikis and EMT levels in COAD
In this study, Principal component analysis (PCA) was conducted for determining the anoikis and EMT scores for understanding the degree of anoikis and EMT in each sample. Then, univariate Cox regression analysis was conducted for analyzing the survival of anoikis and EMT-related genes. Then, the gene expression matrix (P<0.05) for PCA was extracted, and the principal components 1 and 2 were determined as the main subjects. Based on a few earlier reports (16–18), the Anoikis Potential Index (API) and EMT Potential Index (EPI) were defined, respectively: API or EPI=Σ (PC1i+PC2i), where i denotes the expression of related genes.
Gene set enrichment analysis
GSEA was utilized to study the relationship between both groups after dividing the TCGA samples into the API Low + EPI High group and the others group. For each analysis, 1000 genome permutations were carried out. The enrichment function was selected using the below-mentioned criteria: the ‘clusterProfiler’ software was used to enrich and evaluate the gene set with the false discovery rate (FDR) of 0.25 and 0.05 NOM p-value. The first five up- and down-regulated functions of the two enrichment sets were visualized by multiple GSEA maps. Then, the DEGs were identified using the differential expression analysis. Thereafter, the ‘ClusterProfiler’ was employed for carrying out Gene ontology (GO) and Kyoto Encyclopedia of Genes and Genomes (KEGG) enrichment analyses for enriching and analyzing the DEGs. Finally, the ‘Enrichplot’ and ‘ggplot2’ software were used for presenting the enrichment results as a bar graph, bubble graph, chord graph, and cluster circle graph.
Construction of an anoikis-related and EMT-related prognostic model
In this study, univariate Cox regression analysis was conducted for identifying 12 anoikis-linked genes and 11 EMT-related genes. The ‘glmnet’ software was utilized for determining the optimal value of the penalty parameter, lambda, through 1000 times of cross-validation with the Least absolute shrinkage and selection operator (LASSO) regression technique. The risk scores for every COAD patient were estimated using the coefficient and expression of the candidate prognostic anoikis-related genes and EMT-related genes (PAEG), with the following risk scoring formula: ; where Coefi denotes the coefficient of gene i, and Expri denotes the expression of every gene in patient i (18).
Validating the PAEG risk model
The expression levels of 3 mRNAs, risk score, survival duration, and risk level for each TCGA sample were integrated into a table and used as a training set. The GSE17536 dataset was used as the test set to validate the training set’s accuracy. The risk prognosis was examined using the KM chart and a log-rank test. Also, the ROC curve was plotted using the ‘timeROC’ tool. Then, the risk heat map, survival state diagram, and risk curve were generated using the ‘pheatmap’ program. PCA and t-SNE analysis were carried out using the ‘Rtsne’ and ‘ggplot2’ packages, respectively. Lastly, the risk score values were combined with clinical parameters (such as age, sex, grade, and TNM stage) and visualized using the forest map.
Nomogram construction and calibration
In this study, clinical characteristics such as age, TNM stage, and risk scores were used as research subjects for univariate Cox analysis. The survival rates of COAD patients after one, three, and five years were anticipated by a nomograph using the ‘RMS’ tool. Here, calibration curves were used to evaluate the nomogram’s accuracy. Lastly, the ‘ggDCA’ software was used for plotting the decision curve analysis (DCA) curve for predicting the clinical values of various objects.
Immune infiltration levels in the high- and low-risk groups
Firstly, the ‘ESTIMATE’ software was employed for assessing the stromal score, immune score, and tumor purity between both groups. Then, the differences in immune function, the activity of immune cells, and the immune pathways between the two groups in the training set and test set were examined using the single sample GSEA (ssGSEA) test, and the data were visualized using the box graph. Based on the COAD expression matrix, the ‘MCP counter’ web tool was used for estimating the abundance of various non-immune and immune stromal cells. The data were then observed using violin plots. Then, the human leukocyte antigen (HLA) gene expression and the expression levels of various immune checkpoint genes in both groups were estimated.
Prediction of chemosensitivity
In this study, the half maximal inhibitory concentration (IC50) of three commonly used chemotherapeutic drugs, such as Gefitinib, Gemcitabine, and Camptothecin, was determined in colorectal cancer using the ‘pRRophic’ package. Thereafter, the difference in the sensitivity levels of the above chemotherapy drugs between the high- and low-risk groups was assessed by comparing the variations in the IC50 values between both groups.
Patient tissue specimens and cell lines
Herein, the tissue specimens of COAD patients without distant metastasis, with liver metastasis, and with lung metastasis were extracted from the patients after surgical resection in the Department of Gastrointestinal Surgery, Suzhou Municipal Hospital, Jiangsu, China. The patients had not undergone preoperative chemoradiotherapy, and all specimens were sampled within 10 mins after resection and subsequently fixed in 10% formalin. The Ethics Committee in the hospital approved the experimental procedures used in the study, and the patients were also asked to sign a consent form.
The HCT-116 and DLD-1 colon cancer cell lines were supplied by the Shanghai Cell Bank, Chinese Academy of Sciences (China). These cells were cultured in the DMEM medium (Hyclone, USA) containing 10% (v/v) fetal bovine serum (Hyclone, USA), and 1% (v/v) penicillin/streptomycin solution (Beyotime, China), at 37°C, under 5% CO2 and 95% humidity conditions. The anoikis-resistance model was developed based on published literature (19, 20). Herein, the above-mentioned COAD cell lines were continually cultivated in ultra-low-attachment 6-well cell culture plates (Corning, USA) for 7 days and were transferred to the normal culture plates for 24 h. The re-adhered cells were defined as anoikis-resistant cells. All the experiments were conducted using mycoplasma-free cells. The Shanghai Cell Bank of the Chinese Academy of Sciences (China) validated all the cell lines used in the past three years.
RNA extraction and qRT-PCR analyses
The TRIzol reagent (Takara, Japan) was used for isolating the total RNA samples from the normal and anoikis-resistant cells. These RNA samples were reverse-transcribed into cDNA using the HiScript II RT SuperMix qPCR kit (Vazyme, China). The qRT-PCR experiments were carried out with the aid of the SYBR Premix Ex Taq Kit (Takara, Japan) on an RT-PCR instrument (7500 Sequence Detection System, Applied Biosystems, USA). The primers were designed and acquired from RiboBio (China). In this study, GAPDH was employed as the internal control for all experiments. The gene expression was represented using the 2-ΔΔCT technique. Table S1 lists the primer sequences used in the study.
Hematoxylin-eosin staining and immunohistochemistry
Herein, H&E staining and IHC experiments were conducted as mentioned in an earlier study (21). Table S2 lists the antibodies used in this study.
Statistical analysis
All data were statistically analyzed using the R language (ver. 4.1.2) and GraphPad Prism software (ver. 8.0.1). The Kolmogorov-Smirnov normality test was carried out for determining if the data followed the Gaussian distribution, and the data were compared for every sample. If the data conformed to a non-Gaussian distribution, a non-parametric test (Wilcoxon rank test or Spearman correlation) was carried out. On the other hand, when the data conformed to a Gaussian distribution, the parametric test was conducted (unpaired Student’s test, one-way ANOVA, or Pearson correlation). Values with P<0.05 were deemed statistically significant.
Results
Identifying the differentially expressed ARGs and ERGs associated with prognosis
Initially, the ARGs and ERGs were downloaded from GeneCards and GSEA, and subsequently, the diff-ARGs and diff-ERGs were selected, respectively. The locations of diff-ARGs and diff-ERGs on human chromosomes were mapped separately in Supplementary Figure 1A, B. Then, the clinical prognostic data of COAD patients were acquired from TCGA, and subsequently, 152 diff-ARGs and 125 diff-ERGs were combined with the clinical data using univariate Cox analysis (P<0.05), to eventually obtain 12 prognosis-related ARGs (TIMP1, BDNF, IGF1, CDKN2A, MTA1, NAT1, INHBB, CD24, CD36, TRAF2, NOTCH3, PPP2R2A) and 11 prognosis-related ERGs (BGN, CXCL1, FSTL3, GPC1, MMP3, OXTR, PCOLCE2, SCG2, SERPINE1, SERPINH11, TPM2) (Figure 2A, B). Thereafter, the expression levels of the 23 genes in 521 COAD samples (41 normal samples and 480 tumor samples) from TCGA were determined, and box plots were generated independently, which indicated that the genes were differentially expressed between healthy and malignant tissues (Figures 2C, D). Meanwhile, the correlations between these 12 ARGs and 11 ERGs associated with prognosis were further analyzed and plotted using the ‘corrplot’ package (Figure 2E). Then, the pairs of genes for the Sankey diagram (P<0.05, |cor|>0.3) were selected, where the positive value represented the positive relationship, whereas the negative value indicated a negative correlation (Figure 2F).
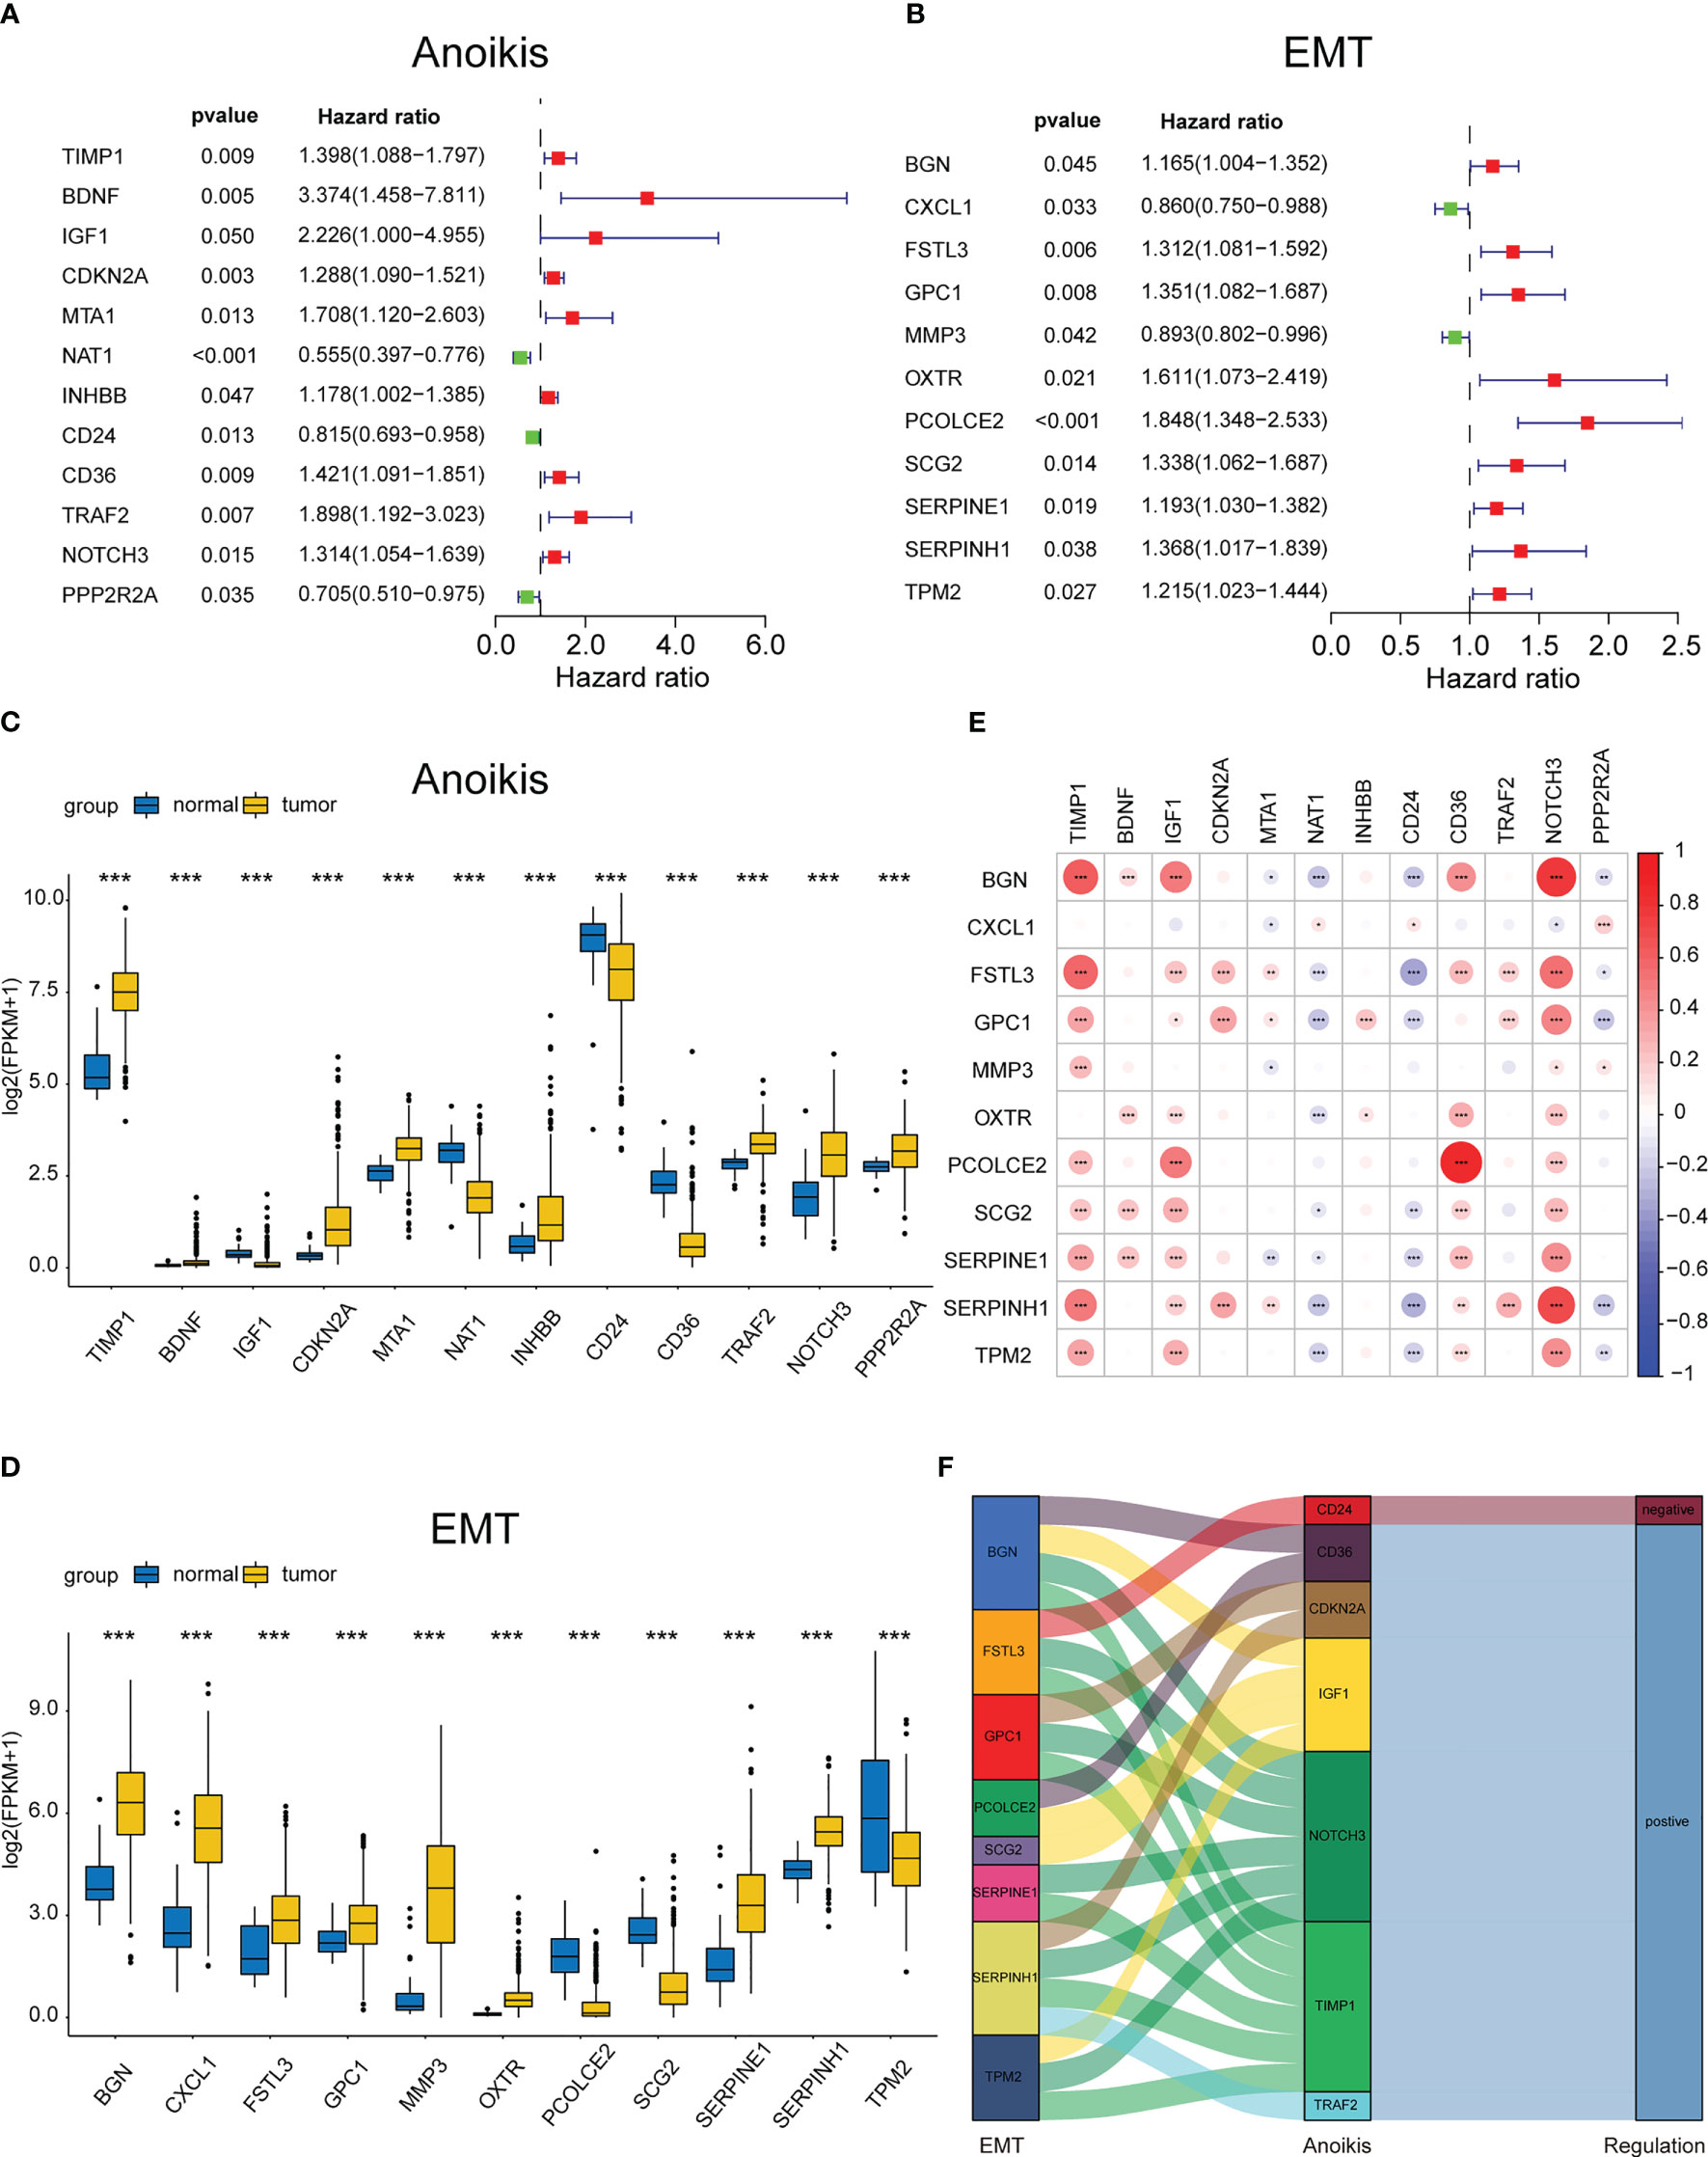
Figure 2 Identifying the differentially expressed ARGs and ERGs associated with prognosis. Forest map of 11 prognostic anoikis-related genes (A) and 12 prognostic EMT-related genes (B) by univariate Cox analysis (P< 0.05). The differential expression box plot of 11 prognostic anoikis-related genes (C) and 12 prognostic EMT-related genes (D) in COAD. (E)Pearson correlation analysis of 11 prognostic anoikis-related genes and 12 prognostic EMT-related genes. The red color represents a positive correlation; the blue color represents a negative correlation. (F) The Sankey diagram displayed the relationship between 11 prognostic anoikis-related genes and 12 prognostic EMT-related genes. *p< 0.05, **p< 0.01, and ***p< 0.001.
Construction of API and EPI with negative correlation
To further investigate the crosstalk between ARGs and ERGs, the anoikis and EMT levels in each tumor tissue were calculated and quantified based on the 12 prognosis-related ARGs and 11 prognosis-related ERGs with PCA, and the API and EPI were separately defined (Figure 3A, B). A negative correlation was detected between API and EPI in COAD patients (Figure 3C). Subsequently, the COAD patients were classified into four molecular subtype groups based on their API and EPI scores, namely API High + EPI High; API High + EPI Low; API Low + EPI High; and API Low + EPI Low. The results of the prognosis analysis indicated that patients in the API Low + EPI High group exhibited the shortest survival time compared to the other three groups (Figure 3D). Then, the data from the other groups of COAD patients were combined and compared with the API Low + EPI High group for prognostic analysis, and the corresponding p-value<0.001 was obtained (Figure 3E). Both analysis results indicated that high anoikis resistance and high EMT levels were associated with an unfavorable prognosis.
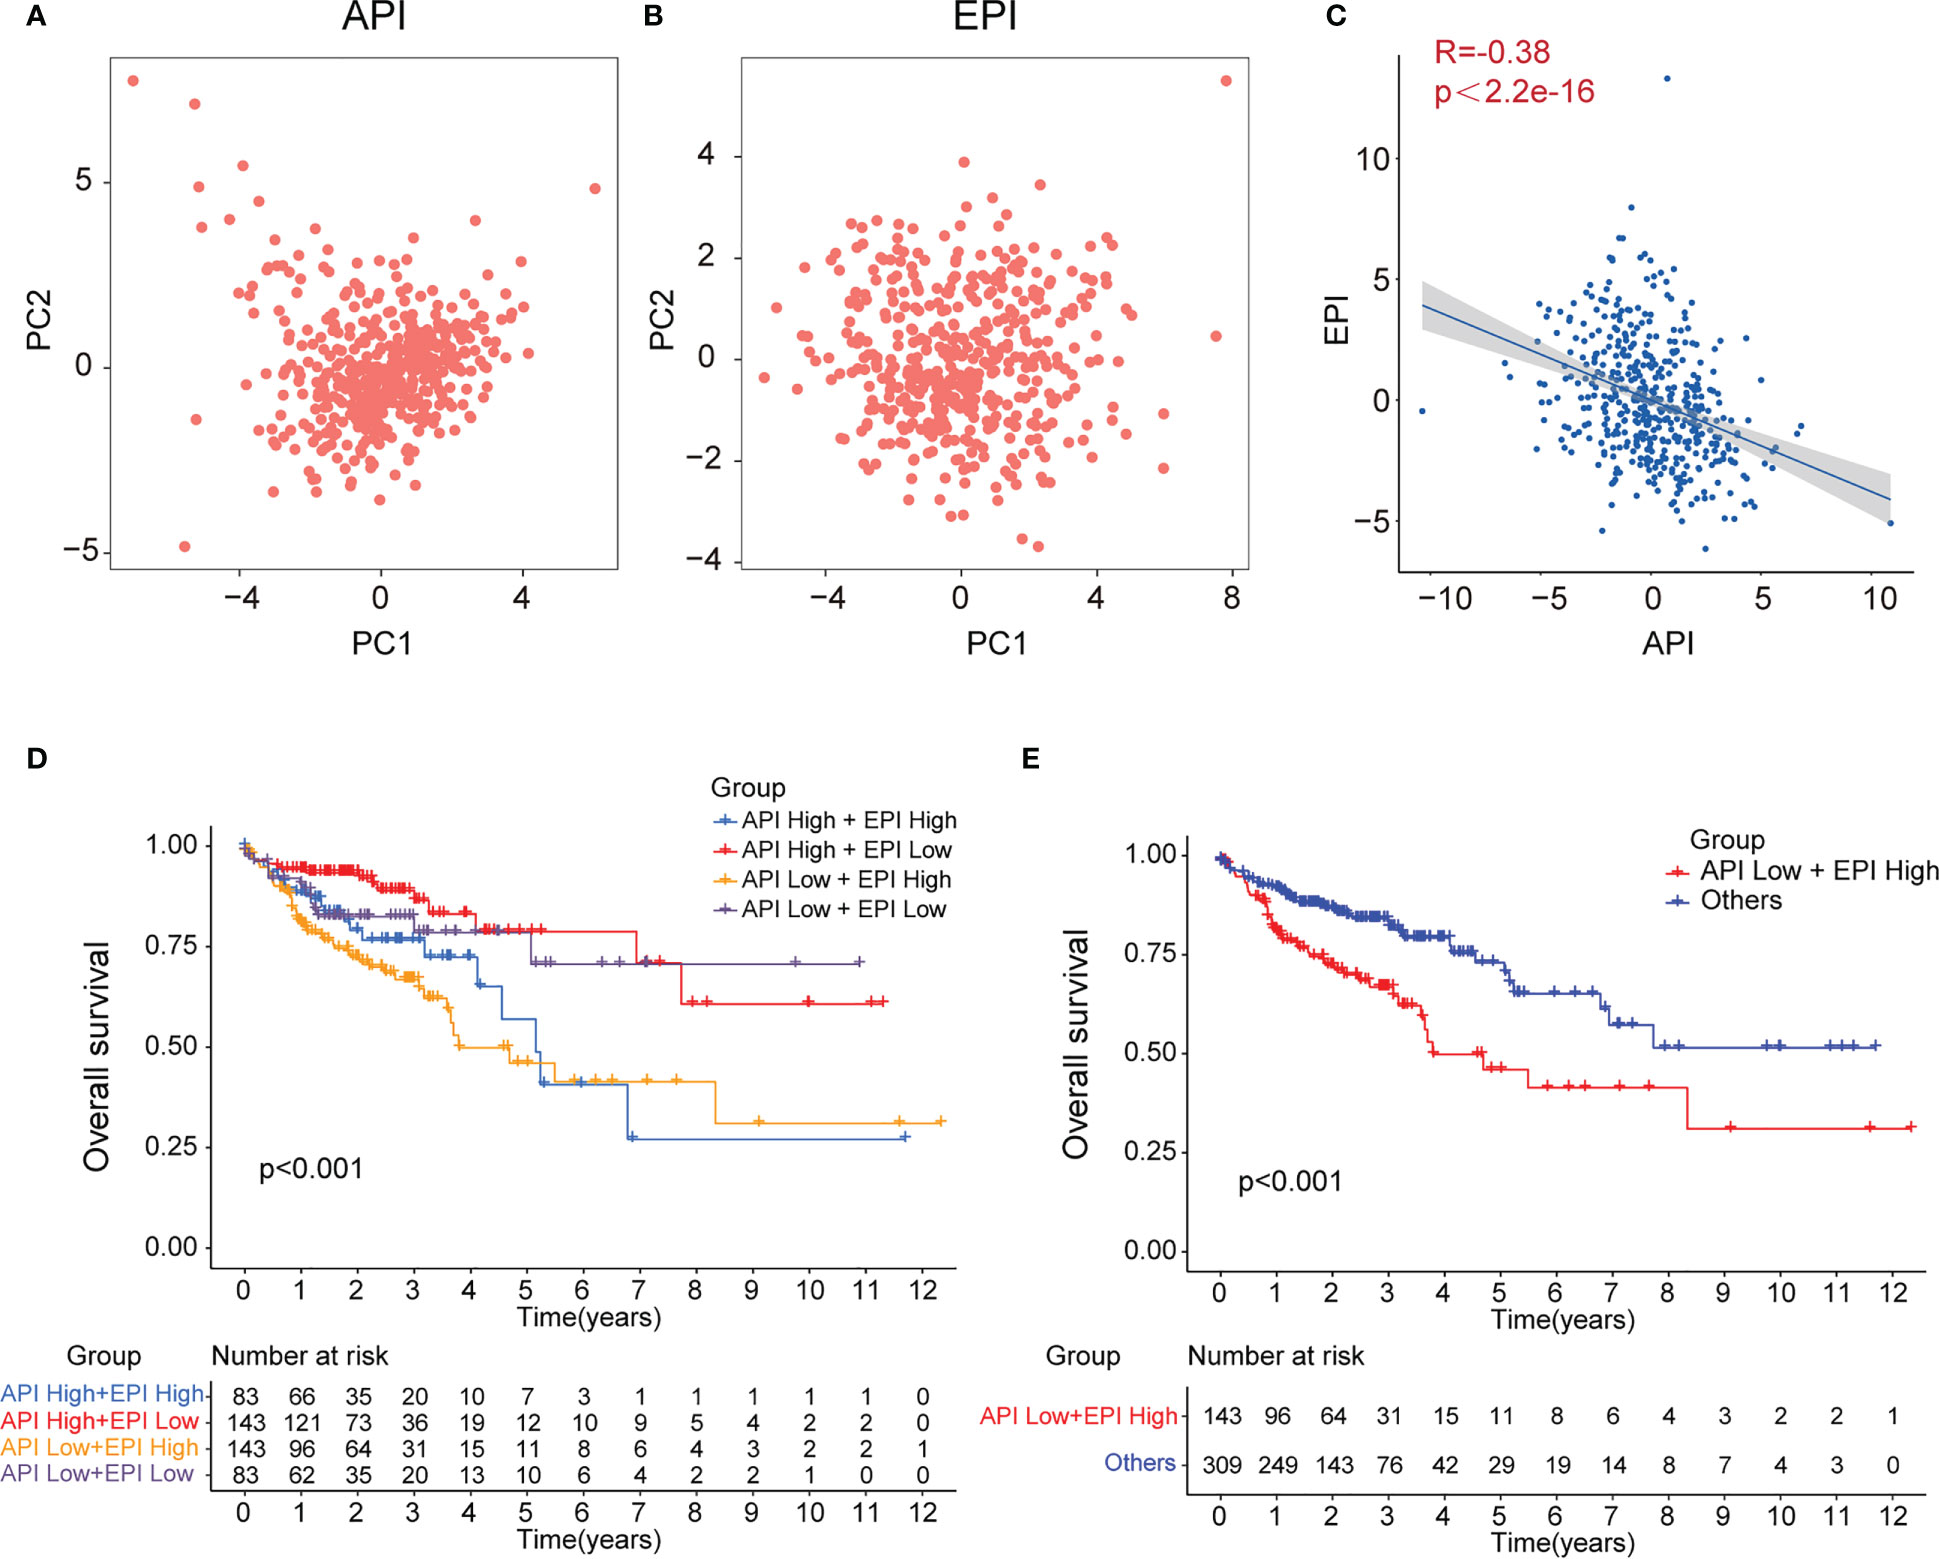
Figure 3 Construction of API and EPI with negative correlation. PCA analysis of 11 prognostic anoikis-related genes (A) and 12 prognostic EMT-related genes (B). (C)Scatter plot showing the spearman correlation of API and EPI. The KM plot showing overall survival in 4 groups (D) and two newly defined groups (E).
Enrichment analysis of DEGs in the ‘API Low + EPI high’ and ‘the others’ group
Subsequently, the DEGs in the API Low + EPI High group were analyzed and compared to the others groups. Based on the criterion of |FC| > 1.8, 70 DEGs were screened, and a volcano map was plotted (Figure 4A) using the clustering heat map (Figure 4B). KEGG analysis that was drawn using the barplot indicated that the DEGS in the two groups were primarily enriched in “Focal adhesion”, “Viral protein interaction with cytokine and cytokine receptor”, “ECM-receptor interaction”, “NF-κB signaling pathway,” “IL-17 signaling pathway”, “Chemokine signaling pathway”, “Cytokine-cytokine receptor interaction”, and “PI3K-Akt signaling pathway” (Figure 4C). GO analysis plotted by chord diagram suggested a major difference in molecular functions (MF), biological process (BP), or cellular components (CC) in both groups. The DEGs were mainly enriched in “collagen fibril organization”, “extracellular matrix organization”, “extracellular structure organization”, “antimicrobial peptide-mediated antimicrobial humoral immune response”, “external encapsulating structure organization”, “humoral immune response”, “antimicrobial humoral response”, and “wound healing” (Figure 4D). The GSEA enrichment analysis between the two groups was described using multiple GSEA diagrams based on the following filtering criteria: FDR<0.25 and NOM P<0.05 (Figure 4E). The top five functions that were enriched in the API Low+EPI High group were “Asthma”, “ECM-receptor interaction”, “Glycosaminoglycan biosynthesis”, “Protein digestion and absorption” and “Systemic lupus erythematosus”. The five leading functions enriched in the others group were recorded to be “Ascorbate and alternate metabolism”, “Fatty acid degradation”, “Nitrogen metabolism”, “Pentose and glucuronate interconversions,” and “Protein export”.
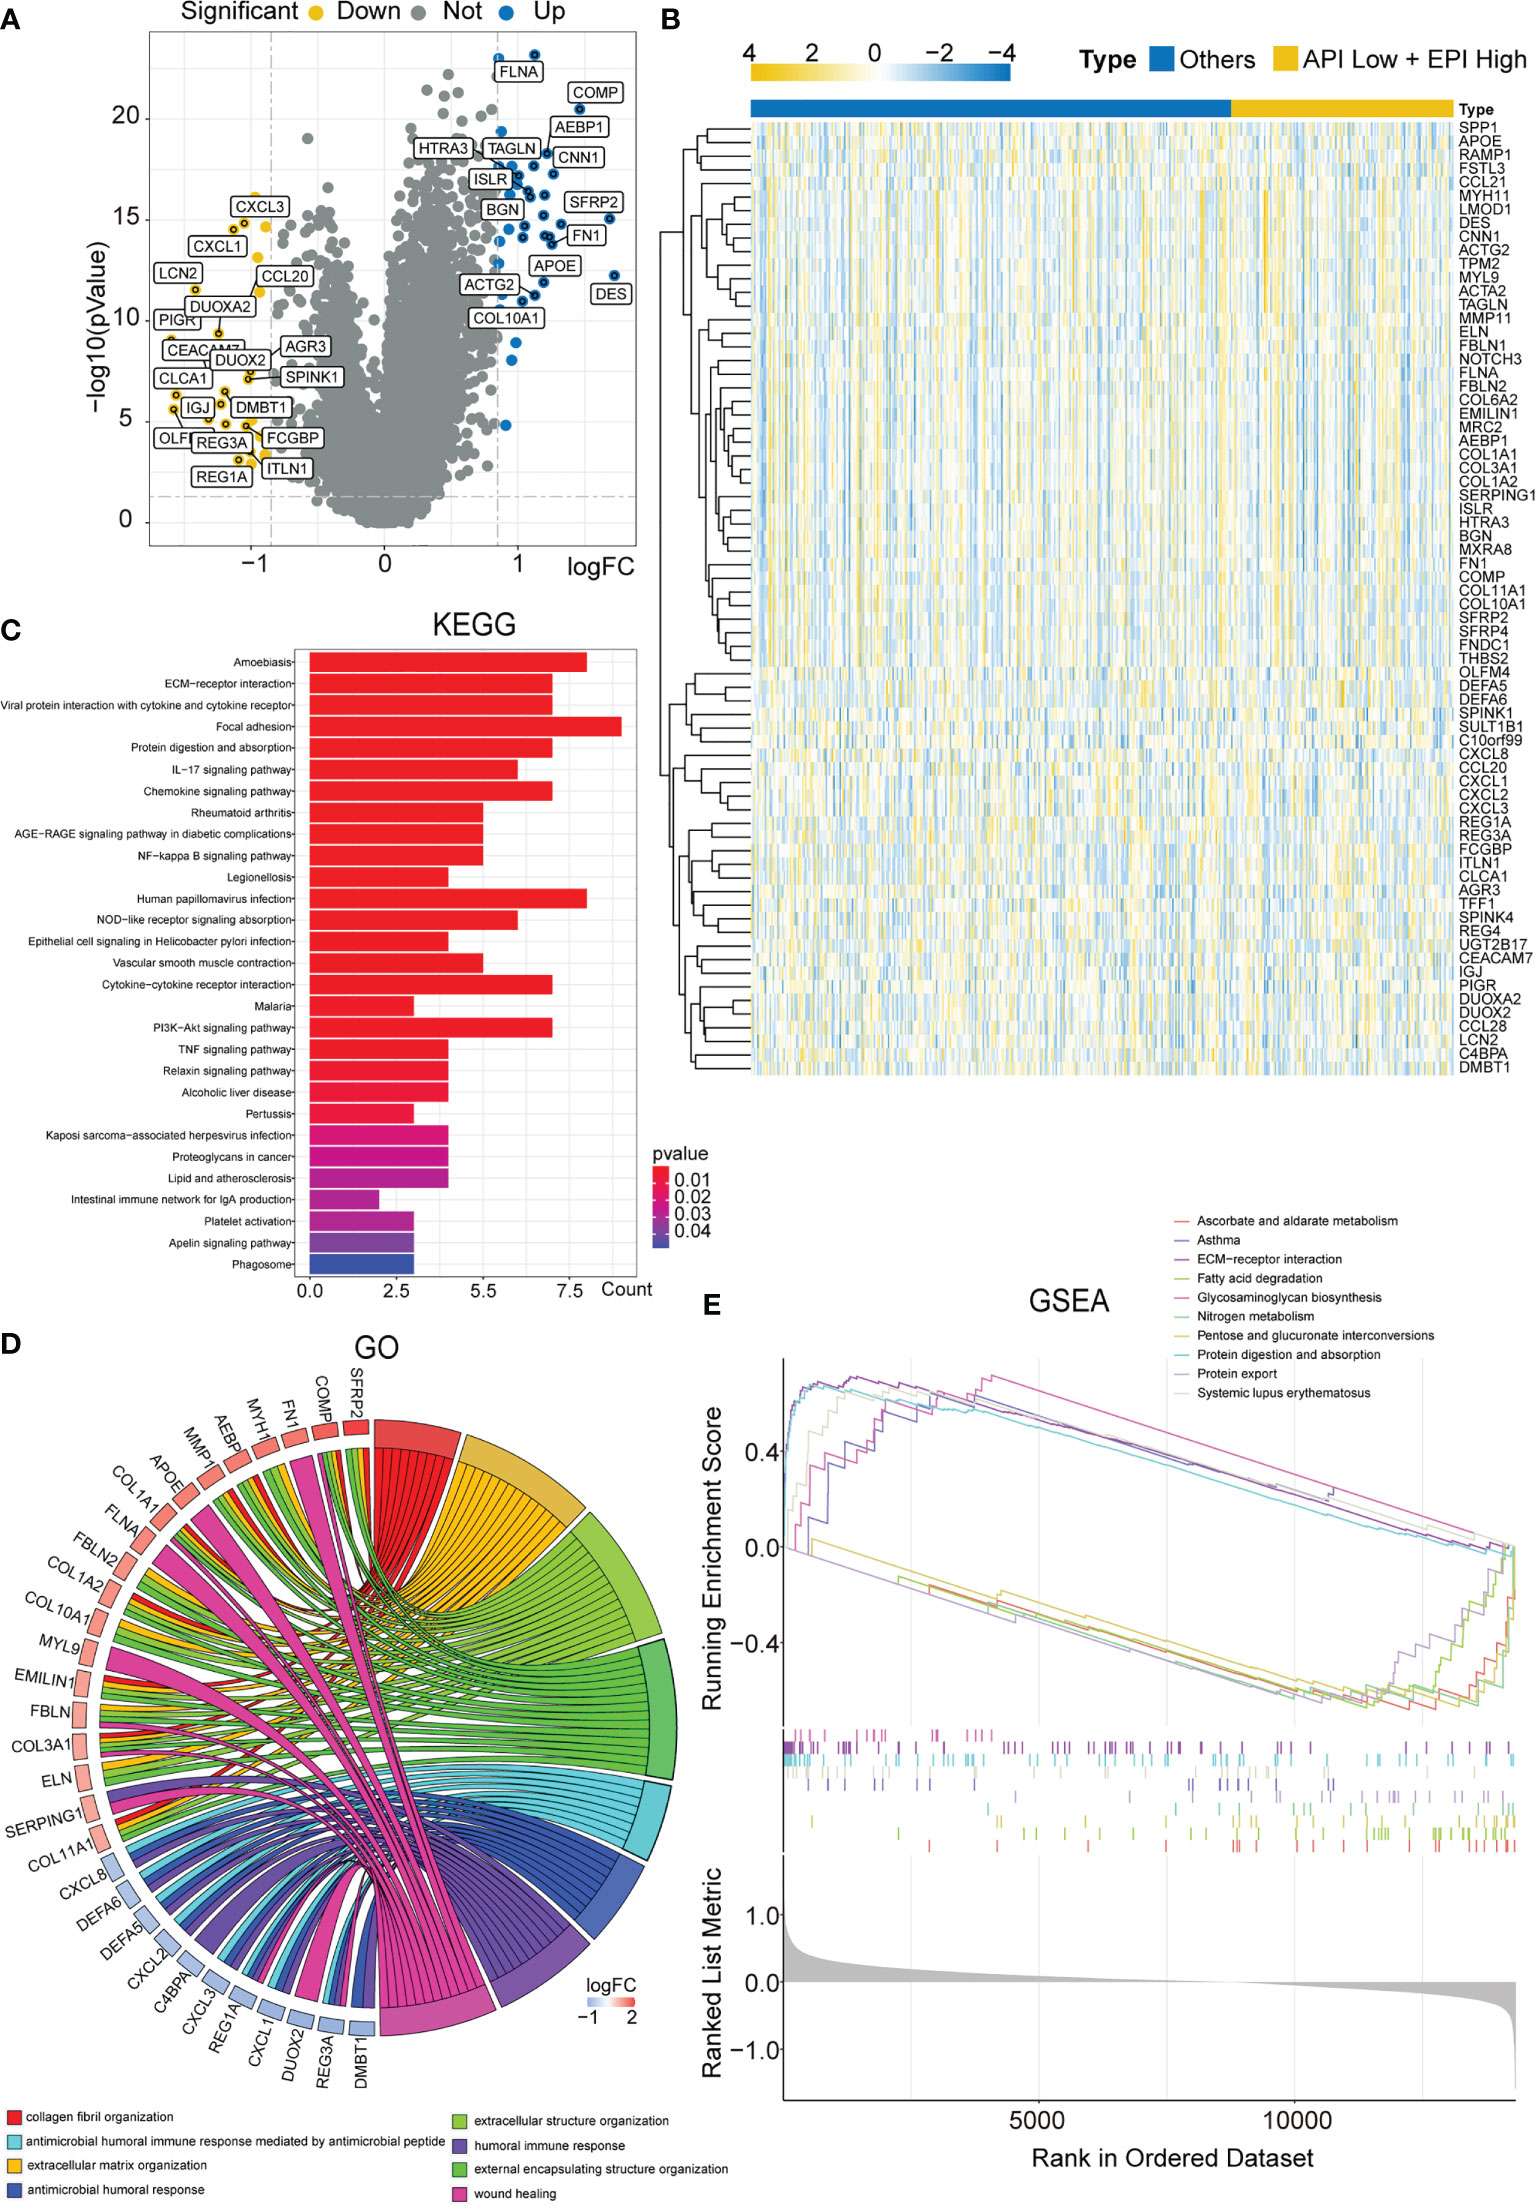
Figure 4 Enrichment analysis of DEGs in the ‘API Low + EPI high’ and ‘others’ group. (A)Volcano plots displaying the DEGs between two groups. (B) Heatmap created by the DEGs between two groups. The results of KEGG and GO enrichment analysis of the DEGs between two groups showing by barplot (C) and chord diagram (D). GSEA results illustrating ten significant enrichments of KEGG in two groups.
Construction of the prognostic ARGs and ERGs (PAEG) risk model, PCA analysis, and survival analysis of clinicopathological parameters
To construct a risk model for COAD patients based on anoikis and EMT, the 12 prognosis-associated ARGs and 11 prognosis-associated ERGs were combined, and the 23 genes were then subjected to Lasso regression analysis (Figure 5A, B). The corresponding coefficient criterion was evaluated by 1,000-fold cross-validation. the optimal penalty parameter lambda was determined, and the corresponding coefficient criterion was calculated depending on a minimum criterion. Lastly, a three-mRNA (NAT1, PCOLCE2, CDKN2A) prognostic risk model was constructed. The risk score was calculated using the following formula: risk score = (-0.135312062940216 ×NAT1 expression) + (0.178733977096469 × PCOLCE2 expression) + (0.0267778987311829 ×CDKN2A expression). The COAD patients were classified into high-risk or low-risk groups depending on risk score values. Then, the GSE17536 data set was selected as the test set for verification, whereas the TCGA data set (n = 452) was chosen as a training set. The risk curve, scatter plot, and risk heat maps were used for highlighting the relationship between the survival time, risk score, and abundance of three genes in COAD patients, determined using the training (Figure 5C) and test sets (Figure 5D). The results of the prognostic analysis revealed that high-risk patients exhibited a short survival duration compared to the low-risk patients in the training (p<0.001) (Figure 5E) and test sets (p=0.006) (Figure 5F). Furthermore, ROC curves were used for characterizing the specificity and sensitivity of the risk model. For the 1-, 3-, and 5-year risk scores, the area under the ROC curve (AUC) values in the training set were 0.658, 0.684, and 0.680 (Figure 6A), respectively, whereas the test set’s corresponding values were 0.655, 0.633, and 0.634 (Figure 6D). Also, the Rtsne package and ggplot2 packages were employed for plotting the t-SNE analysis images from the training set (Figure 6B) and test set (Figure 6E), independently. The scatterplot3d program was utilized to capture the 3D images of the PCA analysis of the training (Figure 6C) and test sets (Figure 6F). The above findings highlighted the fact that the high- and low-risk patients showed a favorable heterogeneity in the training and test sets. Finally, the COAD patients were sub-classified in the training set depending on their clinical traits (such as gender, Stage, age, and TNM stage), and the survival durations of high- and low-risk patients were compared after subclassification. The KM curves revealed that a few of the subgroups such as age (both ≤ 65 and >65), gender (male and female), M0 (patients with no distant metastasis), N0 or N 1-2 (patients with or without lymph nodes metastasis), stage III-IV, and T 3-4 (Figure 6G) showed a significant survival duration (P< 0.05).
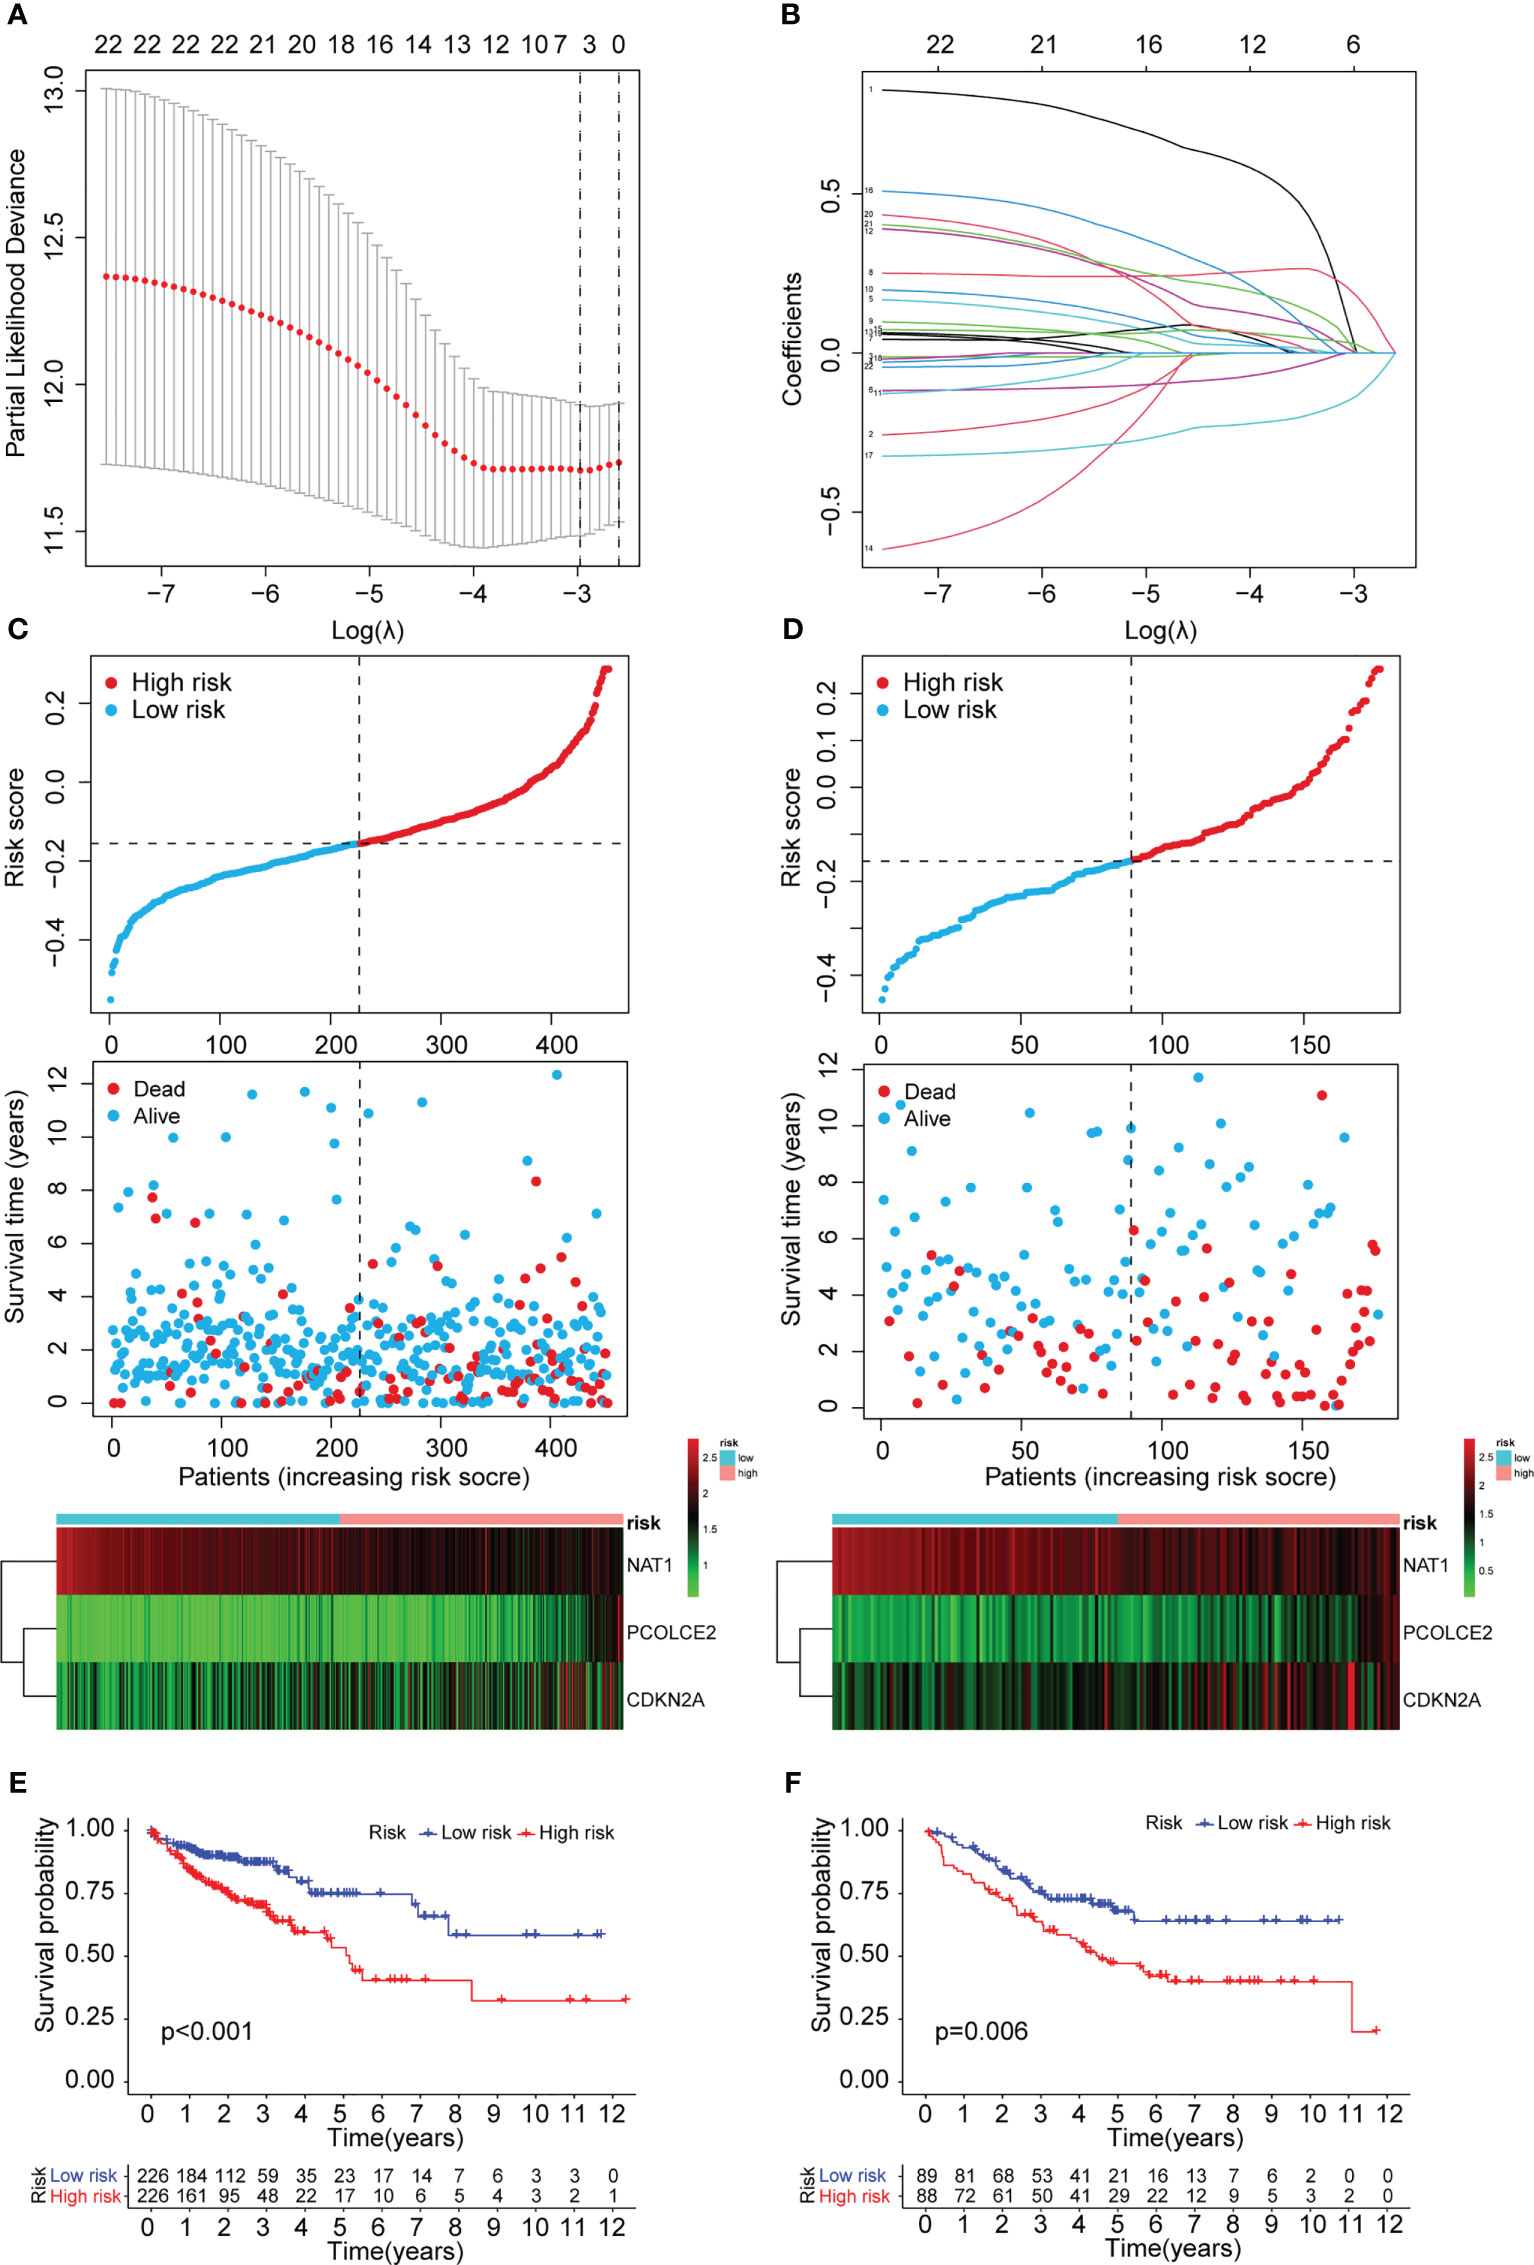
Figure 5 Construction of the prognostic ARGs and ERGs (PAEG) risk model. (A) 1000 cross-validation to determine the optimal penalty parameters lambda. (B)Lasso regression of the 11 prognostic anoikis-related genes and 12 prognostic EMT-related genes. Scatter plot showing risk score distribution of high-risk and low-risk and the relationship between survival time and risk score based on the training set (C) and test set (D). KM plot showing overall survival in training set (E) and test set (F).
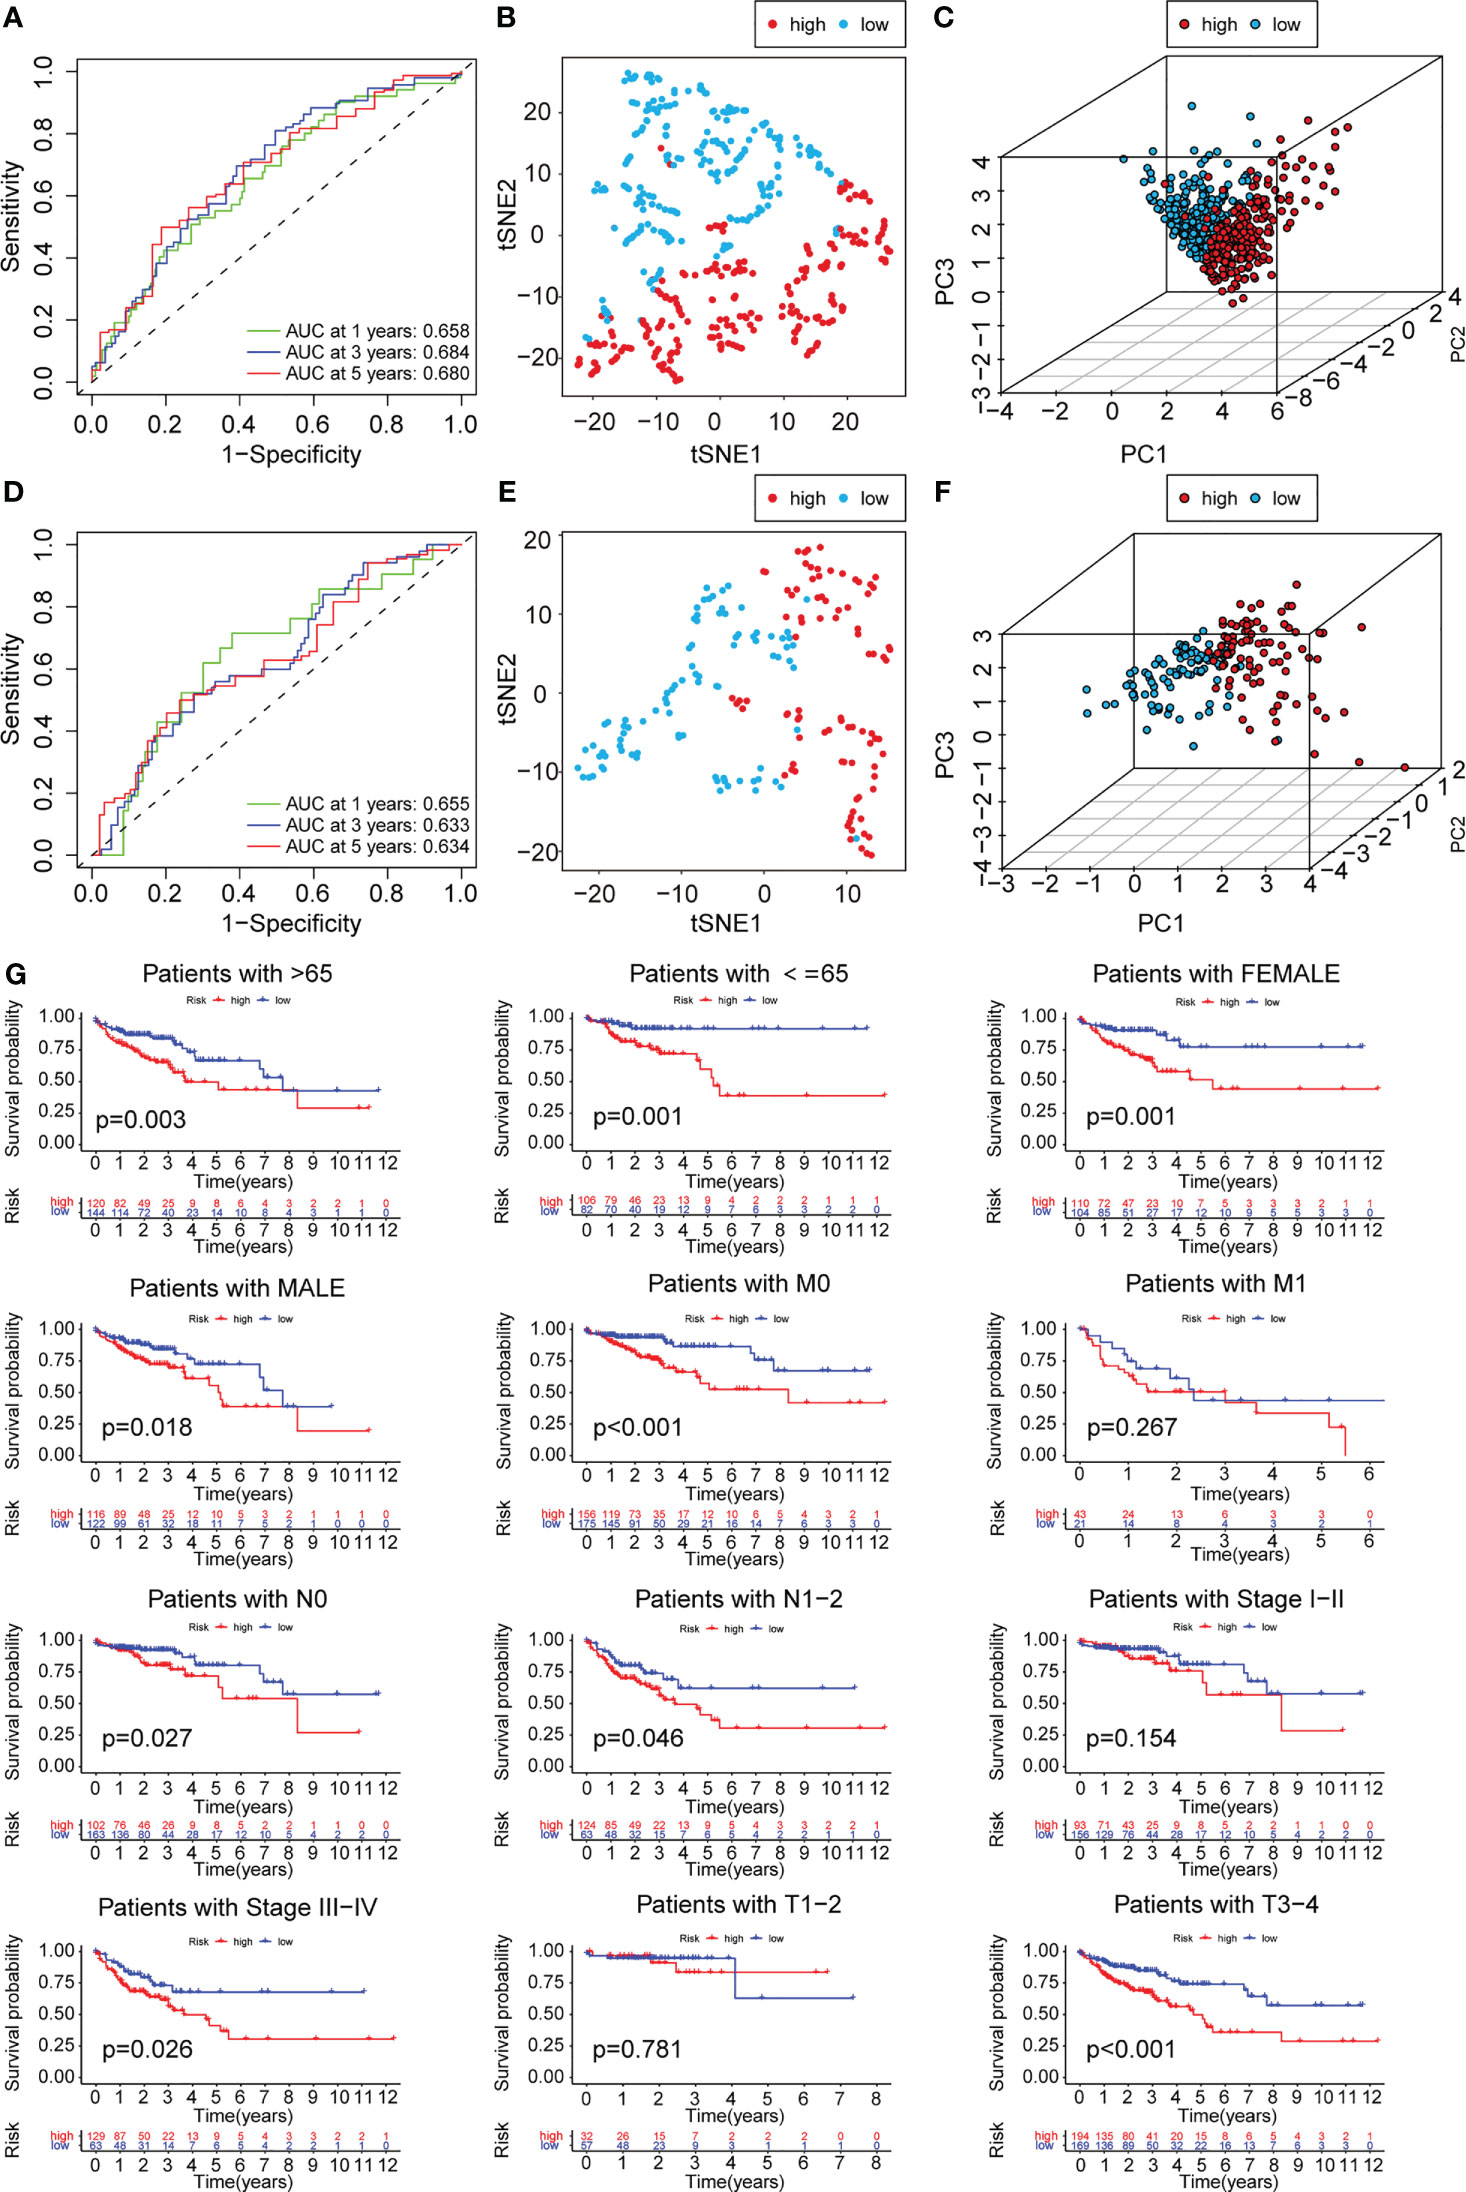
Figure 6 PCA analysis and survival analysis of clinicopathological parameters. The 1-,3- and 5-year ROC curve of risk score in training set (A) and test set (D). The t-SNE analysis of training set (B)and test set (E). The 3D scatter plot of PCA results of training set (C) and test set (F). (G) KM plot in subgroups including gender, age and tumor stages.
Cox regression analysis and nomogram development
In this study, univariate and multivariate Cox regression analyses were carried out to determine if the risk model could serve as an outstanding independent prognostic signature. The findings of the univariate Cox regression analysis implied that some factors like age, T stage, M stage, N stage, and risk score were significantly and positively related to OS in the training set (Figure 7A). Furthermore, a strong and positive relationship was observed between the risk score, grade, and OS in the test set (Figure 7C). On the other hand, the multivariate regression analysis of the significant factors involved in the univariate analysis indicated that characteristics such as age, M stage, T stage, and risk score in the training set were significantly linked to OS (Figure 7B), while risk score and grade in the test set were significantly and positively related to OS (Figure 7D). The aforementioned findings demonstrated that the risk prediction model was an effective and independent predictor that outperformed clinical factors such as age and TNM stage.
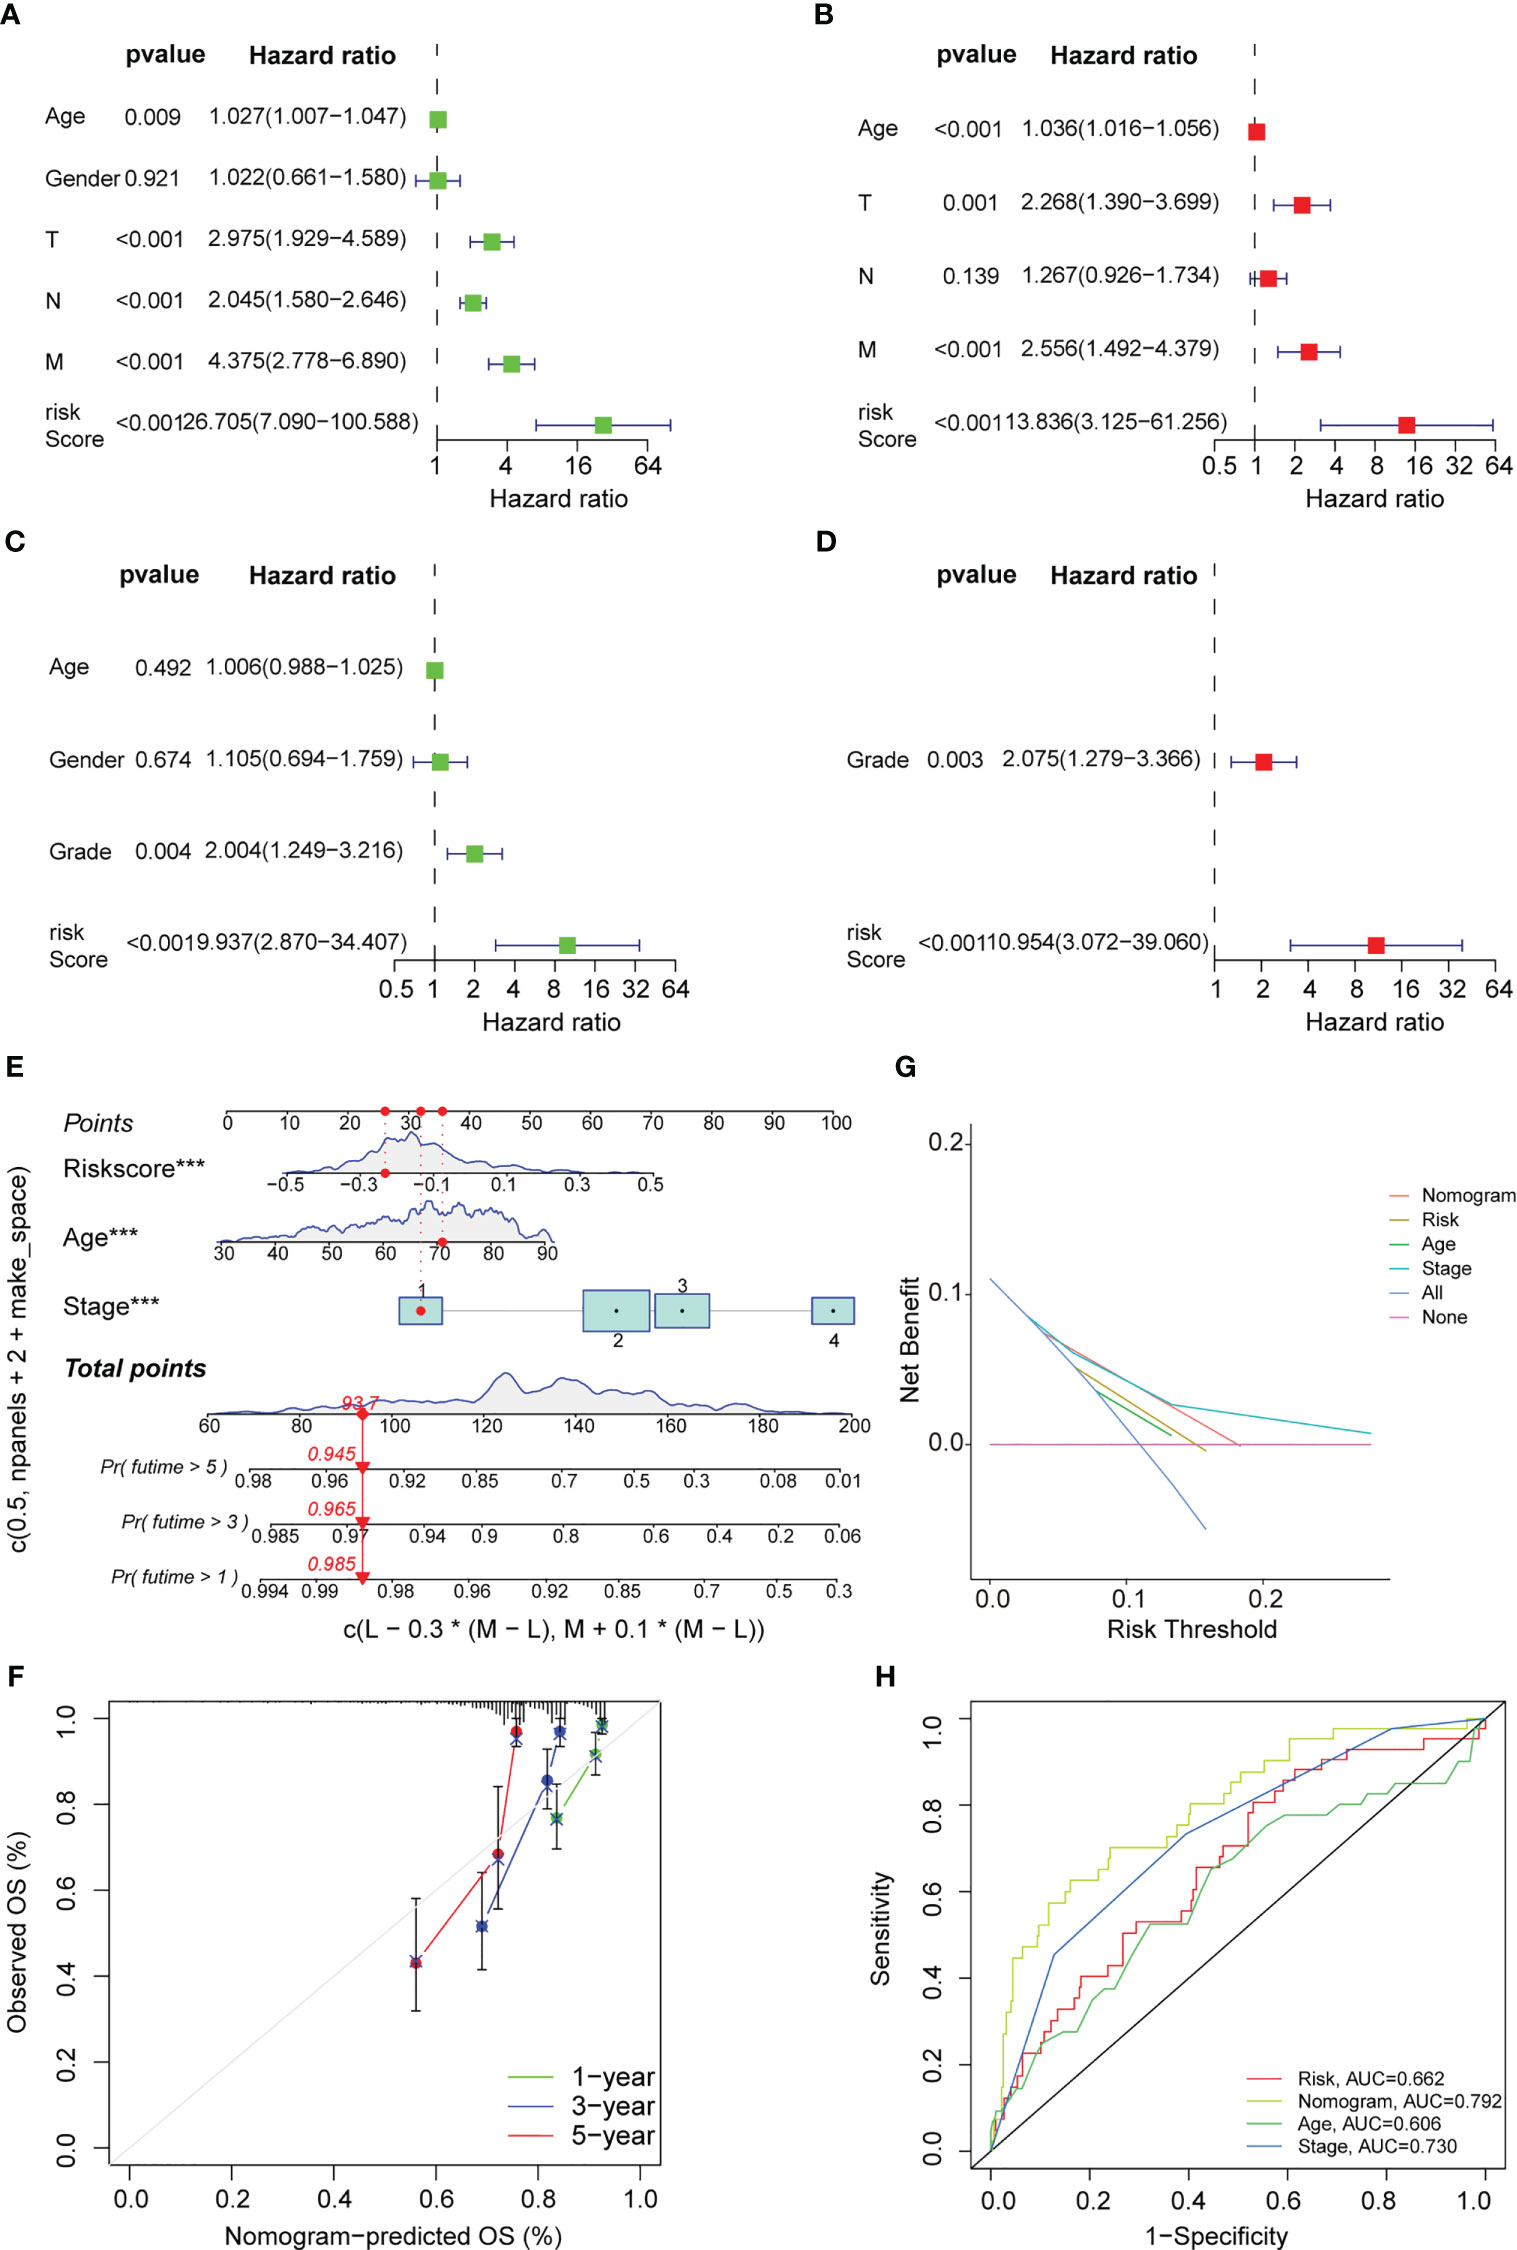
Figure 7 Cox regression analysis and nomogram development. Univariate Cox regression analysis displaying the association between patients’ overall survival and clinicopathological parameters along with the PAEG risk score in training set (A) and test set (C). Multivariate Cox regression analysis revealing independent prognostic factors in training set (B) and test set (D). (E) Nomogram depending on the PAEG risk score and other clinicopathologic feature predicting the 1 -, 3 - and 5-year overall survival for COAD patients. (F) Calibration curves uncovering the consistency between predicted and observed 1-, 3- and 5-year overall survival rates in COAD patients based on the nomogram. DCA curve (G) and ROC curve (H) of nomogram, risk and other clinicopathologic feature in COAD.
Thereafter, based on the above findings, a nomogram was developed in this study, which included factors like stage, age, and risk score (Figure 7E). Also, calibration curves were plotted for the nomogram, where the results indicated that all three calibration curves (1-, 3-, and 5-year) were close to the standard curve, thus demonstrating an acceptable predictive effect (Figure 7F). The DCA curve indicated that the nomogram was much more beneficial than the extreme curves (Figure 7G). The ROC curves indicated that AUC values for the nomogram, age, risk, and stage were 0.792, 0.662, 0.606, and 0.730, respectively (Figure 7H). The nomogram curve exhibited a greater AUC value compared to the risk score curve, age curve, and stage curve, suggesting that the nomogram was a better predictor of prognosis.
Immune infiltration analysis, MCP counter, and drug sensitivity of the PAEG risk model
Earlier studies have shown that the TME was linked to COAD distant metastasis, immunotherapy response, and drug sensitivity (22–24). The content of stromal cells present in the TME is indicated by the stromal score. The immune score indicates the content of immune cells in the TME. The high-risk patients showed higher stromal cell levels (Figure 8A), however, no remarkable difference was observed in the proportion of immune cells between the low- and high-risk groups (Supplementary Figure 2A). A higher tumor purity is linked to a better prognosis as it indicates the proportion of tumor cells present in the tissue. The tumor purity was higher in the low-risk group (Figure 8B). TIDE scores were used to assess the potential of tumor immune infiltration in the gene expression profile of the malignant samples and could anticipate the response to the immune checkpoint blockade therapy. The high-risk patients showed enhanced expression of the cytotoxic T lymphocyte (CTL) exclusion, cancer-associated fibroblasts (CAF), and CTL dysfunction (Figure 8C). The ssGSEA technique was then used to investigate the infiltration status of 16 immune cells and derive the scores of 13 immunological functions to further assess the relationship between immune infiltration and the risk model. The low-risk patients displayed a higher infiltration of CD8+ T cells, Th1 cells, B cells, Th2 cells, and Treg cells as well as higher immunological functions like APC_co_inhibition and Cytolytic_activity. On the other hand, the high-risk patients displayed a higher infiltration level of macrophages and immunological functions like Type_II_IFN_response in the training set (Figures 8D, E). In the test set, the low-risk group displayed higher immunological functions such as Check-point, Cytolytic_activity, APC_co_inhibition, HLA, T_cell_co_inhibition, Inflammation-promoting, and T_cell_co_stimulation. They also showed a higher infiltration level of aDCs, B cells, Neutrophils, TILs, iDCs, Th2 cells, Th1 cells, CD8+ T cells, and Treg cells (Figure 8F, G). Then, the MCPcounter software was used for comparing the contents of 10 immune and stromal cells in the two groups. The high-risk group contained a higher number of endothelial cells and fibroblasts, whereas the low-risk group contained more B lineage, cytotoxic lymphocytes, and NK cells (Figure 9A, Supplementary Figure 2B). Also, 10 common immune checkpoint molecules and 24 major histocompatibility complex (MHC) molecules in the high- and low-risk groups were evaluated, and no remarkable differences were noted (Supplementary Figure 2C, D).
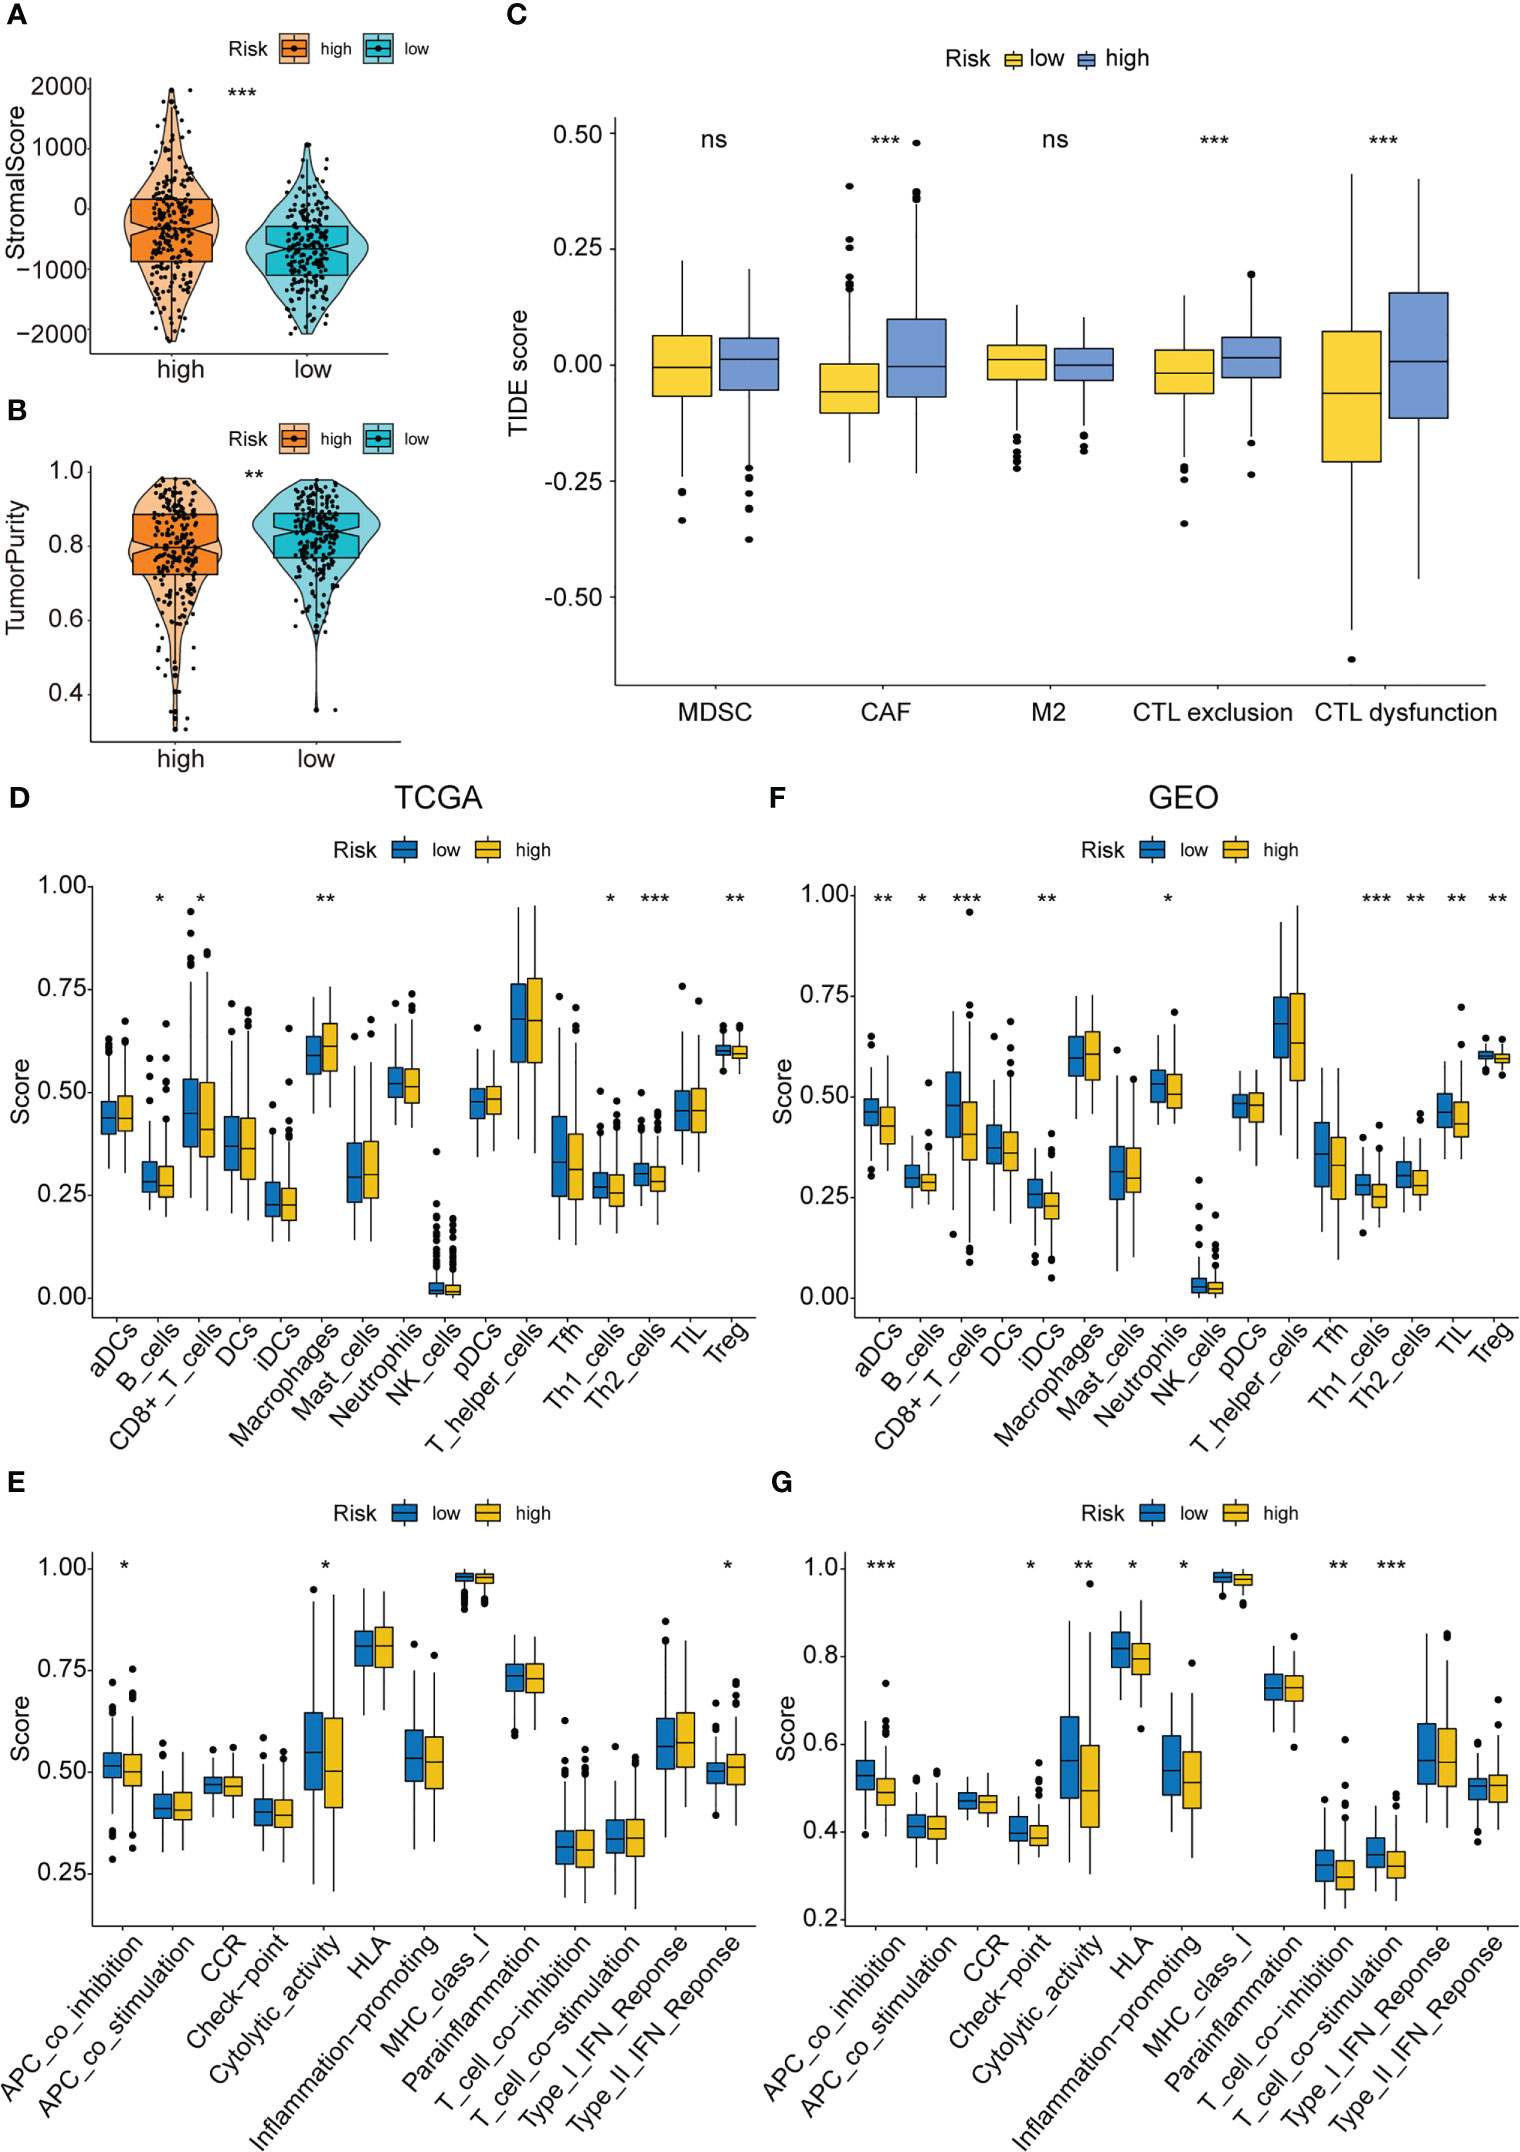
Figure 8 Immune infiltration analysis of the PAEG risk model. (A, B) The violin and box plot displaying the difference of the stromal score and tumor purity in two groups. (C) TIDE analysis showing the difference of tumor immune dysfunction and exclusion in two groups. The infiltrating levels of 16 immune cell types in training set (D) and test set (F) estimated by ssGSEA. The infiltrating levels of 13 immune functions in training set (E) and test set (G) estimated by ssGSEA. ns means p>0.05, *p< 0.05, **p< 0.01, and ***p< 0.001.
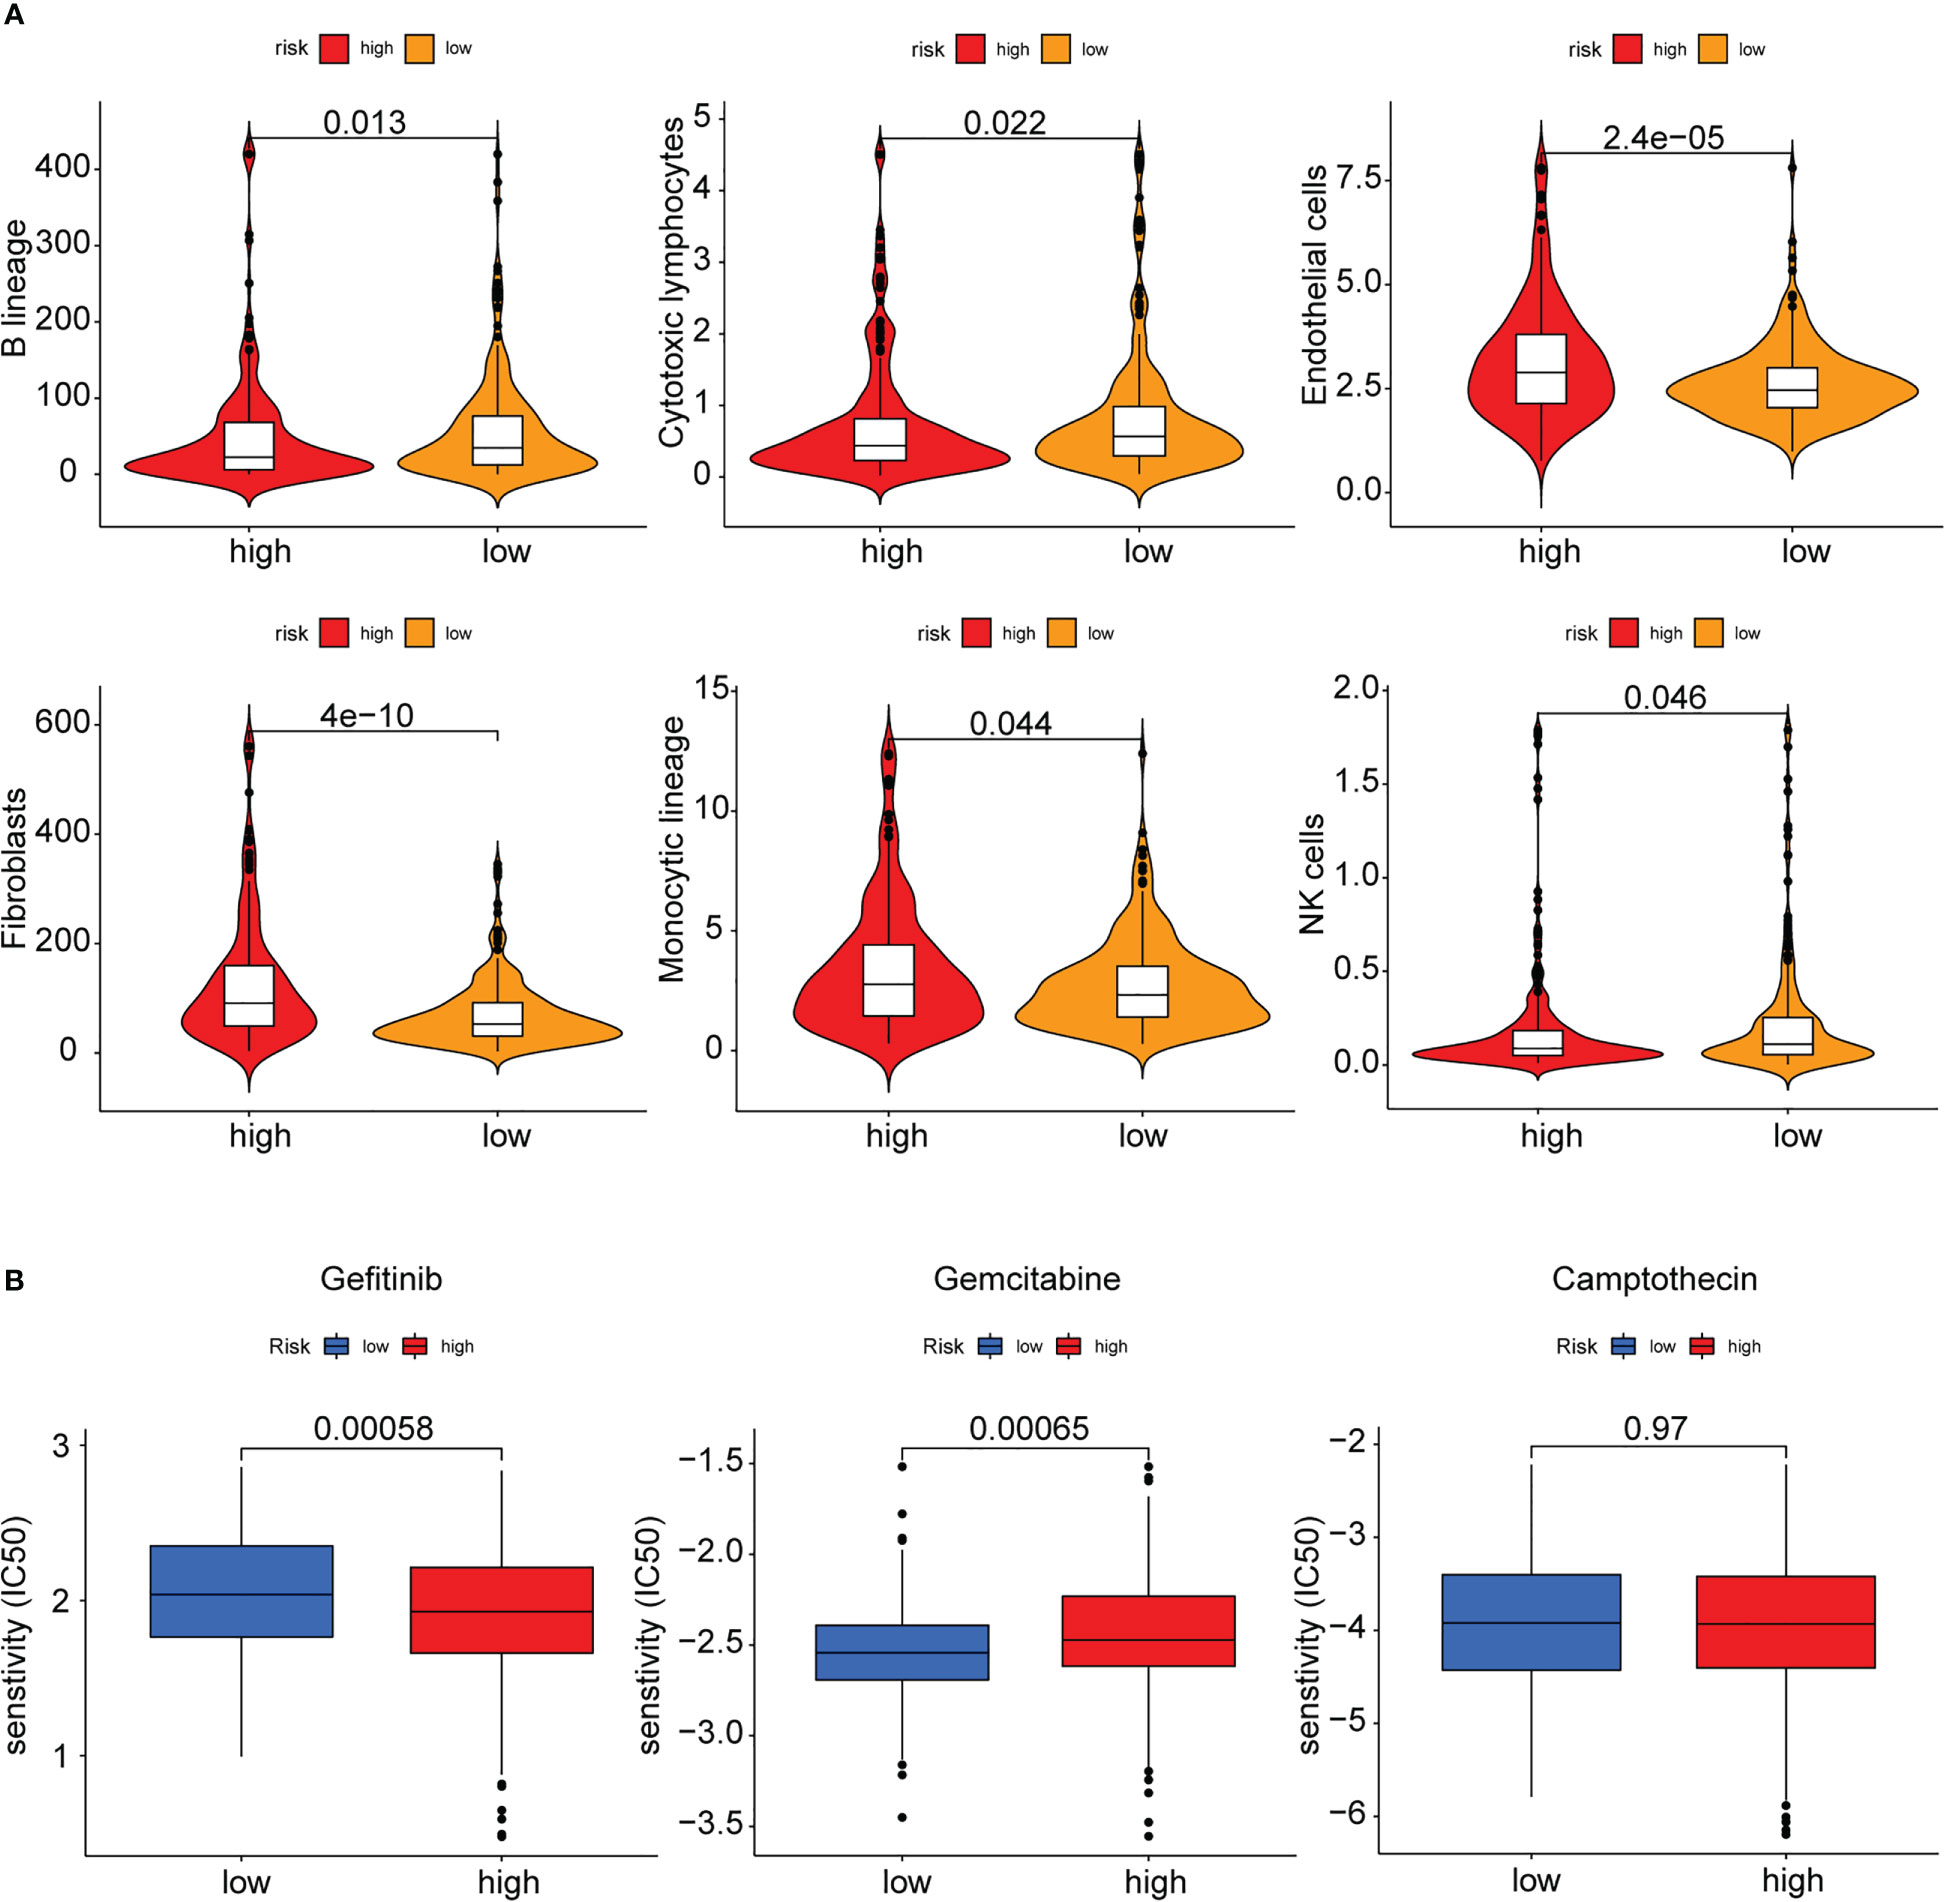
Figure 9 MCPcounter and drug sensitivity analysis of low-risk and high-risk group. (A) The violin diagram showing the abundance of 6 types of differentially expressed immune and stromal cells between two groups using MCPcounter. (B) Sensitivity difference of three common chemotherapeutic drugs in two groups.
Finally, the sensitivity of the high- and low-risk patients to the common therapeutic drugs used in COAD was evaluated, and the findings implied that the high-risk patients showed a higher sensitivity to gemcitabine, while the low-risk patients showed a higher sensitivity to gefitinib. Both groups showed no difference in their sensitivity to camptothecin (Figure 9B).
Validation of PAEG in the risk model in cell and tissue experiments
In this study, the anoikis-resistant COAD cell lines such as HCT-116 and DLD-1 were constructed. Then, the mRNA expression levels of NAT1, CDKN2A, and PCOLCE2 in the parental and anoikis-resistant groups were detected separately by means of qPCR. The findings of this experiment indicated that the NAT1 mRNA expression level was decreased, whereas the CDKN2A and PCOLCE2 mRNA expression levels were elevated in the anoikis-resistant group, which led to the conclusion that NAT1 could facilitate anoikis, while CDKN2A and PCOLCE2 were responsible for anoikis resistance (Figure 10A). Considering the significant role of PAEGs in the distant metastasis of COAD, four cases of primary COAD tissues without distant metastasis, with liver metastasis, and with lung metastasis were selected, respectively, to detect the protein expression levels of the above-mentioned three genes by IHC. An earlier study showed that Claudin-1 could attenuate E-cadherin expression in colorectal cancer by upregulating ZEB-1, which, in turn, promoted EMT and reduced anoikis (13). Also N-cadherin is one of the key markers of EMT. Hence, Claudin-1 and N-cadherin were used as references and compared to the three PAEGs. The results implied that the NAT1 protein expression level was elevated in the tissues without distant metastasis compared to the tissues with liver and lung metastasis, whereas the CDKN2A and PCOLCE2 protein expression levels were increased in the tissues with liver and lung metastasis. The above findings indicated a positive correlation between high anoikis resistance, high EMT, and more distant metastasis of COAD (Figure 10B).
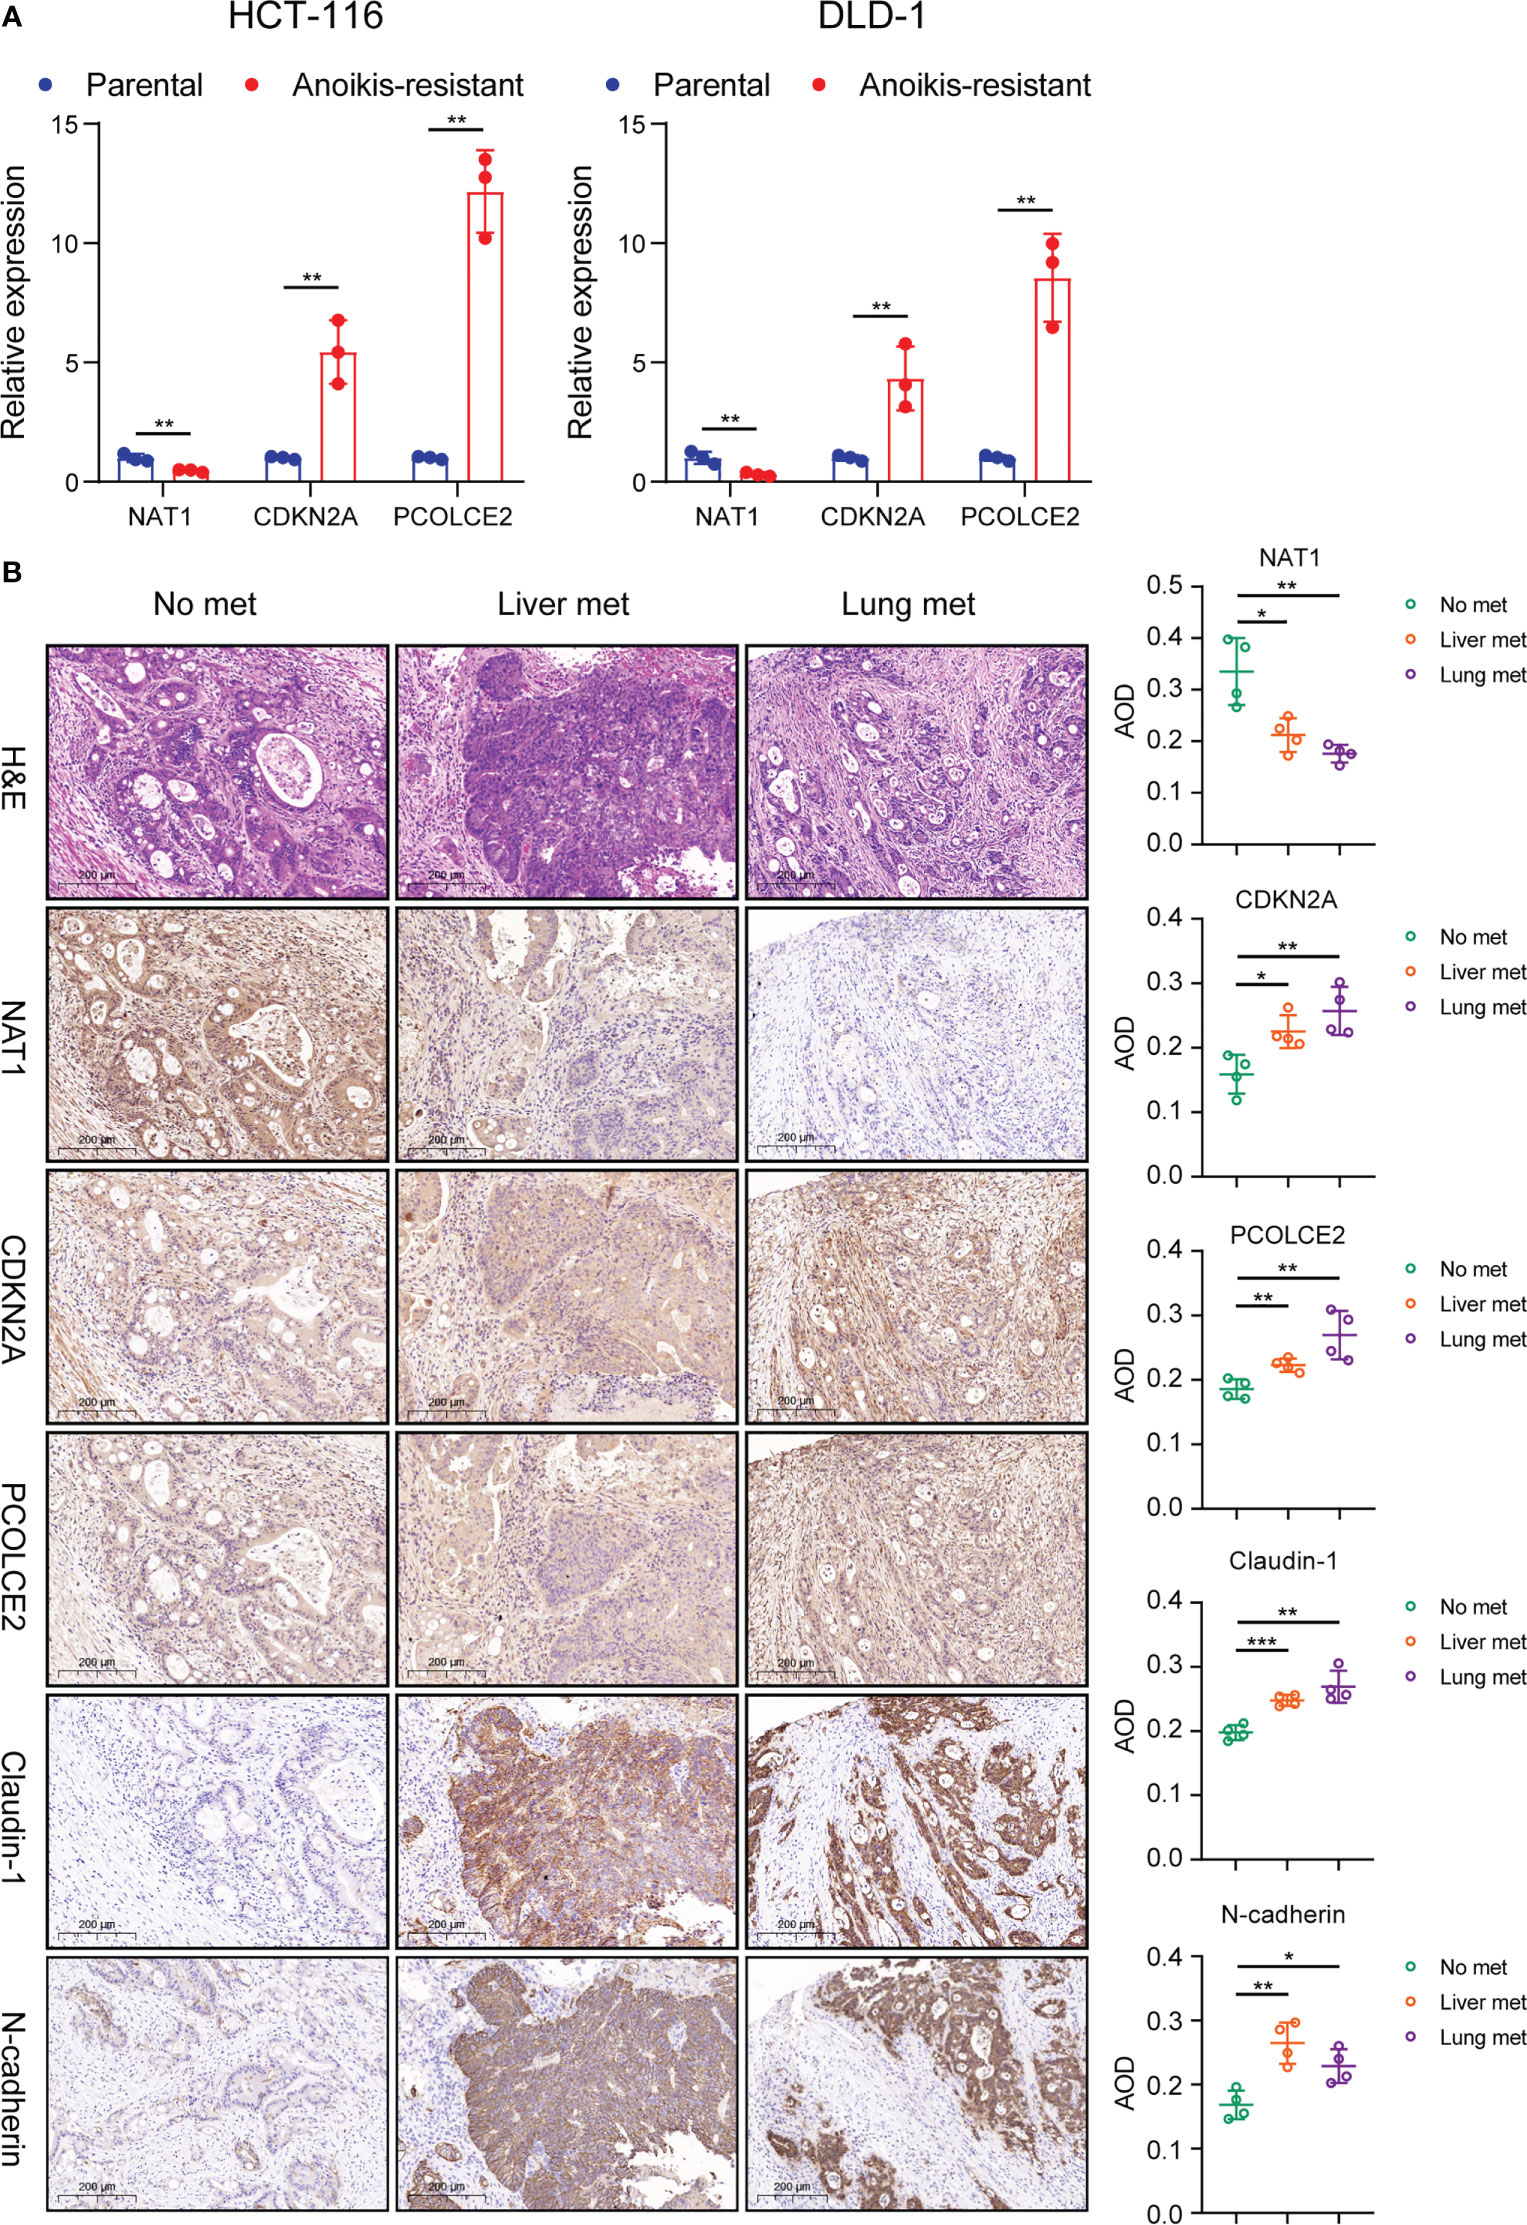
Figure 10 Validation of PAEG in the risk model in cell and tissue experiments. (A) Relative expression of NAT1, CDKN2A and PCOLCE2 in the parental and anoikis-resistant groups by qPCR. (B) The protein expression of NAT1, CDKN2A, PCOLCE2, Claudin-1 and N-cadherin in the primary tumor in the no distant metastasis group (n=4), liver metastasis group (n=4) and lung metastasis group (n=4) were detected by IHC (scale bars, 200 μm.) and the AOD values were expressed as scatter plots. *p< 0.05, **p< 0.01, and ***p< 0.001.
Discussion
Distant metastases severely limit the prognosis of COAD patients. Although current therapeutic approaches are more mature, a recent meta-analysis suggested that median recurrence-free survival was 1.3 years after resection of colorectal liver metastases (25). A high recurrence rate is an important cause of death for COAD patients. Most patients with distant metastases are not detected during the initial diagnosis and suffer a worse prognosis. Therefore, it is essential to investigate techniques that help in preventing distant metastasis of COAD. According to existing research (26, 27), the first step of distant metastases of COAD involves the invasion of tumor cells into the stromal environment. Both anoikis and EMT play important roles in inhibiting and promoting invasion during this phase; therefore, an in-depth study of the crosstalk between anoikis and EMT can help uncover key genes involved in distant metastasis.
In this study, API and EPI were quantified for determining the anoikis and EMT levels in COAD, using the PCA technique, and the group that showed the worst survival curve (i.e., the API Low + EPI High group) was isolated. This was in agreement with an earlier finding that anoikis repressed metastasis and EMT promoted metastasis (28, 29). This is the first study that used this technique for clustering COAD patients, and a favorable prognostic difference presents the rationality and effectiveness of this type of grouping technique, which needs to be further analyzed and experimentally validated.
Next, a risk model was developed using three genes: NAT1, CDKN2A, and PCOLCE2. Arylamine N-acetyltransferase 1 (NAT1) was shown to catalyze the N- or O-acetylation of different arylamine and heterocyclic amine substrates and was observed to be involved in tumor progression and chemotherapy resistance (30). MicroRNA-6744-5p facilitated anoikis and targeted NAT1 in breast cancer cells (31). NAT1 expression levels also correlated with EMT status and metastatic behavior in breast cancer patients (32). Moreover, by interacting significantly with CDK4 and CDK6, the cyclin-dependent kinase inhibitor 2A (CDKN2A) functioned as a negative regulator of the proliferation of normal cells (33). CDKN2A also played a vital role in regulating the anoikis in hepatocellular carcinoma cells (34) and pancreatic cancer cells (35–38) and hence could serve as an anoikis-related signature gene to predict the prognosis of endometrial carcinoma patients (39). Meanwhile, CDKN2A may facilitate colorectal cancer cell metastasis through the induction of EMT and may be associated with the infiltration status of multiple immune cells (40, 41). Procollagen C-endopeptidase enhancer 2 (PCOLCE2) refers to a collagen-binding protein that binds to the C-terminal pro-peptide of types I and II procollagens and could enhance the cleavage of the pro-peptide by BMP1 (42). PCOLCE2 can be considered as an EMT-linked gene for anticipating the prognosis of gastric cancer patients (43, 44) and the metastasis ability of COAD (45). However, none of the studies determined the role of PCOLCE2 in anoikis. The risk model was used for categorizing the COAD patients into the high- and low-risk categories, and the OS duration of the patients with different clinicopathological parameters like gender, age, and stage was seen to be significantly different between both categories. The nomogram curve that was developed using the risk model was more sensitive and specific in reflecting the prognosis of COAD patients than age, stage, and risk model.
Furthermore, the stromal and immune infiltration analysis was carried out based on the risk model. The findings revealed that this risk model was associated with a few acquired immune cells like Th1 cells, Th2 cells, B cells, and Treg cells, and with the innate immune cells like lymphocytes, monocytes, and NK cells, but not with numerous MHC molecules and immune checkpoint genes. However, it showed a stronger correlation with stromal infiltrates such as CAF and endothelial cells. Anoikis resistance and EMT are related to cell adhesion and ECM remodeling, while stromal cells are involved in the composition and remodeling of ECM (46–49). Hence, the risk model can better reflect the differences in stromal cell distribution, and the specific molecular mechanisms deserve further investigation.
Lastly, our cell experiments confirmed the relationship between the expression of NAT1, CDKN2A, PCOLCE2, and anoikis, suggesting that NAT1 promoted anoikis while CDKN2A and PCOLCE2 contributed to anoikis resistance in COAD cells. IHC was used for verifying the link between these PAEGs and distant metastasis of COAD, and the results also suggested that the high NAT1 expression level was associated with no distant metastasis while the high CDKN2A or PCOLCE2 expression levels were related to hepatopulmonary metastasis. The above findings were in agreement with the findings of the univariate Cox analysis of these genes in TCGA.
This study has some limitations despite its superiorities. Firstly, we obtained the EMT signature containing 198 genes from the MSigDB portal in where some important genes of EMT such as ZEB1, ZEB2, SNAI1 are not included. This may bring some uncertainties, and a more complete database may yield better analysis results. Secondly, the ROC curves for the 1-year, 3-year, and 5-year risk scores were<0.7 in the training and test sets, indicating that the prediction rate was less accurate, and the risk model needs further improvement. Thirdly, after classifying the patients into the API Low + EPI High and the others group, the immune infiltration, stromal infiltration, and drug sensitivity rates in the two groups were determined by means of gene enrichment and DEG analyses. The ESTIMATE tool indicated no significant difference in the immune cell proportion between the low- and high-risk groups, it should be noted that the analysis did not include some important immune cells such as dendritic cells or NK cells. Fourthly, the study found no significant difference in the expression of 10 immune checkpoint molecules and 24 MHC molecules between the low- and high-risk groups, suggesting that the immune checkpoint blockade therapy response may not be affected by the risk model. Finally, the molecular mechanisms of the three PAEGs in anoikis and EMT need to be explored and validated by further in vivo and in vitro experiments. Additionally, the univariate Cox analysis of PCOLCE2 revealed that it is a poor predictive gene, although its expression is low in tumor tissues relative to normal tissue, which is an intriguing and paradoxical finding. More research is needed to determine its role and mechanism in colorectal cancer, as very few studies have investigated the role played by this gene. Hence, more research needs to be conducted to determine its role and mechanism in the future.
This is the first study that combines the anoikis and EMT analysis based on distant metastasis of COAD. Herein, a favorable molecular group and prognostic risk model was constructed, which can help to establish biomarkers and drug intervention targets for patients with distant metastasis. Moreover, drug sensitivity analyses were conducted in this study, which can provide some clinical drug references for these patients.
Conclusions
Collectively, based on the anoikis and EMT gene sets, the prognosis-related ARGs and ERGs were identified using univariate Cox analysis, and then PCA stratified analysis was used for categorizing the patients into two groups based on the greatest prognostic differences. A prognostic risk model was constructed, which showed good predictive sensitivity and specificity. This risk model was linked to the tumor microenvironment, especially stromal infiltration. Finally, the findings in this study could help in developing novel molecular biomarkers, therapeutic targets, and clinical medicines for treating patients with COAD metastasis.
Data availability statement
The original contributions presented in the study are included in the article/Supplementary Material. Further inquiries can be directed to the corresponding authors.
Ethics statement
The studies involving human participants were reviewed and approved by the Ethical Committee of The Affiliated Suzhou Hospital of Nanjing Medical University. The patients/participants provided their written informed consent to participate in this study.
Author contributions
JZhou, SYang, DZhu and HLi for the acquisition of data, analysis and interpretation of data, statistical analysis and drafting of the manuscript. XMiao, MGu, WXu, YZhang, WTang, JZha, RShen and JZhu for technical and material support. JZhou, ZYuan, and XGu for study concept and design, obtained funding and study supervision. All authors read and approved the final manuscript.
Funding
This work was supported by the Clinical study of the accurate laparoscopic surgical treatment of rectal cancer (Grant No. LCZX202111); the Key Medical Discipline Gastrointestinal Surgery of Suzhou (Grant No. SZXK202109).
Acknowledgments
We thank Bullet Edits Limited for the linguistic editing and proofreading of the manuscript.
Conflict of interest
The authors declare that the research was conducted in the absence of any commercial or financial relationships that could be construed as a potential conflict of interest.
Publisher’s note
All claims expressed in this article are solely those of the authors and do not necessarily represent those of their affiliated organizations, or those of the publisher, the editors and the reviewers. Any product that may be evaluated in this article, or claim that may be made by its manufacturer, is not guaranteed or endorsed by the publisher.
Supplementary material
The Supplementary Material for this article can be found online at: https://www.frontiersin.org/articles/10.3389/fonc.2023.1184215/full#supplementary-material
Abbreviations
EMT: epithelial-mesenchymal transition, COAD: Colon adenocarcinoma, qPCR: quantitative polymerase chain reaction, IHC: Immunohistochemistry, PCA: principal component analysis, ECM: extracellular matrix, CTC: circulating tumor cells, ARGs: anoikis-related genes, ERGs: EMT-related genes, GSEA: Gene Set Enrichment Analysis, TCGA: The Cancer Genome Atlas, CNV: copy number variation, OS: overall survival, ROC: receiver operating characteristic, AUC: area under the ROC curve, API: Anoikis Potential Index, EPI: EMT Potential Index, GO: gene ontology, FDR: False discovery rate, DEGs: differentially expressed genes, KEGG: Kyoto Encyclopedia of Genes And Genomes, LASSO: least absolute shrinkage and selection operator, PAEGs: prognostic anoikis-related genes and EMT-related genes, KM: Kaplan Meier, DCA: decision curve analysis, ssGSEA: single sample GSEA, HLA: human leukocyte antigen, H&E: Hematoxylin-eosin, MF: molecular functions, BP: biological process, COAD: cellular components, NAT1: Arylamine N-acetyltransferase 1, PCOLCE2: Procollagen C-endopeptidase enhancer 2, CDKN2A: Cyclin-dependent kinase inhibitor 2A, TME: The tumor microenvironment, CAF: cancer-associated fibroblasts, CTL: Cytotoxic T lymphocyte, MHC: major histocompatibility complex.
References
1. Siegel RL, Miller KD, Wagle NS, Jemal A. Cancer statistics, 2023. CA Cancer J Clin (2023) 73:17–48. doi: 10.3322/caac.21763
2. Miller KD, Nogueira L, Devasia T, Mariotto AB, Yabroff KR, Jemal A, et al. Cancer treatment and survivorship statistics, 2022. CA Cancer J Clin (2022) 72:409–36. doi: 10.3322/caac.21731
3. Siegel RL, Wagle NS, Cercek A, Smith RA, Jemal A. Colorectal cancer statistics, 2023. CA Cancer J Clin (2023) 73:233–54. doi: 10.3322/caac.21772
4. Nieto MA, Huang RY, Jackson RA, Thiery JP. EMT: 2016. Cell (2016) 166:21–45. doi: 10.1016/j.cell.2016.06.028
5. Zhang N, Ng AS, Cai S, Li Q, Yang L, Kerr D. Novel therapeutic strategies: targeting epithelial-mesenchymal transition in colorectal cancer. Lancet Oncol (2021) 22:e358–68. doi: 10.1016/s1470-2045(21)00343-0
6. Zhou Y, Lu L, Jiang G, Chen Z, Li J, An P, et al. Targeting CDK7 increases the stability of snail to promote the dissemination of colorectal cancer. Cell Death Differ (2019) 26:1442–52. doi: 10.1038/s41418-018-0222-4
7. Bao Z, Zeng W, Zhang D, Wang L, Deng X, Lai J, et al. SNAIL induces EMT and lung metastasis of tumours secreting CXCL2 to promote the invasion of M2-type immunosuppressed macrophages in colorectal cancer. Int J Biol Sci (2022) 18:2867–81. doi: 10.7150/ijbs.66854
8. Taddei ML, Giannoni E, Fiaschi T, Chiarugi P. Anoikis: an emerging hallmark in health and diseases. J Pathol (2012) 226:380–93. doi: 10.1002/path.3000
9. Buchheit CL, Weigel KJ, Schafer ZT. Cancer cell survival during detachment from the ECM: multiple barriers to tumour progression. Nat Rev Cancer (2014) 14:632–41. doi: 10.1038/nrc3789
10. Qin W, Tian Y, Zhang J, Liu W, Zhou Q, Hu S, et al. The double inhibition of PDK1 and STAT3-Y705 prevents liver metastasis in colorectal cancer. Sci Rep (2019) 9:12973. doi: 10.1038/s41598-019-49480-8
11. Wang YN, Zeng ZL, Lu J, Wang Y, Liu ZX, He MM, et al. CPT1A-mediated fatty acid oxidation promotes colorectal cancer cell metastasis by inhibiting anoikis. Oncogene (2018) 37:6025–40. doi: 10.1038/s41388-018-0384-z
12. Tiwari N, Gheldof A, Tatari M, Christofori G. EMT as the ultimate survival mechanism of cancer cells. Semin Cancer Biol (2012) 22:194–207. doi: 10.1016/j.semcancer.2012.02.013
13. Singh AB, Sharma A, Smith JJ, Krishnan M, Chen X, Eschrich S, et al. Claudin-1 up-regulates the repressor ZEB-1 to inhibit e-cadherin expression in colon cancer cells. Gastroenterology (2011) 141:2140–53. doi: 10.1053/j.gastro.2011.08.038
14. Muys BR, Sousa JF, Plaça JR, de Araújo LF, Sarshad AA, Anastasakis DG, et al. miR-450a acts as a tumor suppressor in ovarian cancer by regulating energy metabolism. Cancer Res (2019) 79:3294–305. doi: 10.1158/0008-5472.Can-19-0490
15. Wang D, Zhang L, Hu A, Wang Y, Liu Y, Yang J, et al. Loss of 4.1N in epithelial ovarian cancer results in EMT and matrix-detached cell death resistance. Protein Cell (2021) 12:107–27. doi: 10.1007/s13238-020-00723-9
16. Zhang B, Wu Q, Li B, Wang D, Wang L, Zhou YL. m(6)A regulator-mediated methylation modification patterns and tumor microenvironment infiltration characterization in gastric cancer. Mol Cancer (2020) 19:53. doi: 10.1186/s12943-020-01170-0
17. Wilkerson MD, Hayes DN. ConsensusClusterPlus: a class discovery tool with confidence assessments and item tracking. Bioinformatics (2010) 26:1572–3. doi: 10.1093/bioinformatics/btq170
18. Chen L, Niu X, Qiao X, Liu S, Ma H, Shi X, et al. Characterization of interplay between autophagy and ferroptosis and their synergistical roles on manipulating immunological tumor microenvironment in squamous cell carcinomas. Front Immunol (2021) 12:739039. doi: 10.3389/fimmu.2021.739039
19. Yu Y, Song Y, Cheng L, Chen L, Liu B, Lu D, et al. CircCEMIP promotes anoikis-resistance by enhancing protective autophagy in prostate cancer cells. J Exp Clin Cancer Res (2022) 41:188. doi: 10.1186/s13046-022-02381-7
20. Yu Y, Liu B, Li X, Lu D, Yang L, Chen L, et al. ATF4/CEMIP/PKCα promotes anoikis resistance by enhancing protective autophagy in prostate cancer cells. Cell Death Dis (2022) 13:46. doi: 10.1038/s41419-021-04494-x
21. Zhang C, Wang L, Jin C, Zhou J, Peng C, Wang Y, et al. Long non-coding RNA lnc-LALC facilitates colorectal cancer liver metastasis via epigenetically silencing LZTS1. Cell Death Dis (2021) 12:224. doi: 10.1038/s41419-021-03461-w
22. Liu Y, Zhang Q, Xing B, Luo N, Gao R, Yu K, et al. Immune phenotypic linkage between colorectal cancer and liver metastasis. Cancer Cell (2022) 40:424–437.e425. doi: 10.1016/j.ccell.2022.02.013
23. Chandra R, Karalis JD, Liu C, Murimwa GZ, Voth Park J, Heid CA, et al. The colorectal cancer tumor microenvironment and its impact on liver and lung metastasis. Cancers (Basel) (2021) 13:6206. doi: 10.3390/cancers13246206
24. Zhu X, Tian X, Ji L, Zhang X, Cao Y, Shen C, et al. A tumor microenvironment-specific gene expression signature predicts chemotherapy resistance in colorectal cancer patients. NPJ Precis Oncol (2021) 5:7. doi: 10.1038/s41698-021-00142-x
25. Ecker BL, Lee J, Saadat LV, Aparicio T, Buisman FE, Balachandran VP, et al. Recurrence-free survival versus overall survival as a primary endpoint for studies of resected colorectal liver metastasis: a retrospective study and meta-analysis. Lancet Oncol (2022) 23:1332–42. doi: 10.1016/s1470-2045(22)00506-x
26. Tsilimigras DI, Brodt P, Clavien PA, Muschel RJ, D'Angelica MI, Endo I, et al. Liver metastases. Nat Rev Dis Primers (2021) 7:27. doi: 10.1038/s41572-021-00261-6
27. Achrol AS, Rennert RC, Anders C, Soffietti R, Ahluwalia MS, Nayak L, et al. Brain metastases. Nat Rev Dis Primers (2019) 5:5. doi: 10.1038/s41572-018-0055-y
28. Jin L, Chun J, Pan C, Kumar A, Zhang G, Ha Y, et al. The PLAG1-GDH1 axis promotes anoikis resistance and tumor metastasis through CamKK2-AMPK signaling in LKB1-deficient lung cancer. Mol Cell (2018) 69:87–99.e87. doi: 10.1016/j.molcel.2017.11.025
29. Huang Y, Hong W, Wei X. The molecular mechanisms and therapeutic strategies of EMT in tumor progression and metastasis. J Hematol Oncol (2022) 15:129. doi: 10.1186/s13045-022-01347-8
30. Butcher NJ, Minchin RF. Arylamine n-acetyltransferase 1: a novel drug target in cancer development. Pharmacol Rev (2012) 64:147–65. doi: 10.1124/pr.110.004275
31. Malagobadan S, Ho CS, Nagoor NH. MicroRNA-6744-5p promotes anoikis in breast cancer and directly targets NAT1 enzyme. Cancer Biol Med (2020) 17:101–11. doi: 10.20892/j.issn.2095-3941.2019.0010
32. Savci-Heijink CD, Halfwerk H, Hooijer GKJ, Koster J, Horlings HM, Meijer SL, et al. Epithelial-to-mesenchymal transition status of primary breast carcinomas and its correlation with metastatic behavior. Breast Cancer Res Treat (2019) 174:649–59. doi: 10.1007/s10549-018-05089-5
33. Okamoto A, Demetrick DJ, Spillare EA, Hagiwara K, Hussain SP, Bennett WP, et al. Mutations and altered expression of p16INK4 in human cancer. Proc Natl Acad Sci U.S.A. (1994) 91:11045–9. doi: 10.1073/pnas.91.23.11045
34. Hu H, Li Z, Chen J, Wang D, Ma J, Wang W, et al. P16 reactivation induces anoikis and exhibits antitumour potency by downregulating akt/survivin signalling in hepatocellular carcinoma cells. Gut (2011) 60:710–21. doi: 10.1136/gut.2010.220020
35. Amano M, Eriksson H, Manning JC, Detjen KM, André S, Nishimura S, et al. Tumour suppressor p16(INK4a) - anoikis-favouring decrease in N/O-glycan/cell surface sialylation by down-regulation of enzymes in sialic acid biosynthesis in tandem in a pancreatic carcinoma model. FEBS J (2012) 279:4062–80. doi: 10.1111/febs.12001
36. Rabien A, Sanchez-Ruderisch H, Schulz P, Otto N, Wimmel A, Wiedenmann B, et al. Tumor suppressor p16INK4a controls oncogenic K-ras function in human pancreatic cancer cells. Cancer Sci (2012) 103:169–75. doi: 10.1111/j.1349-7006.2011.02140.x
37. Kemmner W, Kessel P, Sanchez-Ruderisch H, Möller H, Hinderlich S, Schlag PM, et al. Loss of UDP-n-acetylglucosamine 2-epimerase/N-acetylmannosamine kinase (GNE) induces apoptotic processes in pancreatic carcinoma cells. FASEB J (2012) 26:938–46. doi: 10.1096/fj.11-186700
38. André S, Sanchez-Ruderisch H, Nakagawa H, Buchholz M, Kopitz J, Forberich P, et al. Tumor suppressor p16INK4a--modulator of glycomic profile and galectin-1 expression to increase susceptibility to carbohydrate-dependent induction of anoikis in pancreatic carcinoma cells. FEBS J (2007) 274:3233–56. doi: 10.1111/j.1742-4658.2007.05851.x
39. Chen S, Gu J, Zhang Q, Hu Y, Ge Y. Development of biomarker signatures associated with anoikis to predict prognosis in endometrial carcinoma patients. J Oncol (2021) 2021:3375297. doi: 10.1155/2021/3375297
40. Shi WK, Li YH, Bai XS, Lin GL. The cell cycle-associated protein CDKN2A may promotes colorectal cancer cell metastasis by inducing epithelial-mesenchymal transition. Front Oncol (2022) 12:834235. doi: 10.3389/fonc.2022.834235
41. Kang N, Xie X, Zhou X, Wang Y, Chen S, Qi R, et al. Identification and validation of EMT-immune-related prognostic biomarkers CDKN2A, CMTM8 and ILK in colon cancer. BMC Gastroenterol (2022) 22:190. doi: 10.1186/s12876-022-02257-2
42. Steiglitz BM, Keene DR, Greenspan DS. PCOLCE2 encodes a functional procollagen c-proteinase enhancer (PCPE2) that is a collagen-binding protein differing in distribution of expression and post-translational modification from the previously described PCPE1. J Biol Chem (2002) 277:49820–30. doi: 10.1074/jbc.M209891200
43. Zhang M, Cao C, Li X, Gu Q, Xu Y, Zhu Z, et al. Five EMT-related genes signature predicts overall survival and immune environment in microsatellite instability-high gastric cancer. Cancer Med (2022) 12:2075–88. doi: 10.1002/cam4.4975
44. Xu H, Wan H, Zhu M, Feng L, Zhang H, Su F. Discovery and validation of an epithelial-mesenchymal transition-based signature in gastric cancer by genomics and prognosis analysis. BioMed Res Int (2021) 2021:9026918. doi: 10.1155/2021/9026918
45. Shi C, Xie Y, Li X, Li G, Liu W, Pei W, et al. Identification of ferroptosis-related genes signature predicting the efficiency of invasion and metastasis ability in colon adenocarcinoma. Front Cell Dev Biol (2021) 9:815104. doi: 10.3389/fcell.2021.815104
46. Grünwald BT, Devisme A, Andrieux G, Vyas F, Aliar K, McCloskey CW, et al. Spatially confined sub-tumor microenvironments in pancreatic cancer. Cell (2021) 184:5577–5592.e5518. doi: 10.1016/j.cell.2021.09.022
47. Zhang HF, Hughes CS, Li W, He JZ, Surdez D, El-Naggar AM, et al. Proteomic screens for suppressors of anoikis identify IL1RAP as a promising surface target in Ewing sarcoma. Cancer Discovery (2021) 11:2884–903. doi: 10.1158/2159-8290.Cd-20-1690
48. Yuan JW, Zhang YN, Liu YR, Li W, Dou SX, Wei Y, et al. Diffusion behaviors of integrins in single cells altered by epithelial to mesenchymal transition. Small (2022) 18:e2106498. doi: 10.1002/smll.202106498
Keywords: colon adenocarcinoma, anoikis, EMT, crosstalk, risk model
Citation: Zhou J, Yang S, Zhu D, Li H, Miao X, Gu M, Xu W, Zhang Y, Tang W, Shen R, Zha J, Zhu J, Yuan Z and Gu X (2023) The crosstalk between anoikis and epithelial-mesenchymal transition and their synergistic roles in predicting prognosis in colon adenocarcinoma. Front. Oncol. 13:1184215. doi: 10.3389/fonc.2023.1184215
Received: 11 March 2023; Accepted: 17 May 2023;
Published: 07 June 2023.
Edited by:
Alessandro Passardi, Scientific Institute of Romagna for the Study and Treatment of Tumors (IRCCS), ItalyReviewed by:
Yingkun Xu, Chongqing Medical University, ChinaRongzhang Dou, University of Texas MD Anderson Cancer Center, United States
Copyright © 2023 Zhou, Yang, Zhu, Li, Miao, Gu, Xu, Zhang, Tang, Shen, Zha, Zhu, Yuan and Gu. This is an open-access article distributed under the terms of the Creative Commons Attribution License (CC BY). The use, distribution or reproduction in other forums is permitted, provided the original author(s) and the copyright owner(s) are credited and that the original publication in this journal is cited, in accordance with accepted academic practice. No use, distribution or reproduction is permitted which does not comply with these terms.
*Correspondence: Jianhua Zhu, eWFvbGk3OEAxNjMuY29t; Zheng Yuan, bGluemk4MF84MEAxMjYuY29t; Xinhua Gu, MTE3MzQyMTc1NUBxcS5jb20=
†These authors have contributed equally to this work