 Yutong Fang1,2
 Qunchen Zhang1,2
 Chunfa Chen1,2
 Zexiao Chen1,2Rongji Zheng1,2Chuanghong She1,2Rendong Zhang1,2*
 Jundong Wu1,2*
- 1The Breast Center, Cancer Hospital of Shantou University Medical College, Shantou, Guangdong, China
- 2The Department of Central Laboratory, Cancer Hospital of Shantou University Medical College, Shantou, Guangdong, China
Background: Epithelial–mesenchymal transition (EMT) is a crucial mechanism that microRNA-222-3p (miR-222-3p) promotes breast cancer (BC) progression. Our study aimed to identify EMT-associated target genes (ETGs) of miR-222-3p for further analysis of their roles in BC based on bioinformatics tools.
Methods: Based on bioinformatics analysis, we identified 10 core ETGs of miR-222-3p. Then, we performed a comprehensive analysis of 10 ETGs and miR-222-3p, including pathway enrichment analysis of ETGs, differential expression, clinical significance, correlation with immune cell infiltration, immune checkpoint genes (ICGs) expression, tumor mutational burden (TMB), microsatellite instability (MSI), stemness, drug sensitivity, and genetic alteration.
Results: The expression of miR222-3p in basal-like BC was significantly higher than in other subtypes of BC and the normal adjacent tissue. Pathway analysis suggested that the ETGs might regulate the EMT process via the PI3K-Akt and HIF-1 signaling pathway. Six of the 10 core ETGs of miR-222-3p identified were down-expressed in BC, which were EGFR, IL6, NRP1, NTRK2, LAMC2, and PIK3R1, and SERPINE1, MUC1, MMP11, and BIRC5 were up-expressed in BC, which also showed potential diagnostic values in BC. Prognosis analysis revealed that higher NTRK2 and PIK3R1 expressions were related to a better prognosis, and higher BIRC5 and miR-222-3p expressions were related to a worse prognosis. Most ETGs and miR-222-3p were positively correlated with various infiltration of various immune cells and ICGs expression. Lower TMB scores were correlated with higher expression of MUC1 and NTRK2, and higher BIRC5 was related to a higher TMB score. Lower expression of MUC1, NTRK2, and PIK3R1 were associated with higher MSI scores. Higher expression of ETGs was associated with lower mRNAsi scores, except BIRC5 and miR-222-3p conversely. Most ETGs and miR-222-3p expression were negatively correlated with the drug IC50 values. The analysis of the genetic alteration of the ETGs suggested that amplification was the main genetic alteration of eight ETGs except for NTRK2 and PIK3R1.
Conclusion: MiR-222-3p might be a specific biomarker of basal-like BC. We successfully identify 10 core ETGs of miR-222-3p, some might be useful diagnostic and prognostic biomarkers. The comprehensive analysis of 10 ETGs and miR-222-3p indicated that they might be involved in the development of BC, which might be novel therapeutic targets for the treatment of BC.
1 Introduction
Breast cancer (BC) is a prevalent malignancy among women globally, with an annual incidence of over two million cases, posing a significant threat to women’s health and life (1). The current therapeutic approach for BC patients involves a comprehensive therapeutic strategy comprising surgery, chemotherapy, radiotherapy, endocrine therapy, and targeted therapy (2). Despite the 5-year survival rate exceeding 90% for localized BC patients, the survival rate drops to <30% for those diagnosed with metastatic BC (3), which accounts for over 90% of cancer-related deaths in BC (4). Epithelial–mesenchymal transition (EMT) is a well-established process that plays a critical role in tumor-distant metastasis, whereby epithelial cells undergo a phenotypic switch to motile mesenchymal cells with heightened migratory and invasive capabilities (5). EMT has been linked to various biological properties of BC, including the acquisition of stem cell characteristics by BC cells (6). In addition, EMT has been shown to contribute to immunosuppression within the tumor microenvironment, thereby promoting tumor progression and resistance to immunotherapy (7). In addition, several lines of evidence have proven that the expression of the EMT-related gene was associated with therapeutic resistance; thus, it is necessary to evaluate the impact of EMT-related gene expression when developing a precise and individualized treatment plan for BC patients (8).
MicroRNAs (miRNAs) are a class of non-coding RNA molecules that are short and single-stranded. They function as post-transcriptional regulators of protein-coding gene expression and are involved in various cellular activities and the pathogenesis of numerous human diseases, including cancer (9, 10). Recent research has demonstrated that miRNAs can regulate the EMT process by targeting transcription factors such as Snail land Twist, thereby influencing tumor invasion and metastasis in different types of cancer (11). Certain EMT-related miRNAs have also been linked to cancer stemness and drug resistance (12).
MicroRNA-222-3p (miR-222-3p), a member of the miRNA family, is located on the human X chromosome and functions as a regulator of gene expression in the context of tumorigenesis. Specifically, miR-222-3p has been implicated in the progression of various types of cancers, acting as either a tumor suppressor or oncogene (13). In recent years, it has been established that miR-222-3p plays a significant role in promoting BC progression through the mechanism of EMT. A prior investigation has demonstrated that miR-222-3p can suppress the expression of Zinc finger E-box-binding homeobox 2 (ZEB2), thereby inducing EMT (14). Moreover, recent evidence has identified Notch3, a member of the Notch receptor family, as a target of miR-222-3p that facilitates the EMT process in BC cells (15). Given that miR-222-3p is an EMT-associated miRNA, it is imperative to further explore the molecular mechanisms underlying its regulation of the EMT process in BC. Given the ability of a single miRNA to regulate the expression of multiple target genes concurrently (16), the objective of our investigation was to identify further potential target EMT-related genes of miR-222-3p and to explore their clinical significance, their relationship with tumor-infiltrating immune cells and drug sensitivity based on bioinformatics tools. Our findings may aid in the identification of novel drug therapy targets for patients with breast cancer.
2 Materials and methods
2.1 Data collection and analysis of differential expression and clinical significance of miR-222-3p
The level 3 normalized miRNA-sequencing data of miR-222-3p expression, including 104 normal samples and 1,103 BC tissue samples, and the clinical information of BC patients were downloaded from The Cancer Genome Atlas (TCGA) website (https://portal.gdc.cancer.gov/) (17). Then, the expression data of miRNA were then normalized to read per million (RPM) format and then were converted to log2(RPM+1). Samples lacking clinical information were excluded when analyzing the relation between expression and clinical significance in this study. The unpaired t-test was used to analyze the statistical difference between two groups of BC patients, and the Kruskal–Wallis test among more than two groups. Values of the expression level were displayed as means ± standard deviations. The differential expression of miR-222-3p was also validated by the GSE45666 dataset obtained from the Gene Expression Omnibus (GEO) database (https://www.ncbi.nlm.nih.gov/geo/) and cell lines. The receiver operating characteristic (ROC) analysis was performed by the pROC package in R to evaluate the power of miR-222-3p to differentiate BC subtypes. The Kaplan–Meier (KM) method with the log-rank test was used for analyzing the prognosis between high and low miR-222-3p expression groups with a cutoff set at the median expression level by the survival and survminer package in R. Plots were generated in R with the ggplot2 package.
2.2 Identification and enrichment analysis of EMT-related target genes
To identify the potential target genes of miR-222-3p, we used the miRWalk website of version 3.0 (http://mirwalk.umm.uni-heidelberg.de/) (Supplementary Table S1), which includes the prediction outcomes of various prediction databases (18). The EMT-related genes were obtained from the dbEMT 2.0 database (http://dbemt.bioinfo-minzhao.org/index.html) (Supplementary Table S2), including 1,184 genes (19). In addition, we identified the differentially expressed genes (DEGs) of the data from TCGA via the R software package limma package with the thresholds of |logFC| > 1 and false discovery rate (FDR) < 0.05 (Supplementary Table S3). Then, the intersection among the potential target genes of miR-222-3p, EMT-related genes, and DEGs were selected as the possible EMT-related target genes (ETGs) of miR-222-3p. To further explore the related pathways involved in the process of BC and biological functions of the possible ETGs of miRR-222-3p, we performed the Gene Ontology (GO) and Kyoto Encyclopedia of Genes and Genomes (KEGG) functional enrichment analyses using the R clusterProfiler package and visualization via the R package ggplot2. To further select the hub ETGs to improve the precision of the study, we constructed the protein–protein interaction (PPI) network of the ETGs via the STRING database (https://cn.string-db.org/) (20) and visualized via the Cytoscape (version 3.8.2), with the cytoHubba tool of which we screened 10 top hub genes as the ETGs of miR-222-3p for further research.
2.3 Data collection and correlation analysis of ETGs
After identifying the ETGs of miR-222-3p, we further downloaded the level 3 RNA-sequencing data in fragments per kilobase million (FPKM) format of 10 ETGs from the TCGA website. The data were converted to the format of transcripts per million (TPM) as log2(TPM+1). The Spearman’s correlation test was used to analyze the association between miR-222-3p and its ETGs and the pairwise correlation among the ETGs.
2.4 Differential expression and protein expression of the ETGs
The unpaired t-test was used to analyze the statistical difference of the differential expression between normal groups and BC groups of 10 ETGs with the data obtained from the TCGA and validated by the GSE45666 dataset obtained from the GEO database and cell lines. In addition, the immunohistochemistry images of BC tissues and paired adjacent normal tissues of 10 EGTs were downloaded from the Human Protein Atlas (https://www.proteinatlas.org/) to analyze the protein expression of the EGTs.
2.5 Cell lines and quantitative real-time PCR
MCF-7 is an ER-positive human BC cell line, and MDA-MB-231 is a human basal-like BC cell line with high invasiveness. MCF-10A is a normal breast epithelial cell line. The BC cell lines MCF-7 and MDA-MB-231, and the normal breast epithelial cell line MCF-10A were purchased from Procell (Wuhan, China) and cultured according to the manufacturer’s recommendations. Total RNA was severely isolated from the cells using the RNAsimple total RNA kit (Tiangen, Beijing, China) according to the manufacturer’s instructions. The quantitative real-time PCR (qRT-PCR) was performed using the PrimeScriptTM RT reagent kit (Takara, Japan) and the SYBR Premix Ex TaqTM II (Takara, Japan) according to the manufacturer’s instructions. Glyceraldehyde-3-phosphate dehydrogenase (GAPDH) was used as an internal reference gene, and the relative expression levels were calculated by the 2−△△Ct method. All specific primers are shown in Table 1. The Student’s t-test was used for pairwise comparison of the statistical difference between the MCF-10A cell line and BC cell lines. Plots were generated in GraphPad Prism (version 8.0).
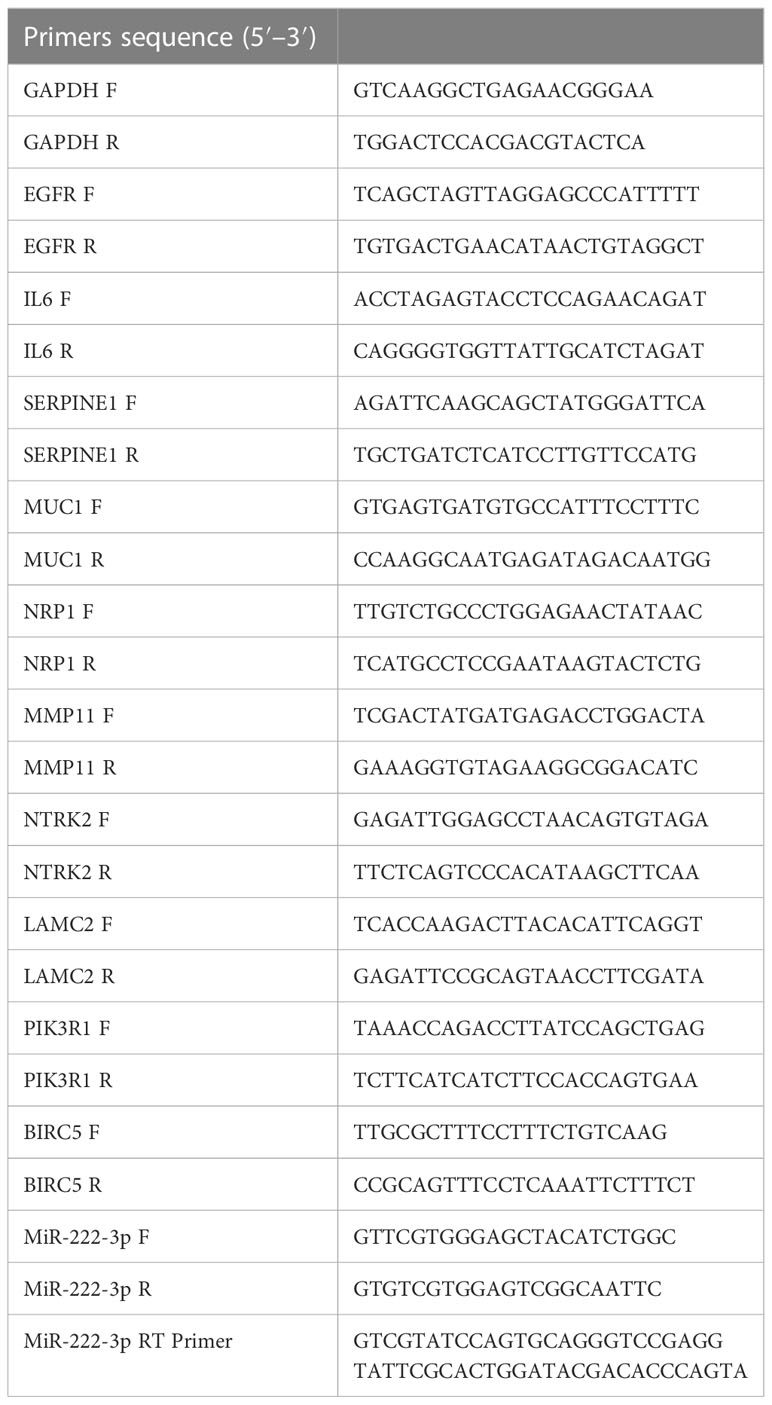
Table 1 Sequences of all primers.
2.6 Clinical significance and prognosis analysis of the EGTs
The ROC curves analysis was performed by the pROC package in R for potential diagnostic values evaluation of the up-expressed EMTs and validated by the GSE45666 dataset from GEO. To explore the clinical significance of the ETGs, we utilized the unpaired t-test to identify the association between the ETGs expression and clinical stages and PAM50 subtypes of BC. In addition, the KM method with the log-rank test was performed by the survival and survminer package in R for analyzing the prognosis of the ETGs expression, including the overall survival (OS) and the disease-specific survival (DSS), with a cutoff set at the median expression level between high and low expression groups. Plots were generated in R with the ggplot2 package.
2.7 Immune cell and immune checkpoint genes analysis
To explore the relationship between the ETGs expression and the immune cells in BC, we utilized the single-sample GSEA (ssGSEA) method (21) to present the infiltration enrichment of 24 common immune cells from the TCGA cohort, and the Spearman’s test was used for correlation analysis. Additionally, we applied Spearman’s correlation test to analyze the correlation between eight ICGs and the ETGs and miR-222-3p expression. Plots were generated with the ggplot2 package.
2.8 Tumor mutational burden, microsatellite instability, and stemness analysis
The somatic mutation data for TMB analysis were downloaded from TCGA, and the TMB scores were calculated by the observed number of mutations divided by 38Mb (22). MSI scores of the BC samples from TCGA were obtained from a previous publication (23). The one-class logistic regression (OCLR) machine-learning algorithm (24) was used for calculating the mRNA expression-based stemness index (mRNAsi) score. The unpaired t-test was used to analyze the statistical difference of the TMB, MSI, and mRNAsi scores between the high-expression and the low-expression group of 10 ETGs and miR-222-3p. Plots were generated with the ggplot2 package.
2.9 Drug sensitivity analysis
The R pRRophetic package was used to predict the drug response of each sample from the TCGA, and the drug sensitivity (IC50) values of each sample were estimated using Ridge’s regression with the data obtained from the Genomics of Drug Sensitivity in Cancer (GDSC) (25). Then, Spearman’s correlation test was applied to analyze the correlation between the IC50 values and the expression levels. Plots were generated in R with the ggplot2 package.
2.10 Genetic alteration analysis
Genetic alteration of the ETGs in the BC cohort was analyzed by cBioPortal website (http://www.cbioportal.org). Additionally, we also analyzed the OS and DSS in altered and unaltered groups.
2.11 Statistical analysis
The R software (version 4.2.1) and GraphPad Prism (version 8.0) were used for all statistical analyses. The above section has described detailed statistical approaches for data processing. p<0.05 was considered statistically significant.
3 Result
3.1 Differential expression and clinical significance of miR-222-3p
The analysis of the differential expression of miR-222-3p from the TCGA suggested that the expression of the BC tissues was lower than that of the normal tissues (p=0.002), which were 5.168 ± 1.117 and 5.519 ± 0.63, respectively (Figure 1A). The same outcome was also validated in the GSE45666 dataset (p<0.05) (Figure 1B). Additionally, the expression of miR-222-3p in MCF-7 was downregulated but upregulated significantly in MDA-MB-231 (Figure 1C). The relation between the miR-222-3p expression and the clinical indicators is shown in Figure 1D. The expression of miR-222-3p was associated with the status of estrogen receptor (ER), progesterone receptor (PR), human epidermal growth factor receptor 2 (HER2), lymph node status, and the PAM50 subtypes (all p<0.05). From the results, we found that BC patients with negative expression of ER and PR had a higher expression level of miR-222-3p (both p<0.001). The negative status of HER2 was associated with the high expression of miR-222-3p (p=0.031). Additionally, patients with nodal status of N0 and N2 had higher expression of miR-222-3p than patients with lymph node metastasis of N3 (p=0.021, p=0.040, respectively). Notably, the expression of miR-222-3p was 6.176 ± 1.047, significantly higher than that of luminal A (4.848 ± 1.006, p<0.001), luminal B (5.099 ± 1.025, p<0.001) and HER2-enriched subtypes (5.116 ± 0.804, p<0.001). We further evaluate the discriminative power between the basal-like subtype and other BC subtypes of miR-222-3p, and the result showed that the area under the curve (AUC) of the ROC curve was 0.819 when the cutoff value was 5.423, with a specificity of 72.5% and a sensitivity of 76.4% (Figure 1E). Additionally, a higher expression of miR-222-3p was correlated with better OS (HR=1.56, p=0.009) and DSS (HR=1.67, p=0.025) (Figure 1F).
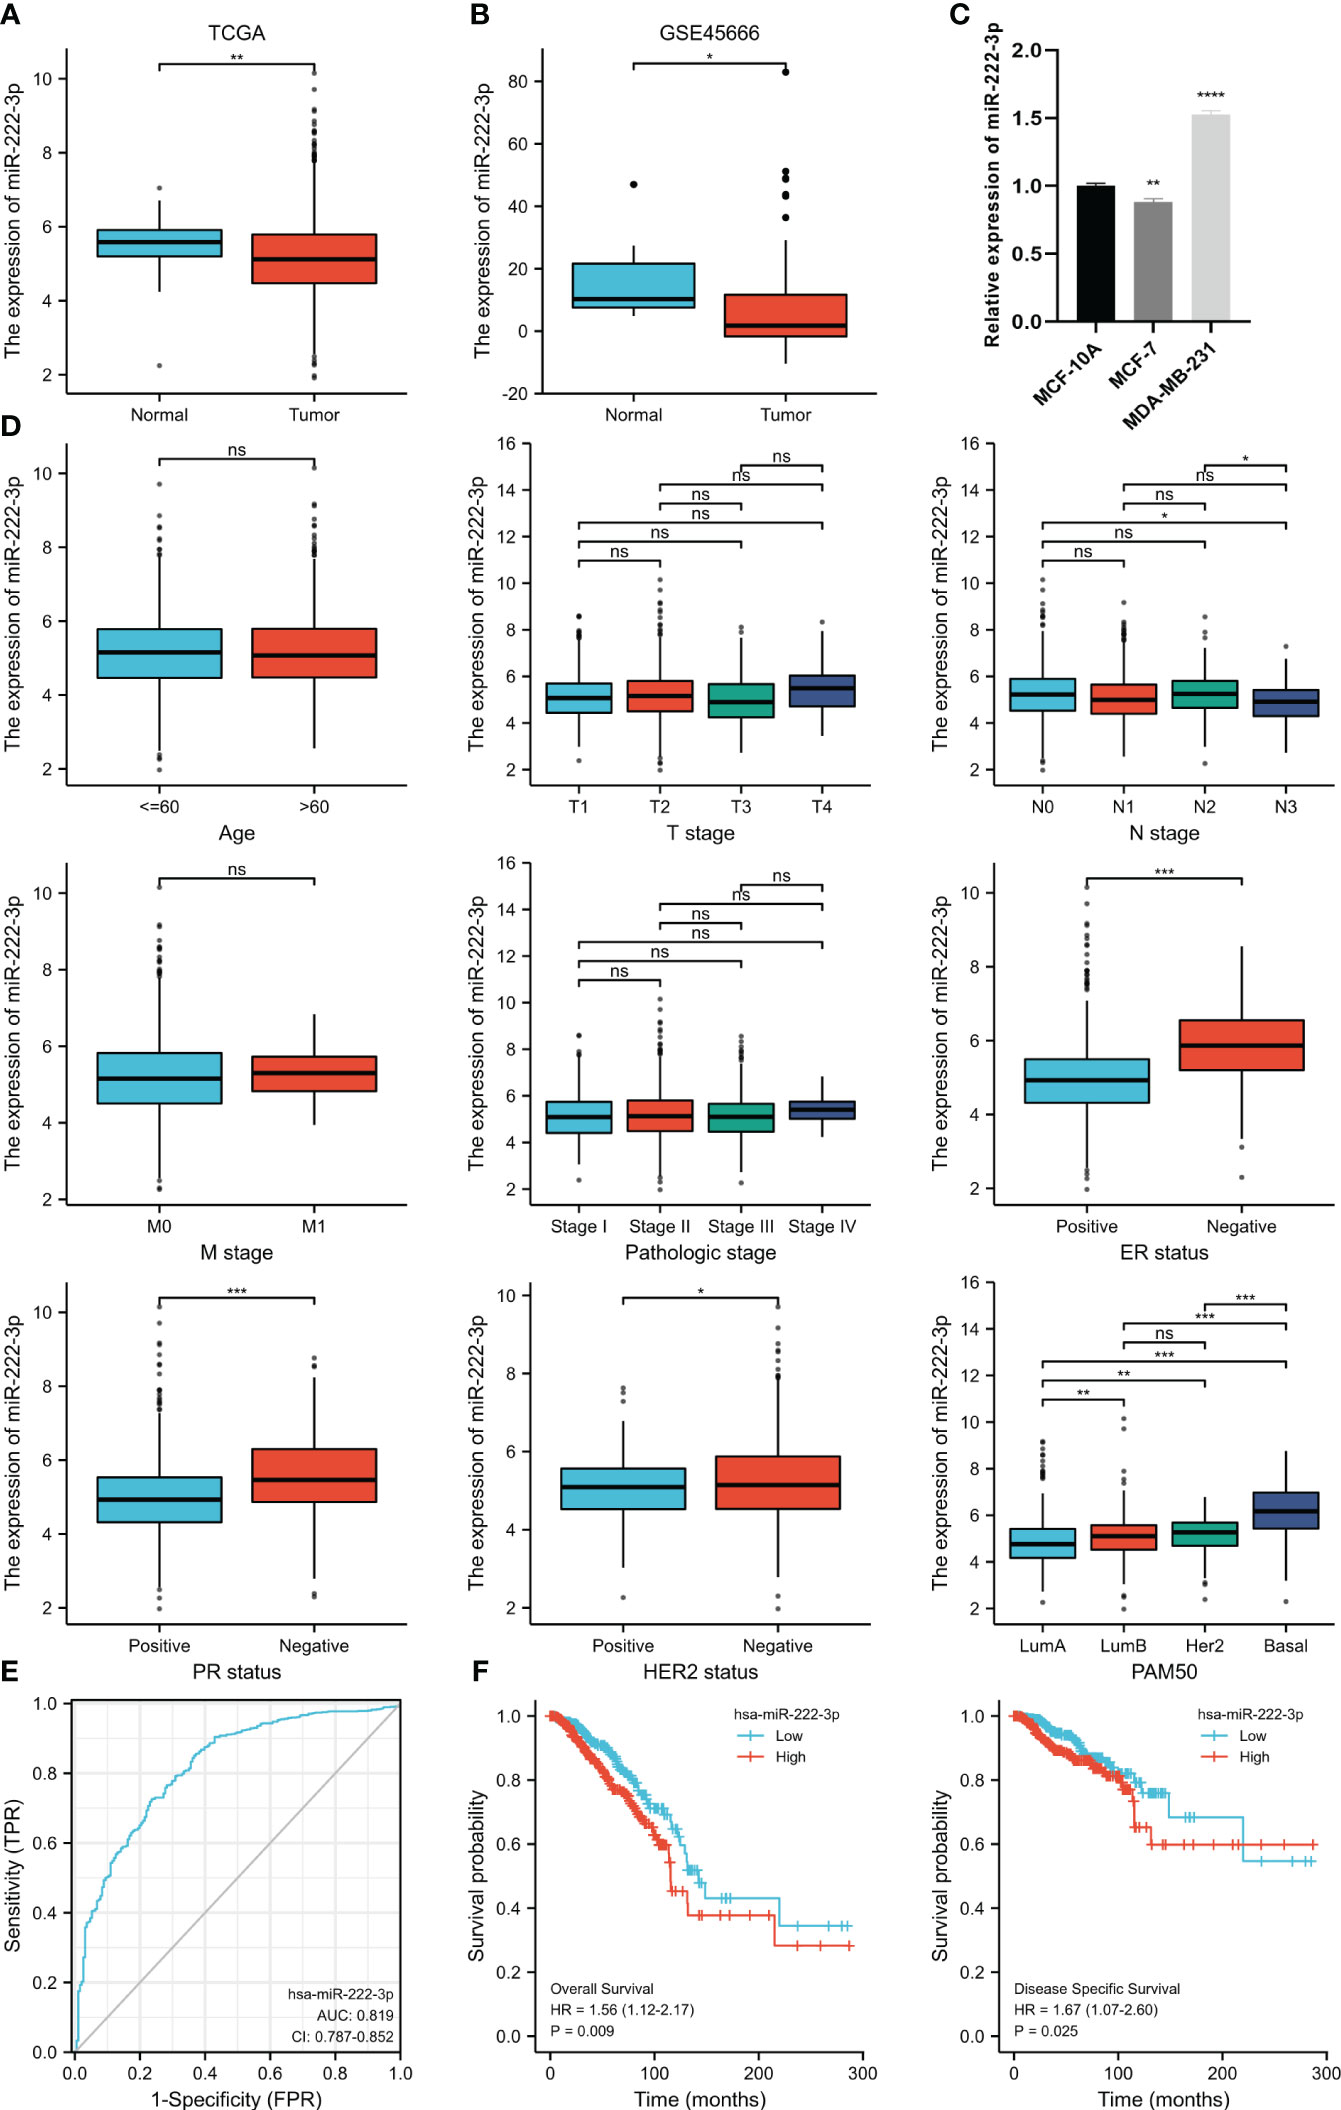
Figure 1 MiR-222-3p differential expression in BC and normal adjacent tissues based on TCGA database (A) and validated by the GSE45666 dataset (B) and cell lines (C). The association between miR-222-3p expression and age, T stage, N stage, M stage, pathological stage, ER status, PR status, HER2 status, and PAM50 subtype (D). The ROC curve shows the discriminative power between the basal-like subtype and other BC subtypes of miR-222-3p (E). The KM survival curves show the OS and DSS of the high and low miR-222-3p expression groups in BC patients from TCGA (F). NS, indicates no statistical difference, *p< 0.05, **p< 0.01, ***p< 0.001, ****P< 0.0001..
3.2 Identification and enrichment analysis of EMT-related target genes
As shown in the Wayne diagram in Figure 2A, a total of 2692 genes were predicted as the target of miR-222-3p via the miRWalk, and 2,401 differentially expressed genes and 1,184 EMT-related genes were identified. We selected the intersection and finally identified 38 genes as the possible ETGs of miR-222-3p. The GO and KEGG functional enrichment analyses were performed to further explore the potential biological mechanisms of the above 38 genes (Figure 2B, Supplementary Table S4). The GO analysis showed that the ETGs might regulate the biological process of cell-matrix adhesion and intracellular signal transduction. The KEGG pathway analysis suggested that the ETGs might regulate the EMT process via the PI3K-Akt and HIF-1 signaling pathway and were associated with the drug resistance of EGFR tyrosine kinase inhibitors in cancer treatment. We constructed a PPI network of 38 ETGs, with 27 nodes and 42 edges (Figure 2C). To improve the accuracy of prediction, we identified 10 top hub genes of the PPI network as the ETGs of miR-222-3p for further research, which were EGFR, IL6, SERPINE1, MUC1, NRP1, MMP11, NTRK2, LAMC2, PIK3R1, BIRC5 (Figure 2D).
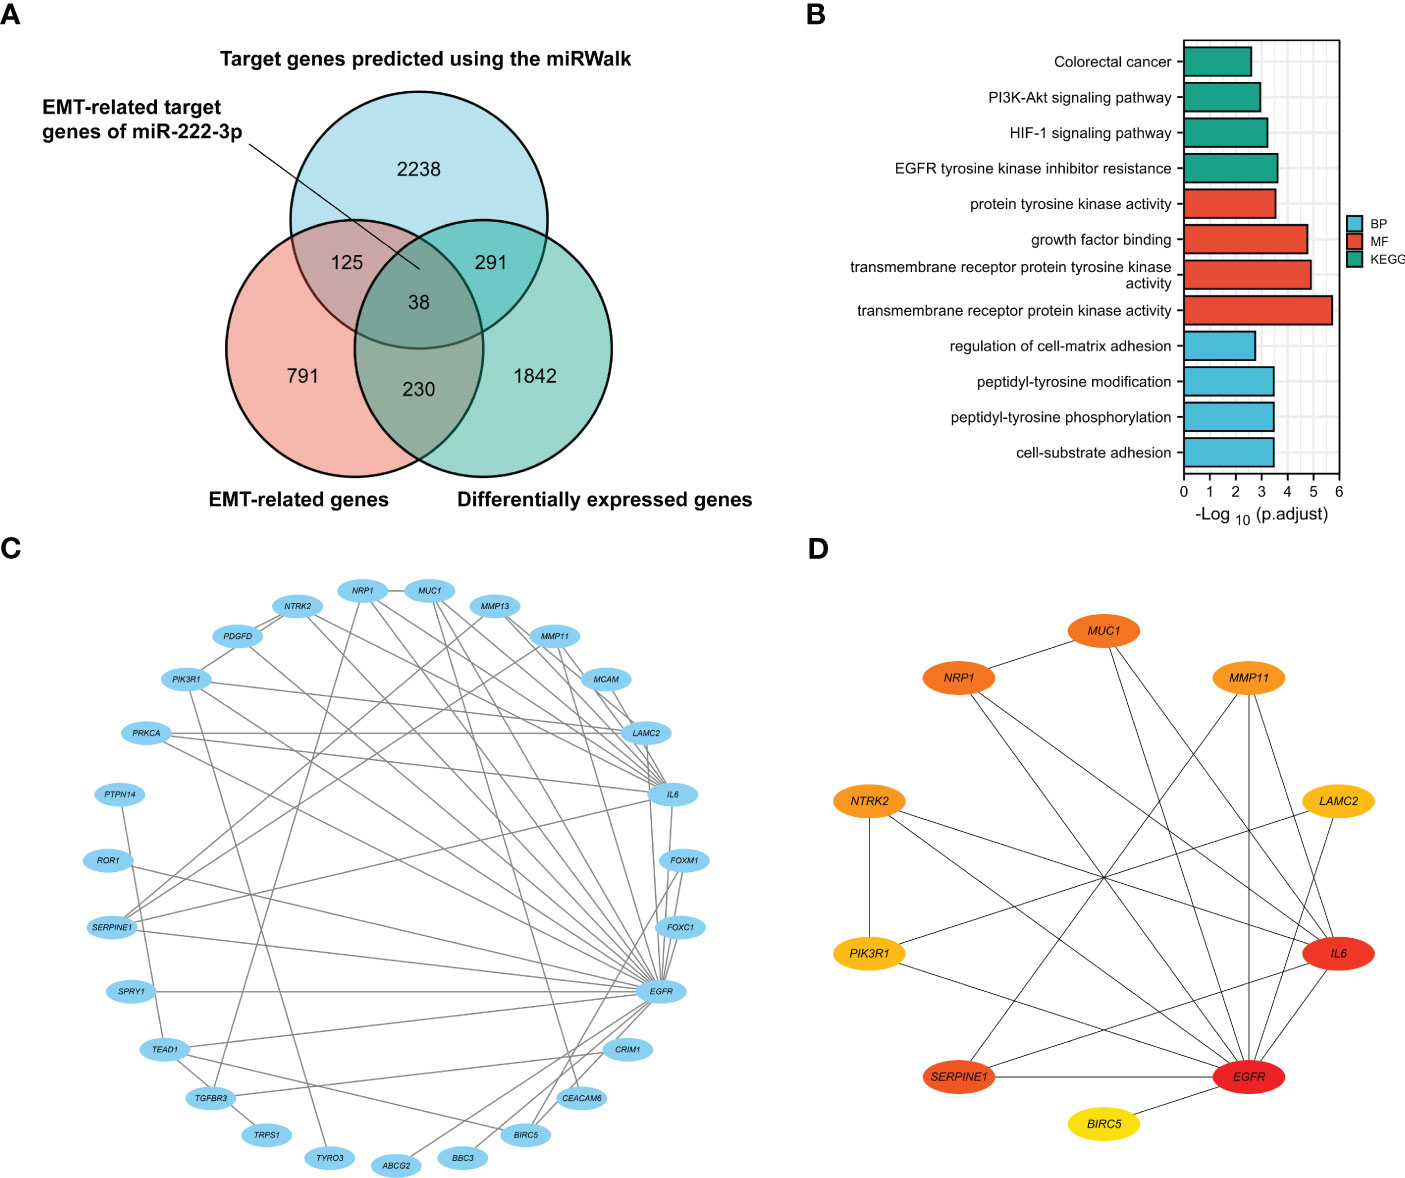
Figure 2 The Venn diagram shows 38 target genes as the possible ETGs of miR-222-3p (A). GO and KEGG pathway enrichment analysis of 38 ETGs of miR-222-3p (B). The PPI network of 38 ETGs of miR-222-3p (C). Ten top hub genes of the PPI network were identified as the ETGs of miR-222-3p for further research (D).
3.3 Correlation analysis
We analyzed the correlation between the miR-222-3p and its ETGs, and the results of Spearman’s correlation test showed that 6 of 10 ETGs were significantly correlated with the expression of miR-222-3p. See Figure 3A for further details. The expression of EGFR (r=0.201, p<0.001), IL6 (r=0.127, p<0.001), LAMC2 (r=0.179, p<0.001), BIRC5 (r=0.282, p<0.001) were positively correlated with miR-222-3p expression, and MUC1 (r=−0.260, p<0.001) and PIK3R1 (r=−0.096, p=0.001) negatively. Interestingly, the pairwise correlation among the ETGs showed that most ETGs had positive a correlation with others. Interestingly, the negative correlation mainly existed between BIRC5 and other ETGs, such as SERPINE1 (r=−0.136, p<0.001), MUC1 (r=−0.417, p=0.003), NRP1 (r=−0.263, p<0.001), NTRK2 (r=−0.356, p<0.001), and PIK3R1 (r=−0.314, p<0.001) (Figure 3B).
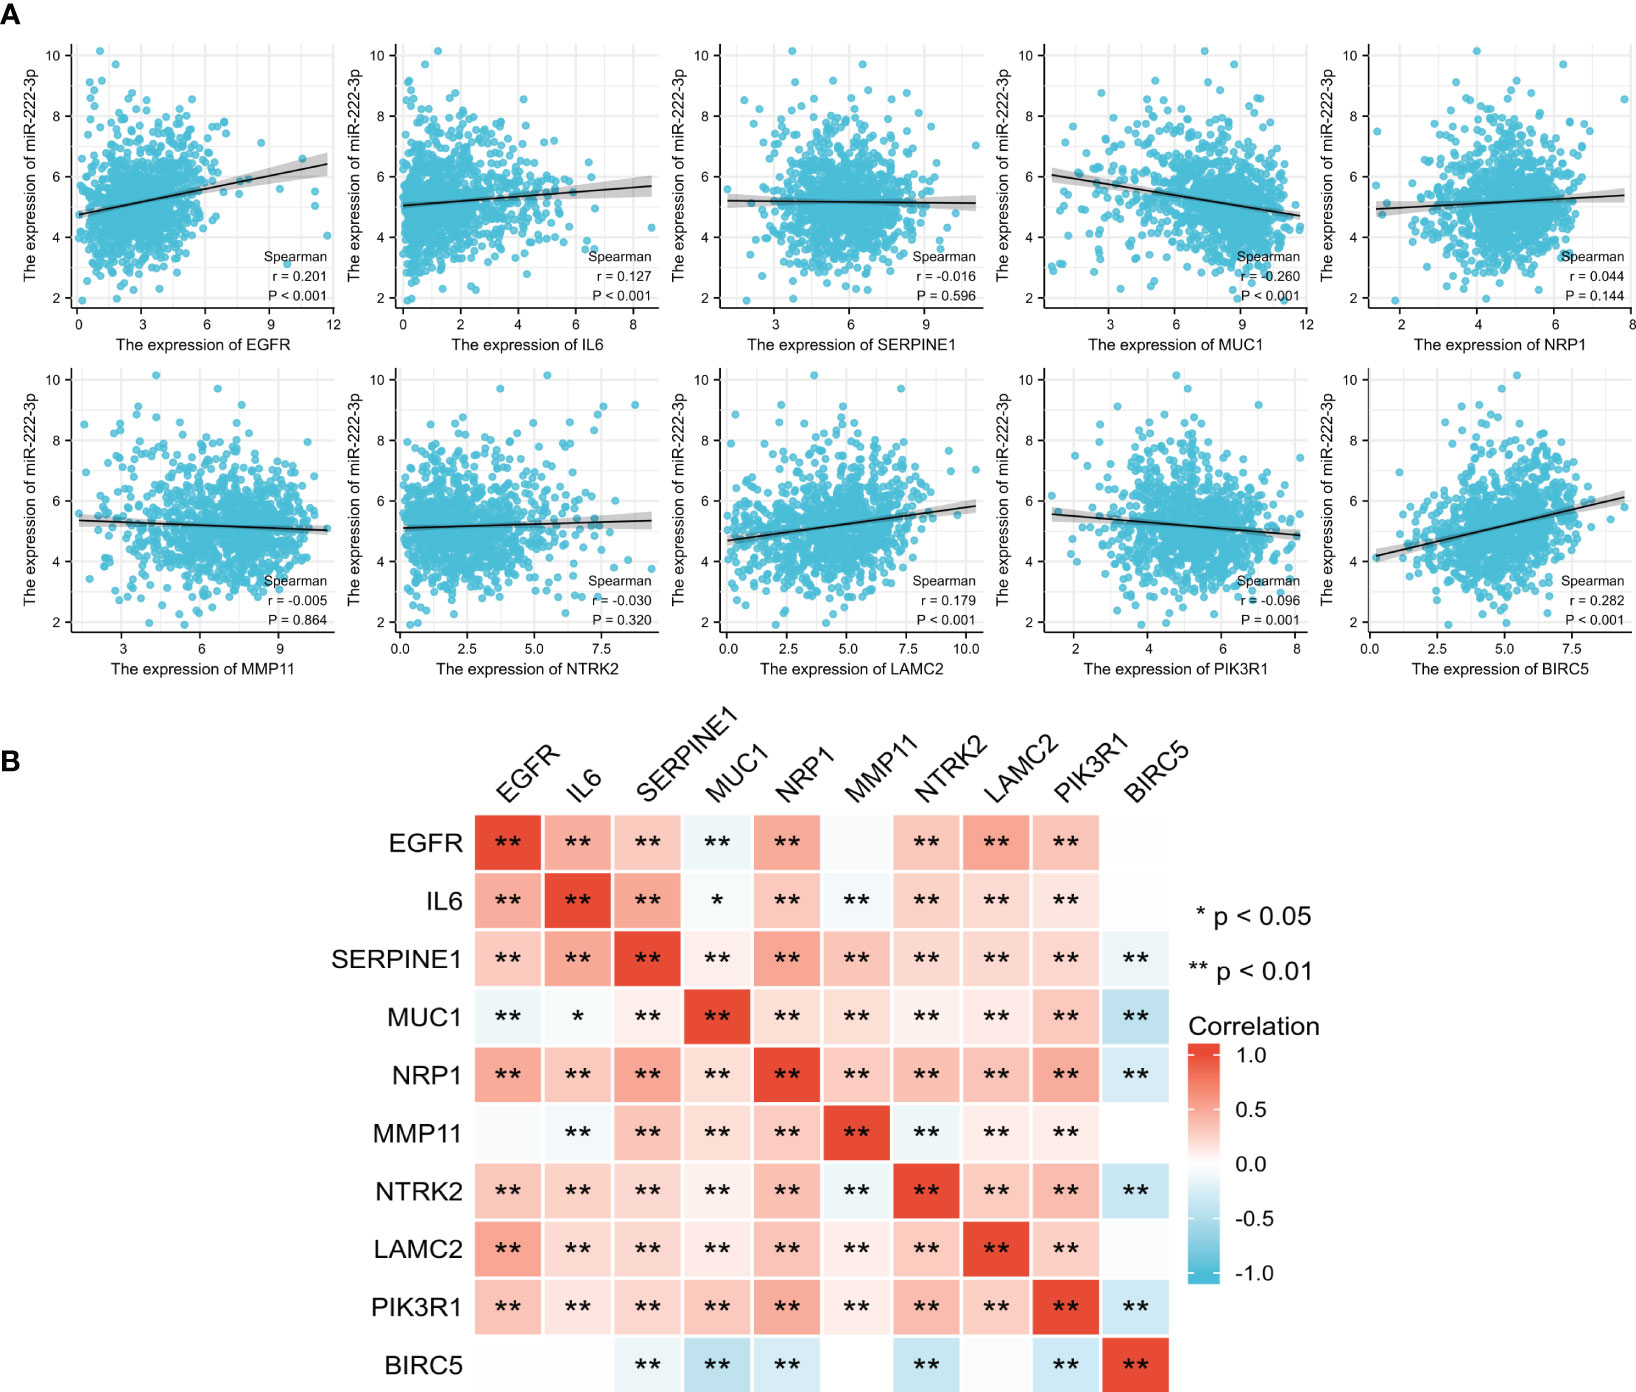
Figure 3 The correlation between the expression of miR-222-3p and its ETGs (A). The pairwise correlation among the ETGs expression (B). *p< 0.05, **p< 0.01.
3.4 Differential expression of the ETGs
Based on the TCGA data, we analyzed the differential expression between the BC samples and the normal samples. As shown in Figure 4A, 7 of 10 ETGs exhibited lower expression levels in the tumor group than the normal group, which were EGFR, IL6, NRP1, NTRK2, LAMC2, and PIK3R1, and the remaining genes, SERPINE1, MUC1, MMP11, and BIRC5 had higher expression level in the tumor group than the normal group (all p<0.05). The differential expression of the ETGs were also validated by the GSE45666 dataset (Figure 4B). In addition, the results of 10 ETGs and miR-222-3p expression were validated in two BC cells (MCF-7 and MDA-MB-231) and a breast epithelial cell line MCF-10A. The results showed that EGFR, IL6, NRP1, NTRK2, LAMC2, and PIK3R1 were downregulated in BC cell lines, and MUC1, MMP11, and BIRC5 were upregulated in BC cell lines (Figure 4C). The immunohistochemistry images of 10 ETGs were obtained from the HPA database to validate their protein expression. As shown in Figure 5, most ETGs had consistent protein expression with previous analyses in BC and normal samples of TCGA data. However, the protein expression of SERPINE1, NTRK2, and BIRC5 showed no significant difference between BC tissue and normal tissue.
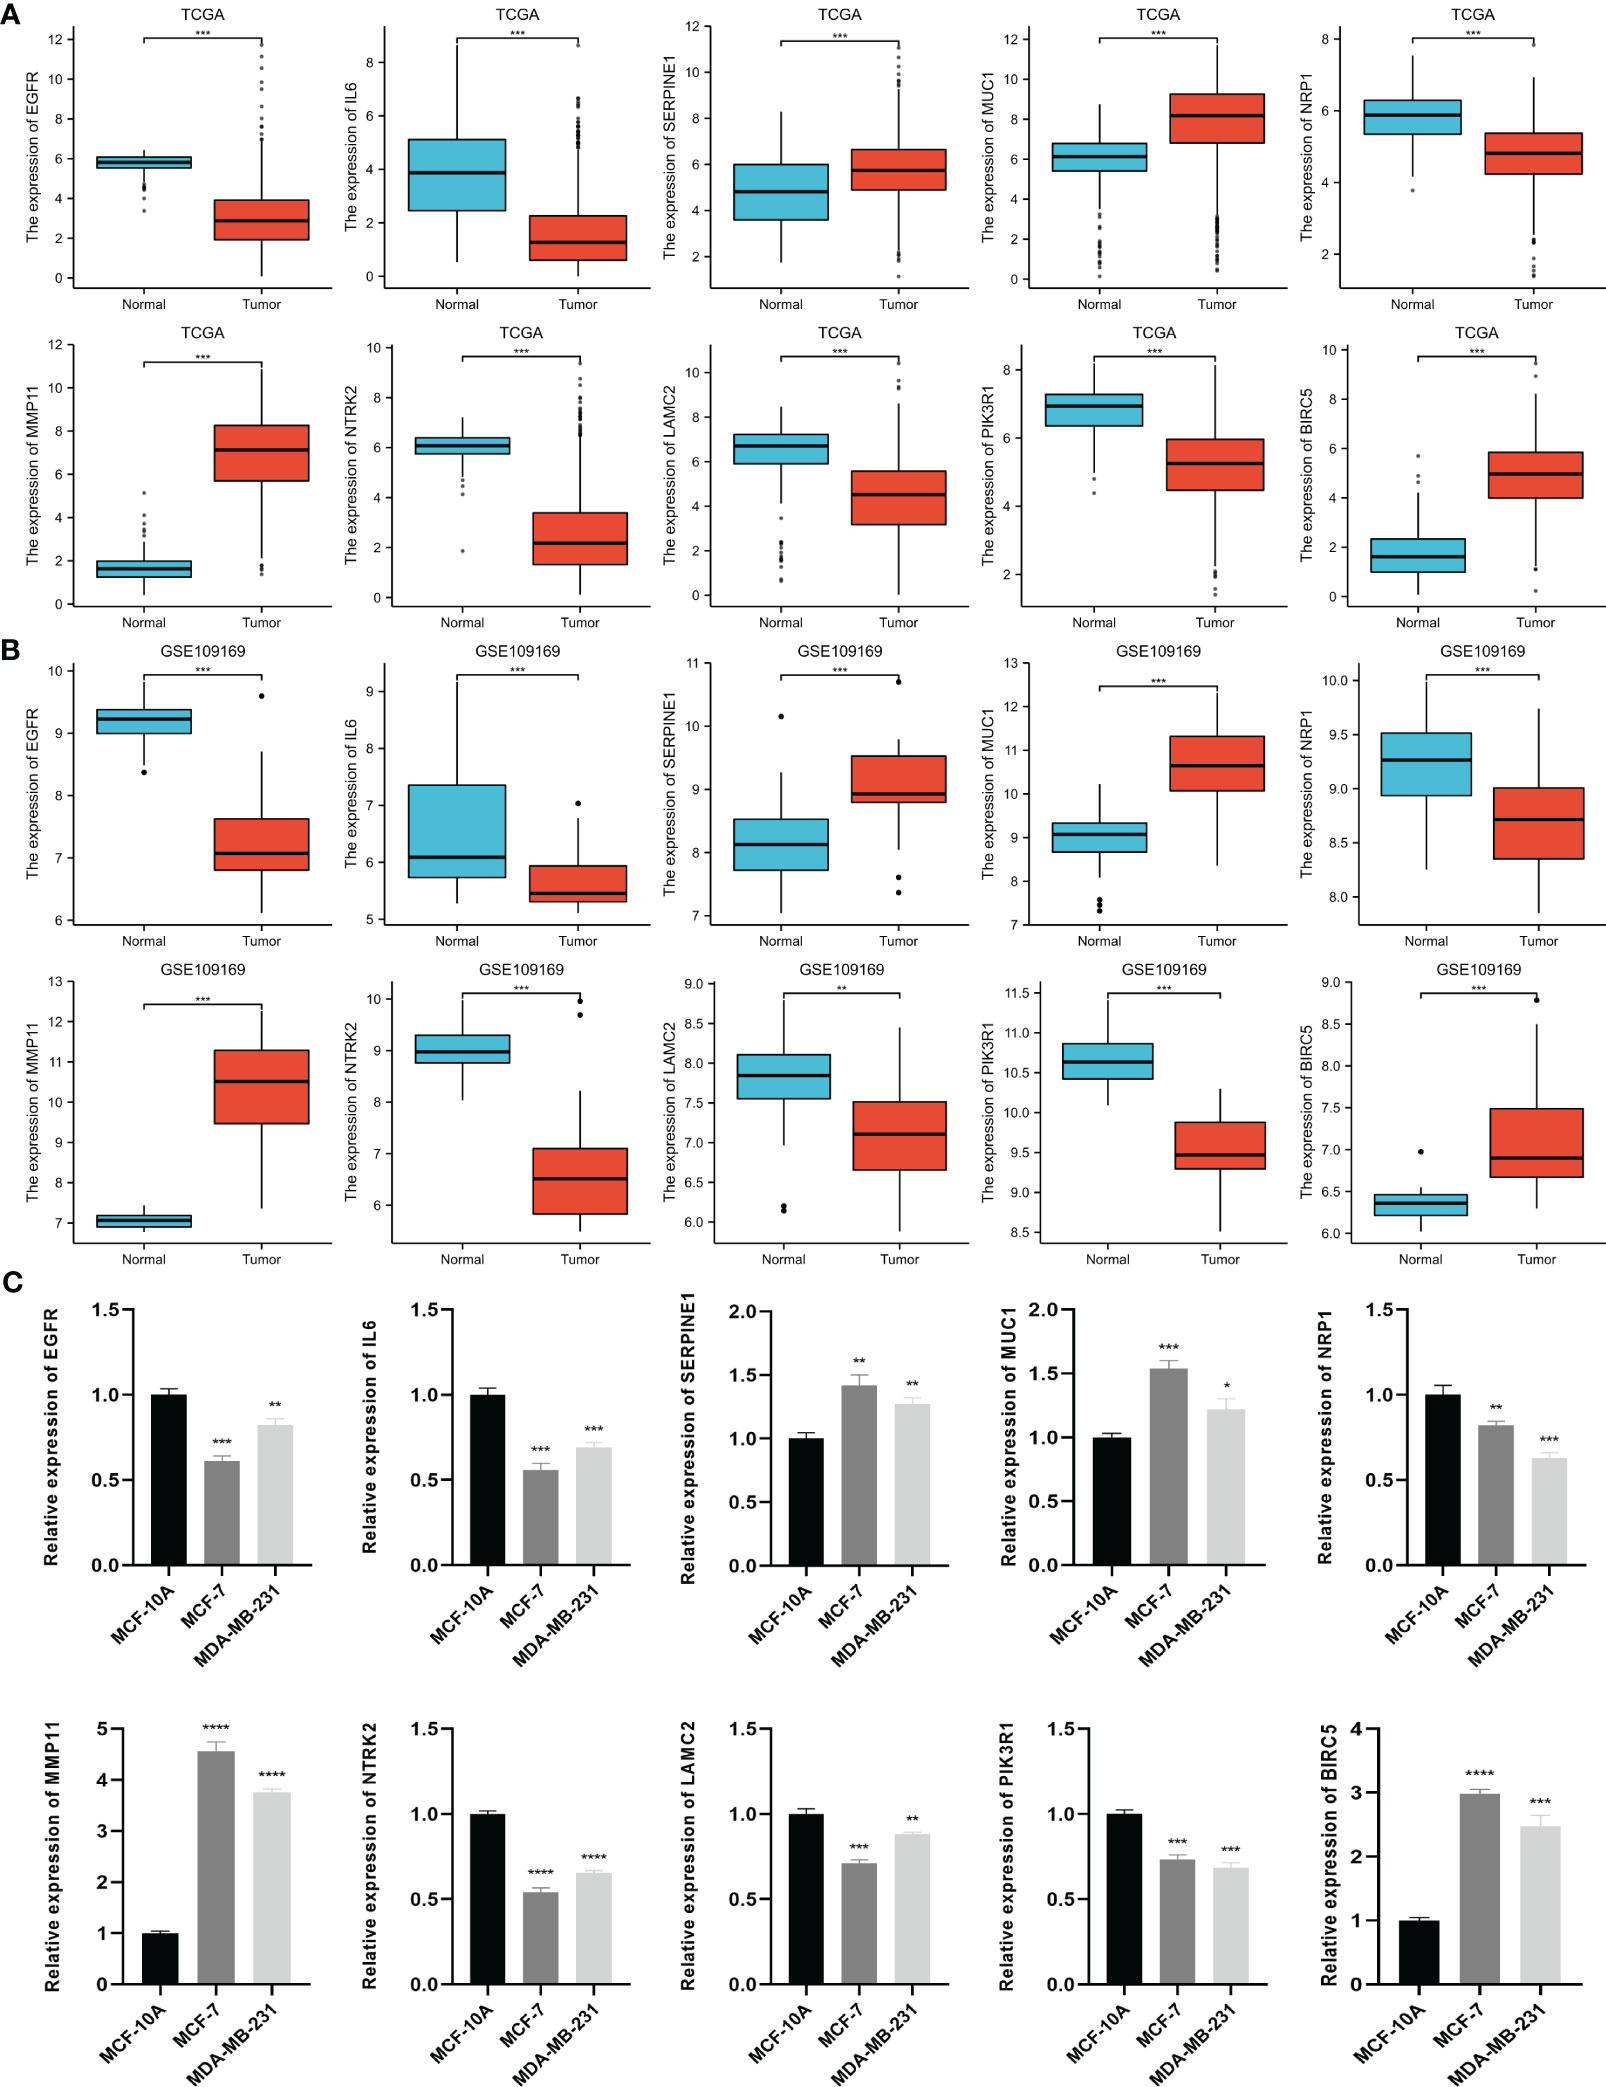
Figure 4 Differential expression of 10 ETGs in BC and normal adjacent tissues based on TCGA database (A), which are validated by the GSE109169 dataset obtained from the GEO database (B) and cell lines (C). *p< 0.05, **p< 0.01, ***p< 0.001, ****P< 0.0001.
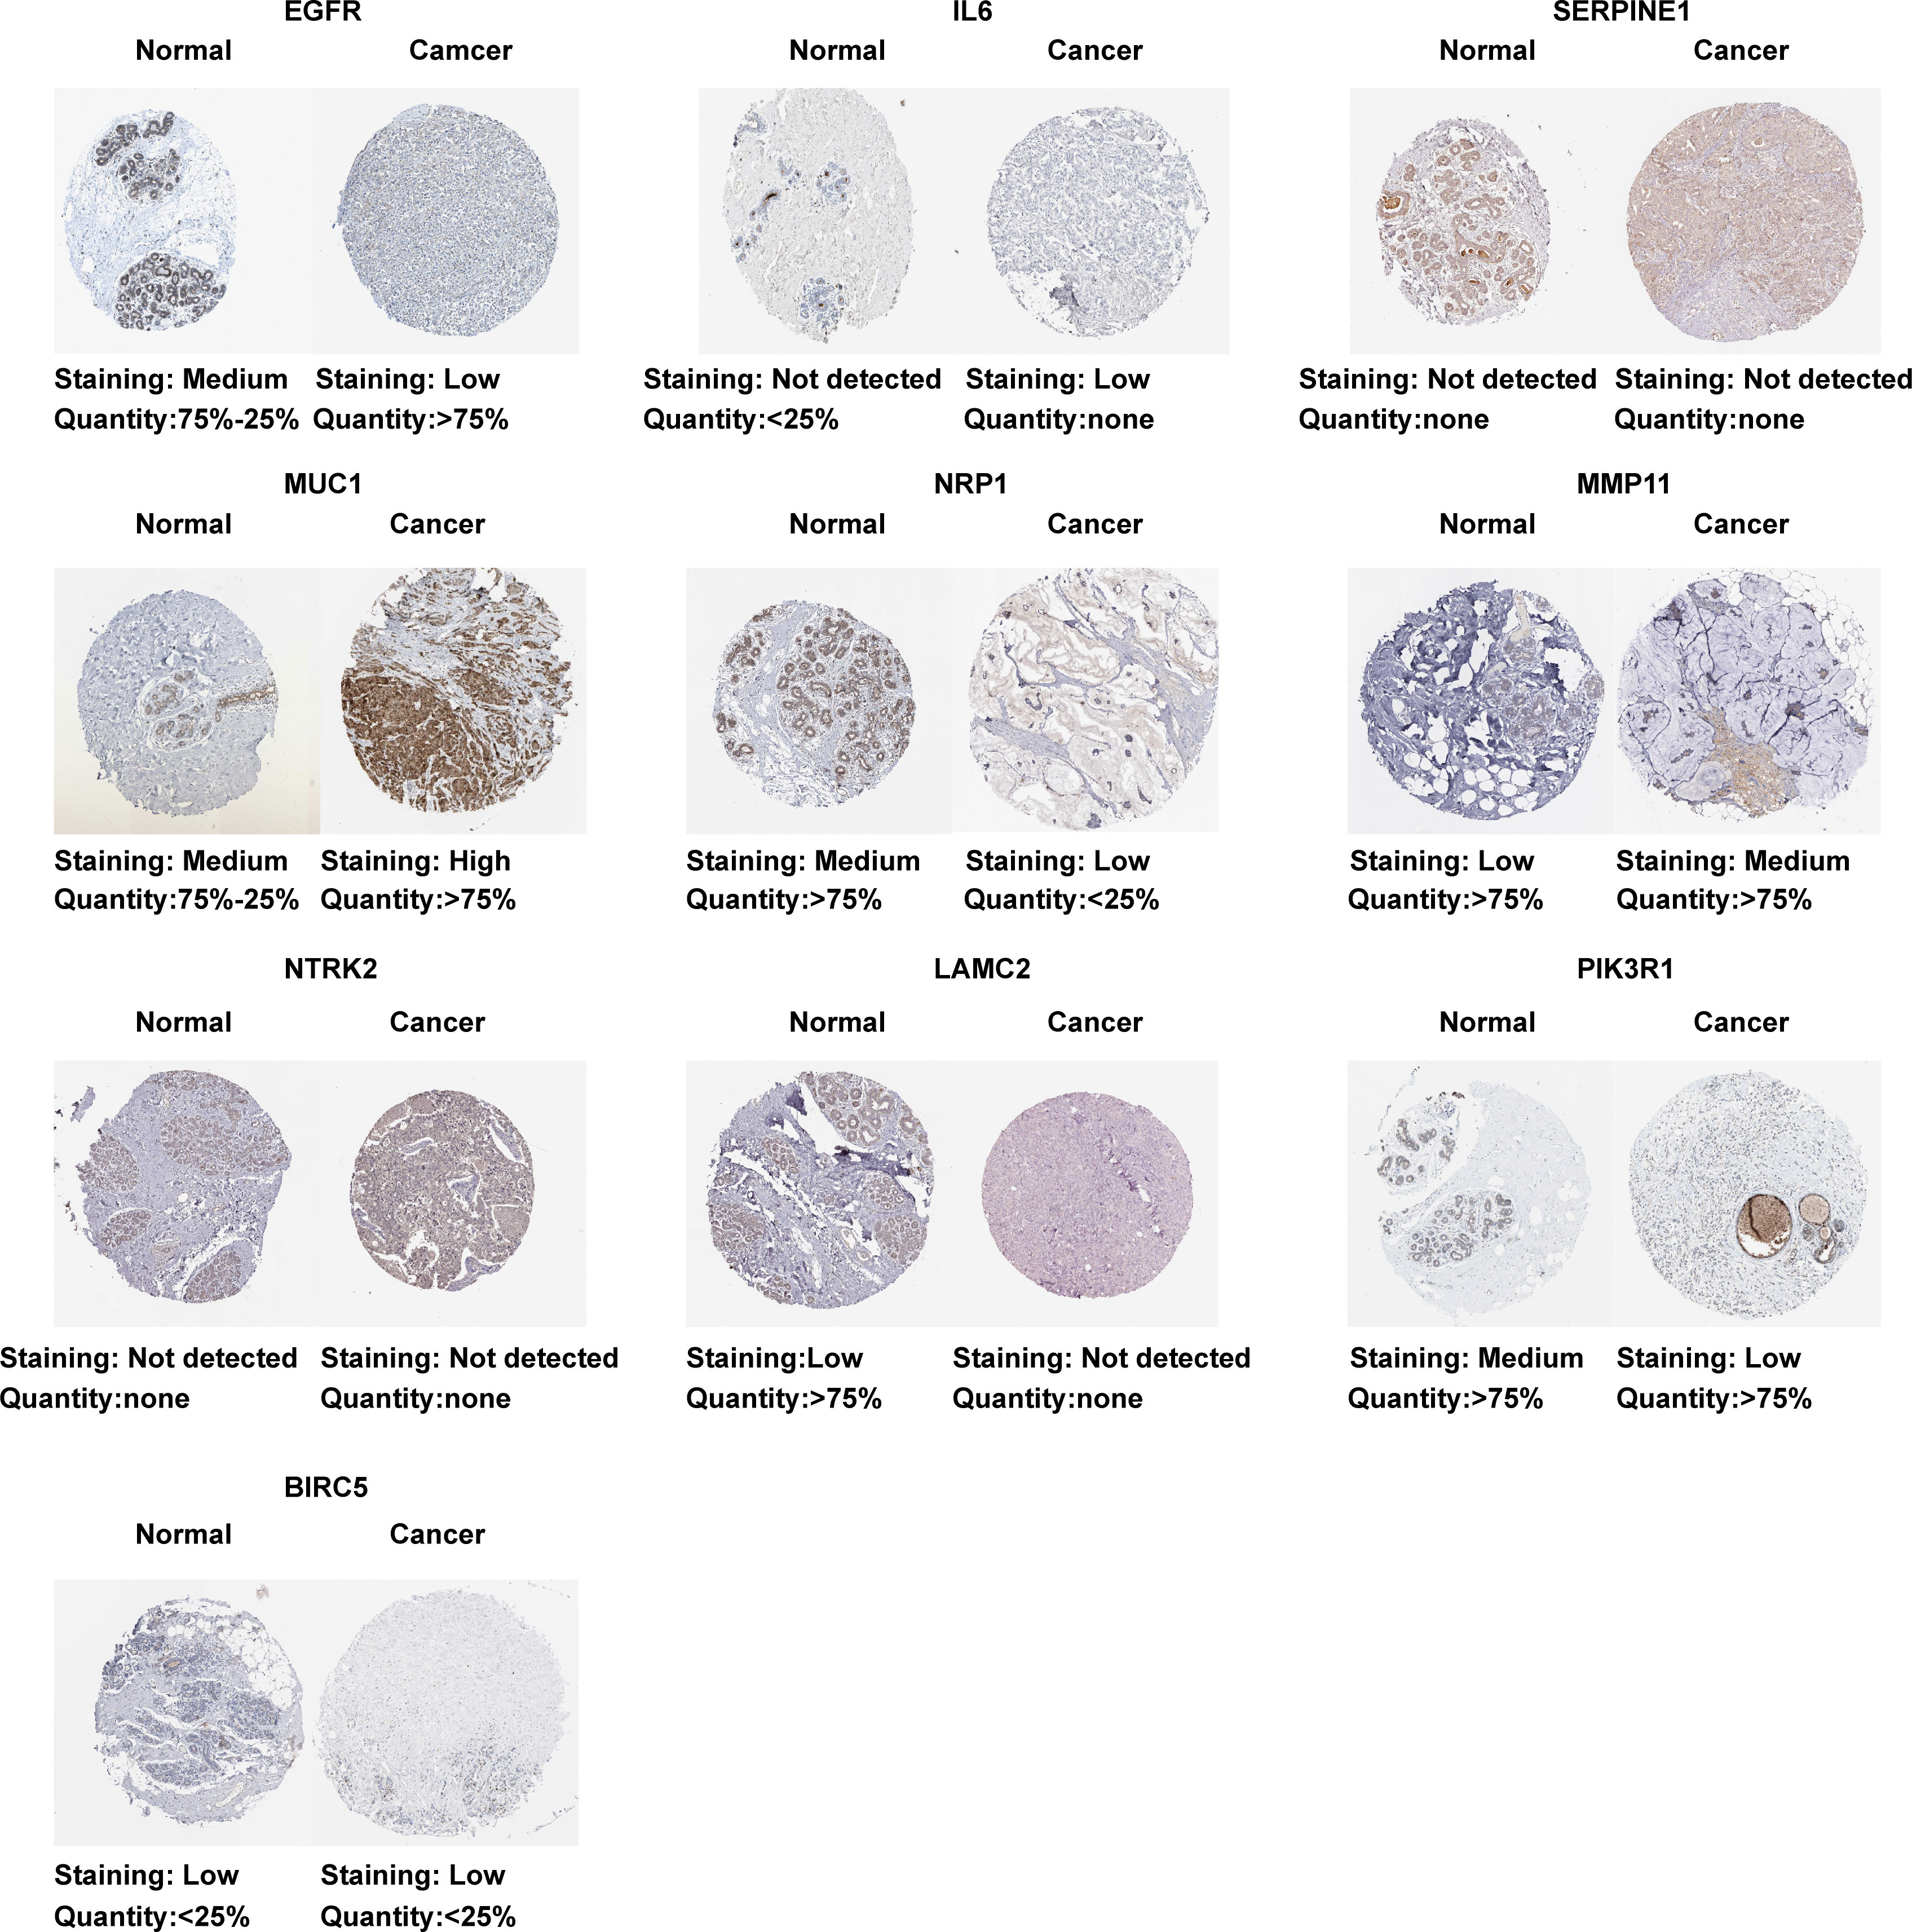
Figure 5 Protein expression of 10 ETGs. Images were obtained from the HPA database.
3.5 Diagnostic value of the up-expressed ETGs
We further evaluated the potential diagnostic values of the up-expressed ETGs for distinguishing the BC group and the normal group. As shown in Figure 6A, the ROC curve of SERPINE1 had an AUC of 0.683, with a sensitivity of 42.5% and a specificity of 86.1% when the cutoff value was 4.355. The ROC curve of MUC1 had an AUC of 0.819, with a sensitivity of 91.2% and a specificity of 67.3% when the cutoff value was 7.346. The AUC of MMP11 was 0.993, which was the highest among the up-expressed ETGs; the sensitivity and specificity were 97.3% and 95.2%, respectively, when the cutoff was 3.461. The AUC of BIRC5 was 0.955, with a sensitivity and specificity of 91.2% and 88.1%, respectively, when the cutoff was 3.379. The diagnostic values of the up-expressed ETGs were also validated in the GSE45666 dataset (Figure 6B).
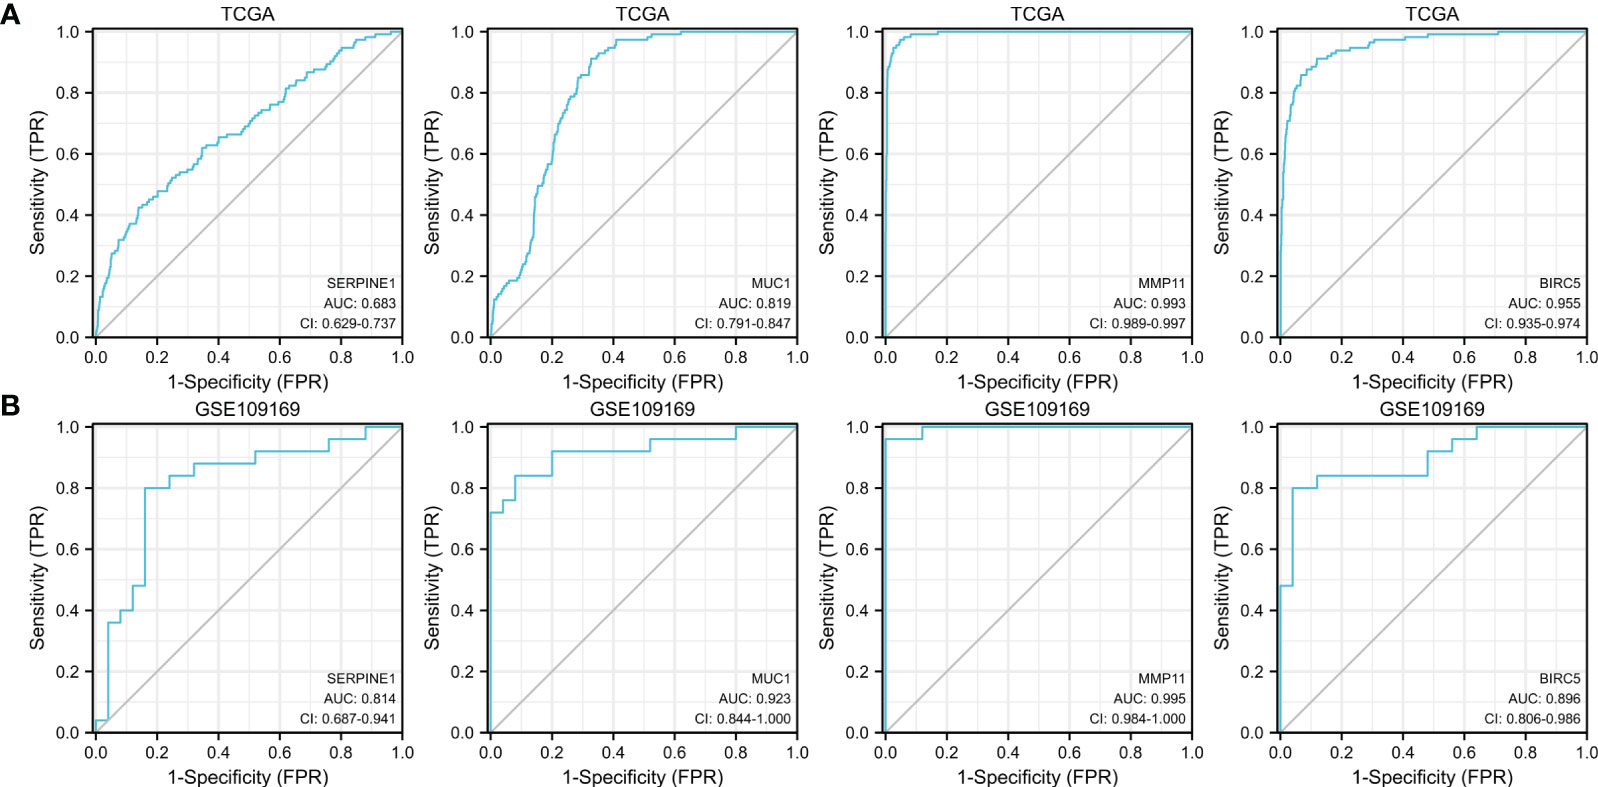
Figure 6 ROC curves show the diagnostic values of four up-expressed genes (A) and are validated by the GSE109169 dataset (B).
3.6 Clinical significance of ETGs in BC
We analyzed the correlation of ETGs expression with clinical stages and PAM50 subtypes of BC. The results suggested that most ETGs showed no significant difference among clinical stages (Figure 7A). However, the analysis in Figure 7B suggested that the expression of most ETGs was associated with PAM50 subtypes, among which EGFR, IL6, and LAMC2 tended to have a higher expression in the basal-like than others. Conversely, MMP11 and MUC1 tended to have a lower expression in the basal-like subtype. Additionally, SERPINE1, MUC1, NRP11, and NTRK2 tended to have a higher expression in luminal A BC, and the expression of BIRC5 was lower in the luminal A subtype. Interestingly, the expression of PIK3R1 in the luminal A and HER2-enriched subtypes was higher than in the luminal B and basal-like subtypes.
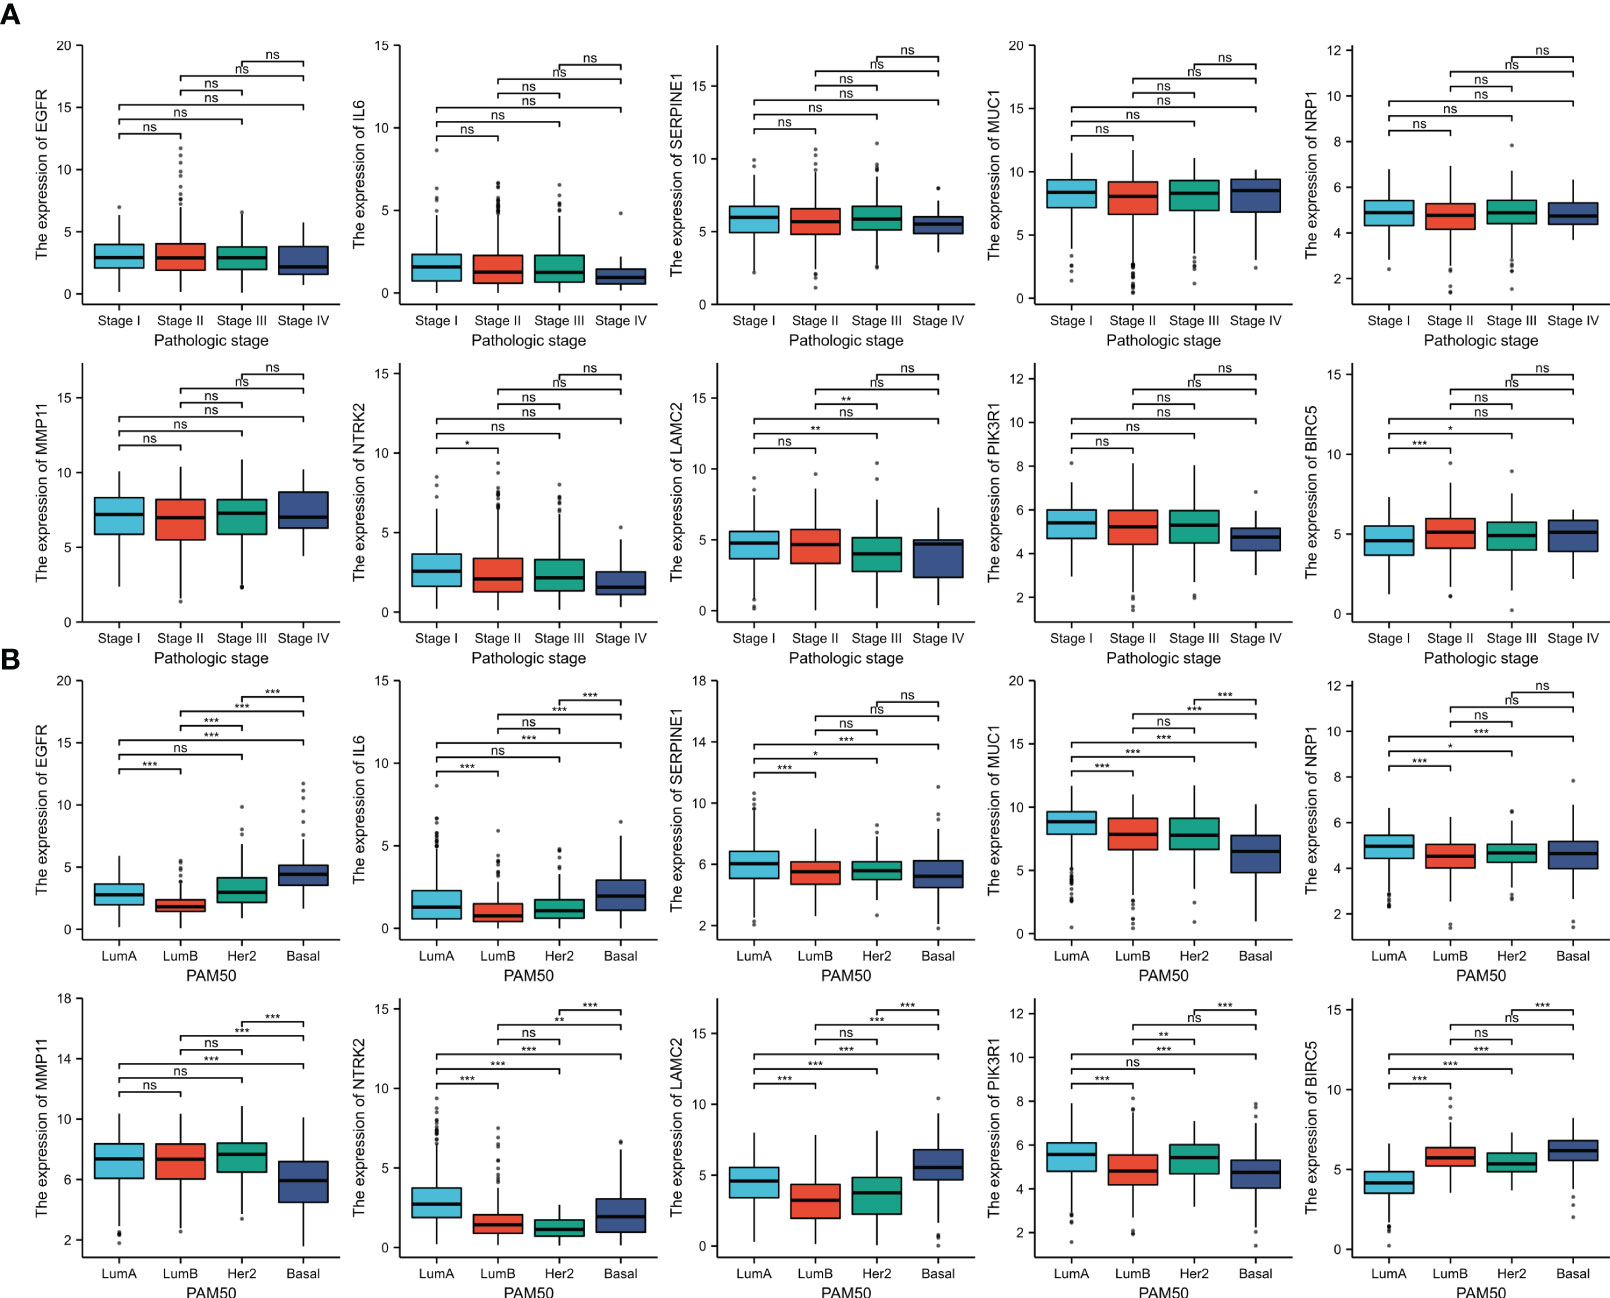
Figure 7 The association between 10 ETGs expression and pathologic stage (A) and PAM50 subtype (B). NS, indicates no statistical difference, *p< 0.05, **p< 0.01, ***p< 0.001.
3.7 Prognosis analysis of the EGTs
The KM survival curves were drawn for prognosis analysis, and the results are shown in Figure 8. We found that BC patients with higher NTRK2 expression had longer OS (HR=0.65, p=0.008) and DSS (HR=0.56, p=0.009). Interestingly, higher expression of PIK3R1 was related to shorter DSS (HR=0.56, p=0.011), but OS was not significantly different. A higher expression of BIRC5 was correlated with shorter DSS (HR=1.65, p=0.023) but not correlated with OS. The results of the KM survival curves of other ETGs were not statistically significant.
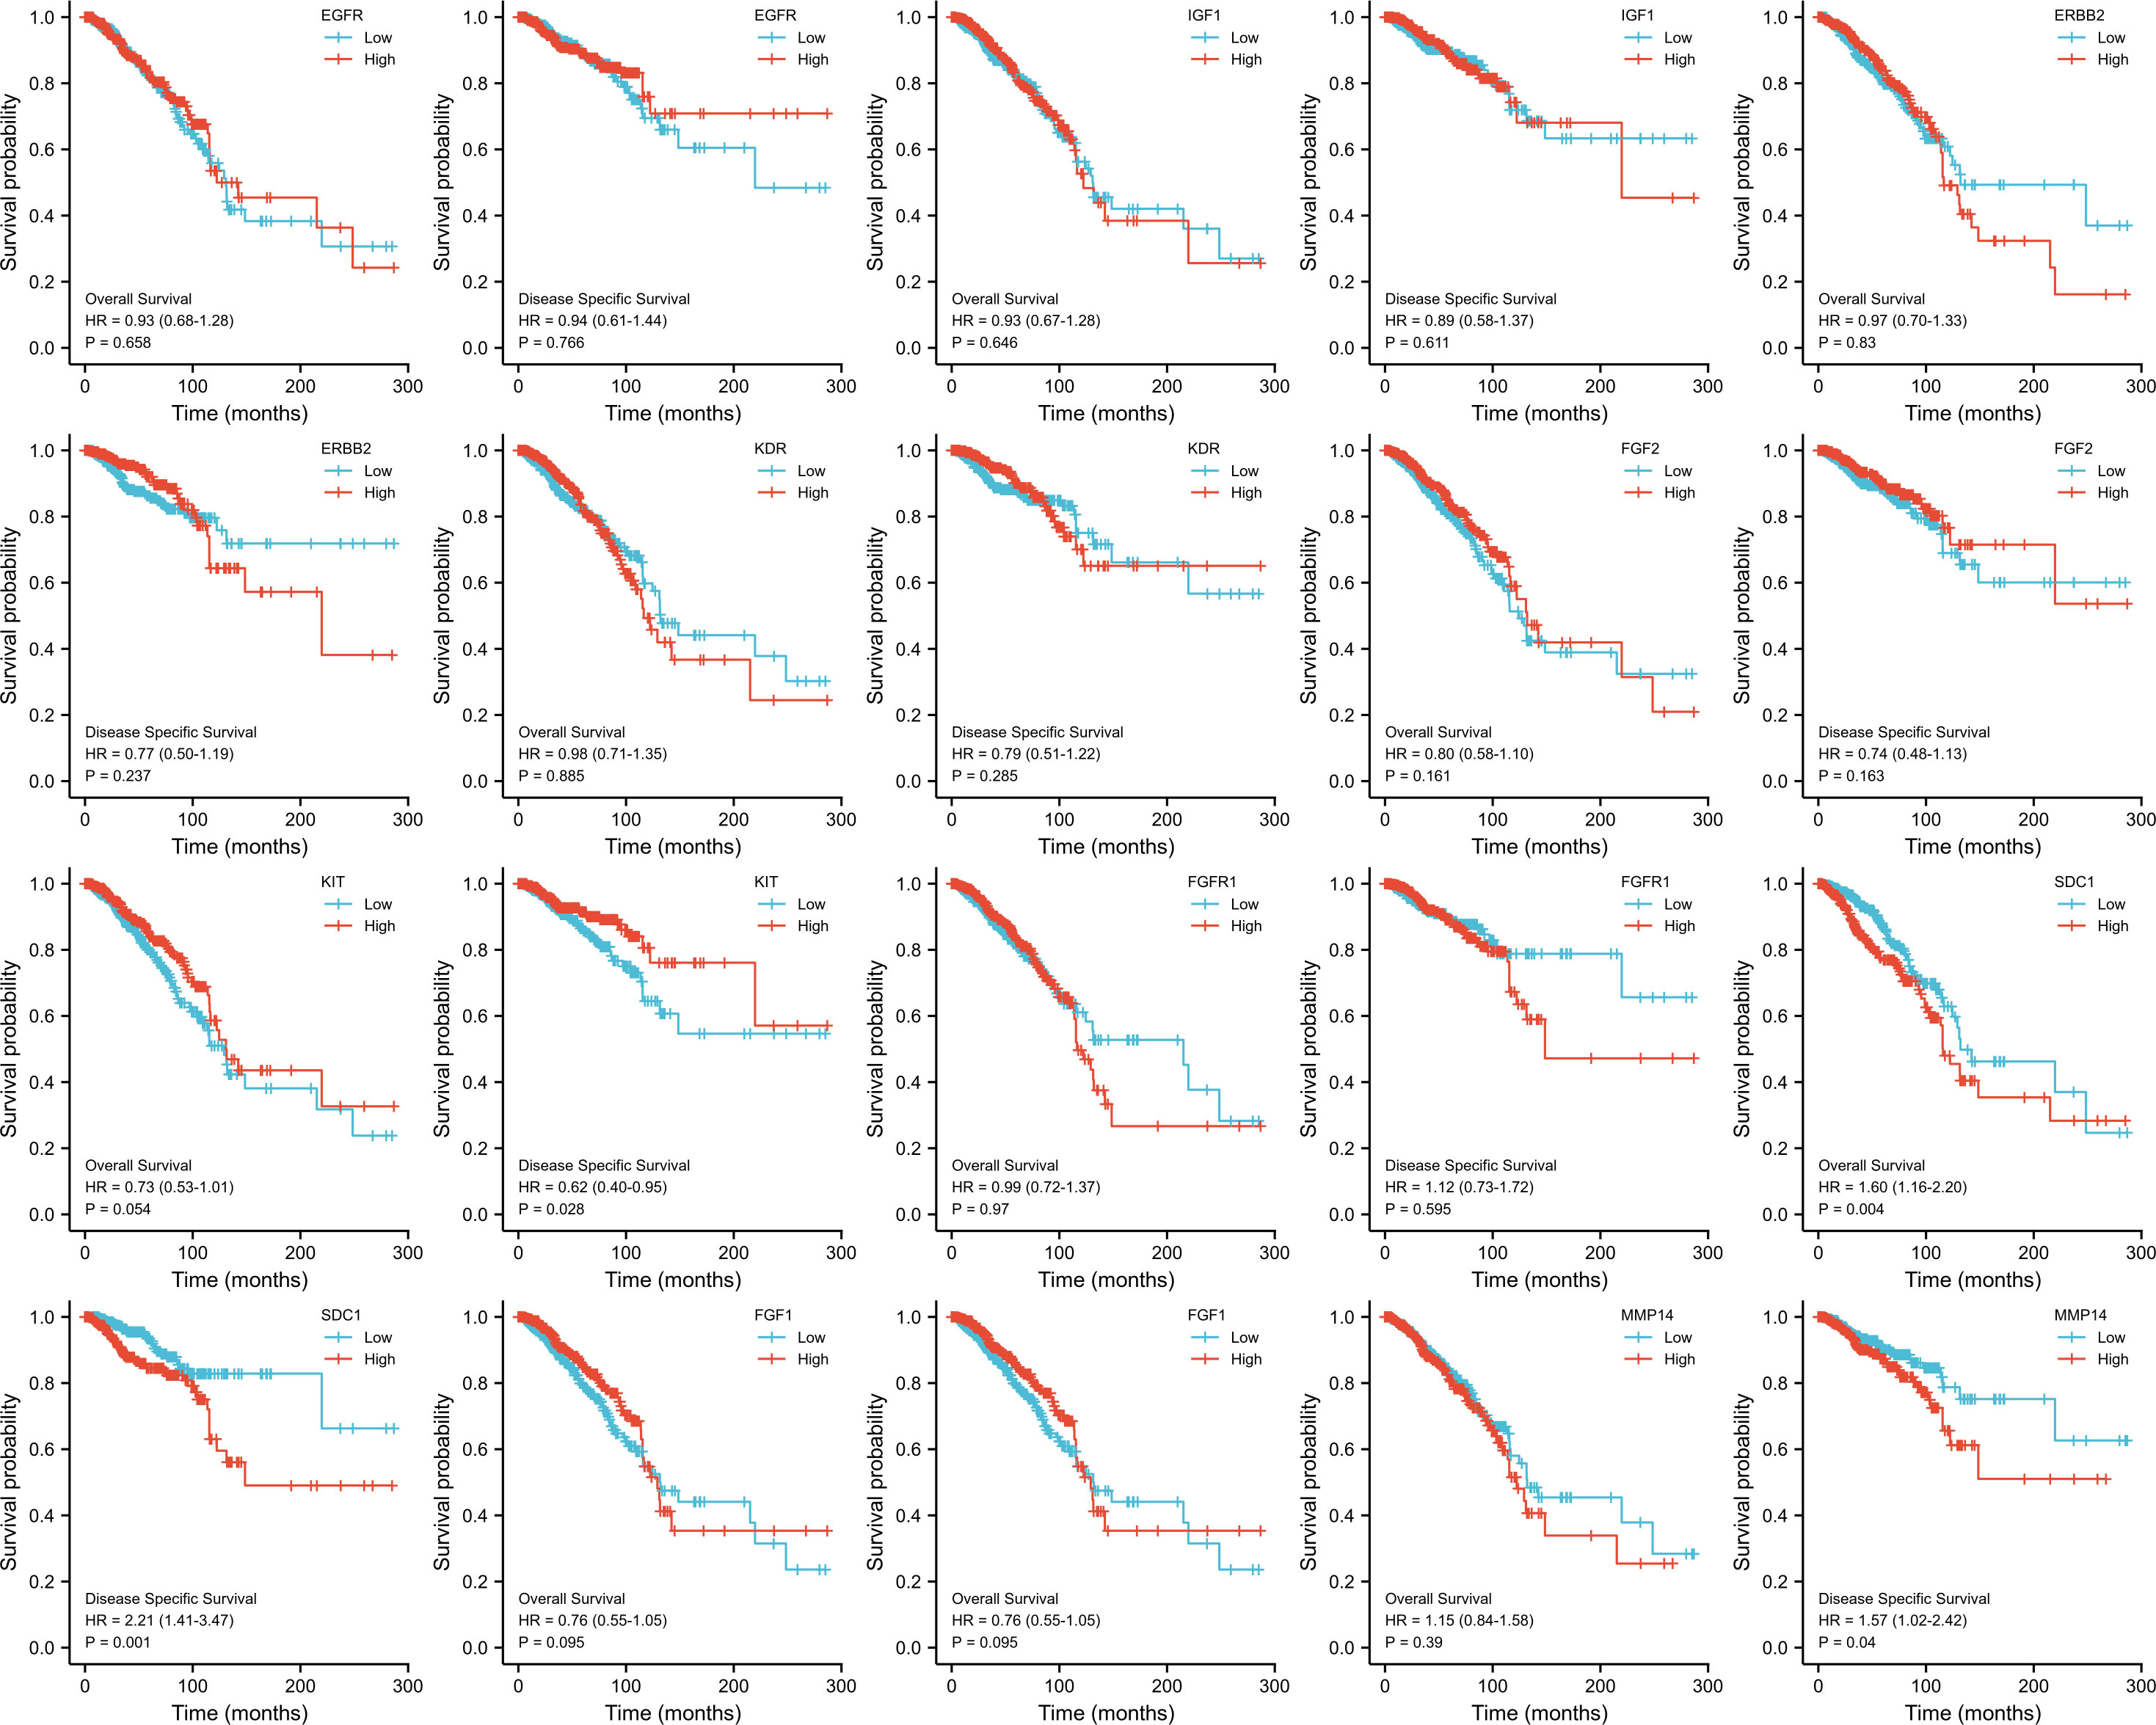
Figure 8 OS and DSS analysis of 10 ETGs based on TCGA.
3.8 Immune infiltration analysis of ETGs and miR-222-3p
The immune infiltration levels of a total of 24 immune cells in BC were analyzed. The results shown in Figure 9A suggested that most ETGs, mainly EGFR, IL6, SERPINE1, NRP1, and NTRK2, were significantly positively correlated with various infiltration of various immune cells, among which IL6 showed the highest positive correlation with activated DCs (aDCs) (r=0.322, p<0.001), B cells (r=0.463, p<0.001), CD8+ T cells (r=0.419, p<0.001), cytotoxic cells (r=0.441, p<0.001), dendritic cells (DCs) (r=0.561, p<0.001), immature DCs (iDCs) (r=0.440, p<0.001), neutrophils (r=0.515, p<0.001), NK CD56- cells (r=0.328, p<0.001), plasmacytoid DCs (pDCs) (r=0.353, p<0.001), T cells (r=0.438, p<0.001), T effector memory (Tem) cells (r=0.313, p<0.001), T follicular helper (TFH) cells (r=0.299, p<0.001), and type 1 Th (Th1) cells (r=0.505, p<0.001). However, the negative correlation between ETGs expression and immune infiltration mainly existed in MUC1 and BIRC5. Additionally, as shown in Figure 9B, the expression of miR-222-3p was positively correlated with most types of immune cells significantly, especially aDC (r=0.379, p<0.001), B cells (r=0.167, p<0.001), and macrophages (r=0.363, p<0.001). miR-222-3p expression was significantly negatively correlated with eosinophils (r=−0.267, p<0.001) and mast cells (r=−0.277, p<0.001).
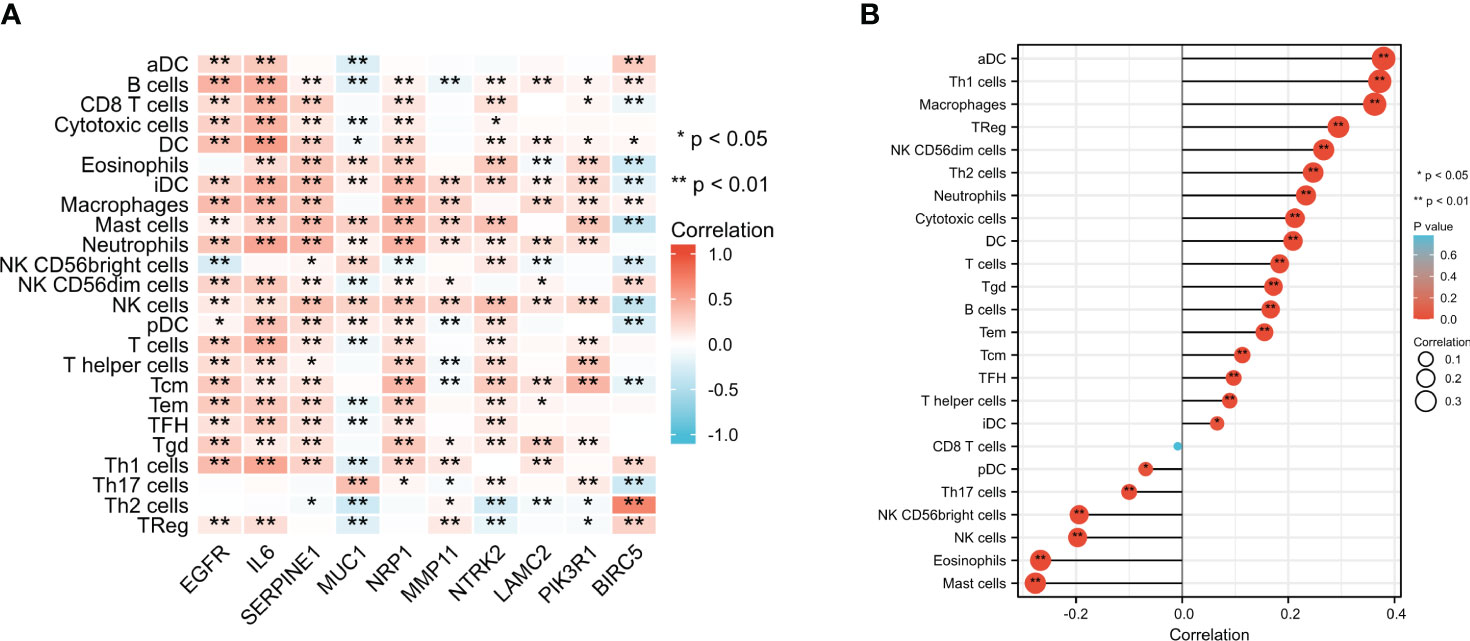
Figure 9 Comparison of infiltration levels in 24 common immune cells between low- and high-expression groups of 10 ETGs (A) and miR-222-3p (B). *p< 0.05, **p< 0.01.
3.9 Correlation with the ICGs expression
From the results shown in Figure 10A, we found that most ETGs of miR-222-3p were positively correlated with the expression of the ICGs, especially EGFR, IL6, SERPINE1, and NRP1. Interestingly, the negative correlation mainly existed between MUC1 and ICGs, which were LAG3 (r=−0.202, p<0.001), CTLA4 (r=−0.213, p<0.001), PDCD1LG2 (r=−0.125, p<0.001), TIGIT (r=−0.179, p<0.001), and PDCD1 (r=−0.157, p<0.001). Additionally, miR-222-3p showed a significant correlation with eight ICGs, which were only negatively correlated with SIGLEC15 (r=−0.230, p<0.001) (Figure 10B).
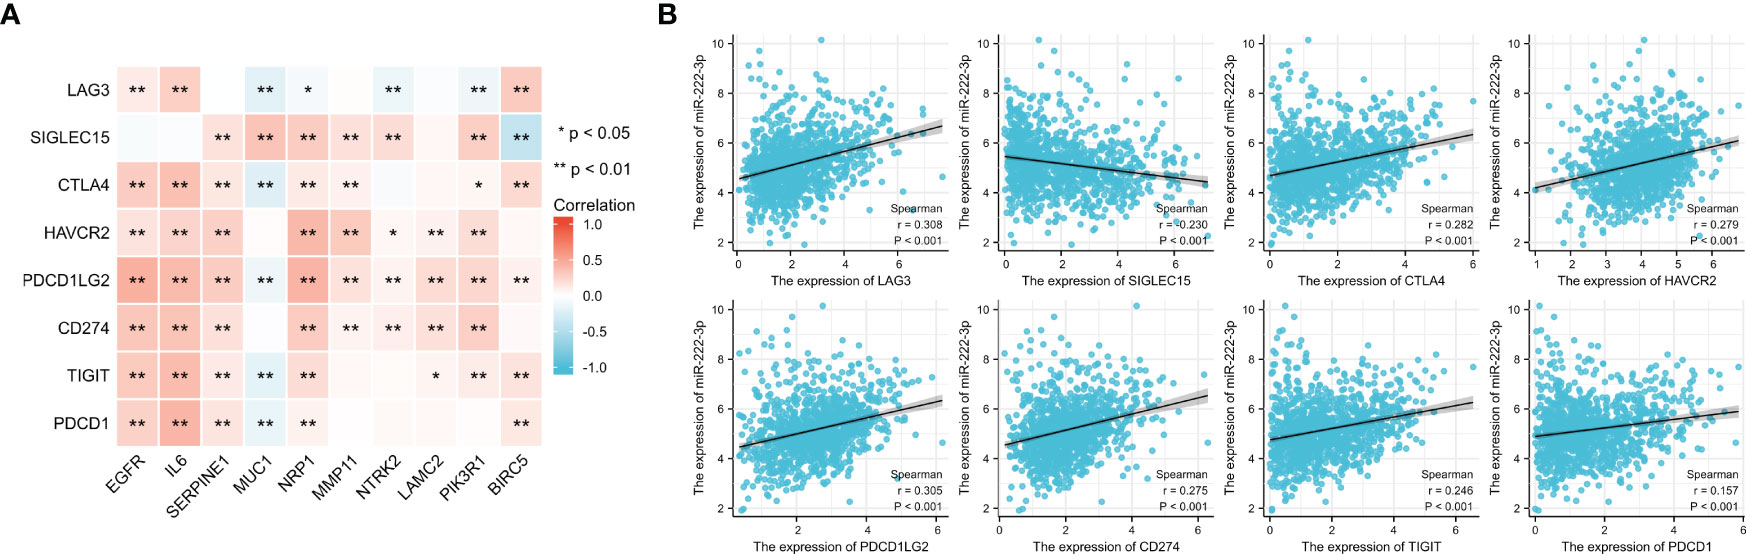
Figure 10 Correlation between 8 ICGs and 10 ETGs expression (A) and correlation between 8 ICGs and miR-222-3p expression (B). *p< 0.05, **p< 0.01.
3.10 TMB and MSI analysis
It has been suggested that patients with a high level of TMB tend to benefit from immunotherapy. Figure 11A showed the difference between high- and low-expression groups, and the results of the unpaired t-test showed that the lower TMB scores were correlated with higher expression of MUC1 (p<0.001) and NTRK2 (p<0.001), and high BIRC5 expression was associated with a higher TMB score (p<0.001). We also evaluated the association of MSI scores between high- and low-expression groups of ETGs (Figure 11B), and we found that lower expression of MUC1 (p=0.005), NTRK2 (p=0.046), and PIK3R1 (p=0.005) were associated with higher MSI scores, and higher BIRC5 expression was related to higher MSI score (p=0.019). Additionally, we found that patients with higher miR-222-3p expression tend to have higher TMB scores (p=0.001) (Figure 11C).
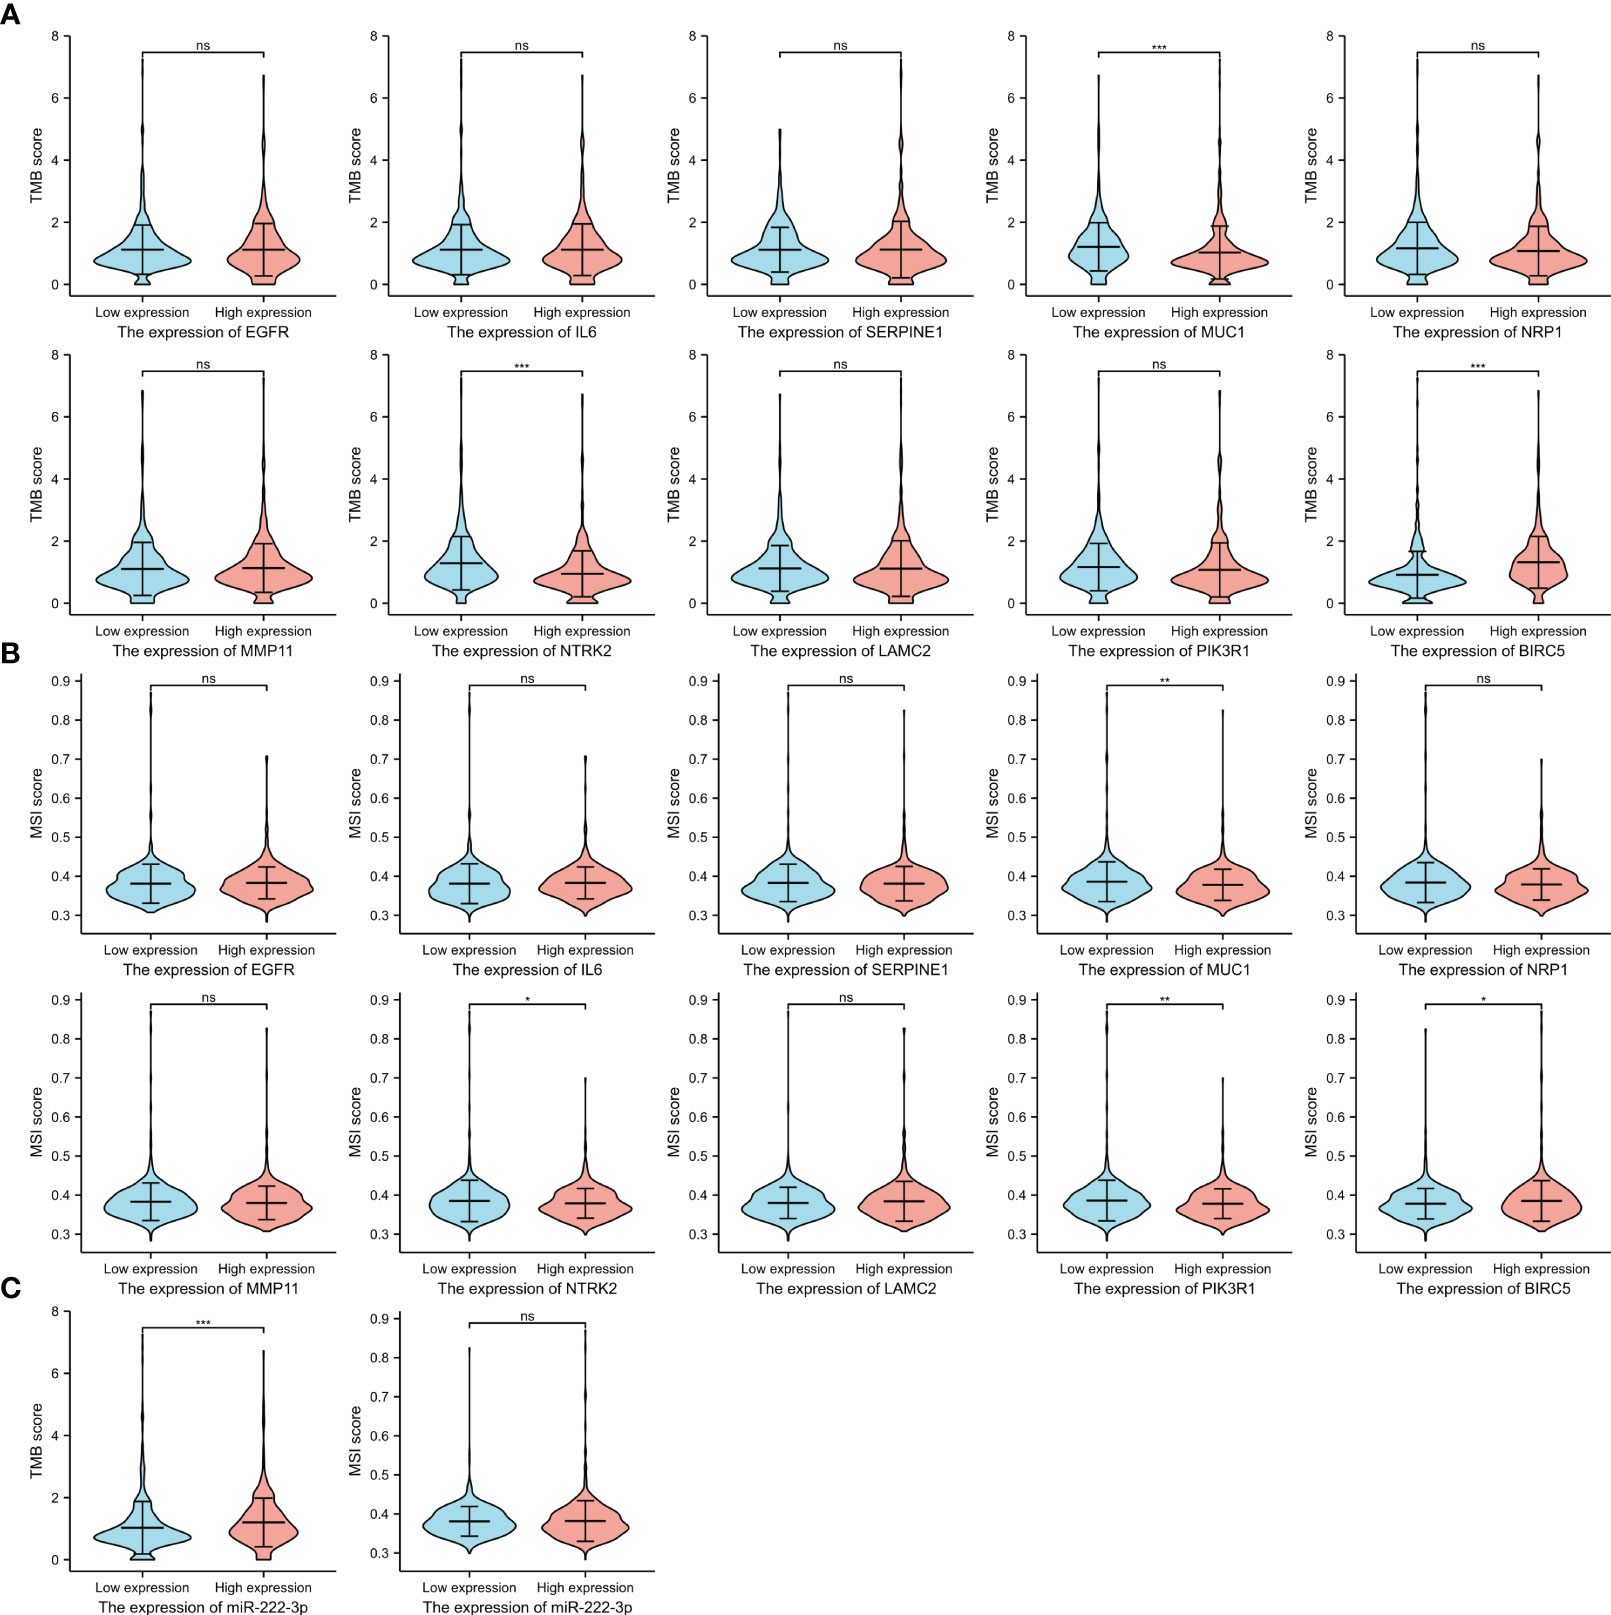
Figure 11 The TMB scores (A) and MSI scores (B) between the high- and low-expression groups of 10 ETGs. The TMB and MSI scores between the high- and low-expression groups of miR-222-3p (C). NS, indicates no statistical difference, *p< 0.05, **p< 0.01, ***p< 0.001.
3.11 Stemness analysis
We evaluated the difference in mRNAsi score between high- and low-expression groups. Figure 12 showed that higher expression of ETGs was associated with lower mRNAsi score, except BIRC5 conversely (all p<0.001). Additionally, BC patients with higher expression of mir-222-3p tend to have a higher mRNAsi level (p<0.001).
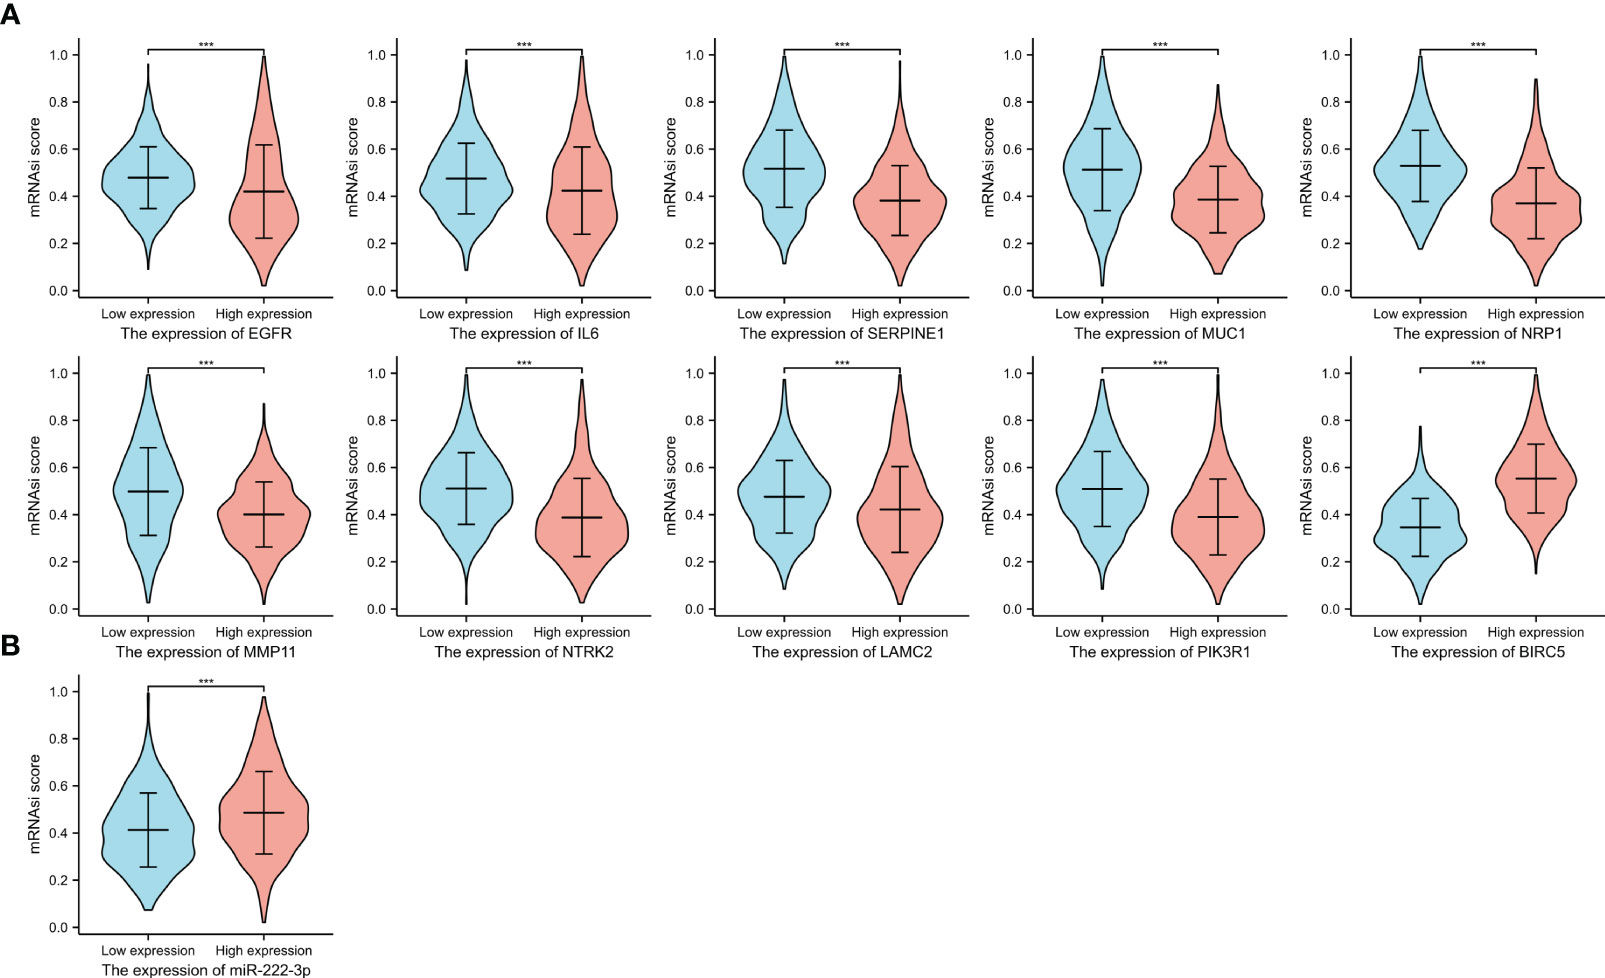
Figure 12 The mRNAsi scores between the high and low expression groups of 10 ETGs (A), and the mRNAsi scores between the high and low expression groups of miR-222-3p (B). ***, indicates P< 0.001.
3.12 Drug sensitivity analysis
The IC50 value was a value that was used to evaluate the sensitivity of drug treatment. Figure 13A showed the association between the IC50 of eight drugs and ETGs expression, from which we found that most ETGs were negatively correlated with the IC50 values. The positive correlation mainly existed between drug IC50 values and MUC1, which exhibited the highest correlation with IC50 of paclitaxel(r=0.170, p<0.001), cisplatin (r=0.313, p<0.001), and tamoxifen (r=0.203, p<0.001). In addition, in Figure 13B, we found that seven drug IC50 were negatively correlated with miR-222-3p expression (all p<0.001), and only the IC50 value of lapatinib was positively correlated with miR-222-3p expression (r=0.201, p<0.001).
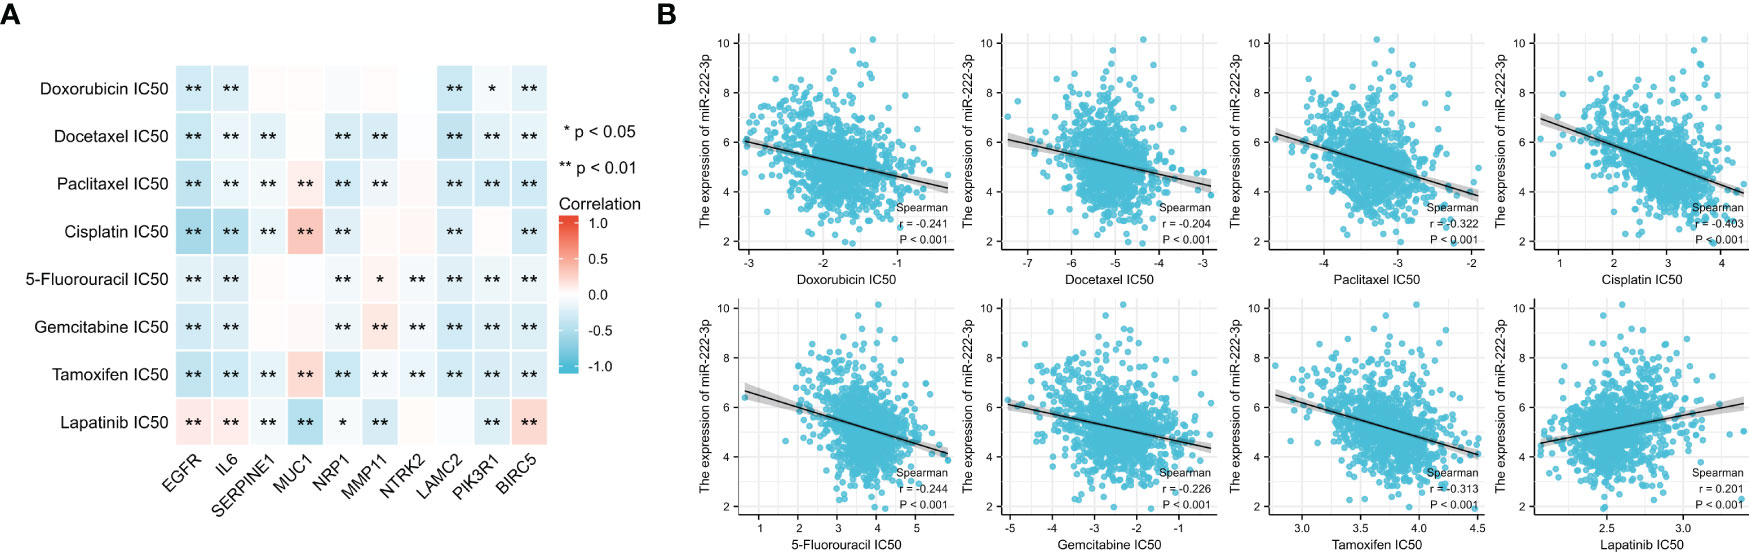
Figure 13 The association between the IC50 of eight drugs and ETGs expression (A), and the association between the IC50 of eight drugs and miR-222-3p expression (B). *p< 0.05, **p< 0.01.
3.13 Genetic alteration of ETGs
The analysis of genetic alteration of the ETGs shown in Figure 14A suggested that amplification was the main genetic alteration of nine ETGs except for NTRK2 and PIK3R1. The genetic alteration rate of MUC1 was highest among 10 ETGs, up to 10%. There was no difference between the ETGs altered group and the unaltered group in OS (Figure 14B), but the DSS of the unaltered group was longer than that of the altered group (p<0.05) (Figure 14C). The median months overall (95% CI) of NRP1, MMP11, NTRK2, and BIRC5 were not applicable; thus, we analyzed the OS of the unaltered group and the ETGs-altered groups of EGFR, IL6, SERPINE1, MUC1, LAMC2, and PIK3R1 (Figure 14D). The median months overall (95% CI) of the unaltered group was 146.50, which was longer than that of six ETG-altered groups.
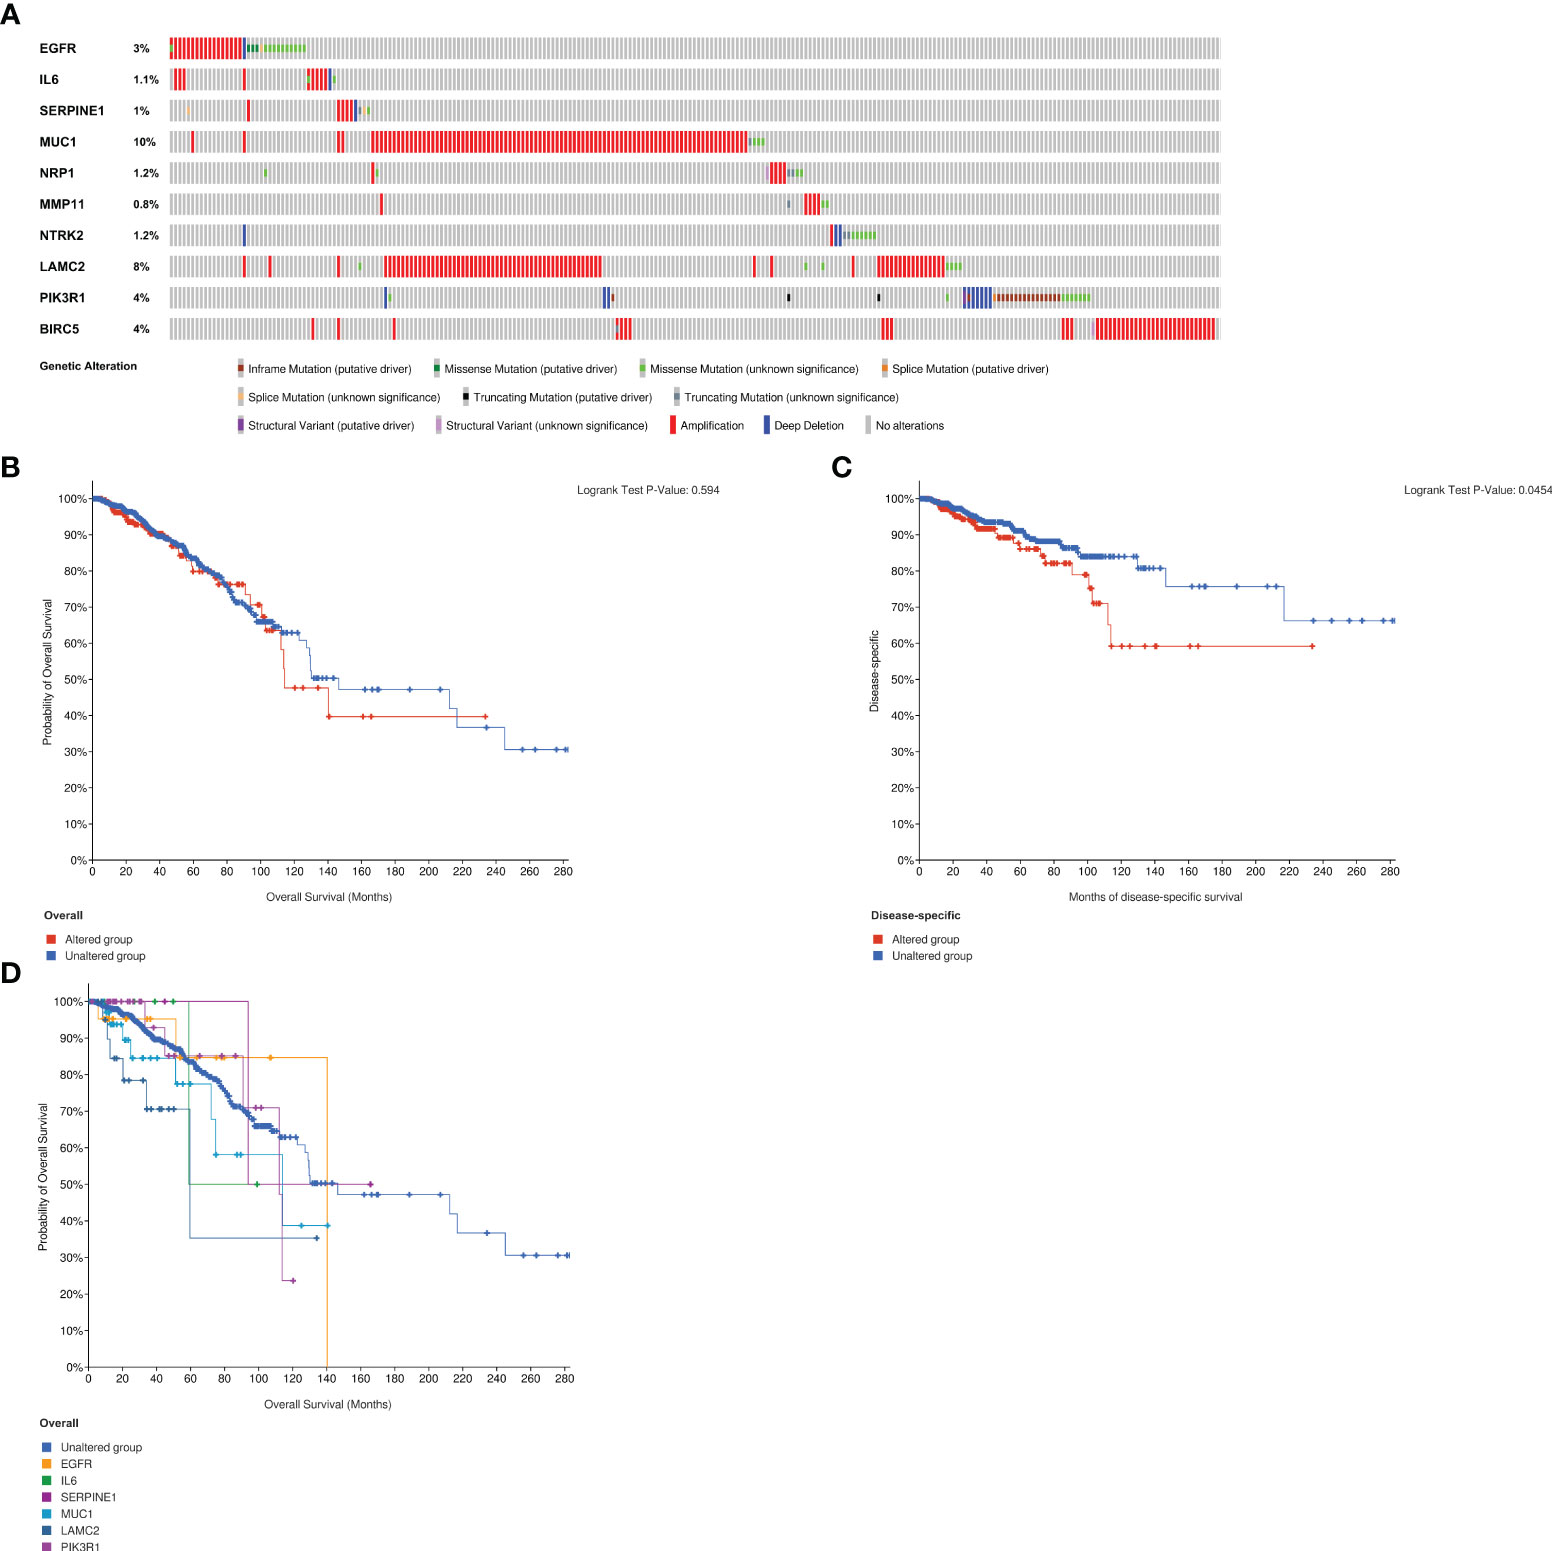
Figure 14 Analysis of genetic alteration of 10 ETGs (A). The KM survival curves show the OS and DSS between the ETGs altered group and the unaltered group (B, C). The KM survival curve shows the OS of the ETGs-unaltered group and the ETGs-altered groups of EGFR, IL6, SERPINE1, MUC1, LAMC2, and PIK3R1 (D).
4 Discussion
While the prognosis for patients diagnosed with early-stage BC is generally favorable, the treatment of metastatic breast cancer poses a significant challenge to public health due to its unfavorable prognosis. The process of EMT plays a critical role in tumor metastasis (5) and has garnered increasing attention in recent years. Recent research has demonstrated that multiple microRNAs are involved in the progression of BC by regulating EMT through different signaling pathways mediated by various transcription factors, thereby disabling tumor-suppressing or tumor-promoting effects, which might also be served as therapeutic molecules for the treatment of BC (11, 26). Prior research has demonstrated that miR-222-3p functions as a regulator of EMT in BC (14, 15, 27). The present investigation employs bioinformatic analysis to identify 10 fundamental ETGs of miR-222-3p for further investigation of the underlying regulatory mechanisms.
The current investigation utilized the TCGA database to conduct an analysis, which revealed that miR-222-3p exhibited a comparatively reduced expression level in contrast to normal paracancerous tissues. This finding was subsequently confirmed through qRT-PCR in MCF-7 cell lines. Nevertheless, prior research has indicated that miR-222-3p tends to exhibit a relatively elevated expression in BC tissues (28, 29). The incongruity in the outcomes can be primarily attributed to the limited sample size and regional disparities in the selection of BC patients, predominantly in Asia, in the earlier studies. Our findings indicate a significant elevation in miR-222-3p expression in MDA-MB-231 cell lines. Furthermore, the PAM50 subtype analysis revealed that miR-222-3p exhibited significantly higher expression in the basal-like subtype compared to other BC subtypes and normal tissues, which is consistent with previous studies (14, 15, 30). The AUC of the ROC curve for distinguishing basal-like BC and other subtypes was 0.819, suggesting that miR-222-3p may be serve as a specific biomarker of basal-like BC. Furthermore, the clinical implications of miR-222-3p indicate that its heightened expression is inversely correlated with negative status of ER, PR, and HER2 statuses. Specifically, research has demonstrated that miR-222-3p overexpression directly inhibits ER translation, while ER can suppress miR-222-3p expression by enlisting the nuclear receptor corepressor (NCoR) and thyroid hormone receptor (SMRT) (31). However, the mechanism of interaction between miR-222-3p and PR or HER2 remains unexplored. In addition, our survival analysis revealed that breast cancer patients exhibiting elevated expression levels of miR-222-3p were more likely to experience a poorer prognosis, thus providing further evidence that heightened miR-222-3p expression is linked to increased invasion in BC. Notably, our study also demonstrated, for the first time, that miR-222-3p expression is correlated with a broad range of immune cell infiltration and ICGs, suggesting that it may play a role in regulating the immune microenvironment during the progression of BC. TMB was proposed for efficacy predictions of immunotherapy as a marker (32), and our analysis revealed that BC patients who exhibit elevated expression levels of miR-222-3p may experience greater advantages from immunotherapy. Additionally, our findings indicate a positive correlation between miR-222-3p expression and mRNAsi scores, which suggests that BC patients with high expression of miR-222-3p are more likely to have lower degrees of differentiation and higher levels of cell stemness.
In order to gain a deeper comprehension of the fundamental mechanisms governing the EMT process, a set of 38 genes associated with EMT were identified as the potential targets of miR-222-3p. Through pathway enrichment analysis reveal, it was determined that miR-222-3p may regulate EMT via the PI3K-Akt and HIF-1 signaling pathways. Previous research has indicated that the activated PI3K-Akt signaling pathway plays a direct role in inducing EMT by upregulating the expression of Snail and phosphorylated Twist and also collaborates with other signaling pathways to facilitate EMT either directly or indirectly during the progression of cancers (33). Moreover, it has been demonstrated that the upregulation of hypoxia-inducible factor 1 (HIF-1) in breast cancer is linked to metastasis as an EMT activator through the mediation of EMT-related signaling pathways, transcription factors, and inflammatory cytokines (34). In this study, we constructed the PPI network of 38 EMT-related genes and subsequently identified 10 top hub genes as the ETGs of miR-222-3p for further research.
Epidermal growth factor receptor (EGFR) is a transmembrane protein with tyrosine kinase activity that governs cellular functions, and miR-222-3p has been reported as a downstream modulator of the EGFR signaling pathway that regulates EMT as a promotor (35, 36). In this investigation, the top core ETG of miR-222-3p was identified as EGFR, and a positive correlation of expression between the two was established. This suggests the possibility of a positive feedback loop between activated EGFR and upregulated miR-222-3p, which may promote EMT in BC. Interestingly, our findings indicate that the EGFR expression in BC tissues is lower than that of normal adjacent tissues. Previous studies have reported that EGFR overexpression was detected in only 15%–30% of BC but at least half of basal-like BC (36, 37). Our investigation also found that EGFR expression in basal-like BC was significantly higher than in other subtypes, revealing that the overexpression of which is associated with BC invasion. Furthermore, our investigation revealed a positive correlation between elevated EGFR expression and a majority of immune cell infiltrates and ICGs, indicating that individuals with basal-like BC who exhibit high EGFR expression may derive greater therapeutic benefit from immune checkpoint inhibitor therapy. Recently, the advent of EGFR-targeted chimeric antigen receptor T cell therapy has shown promising results in treating Basal-like BC (38). These findings underscore the potential of EGFR as a viable therapeutic target for basal-like BC.
Interleukin-6 (IL6) is a pro-inflammatory cytokine that is secreted by different cell types and is known to modulate the growth and differentiation of BC (39, 40). Studies have shown that adipocyte-secreted IL-6 can induce EMT in BC by triggering signal transducer and activated of transcription 3 (STAT3) (41). Interestingly, our analysis revealed that IL6 exhibited the strongest positive correlation with many types of immune cell infiltration across multiple ETGs, suggesting its potential role in immune modulation within the tumor microenvironment. Actually, immune cells in the tumor microenvironment of most cancers were regulated by IL6 to promote chronic inflammation to help angiogenesis for tumors (42).
Serine protease inhibitor clade E member 1 (SERPINE1), also known as PAI1, is an inhibitor of the plasminogen/plasminase system, the upregulation of which was identified as a biomarker for predicting poor outcome and associated with the EMT process in BC (43, 44). Our findings indicate that the expression of SERPINE1 was higher in BC tissues, particularly in luminal A BC. However, we did not observe a significant association between SERINE1 expression and prognosis, although the high-expression group tended to have a worse prognosis but without statistical significance. It has been reported that BC patients with high levels of SERPINE1 may benefit from adjuvant chemotherapy (43). In our study, we found a negative correlation between SERPINE1 expression and IC50 values of docetaxel, paclitaxel, cisplatin, tamoxifen, and lapatinib, suggesting that BC patients with high levels of SERPINE1 might receive a better treatment effect of chemotherapy.
Mucin 1 (MUC1), also known as CA15-3, is a transmembrane heterodimeric glycoprotein that is aberrantly overexpressed in BC and serves as a serum diagnostic biomarker for BC (45, 46). In the present study, we evaluated the diagnostic value of the elevated MUC1 expression and found it to be favorable, with a sensitivity of 91.2% and a specificity of 67.3%. Previous research has demonstrated that MUC1 can facilitate IGF-1-induced EMT in the MCF-7 breast cancer cell line and induce tamoxifen resistance in ER-positive BC patients (47), and we found the high expression of MUC1 was related to high drug sensitivity of tamoxifen, cisplatin, and paclitaxel. Furthermore, the TCGA dataset revealed a negative correlation between the expression of MUC1 and ICGs and TMB score in patients with breast cancer, indicating that those with low MUC1 expression may derive greater benefit from immunotherapy. Despite extensive research on MUC1-based immunotherapy over the past few decades, its efficacy remains limited by factors such as the presence of diverse isoforms and immunosuppression (48).
Neuropilin 1 (NRP1) is a transmembrane glycoprotein that contributes to cancer development by inducing EMT through various signaling pathways (49, 50). Moreover, it has been reported that NRP1 is expressed on human pDCs, which contributes to priming immune responses (51), and a positive correlation between NRP1 expression and pDCs immune infiltrate was found in our study. NRP1-mediated immune modulation in cancer has garnered significant attention in recent years (52), and we found that its expression was associated with ICGs, suggesting that it was a promising checkpoint target in BC immunotherapy.
As a member of the matrix metalloproteinase (MMP) family, MMP11, also termed stromelysin 3, is overexpressed in BC tissues and BC cell lines, promoting tumor cell proliferation (53, 54). The available evidence suggests that miR-125a directly targets MMP11, resulting in downregulation and subsequent suppression of EMT and migration and invasion in osteosarcoma and hepatocellular carcinoma (55, 56). However, the mechanism by which MMP11 is involved in EMT in BC has yet to be reported. Our study is the first to demonstrate a strong correlation between MMP11 expression and immune cells, ICGs expression, stemness, and drug sensitivity. Furthermore, we have identified MMP11 as a potentially valuable diagnostic marker, with an AUC of 0.993 in the diagnostic ROC curve, with a sensitivity and specificity of 97.3% and 95.2%, respectively. Prior studies have indicated that the combination of MMP11 and Doppler ultrasound may enhance the diagnostic efficacy for early-stage BC patients (57). These findings propose that MMP11 could serve as a potential biomarker for precise diagnosis in BC, which deserves our further in-depth study.
Neurotrophic receptor tyrosine kinase 2 (NTRK2), also referred to as KRKB, is a constituent of the neurotrophic tyrosine kinase receptors family, serving as a regulator that facilitates EMT by activating PI3K/AKT and IL6/JAK2/STAT3 signaling pathways to foster tumor metastasis (58). Interestingly, while prior evidence has established a correlation between the upregulation of NTRK2 and its main ligand brain-derived neurotrophic factor (BDNF) with the advancement of cancer progression (59), our current study has yielded contradictory results. Specifically, the expression of NTRK2 was observed to be lower in BC tissues, and patients exhibiting high levels of NTRK2 expression demonstrated a more favorable prognosis, suggesting that NTRK2 may play a defensive role in the BC progression. One plausible hypothesis is that NTRK2 may be involved in the recruitment of immune cells within the tumor microenvironment. Our investigation revealed a positive correlation between NTRK2 expression and heightened infiltration of CD8+ T cells, NK cells, and DCs, all of which are critical components of anti-tumor immunity (60, 61). The precise mechanism underlying NTRK2-mediated anti-tumor immunity remains unreported and may differ from the signaling pathway activated by NTRK2 and BDNF, warranting further investigation.
Laminin γ2 (LAMC2) is a subunit of the heterotrimeric glycoprotein laminin-332, which has been demonstrated to facilitate the proliferation and metastasis of cancer cells in basal-like BC (62). It has been observed that the secretion of LAMC2 by intrahepatic cholangiocarcinoma cells can promote EMT (63). Additionally, LAMC2 has been shown to regulate gemcitabine sensitivity in pancreatic ductal adenocarcinoma through EMT (64). In the current investigation, we found that LAMC2 expression in basal-like BC was higher and positively correlated with miR-222-3p expression. Furthermore, we have found a link between higher LAMC2 expression and reduced drug sensitivity and higher infiltration levels of most immune cells.
Phosphoinositide-3-kinase regulatory subunit 1 (PIK3R1) is a regulatory subunit of the PI3K-Akt signaling pathway, which is a tumor suppressor that is frequently downregulated in BC (65, 66). Previous research has shown that under-expression of PIK3R1 is linked to poor prognosis in BC patients (67). Our study aligns with these findings, as we observed the downregulation of PIK3R1 in BC and noted that patients with low PIK3R1 expression had a shorter DSS. Additionally, it has been reported that PIK3R1 is a target gene of miR-21 and that knockdown of miR-21 leads to upregulation of PIK3R1, which in turn inhibits EMT and the activation of the PI3K-Akt signaling pathway, ultimately suppressing BC development (68). Based on the findings of the present and previous studies, we supposed that miR-222-3p might target and downregulate PIK3R1 expression to promote EMT via the activation of the PI3K-Akt signaling pathway in BC.
Baculoviral inhibitor of apoptosis repeat containing 5 (BIRC5) is a mitotic spindle checkpoint gene that belongs to the inhibitor of the apoptosis family, and a mitotic spindle checkpoint gene has been observed to be overexpressed in BC and linked to unfavorable clinical outcomes (69, 70). This study reveals that expression is notably elevated in BC tissues, particularly in basal-like and luminal B subtypes and that BIRC5 may serve as a valuable biomarker for BC diagnosis, as evidenced by ROC analysis. Patients with high BIRC5 expression levels were found to have a poorer prognosis. Additionally, it has been reported that BIRC5 can stimulate the expression of superoxide dismutase 1 (SOD1) in cancer-associated fibroblasts and transform them into myofibroblasts to promote EMT in BC (71). Furthermore, our investigation revealed a correlation between elevated BIRC5 expression and reduced levels of NK cells, CD8+ cells, and increased miRNA scores, indicating a potential immunosuppressive function of BIRC5 and its ability to promote BC cell stemness. Additionally, heightened BIRC5 expression was linked to the expression of ICGs and TMB, highlighting the potential of BIRC5 as a promising target for BC immunotherapy.
However, it is important to note that our study primarily relied on data obtained from the TCGA database, which needs further validation. To address the limitations, first, the luciferase reporter assay should be performed to validate the relationship between miR-222-3p and its identified ETGs. Subsequently, it is imperative to conduct further investigation into the EMT-regulated mechanism of the ETGs. Additionally, it is crucial to ascertain whether the ETGs have the potential to serve as therapeutic targets in the future. In conclusion, the findings of this study hold significant implications for future research endeavors aimed at exploring the EMT mechanism of BC, which could potentially yield promising treatment modalities for patients afflicted with BC.
5 Conclusion
In conclusion, our study has provided evidence indicating that miR-222-3p was overexpressed in basal-like BC and has the potential to serve as a specific biomarker of basal-like BC. Additionally, elevated expression levels of miR-222-3p in BC are associated with unfavorable prognosis. Through our investigation, we have identified 10 core ETGs of miR-222-3p, among which MUC1, MMP11, and BIRBIRC5 may serve as useful diagnostic biomarkers for BC, and NTRK2, PIK3R1, and BIRC5 may serve as biomarkers for predicting prognosis. Comprehensive analysis of the association between the expression of 10 ETGs and immune cells, ICGs, TMB, MSI, stemness, and drug sensitivity indicates their potential association with the tumor microenvironment in the progression of breast cancer. These findings suggest that these ETGs may serve as novel therapeutic targets for the treatment of BC.
Data availability statement
The original contributions presented in the study are included in the article/Supplementary Material. Further inquiries can be directed to the corresponding authors.
Author contributions
YF organized the article writing and critically modified the manuscript. JW and RDZ modified the manuscript. QZ drafted the manuscript and were responsible for the acquisition of data. CC and ZC participated in the data analysis. RJZ contributed to the literature search. CS checked and corrected language expression. All authors read and approved the manuscript and agreed to be accountable for all aspects of the research in ensuring that the accuracy or integrity of any part of the work are appropriately investigated and resolved.
Funding
This work was supported by funds from the Foundation of Basic and Applied Basic Research of Guangdong Province, China (Grant No. 2022A1515220202), and the Youth Science Foundation of the Cancer Hospital of Shantou University Medical College (Grant No. 2023A002).
Conflict of interest
The authors declare that the research was conducted in the absence of any commercial or financial relationships that could be construed as a potential conflict of interest.
Publisher’s note
All claims expressed in this article are solely those of the authors and do not necessarily represent those of their affiliated organizations, or those of the publisher, the editors and the reviewers. Any product that may be evaluated in this article, or claim that may be made by its manufacturer, is not guaranteed or endorsed by the publisher.
Supplementary material
The Supplementary Material for this article can be found online at: https://www.frontiersin.org/articles/10.3389/fonc.2023.1189635/full#supplementary-material
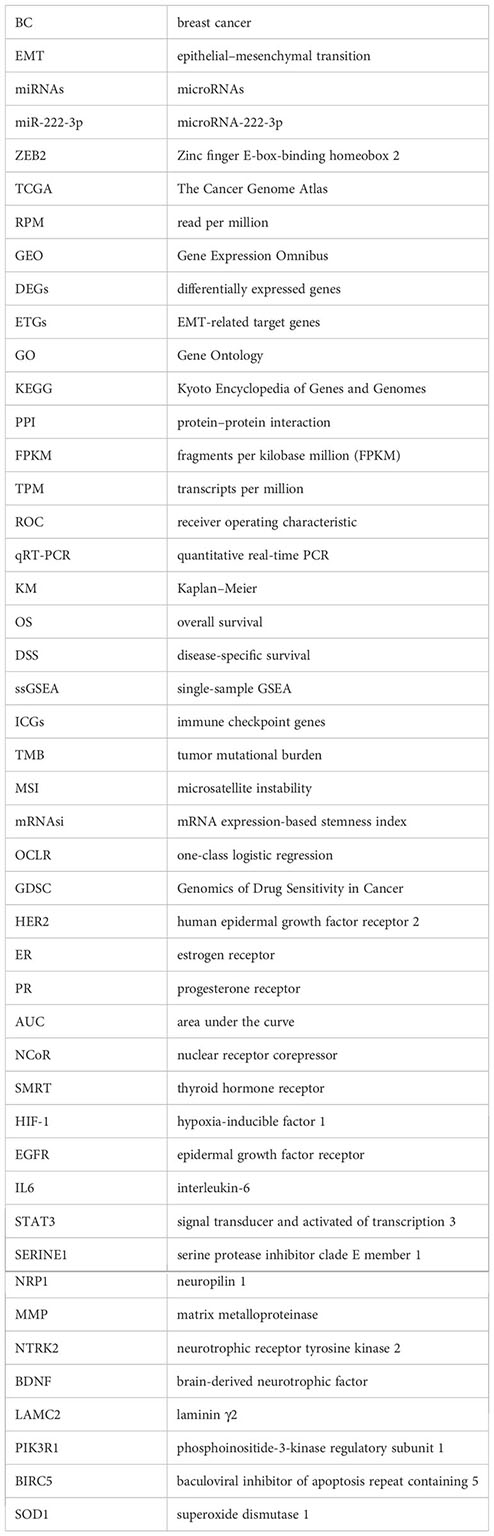
Glossary
References
1. Ferlay J, Colombet M, Soerjomataram I, Parkin DM, Piñeros M, Znaor A, et al. Cancer statistics for the year 2020: an overview. Int J Cancer (2021). doi: 10.1002/ijc.33588
2. Cui G, Wu J, Lin J, Liu W, Chen P, Yu M, et al. Graphene-based nanomaterials for breast cancer treatment: promising therapeutic strategies. J Nanobiotechnol (2021) 19(1):211. doi: 10.1186/s12951-021-00902-8
3. Siegel RL, Miller KD, Jemal A. Cancer statistics, 2020. CA Cancer J Clin (2020) 70(1):7–30. doi: 10.3322/caac.21590
4. Xu X, Zhang M, Xu F, Jiang S. Wnt signaling in breast cancer: biological mechanisms, challenges and opportunities. Mol Cancer (2020) 19(1):165. doi: 10.1186/s12943-020-01276-5
5. Bakir B, Chiarella AM, Pitarresi JR, Rustgi AK. EMT, MET, plasticity, and tumor metastasis. Trends Cell Biol (2020) 30(10):764–76. doi: 10.1016/j.tcb.2020.07.003
6. Mani SA, Guo W, Liao MJ, Eaton EN, Ayyanan A, Zhou AY, et al. The epithelial-mesenchymal transition generates cells with properties of stem cells. Cell (2008) 133(4):704–15. doi: 10.1016/j.cell.2008.03.027
7. Taki M, Abiko K, Ukita M, Murakami R, Yamanoi K, Yamaguchi K, et al. Tumor immune microenvironment during epithelial-mesenchymal transition. Clin Cancer Res (2021) 27(17):4669–79. doi: 10.1158/1078-0432.CCR-20-4459
8. Shibue T, Weinberg RA. EMT. CSCs, and drug resistance: the mechanistic link and clinical implications. Nat Rev Clin Oncol (2017) 14(10):611–29. doi: 10.1038/nrclinonc.2017.44
9. Saliminejad K, Khorram Khorshid HR, Soleymani Fard S, Ghaffari SH. An overview of microRNAs: biology, functions, therapeutics, and analysis methods. J Cell Physiol (2019) 234(5):5451–65. doi: 10.1002/jcp.27486
10. Shi Y, Liu Z, Lin Q, Luo Q, Cen Y, Li J, et al. MiRNAs and cancer: key link in diagnosis and therapy. Genes (Basel) (2021) 12(8):1289. doi: 10.3390/genes12081289
11. Feng J, Hu S, Liu K, Sun G, Zhang Y. The role of MicroRNA in the regulation of tumor epithelial-mesenchymal transition. Cells (2022) 11(13):1981. doi: 10.3390/cells11131981
12. Pan G, Liu Y, Shang L, Zhou F, Yang S. EMT-associated microRNAs and their roles in cancer stemness and drug resistance. Cancer Commun (Lond) (2021) 41(3):199–217. doi: 10.1002/cac2.12138
13. Garofalo M, Quintavalle C, Romano G, Croce CM, Condorelli G. miR221/222 in cancer: their role in tumor progression and response to therapy. Curr Mol Med (2012) 12(1):27–33. doi: 10.2174/156652412798376170
14. Stinson S, Lackner MR, Adai AT, Yu N, Kim HJ, O'Brien C, et al. miR-221/222 targeting of trichorhinophalangeal 1 (TRPS1) promotes epithelial-to-mesenchymal transition in breast cancer. Sci Signal (2011) 4(186):pt5. doi: 10.1126/scisignal.2002258
15. Liang YK, Lin HY, Dou XW, Chen M, Wei XL, Zhang YQ, et al. MiR-221/222 promote epithelial-mesenchymal transition by targeting Notch3 in breast cancer cell lines. NPJ Breast Cancer (2018) 4:20. doi: 10.1038/s41523-018-0073-7
16. Hashimoto Y, Akiyama Y, Yuasa Y. Multiple-to-multiple relationships between microRNAs and target genes in gastric cancer. PloS One (2013) 8(5):e62589. doi: 10.1371/journal.pone.0062589
17. Tomczak K, Czerwińska P, Wiznerowicz M. The cancer genome atlas (TCGA): an immeasurable source of knowledge. Contemp Oncol (Pozn) (2015) 19(1A):A68–77. doi: 10.5114/wo.2014.47136
18. Sticht C, de la Torre C, Parveen A, Gretz N. miRWalk: an online resource for prediction of microRNA binding sites. PloS One (2018) 13(10):e0206239. doi: 10.1371/journal.pone.0206239
19. Zhao M, Liu Y, Zheng C, Qu H. dbEMT 2.0: an updated database for epithelial-mesenchymal transition genes with experimentally verified information and precalculated regulation information for cancer metastasis. J Genet Genomics (2019) 46(12):595–7. doi: 10.1016/j.jgg.2019.11.010
20. Szklarczyk D, Gable AL, Lyon D, Junge A, Wyder S, Huerta-Cepas J, et al. STRING v11: protein-protein association networks with increased coverage, supporting functional discovery in genome-wide experimental datasets. Nucleic Acids Res (2019) 47(D1):D607–13. doi: 10.1093/nar/gky1131
21. Hänzelmann S, Castelo R, Guinney J. GSVA: gene set variation analysis for microarray and RNA-seq data. BMC Bioinf (2013) 14:7. doi: 10.1186/1471-2105-14-7
22. Chalmers ZR, Connelly CF, Fabrizio D, Gay L, Ali SM, Ennis R, et al. Analysis of 100,000 human cancer genomes reveals the landscape of tumor mutational burden. Genome Med (2017) 9(1):34. doi: 10.1186/s13073-017-0424-2
23. Bonneville R, Krook MA, Kautto EA, Miya J, Wing MR, Chen HZ, et al. Landscape of microsatellite instability across 39 cancer types. JCO Precis Oncol (2017) 2017:PO.17.00073. doi: 10.1200/PO.17.00073
24. Malta TM, Sokolov A, Gentles AJ, Burzykowski T, Poisson L, Weinstein JN, et al. Machine learning identifies stemness features associated with oncogenic dedifferentiation. Cell (2018) 173(2):338–354.e15. doi: 10.1016/j.cell.2018.03.034
25. Yang W, Soares J, Greninger P, Edelman EJ, Lightfoot H, Forbes S, et al. Genomics of drug sensitivity in cancer (GDSC): a resource for therapeutic biomarker discovery in cancer cells. Nucleic Acids Res (2013) 41(Database issue):D955–61. doi: 10.1093/nar/gks1111
26. Kumar A, Golani A, Kumar LD. EMT in breast cancer metastasis: an interplay of microRNAs, signaling pathways and circulating tumor cells. Front Biosci (Landmark Ed) (2020) 25(5):979–1010. doi: 10.2741/4844
27. Hwang MS, Yu N, Stinson SY, Yue P, Newman RJ, Allan BB, et al. miR-221/222 targets adiponectin receptor 1 to promote the epithelial-to-mesenchymal transition in breast cancer. PloS One (2013) 8(6):e66502. doi: 10.1371/journal.pone.0066502
28. Amini S, Abak A, Estiar MA, Montazeri V, Abhari A, Sakhinia E. Expression analysis of MicroRNA-222 in breast cancer. Clin Lab (2018) 64(4):491–6. doi: 10.7754/Clin.Lab.2017.171002
29. Zong Y, Zhang Y, Sun X, Xu T, Cheng X, Qin Y. miR-221/222 promote tumor growth and suppress apoptosis by targeting lncRNA GAS5 in breast cancer. Biosci Rep (2019) 39(1):BSR20181859. doi: 10.1042/BSR20181859
30. Li Y, Liang C, Ma H, Zhao Q, Lu Y, Xiang Z, et al. miR-221/222 promotes s-phase entry and cellular migration in control of basal-like breast cancer. Molecules (2014) 19(6):7122–37. doi: 10.3390/molecules19067122
31. Di Leva G, Gasparini P, Piovan C, Ngankeu A, Garofalo M, Taccioli C, et al. MicroRNA cluster 221-222 and estrogen receptor alpha interactions in breast cancer. J Natl Cancer Inst (2010) 102(10):706–21. doi: 10.1093/jnci/djq102
32. Zhao F, Li Z, Dong Z, Wang Z, Guo P, Zhang D, et al. Exploring the potential of exosome-related LncRNA pairs as predictors for immune microenvironment, survival outcome, and microbiotain landscape in esophageal squamous cell carcinoma. Front Immunol (2022) 13:918154. doi: 10.3389/fimmu.2022.918154
33. Xu W, Yang Z, Lu N. A new role for the PI3K/Akt signaling pathway in the epithelial-mesenchymal transition. Cell Adh Migr (2015) 9(4):317–24. doi: 10.1080/19336918.2015.1016686
34. Liu ZJ, Semenza GL, Zhang HF. Hypoxia-inducible factor 1 and breast cancer metastasis. J Zhejiang Univ Sci B (2015) 16(1):32–43. doi: 10.1631/jzus.B1400221
35. Teixeira AL, Gomes M, Medeiros R. EGFR signaling pathway and related-miRNAs in age-related diseases: the example of miR-221 and miR-222. Front Genet (2012) 3:286. doi: 10.3389/fgene.2012.00286
36. Masuda H, Zhang D, Bartholomeusz C, Doihara H, Hortobagyi GN, Ueno NT. Role of epidermal growth factor receptor in breast cancer. Breast Cancer Res Treat (2012) 136(2):331–45. doi: 10.1007/s10549-012-2289-9
37. Hsu JL, Hung MC. The role of HER2, EGFR, and other receptor tyrosine kinases in breast cancer. Cancer Metastasis Rev (2016) 35(4):575–88. doi: 10.1007/s10555-016-9649-6
38. Xia L, Zheng ZZ, Liu JY, Chen YJ, Ding JC, Xia NS, et al. EGFR-targeted CAR-T cells are potent and specific in suppressing triple-negative breast cancer both in vitro and in vivo. Clin Transl Immunol (2020) 9(5):e01135. doi: 10.1002/cti2.1135
39. Masjedi A, Hashemi V, Hojjat-Farsangi M, Ghalamfarsa G, Azizi G, Yousefi M, et al. The significant role of interleukin-6 and its signaling pathway in the immunopathogenesis and treatment of breast cancer. BioMed Pharmacother (2018) 108:1415–24. doi: 10.1016/j.biopha.2018.09.177
40. Felcher CM, Bogni ES, Kordon EC. IL-6 cytokine family: a putative target for breast cancer prevention and treatment. Int J Mol Sci (2022) 23(3):1809. doi: 10.3390/ijms23031809
41. Gyamfi J, Lee YH, Eom M, Choi J. Interleukin-6/STAT3 signalling regulates adipocyte induced epithelial-mesenchymal transition in breast cancer cells. Sci Rep (2018) 8(1):8859. doi: 10.1038/s41598-018-27184-9
42. Jones SA, Jenkins BJ. Recent insights into targeting the IL-6 cytokine family in inflammatory diseases and cancer. Nat Rev Immunol (2018) 18(12):773–89. doi: 10.1038/s41577-018-0066-7
43. Duffy MJ, McGowan PM, Harbeck N, Thomssen C, Schmitt M. uPA and PAI-1 as biomarkers in breast cancer: validated for clinical use in level-of-evidence-1 studies. Breast Cancer Res (2014) 16(4):428. doi: 10.1186/s13058-014-0428-4
44. Xu J, Zhang W, Tang L, Chen W, Guan X. Epithelial-mesenchymal transition induced PAI-1 is associated with prognosis of triple-negative breast cancer patients. Gene (2018) 670:7–14. doi: 10.1016/j.gene.2018.05.089
45. Stergiou N, Nagel J, Pektor S, Heimes AS, Jäkel J, Brenner W, et al. Evaluation of a novel monoclonal antibody against tumor-associated MUC1 for diagnosis and prognosis of breast cancer. Int J Med Sci (2019) 16(9):1188–98. doi: 10.7150/ijms.35452
46. Liao G, Wang M, Ou Y, Zhao Y. IGF-1-induced epithelial-mesenchymal transition in MCF-7 cells is mediated by MUC1. Cell Signal (2014) 26(10):2131–7. doi: 10.1016/j.cellsig.2014.06.004
47. Merikhian P, Ghadirian R, Farahmand L, Mansouri S, Majidzadeh-A K. MUC1 induces tamoxifen resistance in estrogen receptor-positive breast cancer. Expert Rev Anticancer Ther (2017) 17(7):607–13. doi: 10.1080/14737140.2017.1340837
48. Li Z, Yang D, Guo T, Lin M. Advances in MUC1-mediated breast cancer immunotherapy. Biomolecules (2022) 12(7):952. doi: 10.3390/biom12070952
49. Li X, Zhou Y, Hu J, Bai Z, Meng W, Zhang L, et al. Loss of neuropilin1 inhibits liver cancer stem cells population and blocks metastasis in hepatocellular carcinoma via epithelial-mesenchymal transition. Neoplasma (2021) 68(2):325–33. doi: 10.4149/neo_2020_200914N982
50. Jin Q, Ren Q, Chang X, Yu H, Jin X, Lu X, et al. Neuropilin-1 predicts poor prognosis and promotes tumor metastasis through epithelial-mesenchymal transition in gastric cancer. J Cancer (2021) 12(12):3648–59. doi: 10.7150/jca.52851
51. Chaudhary B, Khaled YS, Ammori BJ, Elkord E. Neuropilin 1: function and therapeutic potential in cancer. Cancer Immunol Immunother (2014) 63(2):81–99. doi: 10.1007/s00262-013-1500-0
52. Chuckran CA, Liu C, Bruno TC, Workman CJ, Vignali DA. Neuropilin-1: a checkpoint target with unique implications for cancer immunology and immunotherapy. J Immunother Cancer (2020) 8(2):e000967. doi: 10.1136/jitc-2020-000967
53. Kasper G, Reule M, Tschirschmann M, Dankert N, Stout-Weider K, Lauster R, et al. Stromelysin-3 over-expression enhances tumourigenesis in MCF-7 and MDA-MB-231 breast cancer cell lines: involvement of the IGF-1 signalling pathway. BMC Cancer (2007) 7:12. doi: 10.1186/1471-2407-7-12
54. Zhuang Y, Li X, Zhan P, Pi G, Wen G. MMP11 promotes the proliferation and progression of breast cancer through stabilizing Smad2 protein. Oncol Rep (2021) 45(4):16. doi: 10.3892/or.2021.7967
55. Bi Q, Tang S, Xia L, Du R, Fan R, Gao L, et al. Ectopic expression of MiR-125a inhibits the proliferation and metastasis of hepatocellular carcinoma by targeting MMP11 and VEGF. PloS One (2012) 7(6):e40169. doi: 10.1371/journal.pone.0040169
56. Waresijiang N, Sun J, Abuduaini R, Jiang T, Zhou W, Yuan H. The downregulation of miR−125a−5p functions as a tumor suppressor by directly targeting MMP−11 in osteosarcoma. Mol Med Rep (2016) 13(6):4859–64. doi: 10.3892/mmr.2016.5141
57. Ren H, Shen Z, Shen J, Zhang Y, Zhang Y. Diagnostic value of Doppler ultrasound parameters combined with MMP-11 in early breast cancer and benign breast diseases. Oncol Lett (2020) 20(2):1028–32. doi: 10.3892/ol.2020.11676
58. Kim MS, Lee WS, Jeong J, Kim SJ, Jin W. Induction of metastatic potential by TrkB via activation of IL6/JAK2/STAT3 and PI3K/AKT signaling in breast cancer. Oncotarget (2015) 6(37):40158–71. doi: 10.18632/oncotarget.5522
59. Serafim Junior V, Fernandes GMM, Oliveira-Cucolo JG, Pavarino EC, Goloni-Bertollo EM. Role of tropomyosin-related kinase b receptor and brain-derived neurotrophic factor in cancer. Cytokine (2020) 136:155270. doi: 10.1016/j.cyto.2020.155270
60. Fu C, Jiang A. Dendritic cells and CD8 T cell immunity in tumor microenvironment. Front Immunol (2018) 9:3059. doi: 10.3389/fimmu.2018.03059
61. Myers JA, Miller JS. Exploring the NK cell platform for cancer immunotherapy. Nat Rev Clin Oncol (2021) 18(2):85–100. doi: 10.1038/s41571-020-0426-7
62. He Y, Xiao B, Lei T, Xuan J, Zhu Y, Kuang Z, et al. LncRNA T376626 is a promising serum biomarker and promotes proliferation, migration, and invasion via binding to LAMC2 in triple-negative breast cancer. Gene (2023) 860:147227. doi: 10.1016/j.gene.2023.147227
63. Cen W, Li J, Tong C, Zhang W, Zhao Y, Lu B, et al. Intrahepatic cholangiocarcinoma cells promote epithelial-mesenchymal transition of hepatocellular carcinoma cells by secreting LAMC2. J Cancer (2021) 12(12):3448–57. doi: 10.7150/jca.55627
64. Okada Y, Takahashi N, Takayama T, Goel A. LAMC2 promotes cancer progression and gemcitabine resistance through modulation of EMT and ATP-binding cassette transporters in pancreatic ductal adenocarcinoma. Carcinogenesis (2021) 42(4):546–56. doi: 10.1093/carcin/bgab011
65. Turturro SB, Najor MS, Yung T, Portt L, Malarkey CS, Abukhdeir AM, et al. Somatic loss of PIK3R1 may sensitize breast cancer to inhibitors of the MAPK pathway. Breast Cancer Res Treat (2019) 177(2):325–33. doi: 10.1007/s10549-019-05320-x
66. Liu Y, Wang D, Li Z, Li X, Jin M, Jia N, et al. Pan-cancer analysis on the role of PIK3R1 and PIK3R2 in human tumors. Sci Rep (2022) 12(1):5924. doi: 10.1038/s41598-022-09889-0
67. Cizkova M, Vacher S, Meseure D, Trassard M, Susini A, Mlcuchova D, et al. PIK3R1 underexpression is an independent prognostic marker in breast cancer. BMC Cancer (2013) 13:545. doi: 10.1186/1471-2407-13-545
68. Yan LX, Liu YH, Xiang JW, Wu QN, Xu LB, Luo XL, et al. PIK3R1 targeting by miR-21 suppresses tumor cell migration and invasion by reducing PI3K/AKT signaling and reversing EMT, and predicts clinical outcome of breast cancer. Int J Oncol (2016) 48(2):471–84. doi: 10.3892/ijo.2015.3287
69. Li K, Liu T, Chen J, Ni H, Li W. Survivin in breast cancer-derived exosomes activates fibroblasts by up-regulating SOD1, whose feedback promotes cancer proliferation and metastasis. J Biol Chem (2020) 295(40):13737–52. doi: 10.1074/jbc.RA120.013805
70. Wang C, Zheng X, Shen C, Shi Y. MicroRNA-203 suppresses cell proliferation and migration by targeting BIRC5 and LASP1 in human triple-negative breast cancer cells. J Exp Clin Cancer Res (2012) 31(1):58. doi: 10.1186/1756-9966-31-58
Keywords: breast cancer, miR-222-3p, epithelial-mesenchymal transition, target gene, diagnosis, prognosis, immune infiltration, drug sensitivity
Citation: Fang Y, Zhang Q, Chen C, Chen Z, Zheng R, She C, Zhang R and Wu J (2023) Identification and comprehensive analysis of epithelial–mesenchymal transition related target genes of miR-222-3p in breast cancer. Front. Oncol. 13:1189635. doi: 10.3389/fonc.2023.1189635
Received: 19 March 2023; Accepted: 16 June 2023;
Published: 20 July 2023.
Edited by:
Noha Mousaad Elemam, University of Sharjah, United Arab EmiratesReviewed by:
Rana A. Youness, University of Hertfordshire, United KingdomAdriane Feijo Evangelista, Barretos Cancer Hospital, Brazil
Copyright © 2023 Fang, Zhang, Chen, Chen, Zheng, She, Zhang and Wu. This is an open-access article distributed under the terms of the Creative Commons Attribution License (CC BY). The use, distribution or reproduction in other forums is permitted, provided the original author(s) and the copyright owner(s) are credited and that the original publication in this journal is cited, in accordance with accepted academic practice. No use, distribution or reproduction is permitted which does not comply with these terms.
*Correspondence: Rendong Zhang, emhhbmdyZW5kb25nMjAyMUAxNjMuY29t; Jundong Wu, d3VqdW4tZG9uZ0AxNjMuY29t