 Fatemah Rezayee1,2*
 Jesper Eisfeldt1,2Aron Skaftason1,3
 Ingegerd Öfverholm1,2Shumaila Sayyab4,5Ann Christine Syvänen4,5
 Khurram Maqbool6Henrik Lilljebjörn7
 Bertil Johansson7,8Linda Olsson-Arvidsson7,8Christina Orsmark Pietras7Anna Staffas9,10
 Lars Palmqvist11,12
 Thoas Fioretos7,8,13Lucia Cavelier1,2Linda Fogelstrand11,12
 Jessica Nordlund4,5Valtteri Wirta14,15
 Richard Rosenquist1,2,15
 Gisela Barbany1,2
- 1Department of Molecular Medicine and Surgery, Karolinska Institutet, Stockholm, Sweden
- 2Department of Clinical Genetics, Karolinska University Hospital, Stockholm, Sweden
- 3Science for Life Laboratory, Karolinska Institutet, Stockholm, Sweden
- 4Department of Medical Sciences, Uppsala University, Uppsala, Sweden
- 5Science for Life Laboratory, Uppsala University, Uppsala, Sweden
- 6Science for Life Laboratory, Department of Microbiology, Tumor and Cell Biology, Karolinska Institutet, Stockholm, Sweden
- 7Division of Clinical Genetics, Department of Laboratory Medicine, Lund University, Lund, Sweden
- 8Department of Clinical Genetics, Pathology, and Molecular Diagnostics, Office for Medical Services, Region Skåne, Lund, Sweden
- 9Department of Clinical Genetics and Genomics, Sahlgrenska University Hospital, Gothenburg, Sweden
- 10Department of Microbiology and Immunology, Institute of Biomedicine, Sahlgrenska Academy, University of Gothenburg, Gothenburg, Sweden
- 11Department of Clinical Chemistry, Sahlgrenska University Hospital, Gothenburg, Sweden
- 12Department of Laboratory Medicine, Sahlgrenska Academy, University of Gothenburg, Gothenburg, Sweden
- 13Clinical Genomics Lund, Science for Life Laboratory, Lund University, Lund, Sweden
- 14Science for Life Laboratory, School of Engineering Sciences in Chemistry, Biotechnology and Health, KTH Royal Institute of Technology, Stockholm, Sweden
- 15Genomic Medicine Center Karolinska, Karolinska University Hospital, Stockholm, Sweden
Introduction: The suitability of whole-genome sequencing (WGS) as the sole method to detect clinically relevant genomic aberrations in B-cell acute lymphoblastic leukemia (ALL) was investigated with the aim of replacing current diagnostic methods.
Methods: For this purpose, we assessed the analytical performance of 150 bp paired-end WGS (90x leukemia/30x germline). A set of 88 retrospective B-cell ALL samples were selected to represent established ALL subgroups as well as ALL lacking stratifying markers by standard-of-care (SoC), so-called B-other ALL.
Results: Both the analysis of paired leukemia/germline (L/N)(n=64) as well as leukemia-only (L-only)(n=88) detected all types of aberrations mandatory in the current ALLTogether trial protocol, i.e., aneuploidies, structural variants, and focal copy-number aberrations. Moreover, comparison to SoC revealed 100% concordance and that all patients had been assigned to the correct genetic subgroup using both approaches. Notably, WGS could allocate 35 out of 39 B-other ALL samples to one of the emerging genetic subgroups considered in the most recent classifications of ALL. We further investigated the impact of high (90x; n=58) vs low (30x; n=30) coverage on the diagnostic yield and observed an equally perfect concordance with SoC; low coverage detected all relevant lesions.
Discussion: The filtration of the WGS findings with a short list of genes recurrently rearranged in ALL was instrumental to extract the clinically relevant information efficiently. Nonetheless, the detection of DUX4 rearrangements required an additional customized analysis, due to multiple copies of this gene embedded in the highly repetitive D4Z4 region. We conclude that the diagnostic performance of WGS as the standalone method was remarkable and allowed detection of all clinically relevant genomic events in the diagnostic setting of B-cell ALL.
Introduction
Genetic characterization of acute lymphoblastic leukemia (ALL) is mandatory in modern treatment protocols since it provides important prognostic information, which, together with measurements of initial treatment response, is used to adjust treatment intensity within risk-adapted protocols (1–3). The genomic landscape of ALL is very heterogeneous and extends from aneuploidies over structural variants (SVs) to focal copy number alterations (CNAs) and single-nucleotide variants (SNVs) (4, 5). To accurately detect this range of aberrations, the diagnostic work-up requires a multimodal procedure, combining screening and targeted methods, which makes SoC genetic diagnostics cumbersome and labor-intensive (4–6). Still, a significant proportion of both pediatric and adult ALL patients lack recognized genetic markers, and for these patients, the genetic findings do not contribute to risk stratification.
In the past decade, high-throughput sequencing technologies have provided new tools to unravel the genomics of ALL and led to the identification of novel genomic aberrations with potential prognostic impact or implications for targeted therapy (7). Based on these new findings, the latest WHO 2022 classification (8) and the International Consensus Classification (ICC) (9) propose a number of emerging ALL subgroups among B-cell ALL, significantly decreasing the number of patients lacking primary genetic lesion, the so-called B-other ALL. While these novel aberrations are not yet mandatory to investigate in contemporary treatment protocols, these genetic lesions have been suggested to impact outcomes and may thereby contribute valuable information to patient management (10–16).
Recent studies have shown a high accuracy and cost-efficiency of whole-genome sequencing (WGS) in the diagnostic setting of germline conditions (17) as well as cancer (18). In hematological malignancies specifically, WGS was recently demonstrated to be superior to conventional methods, adding clinically relevant information in 25% of patients with myelodysplastic syndrome or acute myeloid leukemia, information that changed patient stratification for 16% of the patients (19). Also, in B-cell ALL, a recent report by Ryan and coworkers showed that WGS displayed a high diagnostic yield, as subtype-defining lesions were detected in 97% of patients. Of note, restricted analysis of leukemic samples (L-only) could call primary genetic abnormalities in 37 out of 38 patients (20). A further study based on WGS investigated a subset of pediatric B-other ALL patients from the UKALL2003 trial and identified a subtype-defining lesion in 94% of the patients (15), whereas a similar study of 47 adult B-other ALL patients detected a class-defining aberration in 87% of patients (21).
The performance of WGS in the diagnostic setting of hematological malignancies is thus far very promising; however, there are still technical and interpretation issues that need to be addressed before current methods can be replaced by WGS. In the present study, we assessed the diagnostic yield and accuracy of WGS as the sole diagnostic method to detect genetic lesions of clinical relevance in the diagnostic setting of ALL. To this end, we challenged WGS and the bioinformatics pipeline to identify clinically relevant genetic aberrations in a set of 88 well-characterized retrospective B-cell ALL cases. We applied sequential filtration to extract the clinically relevant information efficiently and assessed the accuracy through the comparison to SoC findings. Furthermore, we evaluated the sensitivity of high (90×) versus low (30×) coverage and compared the diagnostic yield of paired leukemia-germline samples to L-only analysis, as these parameters strongly influence turnaround time and costs. The overall results showed a complete concordance between SoC and WGS, also when restricting the analysis to L-only, and that WGS could assign the majority of B-other ALL to emerging genetic subgroups.
Materials and methods
Patient samples
We investigated 88 retrospective leukemic bone marrow (BM) samples from patients diagnosed with pediatric B-cell ALL, treated according to NOPHO trials protocol at Uppsala University Hospital and Karolinska University Hospital in Sweden. The cases were selected to represent the mandatory genetic subgroups (Supplementary Table 1) defined in the current protocol (n = 49), and the remaining samples consisted of B-cell ALL cases lacking recognized stratifying aberrations, i.e., the B-other group (n = 36), as well as three patients with Down syndrome ALL (DS-ALL). The blast count was above 50% in all but two samples: P111 with an ETV6::RUNX1 fusion present in 37% of the cells and P120 with a KMT2A rearrangement (KMT2A-r) present in 14% of the cells. The distribution of B-cell ALL samples across genetic subgroups is summarized in Table 1. The samples were divided into an exploratory set (n = 58) and a validation set (n = 30). BM samples taken during follow-up, when the patients were in remission, were used as the source of germline DNA (n = 64) for the paired analysis.
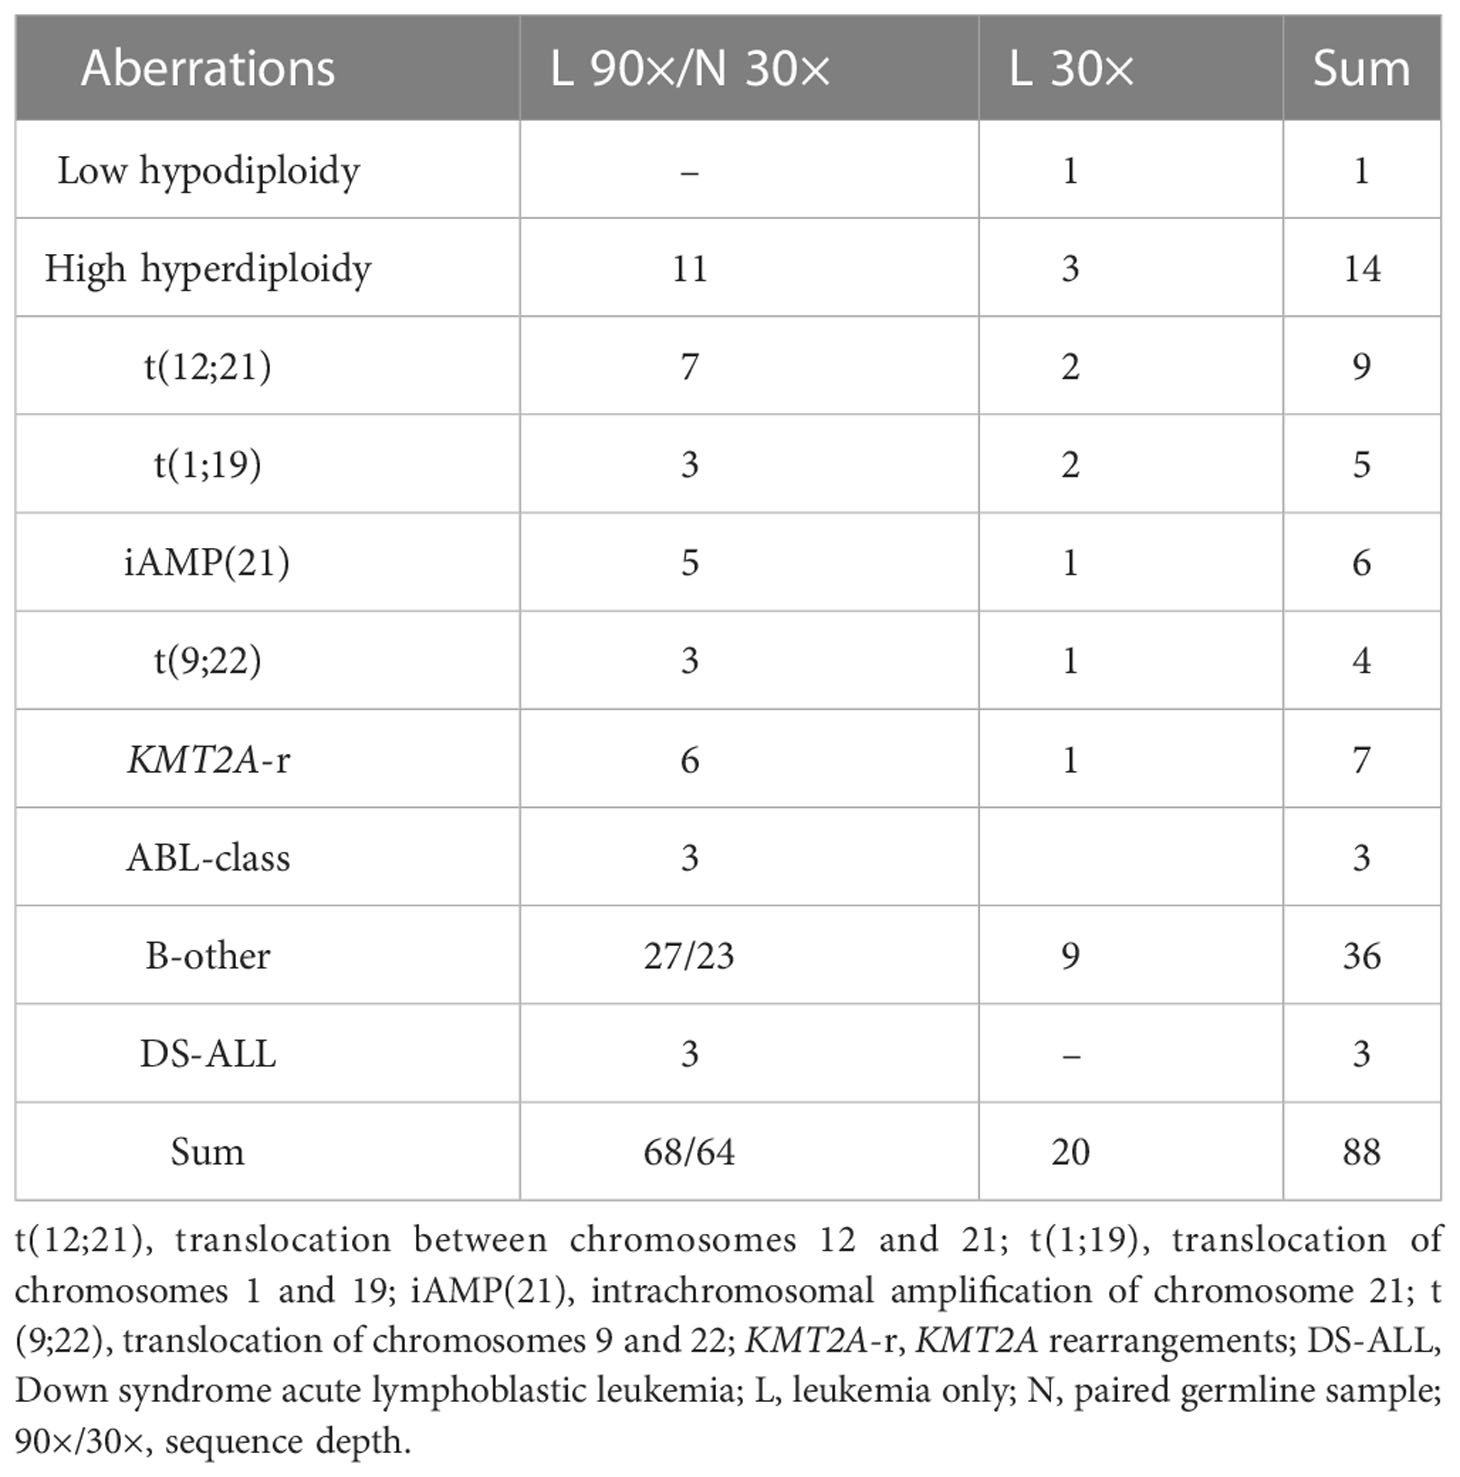
Table 1 Summary of samples analyzed.
At diagnosis, all samples were genetically characterized according to SoC as specified in the NOPHO protocols, which included chromosome banding analysis, fluorescence in situ hybridization (FISH) analysis to investigate the presence of t(12;21), t(9;22), KMT2A-r, intrachromosomal amplification of chromosome 21 (iAMP (21)) (Abbott, Vysis, Abbott Park, IL, USA), t(1;19) (MetaSystems Probes, Heidelberg, Germany), and dic(9;20) (Kreatech Diagnostics, Amsterdam, Netherlands) as well as array comparative genomic hybridization/single-nucleotide polymorphism (CGH/SNP) array analysis. For the purpose of the study, the genetic subgroup for the samples from the NOPHO 92 and 2000 trials (n = 22) was updated to SoC in the NOPHO 2008 trial, as the older trials investigated fewer aberrations (22, 23). Also, three of the B-other samples that harbored retrospectively detected ABL-class rearrangements were revised, as this subgroup was not investigated in the NOPHO 2008 trial.
Sample preparation
BM samples were collected in 5-ml EDTA tubes, and genomic DNA (gDNA) was isolated using a Tissue kit an EZ1™ automated instrument (Qiagen, Hilden, Germany) or extracted manually from frozen cell pellets with the AllPrep DNA/RNA Mini Kit Qiagen (Qiagen, Hilden, Germany). DNA was stored at −20°C until use. The DNA from frozen BM samples taken at remission was extracted with a Gentra Puregene Blood core kit (Qiagen, Hilden, Germany).
Whole-genome sequencing
For the samples in the exploratory set (n = 58), library preparation and sequencing were performed at the National Genomics Infrastructure, Science for Life Laboratory, Stockholm (n = 36) and Uppsala (n = 22), Sweden. For samples with sufficient amounts of DNA available (36/58), the libraries were prepared using 1 µg of DNA with the TruSeq DNA PCR-free (Illumina, San Diego, CA, USA) protocol, 350-bp insert size, and sequenced using the HiSeq X platform (Illumina), 2 × 150-bp paired-end to ~90× coverage for leukemia samples, and ~30× coverage for the paired germline sample. For samples where little DNA was available (n = 22), 100 ng of input DNA was used for library preparation with TruSeq DNA Nano protocol (Illumina).
The samples in the validation set (n = 30) were processed at Clinical Genomics, SciLifeLab, Stockholm. Libraries were prepared using the NxSeq® AmpFREE Low DNA Library Kit (Lucigen, Biosearch Technologies, Petaluma, CA, USA) with 200 ng of DNA input and thereafter sequenced on the NovaSeq 6000 instrument (Illumina) using paired-end 150-bp reads to ~90× (n = 10) or ~30× coverage (n = 20).
To investigate how sequencing depth influenced variant detection, 10 leukemia samples (originally sequenced to 90× coverage) were down-sampled in silico to a coverage of approximately 30×. Down-sampling was performed by randomly discarding reads and retaining only every third read. The subsequent downstream analysis was performed in an identical manner to the 90× L-only analysis.
Data processing
The sequence data were converted to FASTQ format using Illumina bclfastq and further processed using Sarek v2.5.1 (24), a Nextflow pipeline (25) from the nf-core framework of community-curated bioinformatics pipelines (26) on the UPPMAX Cluster (27) at Uppsala University. Briefly, preprocessed FASTQ files were checked for quality with FASTQC (28) before being aligned with BWA-mem (29) to the human reference genome build GRCh37/hg19. Duplicates were marked with Picard MarkDuplicates (30) before base calibration and indel realignment with GATK tools were performed (30), and quality statistics were aggregated with the help of multiqc (31). Following the pre-processing steps, Bam files were generated.
Sequencing data for the validation set were processed at Clinical Genomics through BALSAMIC (Bioinformatic Analysis pipeline for Somatic Mutations in Cancer) version 10.0.5, which packages the workflows for variant calling indicated below (32). Subsequently, the variant files were uploaded to the VCF visualization interface, SCOUT (33), available at https://github.com/Clinical-Genomics/scout, for further inspection and interpretation.
Detection of aneuploidies, copy-number alterations, and single-nucleotide variants
The vcf2cytosure v0.7.1, included in the BALSAMIC v10.0.5 converter (34) was applied to visualize ploidy changes and CNAs (35). The tool converts the output from the variant calling to a “.cgh” format used by CytoSure™ Interpret Software (Oxford Gene Technologies, Oxford, UK) originally developed to display oligonucleotide microarray measurements. Briefly, output files were binned, and 20 bins were pooled into one probe. Coverage along the genome was calculated as the log2 ratio for individual bins relative to all bins. The mean coverage in the sample was drawn at height 0 and regarded as the log2 ratio for the diploid genome (n = 2); ratios above this threshold indicate gains, and below losses. As the tool calculates the threshold relative to the average coverage over the entire genome, this threshold was adjusted manually for samples with multiple tri/tetrasomies or monosomies.
We also used allele-specific copy-number analysis of the leukemia samples (ASCAT version 4.5.0) (36), also included in BALSAMIC, to visualize aneuploidies and copy-number neutral loss of heterozygosity (CNN-LOH), with the latter requiring a paired germline sample.
Additionally, two recurrent SNVs, PAX5 P80R and IKZF1 N159Y (9), were also assessed in samples analyzed through the clinical platform.
Detection of structural variation
SV calling was conducted using the FindSV (37), which merges the variants callers CNVnator (38) and TIDDIT (39), and the variant effect predictor (VEP) (40) was subsequently applied. BALSAMIC version 10.0.5 uses Manta version 1.6.0 (41), Delly version 1.0.3 (42), and TIDDIT version 3.0.0 (31) to call SVs. Subsequently, the output files were annotated in SWEGEN, a reference cohort, that reflects the genetic structure of the Swedish population (43), and variants with an allele frequency above the threshold of 0.02 were discarded. In addition to SWEGEN, the samples in the validation set were also annotated in locusDB, a locally curated database with non-tumor samples, and variants with an observed frequency above 0.02 were discarded as well (44). The SV workflow detected a median of 21,500 SVs per sample, which decreased to 7,500 once recurrent variants above the 0.02 threshold were removed (and further down to roughly 4,000 when variants in the paired germline were subtracted) (leukemia/normal, L/N). Finally, a short list of clinically relevant genes (Supplementary Table 2) was applied, and the filtered events were inspected manually in IGV. The L-only analysis was carried out in the same manner, omitting the filtration with the paired normal.
Detection of DUX4 rearrangements
The location of DUX4, within the highly repetitive D4Z4 region (45), results in a high number of copies for DUX4 and DUX4-like genes. This poses challenges for the detection of DUX4-r with short-read WGS. To overcome the limitations of our initial bioinformatics pipeline, we applied a SAMtools command (46, 47) to specifically identify reads supporting an IGH::DUX4 rearrangement. The command identifies discordant reads in the IGH region (14:106032614–107288051, in GRCh37/hg19), and subsequently, these reads were filtered to only include reads that either i) have a mate mapped to one of the regions where DUX4 may map (4:190988100–191007000, 10:135477000–135500000, or GL000228.1:7000–115000 in GRCh37/hg19) or ii) have a secondary alignment in either of the above-mentioned regions. See Supplementary Material for the SAMtools command.
Selection of genes/genomic aberrations included in the shortlist
The aberrations mandatory to investigate according to the current ALL treatment trial protocol (48) were all selected, as were the genes/genomic regions included in the UKALL-CNA classifier and IKZF1+ profiles (49, 50). Furthermore, the key genes signaling genetic subtypes with potential diagnostic or therapeutic implications among B-other ALL (10–16, 51–55) or included in WHO 2022 classification (8) or the ICC of hematological malignancies were also included (9). The genes’ IDs and genomic coordinates are listed in Supplementary Table 2.
Results
Detection of mandatory aberrations
To investigate whether the detection of all mandatory genetic aberrations was feasible, 38 samples from patients with pediatric B-cell ALL, representative of the genetic subgroups stipulated by the ALLTogether trial protocol (48), were analyzed with the corresponding paired sample (Table 1). These included samples with high hyperdiploidy (HeH) and mandatory aberrations caused by SVs, resulting in recurrent fusion genes or iAMP (21). Two different visualization approaches were used to visualize aneuploidies and large CNAs, vcf2cytosure and ASCAT. Both applications allowed for an accurate calling of trisomies/tetrasomies, and the findings were identical to those obtained by SoC for all 11 samples with HeH (Supplementary Figure 1A). Equally, the high-risk aberration iAMP (21) was readily identified by both, although inspection to determine the boundaries of the changes along chromosome 21q was only possible in vcf2cytosure (Supplementary Figure 1B).
Filtering SVs with the short list of genes recurrently rearranged in ALL returned 20–25 variants per sample and made manual inspection in IGV feasible. With the use of this approach, all seven samples harboring an ETV6::RUNX1 fusion were identified, irrespective of whether the fusion arose through a balanced translocation or a complex genomic rearrangement involving multiple chromosomes (Figure 1A). Similarly, the TCF3::PBX1 fusion, resulting from a translocation between chromosome arms 1q and 19p (Figure 1B), was identified in all three cases. In the initial analysis, only four out of six KMT2A-r with the corresponding fusion partner were detected (Figure 1C). Revision of the VCF files revealed that the missing two rearrangements had been discarded in the paired analysis with the germline. Those two follow-up samples had been taken shortly before the patients relapsed, and as the KMT2A-r already had reappeared, it had been discarded. t(9;22) was successfully detected in the two Philadelphia-positive ALL samples (Figure 1D), both displaying the minor BCR breakpoint and juxtaposition of exon 1 in BCR to exon 2 in ABL1. Two ABL-class rearrangements involving PDGFRB were also identified, whereas a known RANBP2::ABL1 fusion was missing from the variant list for P047. Manual scrutiny of the variants annotated by VEP in IGV revealed that the ABL1 breakpoint mapped immediately upstream of the gene. By replacing the gene’s ID with the genomic coordinates and adding 5 kb upstream, the variant was retained in the filtration step, and the RANBP2::ABL1 fusion was detected (Figure 1E).
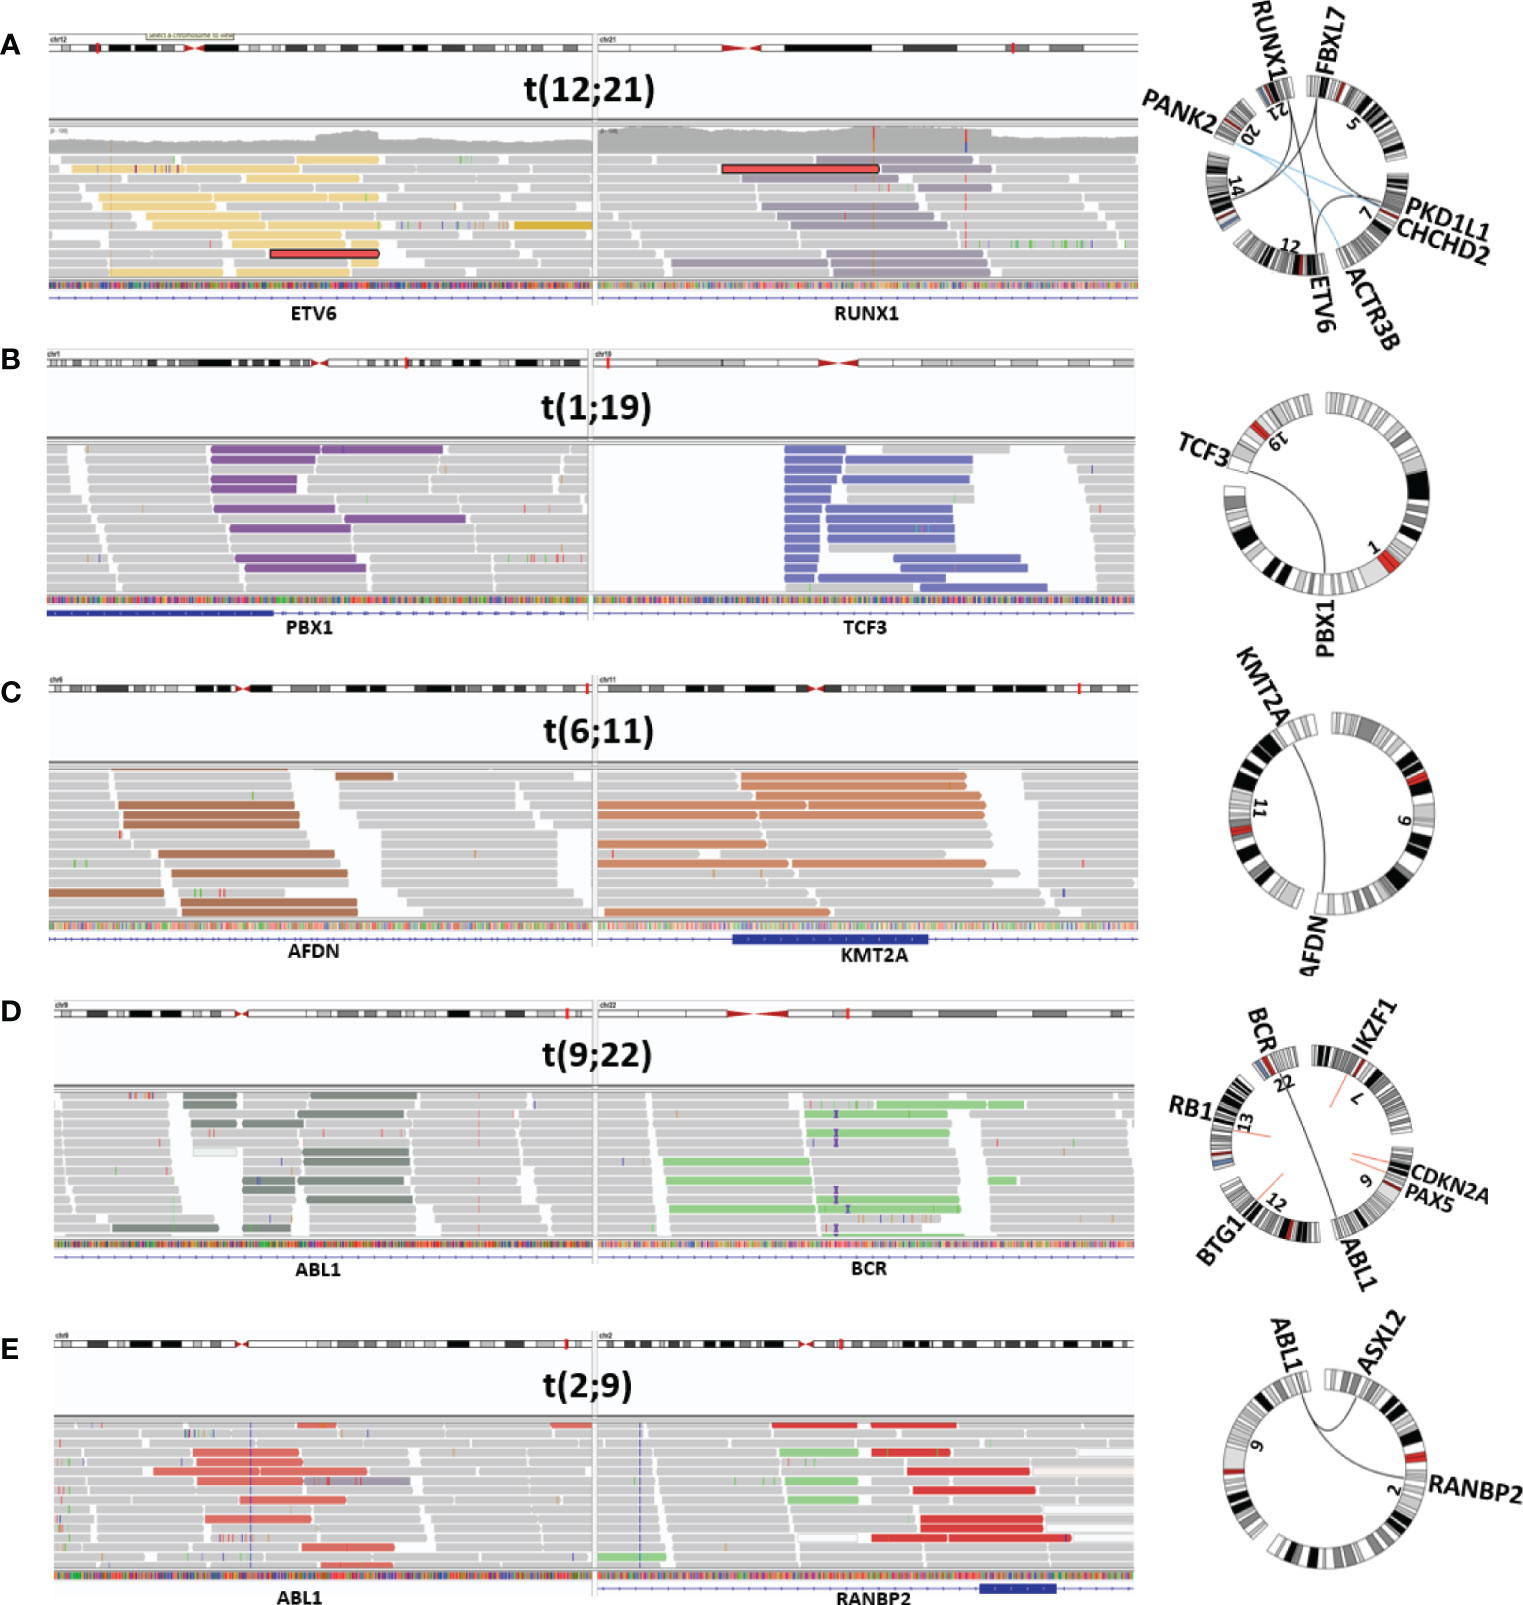
Figure 1 Visualization of mandatory SV. Depiction from IGV and Circos plot illustrating representative mandatory aberrations. The discordant reads at both ends of the junction are displayed in colored bars, and concordant reads are displayed in gray. (A) ETV6::RUNX1-r (P030), (B) TCF3::PBX1 (P034), (C) KMT2A-r (AFDN::KMT2A) (P039), (D) Philadelphia-positive ALL (BCR::ABL1) (P044), and (E) ABL-class ALL (RANBP2::ABL1) (P047). SV, structural variant; ALL, acute lymphoblastic leukemia.
Next, we assessed whether the mandatory aberrations could be confidently detected through analysis of L-only. Also in this case, filtering with the shortlist narrowed the SVs to manageable numbers and detected all the sought rearrangements, including the KMT2A-r that were not detected in the initial L/N analysis. Otherwise, the findings with both approaches were identical, and all the class-defining aberrations were detected. Supplementary Table 3 lists the findings in the samples with mandatory aberrations by SoC and WGS.
To validate the performance in the clinical setting, 10 additional samples (marked with a single asterisk, Supplementary Table 3 and Supplementary Table 4) were processed and analyzed through the clinical platform in a blinded manner. Subsequent comparison with SoC revealed that all relevant variants had been detected by the pipeline through the analysis of paired L/N as well as L-only. Mandatory aberrations were identified in seven samples (Supplementary Table 3), two of the remaining samples harbored rearrangements of PAX5 (P099 and P100), and no single lesion was identified in the third sample (P101). The comparison to SoC showed complete concordance for all 10 cases (Supplementary Table 4). In summary, WGS was able to detect all class-defining aberrations that are mandatory to investigate in the current ALL treatment trial with accuracy comparable to SoC. Figure 2A illustrates the comparison of the genetic findings by SoC and WGS for the entire set of samples.
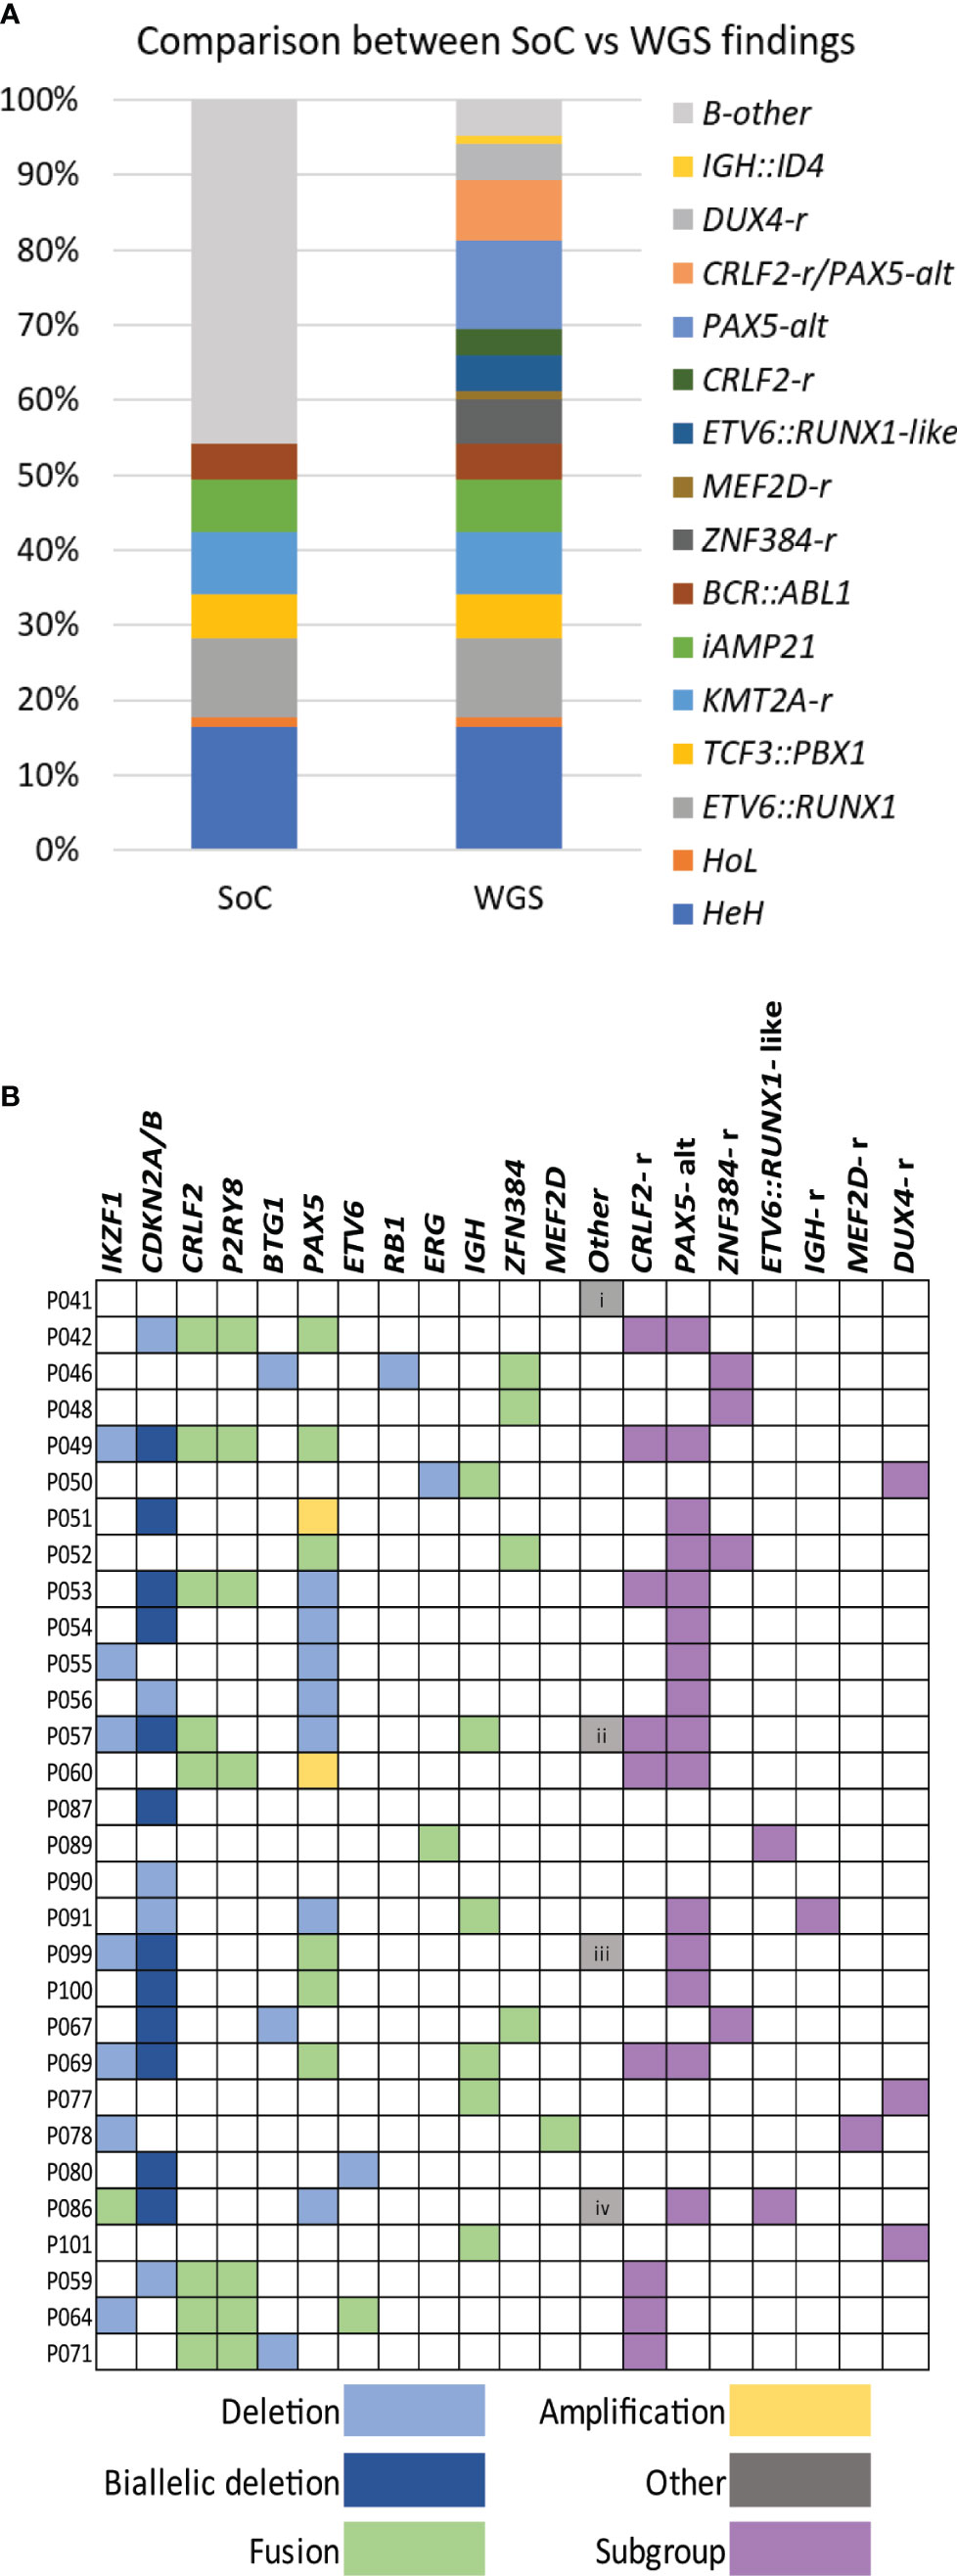
Figure 2 WGS findings. (A) Histogram summarizing the class-defining findings by SoC and WGS analysis. (B) Distribution of genetic findings in B-other cases is presented in colors. Deletions, amplifications, and fusions are detected and used to assign cases to a genetic subgroup. Other additional findings are i) uniparental disomy (UPD) 14, ii) KLHL2::MLLT3, iii) APBB2::NOL4L, and iv) IGK::IKZF1. WGS, whole-genome sequencing; SoC, standard of care.
Detection of copy-number alterations in the UKALL-CNA classifier and IKZF1PLUS profile
In addition to SVs and aneuploidies, we investigated whether WGS is suitable to detect CNAs affecting the eight loci included in the UKALL-CNA classifier (49) as well as the IKZF1PLUS profile (56). Deletions of various sizes from single exons to the entire IKZF1 were detected in vcf2cytosure and also by the SV callers (Supplementary Figure 2A), both among the established mandatory subgroups and B-other ALL. CNAs affecting PAX5, such as amplification of exons 1–5 (Supplementary Figure 2B), intragenic deletions, and partial deletions leading to a PAX5::ZCCHC7 fusion, were also detected in both groups, albeit at a higher frequency in B-other ALL. The same was true for losses of CDKN2A and CDKN2B. Deletions in RB1, EBF1, ETV6, ERG (Supplementary Figure 2C), and BTG1 were identified in isolated cases, whereas CNAs in the PAR1 region (Supplementary Figure 2D), which resulted in the juxtaposition of P2RY8 and CRLF2, were only observed among B-other ALL and DS-ALL. Deletion of ERG was the only lesion detected in two of the B-other samples (P050 and P114). Investigation of CNAs was not mandatory in the NOPHO 2008 trial protocol; however, the few samples with available information were concordant with the WGS findings.
Diagnostic yield in B-other ALL
A total of 36 B-other ALL and three DS-ALL, lacking stratifying aberrations in SoC, were investigated to determine the diagnostic yield. The analysis was restricted to recurrent aberrations that either define subgroups within the B-other group or have been suggested to impact outcome. Among these patients, 35 could be tentatively assigned to one of the emerging genetic categories based on the WGS findings. The lesions identified in B-other ALL are summarized in Figure 2B and Supplementary Table 4.
The most frequent aberrations were rearrangements that affected PAX5 (n = 17) and CRLF2 (n = 10). The alterations in PAX5 (PAX5-alt) were heterogeneous and included recurrent fusions with NOL4L (n = 4) (Supplementary Figure 3A), ZCCHC7 (n = 3), SNTA1 (n = 1), and DACH2 (n = 1), deletions (n = 9), or amplifications (n = 2) (13). PAX5-alt often co-occurred with other putative class-defining lesions, in particular samples harboring CRLF2 rearrangements (CRLF2-r). Both previously described types of CRLF2-r were found, i.e., translocations t(X;14)(p22.33;q32) (Supplementary Figure 3B) juxtaposing the IGH locus to CRLF2 (n = 3) and a P2RY8::CRLF2 fusion (n = 7) (57). Interestingly, CRLF2-r always co-occurred with PAX5-r, with the exception of the three DS-ALL that carried P2RY8::CRLF2 fusions as the only detected lesion. WGS also identified four cases harboring ZNF384 fusions; the partners were TCF3 (n = 3) (Supplementary Figure 3C) and TAF15 in P067. An ETV6::IKZF1 fusion signaling ETV6::RUNX1-like subgroup was detected in P105. Another sample harbored an ETV6 deletion together with the KMT2C::IKZF1 fusion, and as both lesions associate with ETV6::RUNX1-like ALL, the sample was classified as such (51). A FUS::ERG fusion was detected in sample P089. This fusion is rare but recurrent in ALL and has been associated with the ETV6::RUNX1-like gene expression profile (13). Two recurrent aberrations were also found in one patient each, a MEF2D::BCL9 fusion (P078) and an IGH::ID4 fusion (P091).
In addition, WGS detected isolated ERG deletions in one sample (P050) and a rearrangement affecting the IGH locus in sample P077. The corresponding discrepant pairs mapped to the long non-coding RNA CCDC26 at 8q24; however, no cluster of discordant reads supporting DUX4-r was found in our initial analysis, despite extensive manual scrutiny in IGV. In an attempt to overcome this shortcoming, we investigated all samples sequenced to a depth of 90× (n = 68), applying a command that specifically returns the number of discordant reads that link the IGH locus to any of the copies of DUX4/DUX4-like genes in hg19. This approach was successful and identified clusters of discordant reads in these two samples and sample P101 with no lesion detected previously. As many as 126, 31, and 183 read pairs supported an IGH::DUX4 rearrangement in P050, P077, and P101, respectively (Supplementary Table 5), while the median number of discordant read pairs in the remaining 65 samples was 0 (range, 0–6).
No putative class-defining lesion was identified in the remaining four B-other samples; the only lesions found by WGS were loss of CDKN2A/B, uniparental disomy (UPD) for chromosome 14, and ETV6 deletion (Figure 2B; Supplementary Table 4).
Analysis of WGS L-only 30× coverage
Finally, we investigated whether decreasing the coverage to 30× and L-only could be suitable in the diagnostic setting with two approaches. First, we in silico (58) down-sampled 10 leukemia samples (marked with two asterisks, Supplementary Table 3 and Supplementary Table 4), containing various aberrations (ETV6::RUNX1, TCF3::PBX1, KMT2A-r, BCR::ABL1, iAMP (21), and five B-other ALL) to 30× coverage and repeated the analysis described above. The comparison revealed that all the variants detected, i.e., aneuploidies, SVs, and focal CNAs, were also detectable in the corresponding down-sampled 30× data, and all 10 samples were allocated to the correct genetic subgroup.
Subsequently, DNA from 20 additional diagnostic BM samples, including two samples with low blast counts of 37% and 14%, respectively, was sequenced to 30× coverage and processed as described for L-only samples. A mandatory aberration or putative driver event was identified in 19/20 samples (Table 2). Chromosomal gains as in HeH or losses as in HoL (Figure 3A), as well as SVs leading to recurrent fusions, were correctly detected. Even in the samples containing a low percentage of blasts, 30× coverage could identify the class-defining lesion, e.g., the ETV6::RUNX1 fusion in P111 (Figure 3B) and the KMT2A::AFF1 fusion P120 (Figure 3C). ERG deletion was the only somatic aberration identified in sample P114. Targeted analysis revealed 34 read pairs in support of an IGH::DUX4 rearrangement compared to a median of 0 (range 0 to 3) pairs for the rest of the cases, thus confirming the presence of a DUX4 rearrangement in sample P114. A summary of the findings by SoC and WGS is presented in Figure 3D. Taken together, the results indicate that decreasing the sequencing depth to 30× enables the identification of clinically relevant genomic lesions in all the samples investigated irrespective of blast count.

Table 2 Summary of SoC and WGS findings in 30× L-only.
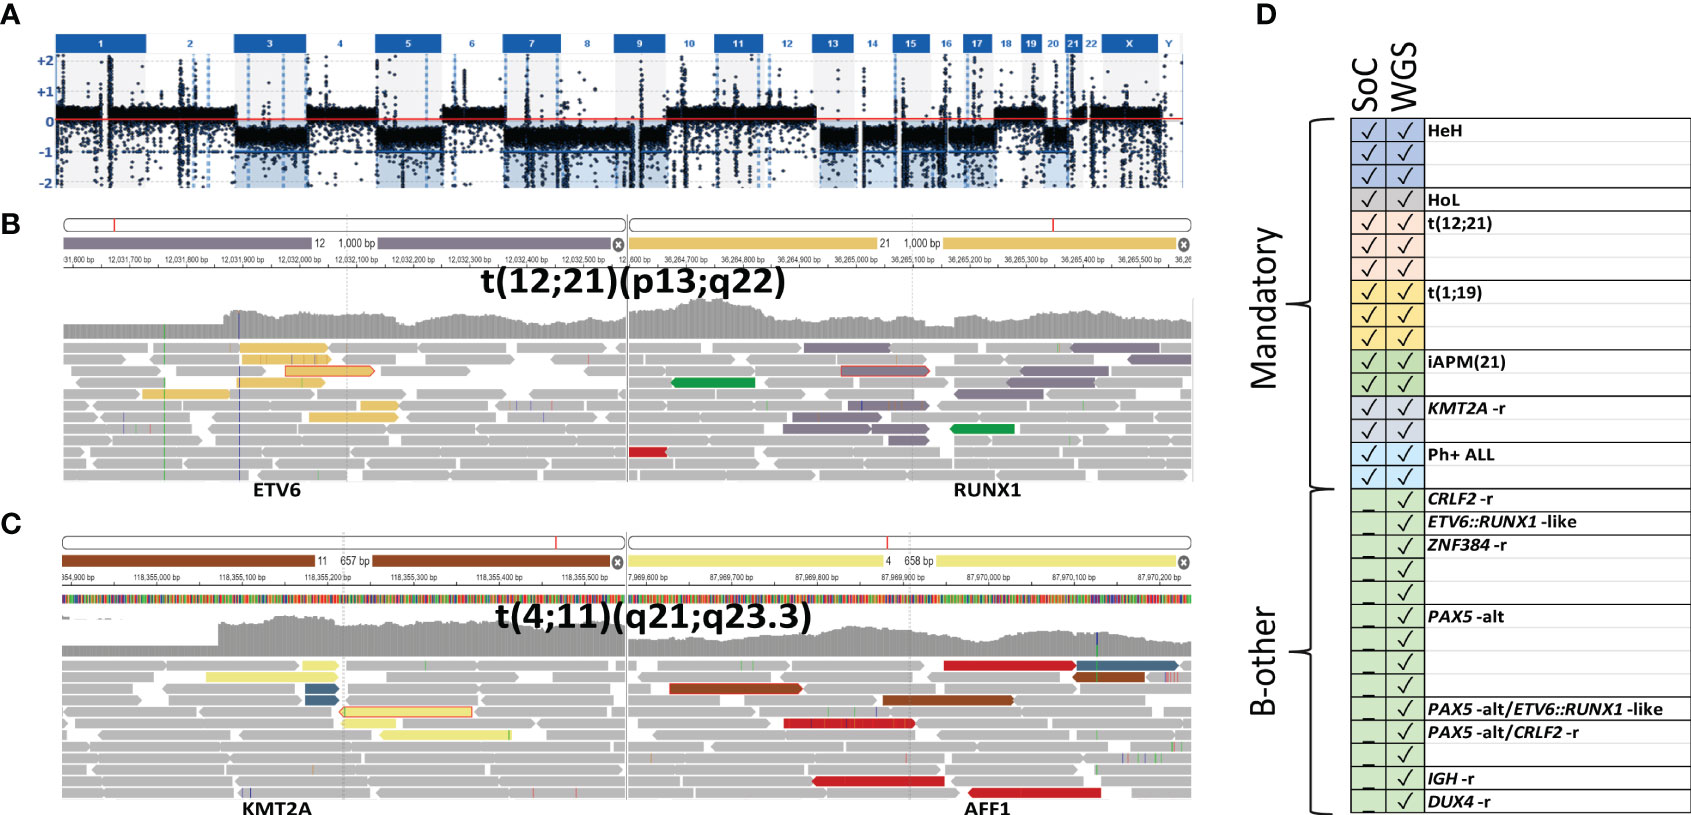
Figure 3 Illustration of representative variants detected through 30× L-only. Depiction from SCOUT’s plug-in IGV showing the discordant reads at both ends of the junction displayed in colored bars and concordant reads displayed in gray. (A) Low hypodiploidy (P116) screenshot from vcf2cytosure. The red line is set to indicate the signal intensity corresponding to diploid chromosomes; signals below indicate losses. (B) ETV6::RUNX1 (P111) and (C) KMT2A::AFF1 t(4;11) (P120). (D) Summary of the class-defining aberrations found with SoC versus WGS in 10 down-sampled as well as samples sequenced to 30×. SoC, standard of care; WGS, whole-genome sequencing.
Discussion
As the goal of this study was to test the feasibility to replace current multimodal diagnostics with WGS, we assessed the method’s performance to detect all aberrations mandatory in the current treatment protocol for pediatric B-cell ALL patients in the clinical setting. The results show that WGS successfully detected all mandatory events and identified emerging class-defining lesions in the majority of B-other ALL cases. In addition to primary aberrations, the combined analysis of SVs and CNAs enabled the identification of focal and larger losses/gains in all the genes included in the UKALL-CNA classifier (49) and the IKZF+ profile (56). Hence, the very high concordance between WGS findings and SoC results and the excellent diagnostic performance (summarized in Supplementary Figure 4) validate our approach for data analysis and interpretation and underscores the utility of WGS as a powerful standalone method in pediatric B-cell ALL diagnostics.
Beyond the established genetic subgroups, the detection of novel genetic lesions in ALL is becoming rapidly relevant, as potentially targetable (13, 16) or lesions affecting outcome have been described (7, 8, 10–16, 51–55). The present approach enabled the identification of at least one potentially class-defining lesion in the majority of B-other ALL (35/39) samples. The most frequently detected lesion was PAX5-alt; deletions or amplifications causing haploinsufficiency for PAX5 were detected in eight of the nine B-other ALL, where PAX5-alt was the sole potentially class-defining lesion identified, suggesting that PAX5 haploinsufficiency might also be a primary lesion. However, PAX5-alt often co-occurred with other class-defining lesions including eight samples with established primary aberrations, which indicates that PAX5-alt might also be a secondary alteration. CRLF2-r was detected in 10 B-other ALLs and co-occurred with PAX5 lesions, but never together with any of the established class-defining aberrations. CRLF2-r was found as an isolated lesion in the three DS-ALL cases, which is consistent with previous findings that show a high prevalence of CRLF2-r among DS-ALL (61). In addition, other recurrent aberrations such as ZNF384-r (14), MEF2D-r (11), IGH::ID4 (62), lesions indicating ETV6::RUNX1-like ALL such as ETV6::IKZF1 (51), or the very rare FUS::ERG fusion (63) were identified among B-other ALL.
While short-read WGS recognized all the mandatory events and many emerging lesions among B-other ALL, no discordant reads linking together DUX4 gene and IGH locus were found in our initial analysis, neither using the L/N or L-only approach in any of the samples analyzed. Several groups have shown that analysis of global gene expression profiles obtained from RNA-seq is an option to detect DUX4 rearrangements, as samples harboring DUX4-r will cluster together (13, 51, 64). In agreement with these studies, samples P077 and P101 had clustered with DUX4-r according to global gene expression analysis, although RNA-seq also failed to detect the IGH::DUX4 fusion transcript (65). Our study included two additional samples suspected to harbor DUX4-r indicated by the presence of ERG deletion (P050 and P114). We, therefore, searched for IGH::DUX4-r using a targeted approach focusing on the genomic regions where these genes are located. The approach was successful and identified a high number of discordant reads in support of an IGH::DUX4-r in these four samples, which was easily discernible from the low signal found among the other samples. Interestingly, the initial SV analysis of the WGS data had revealed an IGH-r in P077, and previous examination by 3′RACE had shown a complex rearrangement with intronic sequence from the CCDC26 locus at 8q24, inserted at the junction between IGH and DUX4, likely explaining the relatively low number of discordant reads linking together IGH and DUX4 in this particular sample. Thus, we found an IGH::DUX4-r in 4/39 samples (10%); the discrepancy with other studies that have found a prevalence ranging from 16% to 41% (20, 51) might be due to differences in the bioinformatics approaches or biases in sample selection.
Although WGS represents an unbiased method to interrogate the entire genome, data analysis and interpretation are still challenging. The complexity of the results generated by WGS, partially driven by repetitive genomic elements and benign individual variants, requires effective filtering steps to extract and interpret the relevant findings. This problem was significantly alleviated through annotation using the SweGen reference cohort (43), and the curated in-house database of artifacts and recurrent variants with an observed frequency above 0.02 (44). Furthermore, the use of a short list of genes/regions involved in mandatory and emerging aberrations was instrumental to extract clinically relevant information in an effective manner.
The identification of ploidy changes was straightforward with both the L-only and L/N analyses, and vcf2cytosure correctly identified the expected gains and losses. However, the herein analyzed samples had modal numbers between 53–60 (HeH) and 39 (HoL), implying that the majority of chromosomes were diploid. Potential problems regarding the interpretation of WGS data from L-only may arise for samples if the number of chromosomes is instead close to the haploid genome (n) or multiples thereof, as is the case in near haploid ALL (n±, <30 chromosomes) or near tri/tetraploidy (3n±/4n±, 58–80/81–103 chromosomes). Moreover, the distinction between HeH and duplicated HoL/NH (66) may be challenging using L-only analysis. Nevertheless, as chromosomal gains and losses in these subgroups are not random, the risk of misinterpretation is limited by careful assessment of gains/losses of specific chromosomes (66, 67). These issues can also be solved by including a normal reference as required by ASCAT that enables the detection of CNN-LOH and UPD in addition to aneuploidies.
Most studies have used target sequencing depths ranging from 60× to 90× to assess the diagnostic yield of WGS in hematological malignancies (15, 19, 20, 60). In a study with an effective mean coverage of 50×, Duncavage and coworkers found that the sensitivity was 100% for the detection of CNVs and SVs but decreased to 84.6% for SNVs (19). In the present study, we explored whether decreasing the sequencing depth to 30× could be suitable in the diagnostic setting of ALL and found that 30× could identify all clinically relevant primary aberrations. Moreover, the comparison to SoC demonstrated concordant findings for all cases. Also, a KMT2A-r present in only 14% of the cells was confidently detected by targeted analysis of 30× WGS and the L-only approach. These promising findings regarding SV and aneuploidy detection in ALL need, however, further validation in larger studies that include more samples with a low blast count.
In addition to analytical accuracy, the delivery of a timely report to the treating clinician together with cost–benefit aspects is a critical parameter in the implementation of diagnostic tests. In the current ALL trial protocol, the information regarding high-risk genetics and targetable aberrations is required by day 14 at the latest. This precludes using a remission sample or cultured fibroblast DNA from a skin biopsy as the source of constitutional DNA for the L/N analysis in the diagnostic setting. Since the analysis of L-only was equally successful in the identification of all the relevant lesions, we suggest that for diagnostic purposes, this may be the preferred approach. Harmonization and batching with samples investigated for other diseases, e.g., germline conditions, at our hospital were crucial to reduce TAT. Also, filtering the WGS data with a short list significantly simplifies the interpretation task, enabling the delivery of the clinical report within the required TAT. In addition to the time aspect, using L-only will influence the cost–benefit calculations positively, which, together with the steady drop in sequencing costs over the past years, may render replacing the current multimodal SoC with WGS a realistic option (18, 68). The micro-costing aspects of replacing SoC with WGS are addressed in an ongoing prospective study of patients diagnosed with acute leukemia (69); however, a preliminary estimation indicates that assuming that WGS can replace the current multimodal SoC testing, the cost per patient will increase with a factor of roughly 1.2 (data not shown).
Increasing the clinical benefit of WGS will also contribute to driving the cost–benefit balance in the desired direction. While the present study was designed to validate the diagnostic accuracy of somatic lesions relevant for ALL stratification, the data generated by WGS can be further used for other diagnostic purposes. In ALL, the early response to therapy is the most important prognostic factor, and thus, monitoring response is critical to managing the individual patient. In a proof-of-principle study, WGS has been shown to enable the identification of patient-specific unique sequences that constitute highly specific and sensitive markers that yielded quantitative assays whose performance can potentially outperform SoC (70). Moreover, the genomic data provided by WGS can also be used to extract pharmacogenetic information regarding variants that affect drug metabolism or to investigate the presence of germline variants, information that may contribute additional valuable input to patient management (7).
In summary, we identified all samples with ploidy changes and called the individual trisomies/tetrasomies or monosomies correctly. Moreover, we detected the SVs that lead to oncogenic gene fusions or iAMP (21) and were able to determine CNA profiles. The WGS results generated showed excellent concordance with SoC findings and allowed allocation to the correct genetic subgroups in all cases. In addition, WGS detected lesions not routinely investigated in SoC, and consequently, we were able to identify primary class-defining aberrations in the majority of B-other ALL samples including DUX4-r and to allocate the samples to one of the emerging genetic subgroups. We conclude that our strategy was successful in extracting clinically relevant information from paired-end WGS and that the analysis of L-only detected all clinically relevant aberrations with the same accuracy as paired analysis. Hence, WGS as the sole method represents an accurate and promising diagnostic tool in ALL diagnostics.
Data availability statement
The data presented in the study are deposited in the https://figshare.scilifelab.se repository, accession number 23530605.
Ethics statement
The studies involving human participants were reviewed and approved by the Ethical Review Board at Stockholm County or the Uppsala County. Written informed consent to participate in this study was provided by the participants’ legal guardian/next of kin.
Author contributions
GB, LF, RR, LC, BJ, LP, TF, and VW designed the study and secured the funding. JE, AS, HL, and KM performed the bioinformatics analysis. GB, JE, and FR performed the data acquisition, analysis, and interpretation, and IÖ contributed to data analysis and interpretation. JN, ACS, and SS contributed to the data acquisition, and IÖ, LO-A, AS, and COP contributed to the data interpretation. FR and GB wrote the manuscript. LF, JN, IÖ, and RR contributed to the writing of the manuscript. All authors revised and approved the final version of the manuscript.
Funding
This work was supported by the Science for Life Laboratory Swedish Genomes Program. The Swedish Genomes Program has been made available with support from the Knut and Alice Wallenberg Foundation. We also acknowledge the support from the Swedish Childhood Cancer Fund (Barncancerfonden) through grants TJ 2021-0082, PR2019-0072, and PR 2022-00.76, and the Swedish Research Council grant 2018-05661 under the frame of ERA PerMed.
Acknowledgments
We like to thank Vahid Shirvani for his valuable contribution to facilitating the manual analysis of WGS data. We would also like to acknowledge Genomic Medicine Sweden for supporting the study. Sequencing was performed by the SNP&SEQ Technology Platform in Uppsala and Clinical Genomics in Stockholm. The SNP&SEQ facility is part of the National Genomics Infrastructure (NGI) Sweden and Science for Life Laboratory. The SNP&SEQ Platform is also supported by the Swedish Research Council and the Knut and Alice Wallenberg Foundation.
Conflict of interest
Author RR received honoraria from the companies AbbVie, AstraZeneca, Janssen, Illumina, and Roche.
The remaining authors declare that the research was conducted in the absence of any commercial or financial relationships that could be construed as a potential conflict of interest.
Publisher’s note
All claims expressed in this article are solely those of the authors and do not necessarily represent those of their affiliated organizations, or those of the publisher, the editors and the reviewers. Any product that may be evaluated in this article, or claim that may be made by its manufacturer, is not guaranteed or endorsed by the publisher.
Supplementary material
The Supplementary Material for this article can be found online at: https://www.frontiersin.org/articles/10.3389/fonc.2023.1217712/full#supplementary-material
Supplementary Figure 1 | Visualization of aneuploidies and large CNAs. Screenshots from vcf2cytosure (upper panel) and ASCAT (lower panel) illustrating the results for a representative sample with, (A) HeH (P029) showing the signal intensity across all chromosomes. (B) iAMP (21) showing the signal intensity along chromosome 21 (P075). The red line indicates the signal intensity corresponding to diploid chromosomes, signals above this threshold indicate gain and below losses.
Supplementary Figure 2 | Visualization of focal CNAs. IGV screenshots from representative samples illustrating representative CNAs. IGV screenshots show the discordant reads at both ends of the junction displayed in colored bars and concordant reads displayed in grey. showing (A) IKZF1 deletion of exons 4-7 (P049), (B) amplification of PAX5 exons 2-5 (P060), (C) ERG deletion (P050), (D) PAR1 deletion (P049) resulting in the fusion CRLF2::P2RY8.
Supplementary Figure 3 | Illustration of representative SVs in B-other group. Screenshots from IGV and Circos plot illustrating representative B-other aberrations. IGV screenshots show the discordant reads at both ends of the junction displayed in colored bars and concordant reads displayed in grey. (A) dic(9;20) (P042), (B) IGH::CRLF2 t(X;14) (P057), (C) TCF3::ZNF384 t(12;19) (P052), (D) a rare fusion gene found in one case FUS::ERG t(16;21) (P089).
Supplementary Figure 4 | Comparison SoC and WGS. Chart showing which SoC methods can be used to detect the primary class-defining lesions in ALL or to call CNA profiles. The brackets indicate that some but not all lesions included in the subgroup can be detected by the method. The asterisk denotes subgroups defined by global gene expression analysis.
Supplementary Table 1 | Mandatory aberrations in ALLtogether treatment protocol.
Supplementary Table 2 | Short list of clinically relevant genes/genomic regions in ALL Chr., chromosome; HGNC ID, HUGO Gene Nomenclature committee ID.
Supplementary Table 3 | Genomic findings in samples harboring mandatory aberrations. UPN, unique patient number; HeH, high hyperdiploidy; iAMP (21), intrachromosomal amplification of chromosome 21;KMT2A-r, KMT2A rearrangements; SoC, standard of care; seq[GRCh37], Genome Reference Consortium Human Build 37; UPD, uniparental disomy; CNN-LoH, Copy number neutral- loss of heterozygosity. The karyotype strings derived from chromosome banding analysis and the WGS-revised strings are written following the International Standards for Cytogenetic Nomenclature, ISCN 2022 rules (59).
Supplementary Table 4 | Summary of SoC and WGS findings in B-other group. UPN, unique patient number; Seq[GRCh37], Genome Reference Consortium Human Build 37; CNN-LoH, Copy number neutral- loss of heterozygosity; PAX5-alt, PAX5 alterations; CRLF2-r, CRLF2 rearrangements; ZFN384-r, ZFN384 rearrangements; IGH-r, IGH rearrangement; DUX4-r, DUX4 rearrangements. The karyotype strings derived from chromosome banding analysis and the WGS-revised strings are written following the International Standards for Cytogenetic Nomenclature, ISCN 2022 rules (59).
Supplementary Table 5 | Number of reads supporting an IGH::DUX4 rearrangement.
Supplementary information | SAMtools command to count the reads supporting IGH::DUX4-r.
Abbreviations
WGS, whole-genome sequencing; ALL, acute lymphoblastic leukemia; SoC, standard of care; L, leukemia; N, paired germline (normal) sample; L/N, paired leukemia/normal analysis; L-only, leukemia-only analysis; SNV, single-nucleotide variant; CNA, copy-number alteration; SV, structural variant; DS-ALL, Down syndrome ALL; BM, bone marrow; ICC, International Consensus Classification; HeH, high hyperdiploidy; HoL, low hypodiploidy; CNN, copy number neutral; UPD, uniparental disomy; VEP, variant effect predictor; iAMP (21), intra-chromosomal amplification (21); KMT2A-r, KMT2A rearrangements; CRLF2-r, CRLF2 rearrangements; PAX5-alt, PAX5 alterations.
References
1. Toft N, Birgens H, Abrahamsson J, Griškevičius L, Hallböök H, Heyman M, et al. Results of NOPHO ALL2008 treatment for patients aged 1-45 years with acute lymphoblastic leukemia. Leukemia (2018) 32(3):606–15. doi: 10.1038/leu.2017.265
2. O'Connor D, Enshaei A, Bartram J, Hancock J, Harrison CJ, Hough R, et al. Genotype-specific minimal residual disease interpretation improves stratification in pediatric acute lymphoblastic leukemia. J Clin Oncol (2018) 36(1):34–43. doi: 10.1200/JCO.2017.74.0449
3. Bergfelt Lennmyr E, Engvall M, Barbany G, Fogelstrand L, Rhodin H, Hallböök H. Cytogenetic aberrations in adult acute lymphoblastic leukemia-A population-based study. EJHaem (2021) 2(4):813–7. doi: 10.1002/jha2.300
4. Harrison CJ, Haas O, Harbott J, Biondi A, Stanulla M, Trka J, et al. Detection of prognostically relevant genetic abnorMalities in childhood B-cell precursor acute lymphoblastic leukaemia: recommendations from the Biology and Diagnosis Committee of the International Berlin-Frankfürt-Münster study group. Br J Haematol (2010) 151(2):132–42. doi: 10.1111/j.1365-2141.2010.08314.x
5. Mullighan K. Molecular pathways and targets in B-cell progenitor acute lymphoblastic leukemia. In: Clinical Management of Acute Lymphoblastic Leukemia. Switzerland:Springer (2022). p. 3–32.
6. de Haas V, Ismaila N, Advani A, Arber DA, Dabney RS, Patel-Donelly D, et al. Initial diagnostic work-up of acute leukemia: ASCO clinical practice guideline endorsement of the college of american pathologists and american society of hematology guideline. J Clin Oncol (2019) 37(3):239–53. doi: 10.1200/JCO.18.01468
7. Tran TH, Hunger SP. The genomic landscape of pediatric acute lymphoblastic leukemia and precision medicine opportunities. Semin Cancer Biol (2022) 84:144–52. doi: 10.1016/j.semcancer.2020.10.013
8. Alaggio R, Amador C, Anagnostopoulos I, Attygalle AD, Araujo IBO, Berti E, et al. The 5th edition of the world health organization classification of haematolymphoid tumours: lymphoid neoplasms. Leukemia (2022) 36(7):1720–48. doi: 10.1038/s41375-022-01620-2
9. Arber DA, Orazi A, Hasserjian RP, Borowitz MJ, Calvo KR, Kvasnicka HM, et al. International Consensus Classification of Myeloid Neoplasms and Acute Leukemias: integrating morphologic, clinical, and genomic data. Blood (2022) 140(11):1200–28. doi: 10.1182/blood.2022015850
10. Roberts KG, Morin RD, Zhang J, Hirst M, Zhao Y, Su X, et al. Genetic alterations activating kinase and cytokine receptor signaling in high-risk acute lymphoblastic leukemia. Cancer Cell (2012) 22(2):153–66. doi: 10.1016/j.ccr.2012.06.005
11. Gu Z, Churchman M, Roberts K, Li Y, Liu Y, Harvey RC, et al. Genomic analyses identify recurrent MEF2D fusions in acute lymphoblastic leukaemia. Nat Commun (2016) 7:13331. doi: 10.1038/ncomms13331
12. Inaba H, Azzato EM, Mullighan CG. Integration of next-generation sequencing to treat acute lymphoblastic leukemia with targetable lesions: the st. Jude children's research hospital approach. Front Pediatr (2017) 5:258. doi: 10.3389/fped.2017.00258
13. Gu Z, Churchman ML, Roberts KG, Moore I, Zhou X, Nakitandwe J, et al. PAX5-driven subtypes of B-progenitor acute lymphoblastic leukemia. Nat Genet (2019) 51(2):296–307. doi: 10.1038/s41588-018-0315-5
14. Hirabayashi S, Ohki K, Nakabayashi K, Ichikawa H, Momozawa Y, Okamura K, et al. ZNF384-related fusion genes define a subgroup of childhood B-cell precursor acute lymphoblastic leukemia with a characteristic immunotype. Haematologica (2017) 102(1):118–29. doi: 10.3324/haematol.2016.151035
15. Schwab C, Cranston RE, Ryan SL, Butler E, Winterman E, Hawking Z, et al. Integrative genomic analysis of childhood acute lymphoblastic leukaemia lacking a genetic biomarker in the UKALL2003 clinical trial. Leukemia (2022) 37:529–538. doi: 10.21203/rs.3.rs-2159503/v1
16. Krstic A, Rezayee F, Saft L, Hammarsjö A, Svenberg P, Barbany G. Case Report: Whole genome sequencing identifies CCDC88C as a novel JAK2 fusion partner in pediatric T-cell acute lymphoblastic leukemia. Front Pediatr (2022) 10:1082986. doi: 10.3389/fped.2022.1082986
17. Runheim H, Pettersson M, Hammarsjö A, Nordgren A, Henriksson M, Lindstrand A, et al. The cost-effectiveness of whole genome sequencing in neurodevelopmental disorders. Sci Rep (2023) 13(1):6904. doi: 10.1038/s41598-023-33787-8
18. Cuppen E, Elemento O, Rosenquist R, Nikic S, IJ M, ID Z, et al. Implementation of whole-genome and transcriptome sequencing into clinical cancer care. JCO Precis Oncol (2022) 6:e2200245. doi: 10.1200/PO.22.00245
19. Duncavage EJ, Schroeder MC, O'Laughlin M, Wilson R, MacMillan S, Bohannon A, et al. Genome sequencing as an alternative to cytogenetic analysis in myeloid cancers. N Engl J Med (2021) 384(10):924–35. doi: 10.1056/NEJMoa2024534
20. Ryan SL, Peden JF, Kingsbury Z, Schwab CJ, James T, Polonen P, et al. Whole genome sequencing provides comprehensive genetic testing in childhood B-cell acute lymphoblastic leukaemia. Leukemia (2023) 37:518–528. doi: 10.21203/rs.3.rs-2151721/v1
21. Leongamornlert D, Gutiérrez-Abril J, Lee SW, Barretta E, Creasey T, Gundem G, et al. Diagnostic utility of whole genome sequencing in adults with B-other acute lymphoblastic leukemia. Blood Adv (2023) 7(15):3862–3873. doi: 10.1182/bloodadvances.2022008992
22. Marincevic-Zuniga Y, Dahlberg J, Nilsson S, Raine A, Nystedt S, Lindqvist CM, et al. Transcriptome sequencing in pediatric acute lymphoblastic leukemia identifies fusion genes associated with distinct DNA methylation profiles. J Hematol Oncol (2017) 10(1):148. doi: 10.1186/s13045-017-0515-y
23. Sayyab S, Lundmark A, Larsson M, Ringnér M, Nystedt S, Marincevic-Zuniga Y, et al. Mutational patterns and clonal evolution from diagnosis to relapse in pediatric acute lymphoblastic leukemia. Sci Rep (2021) 11(1):15988. doi: 10.1038/s41598-021-95109-0
24. Garcia M, Juhos S, Larsson M, Olason PI, Martin M, Eisfeldt J, et al. Sarek: A portable workflow for whole-genome sequencing analysis of germline and somatic variants. F1000Res (2020) 9:63. doi: 10.12688/f1000research.16665.2
25. Di Tommaso P, Chatzou M, Floden EW, Barja PP, Palumbo E, Notredame C. Nextflow enables reproducible computational workflows. Nat Biotechnol (2017) 35(4):316–9. doi: 10.1038/nbt.3820
26. Ewels PA, Peltzer A, Fillinger S, Patel H, Alneberg J, Wilm A, et al. The nf-core framework for community-curated bioinformatics pipelines. Nat Biotechnol (2020) 38(3):276–8. doi: 10.1038/s41587-020-0439-x
27. Lampa S, Dahlö M, Olason PI, Hagberg J, Spjuth O. Lessons learned from implementing a national infrastructure in Sweden for storage and analysis of next-generation sequencing data. Gigascience (2013) 2(1):9. doi: 10.1186/2047-217X-2-9
28. Andrews S. Babraham Institute . Available at: https://www.bioinformatics.babraham.ac.uk/projects/fastqc/.
29. Li H. Aligning sequence reads, clone sequences and assembly contigs with BWA-MEM (2013). Available at: https://arxiv.org/abs/1303.3997.
30. McKenna A, Hanna M, Banks E, Sivachenko A, Cibulskis K, Kernytsky A, et al. The Genome Analysis Toolkit: a MapReduce framework for analyzing next-generation DNA sequencing data. Genome Res (2010) 20(9):1297–303. doi: 10.1101/gr.107524.110
31. Ewels P, Magnusson M, Lundin S, Käller M. MultiQC: summarize analysis results for multiple tools and samples in a single report. Bioinformatics (2016) 32(19):3047–8. doi: 10.1093/bioinformatics/btw354
32. BALSAMIC. Github . Available at: https://github.com/Clinical-Genomics/BALSAMIC.
33. SCOUT. Github . Available at: https://github.com/Clinical-Genomics/scout.
34. Lindstrand A, Eisfeldt J, Pettersson M, Carvalho CMB, Kvarnung M, Grigelioniene G, et al. From cytogenetics to cytogenomics: whole-genome sequencing as a first-line test comprehensively captures the diverse spectrum of disease-causing genetic variation underlying intellectual disability. Genome Med (2019) 11(1):68. doi: 10.1186/s13073-019-0675-1
35. vcf2cytosure. Github . Available at: https://github.com/NBISweden/vcf2cytosure.
36. Van Loo P, Nordgard SH, Lingjærde OC, Russnes HG, Rye IH, Sun W, et al. Allele-specific copy number analysis of tumors. Proc Natl Acad Sci U S A. (2010) 107(39):16910–5. doi: 10.1073/pnas.1009843107
37. FindSV. Github . Available at: https://github.com/J35P312/FindSV.
38. Abyzov A, Urban AE, Snyder M, Gerstein M. CNVnator: an approach to discover, genotype, and characterize typical and atypical CNVs from family and population genome sequencing. Genome Res (2011) 21(6):974–84. doi: 10.1101/gr.114876.110
39. Eisfeldt J, Vezzi F, Olason P, Nilsson D, Lindstrand A. TIDDIT, an efficient and comprehensive structural variant caller for massive parallel sequencing data. F1000Res (2017) 6:664. doi: 10.12688/f1000research.11168.1
40. McLaren W, Gil L, Hunt SE, Riat HS, Ritchie GR, Thormann A, et al. The ensembl variant effect predictor. Genome Biol (2016) 17(1):122. doi: 10.1186/s13059-016-0974-4
41. Chen X, Schulz-Trieglaff O, Shaw R, Barnes B, Schlesinger F, Källberg M, et al. Manta: rapid detection of structural variants and indels for germline and cancer sequencing applications. Bioinformatics (2016) 32(8):1220–2. doi: 10.1093/bioinformatics/btv710
42. Rausch T, Zichner T, Schlattl A, Stütz AM, Benes V, Korbel JO. DELLY: structural variant discovery by integrated paired-end and split-read analysis. Bioinformatics (2012) 28(18):i333–i9. doi: 10.1093/bioinformatics/bts378
43. Ameur A, Dahlberg J, Olason P, Vezzi F, Karlsson R, Martin M, et al. SweGen: a whole-genome data resource of genetic variability in a cross-section of the Swedish population. Eur J Hum Genet (2017) 25(11):1253–60. doi: 10.1038/ejhg.2017.130
44. Magnusson M, Eisfeldt J, Nilsson D, Rosenbaum A, Wirta V, Lindstrand A, et al. Loqusdb: added value of an observations database of local genomic variation. BMC Bioinf (2020) 21(1):273. doi: 10.1186/s12859-020-03609-z
45. Lemmers RJ, van der Vliet PJ, Klooster R, Sacconi S, Camaño P, Dauwerse JG, et al. A unifying genetic model for facioscapulohumeral muscular dystrophy. Science (2010) 329(5999):1650–3. doi: 10.1126/science.1189044
46. SAMtools. Samtools (2023). Available at: https://github.com/samtools/samtools.
47. Danecek P, Bonfield JK, Liddle J, Marshall J, Ohan V, Pollard MO, et al. Twelve years of SAMtools and BCFtools. Gigascience (2021) 10(2). doi: 10.1093/gigascience/giab008
48. A Treatment Protocol for Participants 0-45 Years With Acute Lymphoblastic Leukaemia . Available at: https://clinicaltrials.gov/ct2/show/NCT03911128.
49. Moorman AV, Enshaei A, Schwab C, Wade R, Chilton L, Elliott A, et al. A novel integrated cytogenetic and genomic classification refines risk stratification in pediatric acute lymphoblastic leukemia. Blood (2014) 124(9):1434–44. doi: 10.1182/blood-2014-03-562918
50. Stanulla M, Cave H, Moorman AV. IKZF1 deletions in pediatric acute lymphoblastic leukemia: still a poor prognostic marker? Blood (2020) 135(4):252–60. doi: 10.1182/blood.2019000813
51. Lilljebjorn H, Henningsson R, Hyrenius-Wittsten A, Olsson L, Orsmark-Pietras C, von Palffy S, et al. Identification of ETV6-RUNX1-like and DUX4-rearranged subtypes in paediatric B-cell precursor acute lymphoblastic leukaemia. Nat Commun (2016) 7:11790. doi: 10.1038/ncomms11790
52. Boer JM, Valsecchi MG, Hormann FM, Antić Ž, Zaliova M, Schwab C, et al. Favorable outcome of NUTM1-rearranged infant and pediatric B cell precursor acute lymphoblastic leukemia in a collaborative international study. Leukemia (2021) 35(10):2978–82. doi: 10.1038/s41375-021-01333-y
53. Russell LJ, Capasso M, Vater I, Akasaka T, Bernard OA, Calasanz MJ, et al. Deregulated expression of cytokine receptor gene, CRLF2, is involved in lymphoid transformation in B-cell precursor acute lymphoblastic leukemia. Blood (2009) 114(13):2688–98. doi: 10.1182/blood-2009-03-208397
54. Raffini LJ, Slater DJ, Rappaport EF, Lo Nigro L, Cheung NK, Biegel JA, et al. Panhandle and reverse-panhandle PCR enable cloning of der(11) and der(other) genomic breakpoint junctions of MLL translocations and identify complex translocation of MLL, AF-4, and CDK6. Proc Natl Acad Sci U S A. (2002) 99(7):4568–73. doi: 10.1073/pnas.062066799
55. Clappier E, Auclerc MF, Rapion J, Bakkus M, Caye A, Khemiri A, et al. An intragenic ERG deletion is a marker of an oncogenic subtype of B-cell precursor acute lymphoblastic leukemia with a favorable outcome despite frequent IKZF1 deletions. Leukemia (2014) 28(1):70–7. doi: 10.1038/leu.2013.277
56. Stanulla M, Dagdan E, Zaliova M, Moricke A, Palmi C, Cazzaniga G, et al. IKZF1(plus) defines a new minimal residual disease-dependent very-poor prognostic profile in pediatric B-cell precursor acute lymphoblastic leukemia. J Clin Oncol (2018) 36(12):1240–9. doi: 10.1200/JCO.2017.74.3617
57. Russell LJ, Jones L, Enshaei A, Tonin S, Ryan SL, Eswaran J, et al. Characterisation of the genomic landscape of CRLF2-rearranged acute lymphoblastic leukemia. Genes Chromosomes Cancer. (2017) 56(5):363–72. doi: 10.1002/gcc.22439
58. Duncavage EJ, Coleman JF, de Baca ME, Kadri S, Leon A, Routbort M, et al. Recommendations for the use of in silico approaches for next-generation sequencing bioinformatic pipeline validation: A joint report of the association for molecular pathology, association for pathology informatics, and college of american pathologists. J Mol Diagn. (2023) 25(1):3–16. doi: 10.1016/j.jmoldx.2022.09.007
59. Jean McGowan-Jordan RJH, Moore S. An International System for Human Cytogenomic Nomenclature 2022: Karger. Switzerland:Krager (2022).
60. Höllein A, Twardziok SO, Walter W, Hutter S, Baer C, Hernandez-Sanchez JM, et al. The combination of WGS and RNA-Seq is superior to conventional diagnostic tests in multiple myeloma: Ready for prime time? Cancer Genet (2020) 242:15–24. doi: 10.1016/j.cancergen.2020.01.001
61. Buitenkamp TD, Pieters R, Gallimore NE, van der Veer A, Meijerink JP, Beverloo HB, et al. Outcome in children with Down's syndrome and acute lymphoblastic leukemia: role of IKZF1 deletions and CRLF2 aberrations. Leukemia (2012) 26(10):2204–11. doi: 10.1038/leu.2012.84
62. Russell LJ, Akasaka T, Majid A, Sugimoto KJ, Loraine Karran E, Nagel I, et al. t(6;14)(p22;q32): a new recurrent IGH@ translocation involving ID4 in B-cell precursor acute lymphoblastic leukemia (BCP-ALL). Blood (2008) 111(1):387–91. doi: 10.1182/blood-2007-07-092015
63. Kanazawa T, Ogawa C, Taketani T, Taki T, Hayashi Y, Morikawa A. TLS/FUS-ERG fusion gene in acute lymphoblastic leukemia with t(16;21)(p11;q22) and monitoring of minimal residual disease. Leuk Lymphoma. (2005) 46(12):1833–5. doi: 10.1080/10428190500162203
64. Zhang J, McCastlain K, Yoshihara H, Xu B, Chang Y, Churchman ML, et al. Deregulation of DUX4 and ERG in acute lymphoblastic leukemia. Nat Genet (2016) 48(12):1481–9. doi: 10.1038/ng.3691
65. Olga Krali YM-Z, Arvidsson G, Enblad AP, Lundmark A, Sayyab S, Zachariadis V, et al. Multimodal classification of molecular subtypes in pediatric acute lymphoblastic leukemia. medRxiv (2023). doi: 10.1101/2023.03.24.23287613
66. Safavi S, Forestier E, Golovleva I, Barbany G, Nord KH, Moorman AV, et al. Loss of chromosomes is the primary event in near-haploid and low-hypodiploid acute lymphoblastic leukemia. Leukemia (2013) 27(1):248–50. doi: 10.1038/leu.2012.227
67. Paulsson K, Johansson B. High hyperdiploid childhood acute lymphoblastic leukemia. Genes Chromosomes Cancer. (2009) 48(8):637–60. doi: 10.1002/gcc.20671
68. Rosenquist R, Cuppen E, Buettner R, Caldas C, Dreau H, Elemento O, et al. Clinical utility of whole-genome sequencing in precision oncology. Semin Cancer Biol (2022) 84:32–9. doi: 10.1016/j.semcancer.2021.06.018
69. Berglund E, Barbany G, Orsmark-Pietras C, Fogelstrand L, Abrahamsson J, Golovleva I, et al. A study protocol for validation and implementation of whole-genome and -transcriptome sequencing as a comprehensive precision diagnostic test in acute leukemias. Front Med (Lausanne). (2022) 9:842507. doi: 10.3389/fmed.2022.842507
70. Arthur C, Rezayee F, Mogensen N, Saft L, Rosenquist R, Nordenskjöld M, et al. Patient-specific assays based on whole-genome sequencing data to measure residual disease in children with acute lymphoblastic leukemia: A proof of concept study. Front Oncol (2022) 12:899325. doi: 10.3389/fonc.2022.899325
Keywords: B-cell acute lymphoblastic leukemia, whole-genome sequencing, genomic aberrations, diagnostic validation, class-defining genetic lesions
Citation: Rezayee F, Eisfeldt J, Skaftason A, Öfverholm I, Sayyab S, Syvänen AC, Maqbool K, Lilljebjörn H, Johansson B, Olsson-Arvidsson L, Pietras CO, Staffas A, Palmqvist L, Fioretos T, Cavelier L, Fogelstrand L, Nordlund J, Wirta V, Rosenquist R and Barbany G (2023) Feasibility to use whole-genome sequencing as a sole diagnostic method to detect genomic aberrations in pediatric B-cell acute lymphoblastic leukemia. Front. Oncol. 13:1217712. doi: 10.3389/fonc.2023.1217712
Received: 05 May 2023; Accepted: 17 July 2023;
Published: 14 August 2023.
Edited by:
Liren Qian, Fifth Medical Center of the PLA General Hospital, ChinaReviewed by:
Edwin Sonneveld, Princess Máxima Center for Childhood Oncology, NetherlandsSamuli Eldfors, Massachusetts General Hospital and Harvard Medical School, United States
Angela Hamblin, Oxford University Hospitals NHS Trust, United Kingdom
Copyright © 2023 Rezayee, Eisfeldt, Skaftason, Öfverholm, Sayyab, Syvänen, Maqbool, Lilljebjörn, Johansson, Olsson-Arvidsson, Pietras, Staffas, Palmqvist, Fioretos, Cavelier, Fogelstrand, Nordlund, Wirta, Rosenquist and Barbany. This is an open-access article distributed under the terms of the Creative Commons Attribution License (CC BY). The use, distribution or reproduction in other forums is permitted, provided the original author(s) and the copyright owner(s) are credited and that the original publication in this journal is cited, in accordance with accepted academic practice. No use, distribution or reproduction is permitted which does not comply with these terms.
*Correspondence: Fatemah Rezayee, ZmF0ZW1haC5yZXpheWVlQGtpLnNl