 Hongfang Zhao
 Luxuan Wang3†
 Chuan Fang
 Lijian Zhang
- 1Clinical Medicine College, Hebei University, Baoding, China
- 2Department of Neurosurgery, Affiliated Hospital of Hebei University, Baoding, China
- 3Department of Neurological Function Examination, Affiliated Hospital of Hebei University, Baoding, China
- 4Postdoctoral Research Station of Neurosurgery, Affiliated Hospital of Hebei University, Hebei University, Baoding, China
- 5Key Laboratory of Precise Diagnosis and Treatment of Glioma in Hebei Province, Affiliated Hospital of Hebei University, Hebei University, Baoding, China
Background: Circulating tumor cells (CTCs) could serve as a predictive biomarker in breast cancer (BC). Due to its high heterogeneity, the diagnostic and prognostic values of CTC are challenging.
Methods: We searched published studies from the databases of PubMed, Cochrane Library, Embase, and MEDLINE. The detection capability and hazard ratios (HRs) of CTCs were extracted as the clinical diagnosis and prognosis evaluation. Subgroup analyses were divided according to the detection methods, continents, treatment periods, therapeutic plans, and cancer stages.
Results: In this study, 35 publications had been retrieved with 8,935 patients enrolled. The diagnostic efficacy of CTC detection has 74% sensitivity and 98% specificity. The positive CTC detection (CTC+) would predict worse OS and PFS/DFS in both mid-therapy and post-therapy (HROS, 3.09; 95% CI, 2.17–4.39; HRPFS/DFS, 2.06; 95% CI, 1.72–2.47). Moreover, CTC+ indicated poor survival irrespective of the treatment phases and sampling times (HROS, 2.43; 95% CI, 1.85–3.19; HRPFS/DFS, 1.82; 95% CI, 1.66–1.99). The CTC+ was associated with poor survival regardless of the continents of patients (HROS = 2.43; 95% CI, 1.85–3.19).
Conclusion: Our study suggested that CTC+ was associated with a worse OS and PFS/DFS in the Asian population. The detection method, the threshold level of CTC+, therapeutic approaches, and sampling times would not affect its diagnostic and prognostic values.
Background
Breast cancer (BC) is the most common cancer and will be the primary leading cause of cancer-related mortality for women in the future (1, 2). Imaging and clinicopathological information are the traditional methods for diagnosis and prognosis assessment (3). However, those evaluations could not reflect the BC condition in real time. Thus, it is difficult to assign optimal treatments (4, 5). Therefore, there is considerable interest in developing more accurate and convenient methods for diagnosis and prognosis assessment.
Liquid biopsy has been considered as a non-invasive approach and utilized comprehensively in cancer research (6). The common analytes of liquid biopsy include circulating tumor cells (CTCs), circulating tumor DNA (ctDNA), and extracellular vesicles (7). CTCs are tumor cells which are shed from the primary cancers or secondary tumors. It could enter into the circulation system and cause secondary cancer formations consequently (8). Previous evidence showed that CTCs could represent tumor progression (9–11). Furthermore, the positive detection of CTCs (CTC+) in the circulation system could evaluate the survival of the patients (12). There has been an increasing number of literature emphasizing the potential of CTCs having an important role in diagnosis, prognosis, and therapeutic effect assessment in clinical settings (13–16).
Several meta-analyses have explored the relationships between CTC+ and cancer outcomes. In their study involving 2,957 patients from 27 cohorts, Jin and his colleagues revealed that CTCs indicated poor prognoses universally in lung cancers (14). Current studies also showed similar outcomes in hepatocellular carcinoma and pancreatic cancer (15, 16). Although the prognostic and predictive values of CTCs have been verified in many studies, some results were controversial (17). Further investigations are required to identify the factors that influence the diagnostic and prognostic value of CTC+. Additionally, there is a lack of sufficient research on the diagnostic and prognostic values of CTCs in BC, particularly in relation to the detection methods, therapeutic approaches, and cancer stages (18). Thus, the aims of our study are to investigate the factors that influence CTC+ and to analyze their associations with overall survival (OS), progression-free survival (PFS), and disease-free survival (DFS) of BC patients.
Methods
This study was prospectively registered in PROSPERO on 08 December 2022 (CRD42022379387) (19) and was performed based on the PRISMA reporting guidelines (Supplementary Tables 1, 2).
Retrieval strategy and eligibility criteria
The systematic review of the English language articles was conducted based on the PubMed, Cochrane Library, Embase, and MEDLINE databases from 1 January 1970 to 27 April 2023. The detailed search strategies are exhibited in Supplementary Table 3. The inclusion criteria were as follows: 1) the clinical sample sources were the peripheral blood samples; 2) the studies provide data of true-positive and false-positive rates for diagnosis detection (3); OS or PFS/DFS was reported as HR of univariate Cox analysis and the 95% confidence interval (CI) was considered valid data; and 4) the patients had BC, whether it had metastasized or not. Both prospective and retrospective observational cohort studies were eligible for inclusion.
Data extraction
A standard table was constructed for information extraction. Two authors (HF and LX) conducted an independent literature review and recorded their findings. In order to control for selection bias, the authors compared their extracted data at the end of the revision process and resolved any disparities. Duplicate items were removed. If they could not solve the differences, a senior researcher (LJ) performed the data extraction again.
Main outcomes and study quality assessment
The purpose of this study was to evaluate the diagnostic efficiency of CTC detection and the prognostic value of CTCs. Firstly, we evaluated the quality of all the diagnostic test studies according to the Quality Assessment of Diagnosis Accuracy Studies-2. Secondly, the Newcastle-Ottawa Scale was used to assess the quality of the studies included in the prognosis analysis (20). This scale awarded points based on patient selection (maximum of 4 points), outcome assessment (maximum of 3 points), and comparability of the cohort (maximum of 2 points), with a maximum total of 9 points. The risk of bias was conducted using the Risk of Bias in Non-Randomized Studies of Intervention (Cochrane Bias Methods Group) (21). Publication bias was verified by funnel plot.
Statistical analysis
The statistical analysis was performed using Stata (Version 12.0). Sensitivity, specificity, and area under the curve were regarded as the gauge of diagnostic analysis. Meanwhile, outcome data were reported as HRs in the prognosis analysis. An HR that exceeds 1 indicated a worse outcome. A higher HR value indicated a poorer prognosis. We estimated study heterogeneity using I2 statistics, where greater than 50% was considered significant heterogeneity (I2 > 50%). It was preferred to use a fixed-effects model in the absence of significant heterogeneity and a random-effects model in the presence of significant heterogeneity. The P-values reported were two-sided, and statistical significance was set at P <0.05.
Results
Study characteristics for diagnostic and prognostic value analyses
In this study, the articles were selected according to the diagnostic and prognostic roles of CTCs. There were 1,102 articles obtained from four databases for diagnostic analysis. In order to obtain a comprehensive selection, the full texts of the initially included articles were read entirely. Eight hundred twenty-six studies were unsuitable for inclusion because of duplicate publication. Furthermore, 19 articles were excluded due to missing information, special CTC types, and multivariate Cox which might influence the entire result. Thirty-five articles (8,935 patients) were included after the selection procedure (Figure 1). The main features of the eligible studies are summarized in Tables 1, 2 (12, 22–55). The QUADAS-2 revised tool and the Newcastle-Ottawa scale were utilized to assess the biases and qualities in the meta-analysis procedure (Supplementary Tables 3-6).
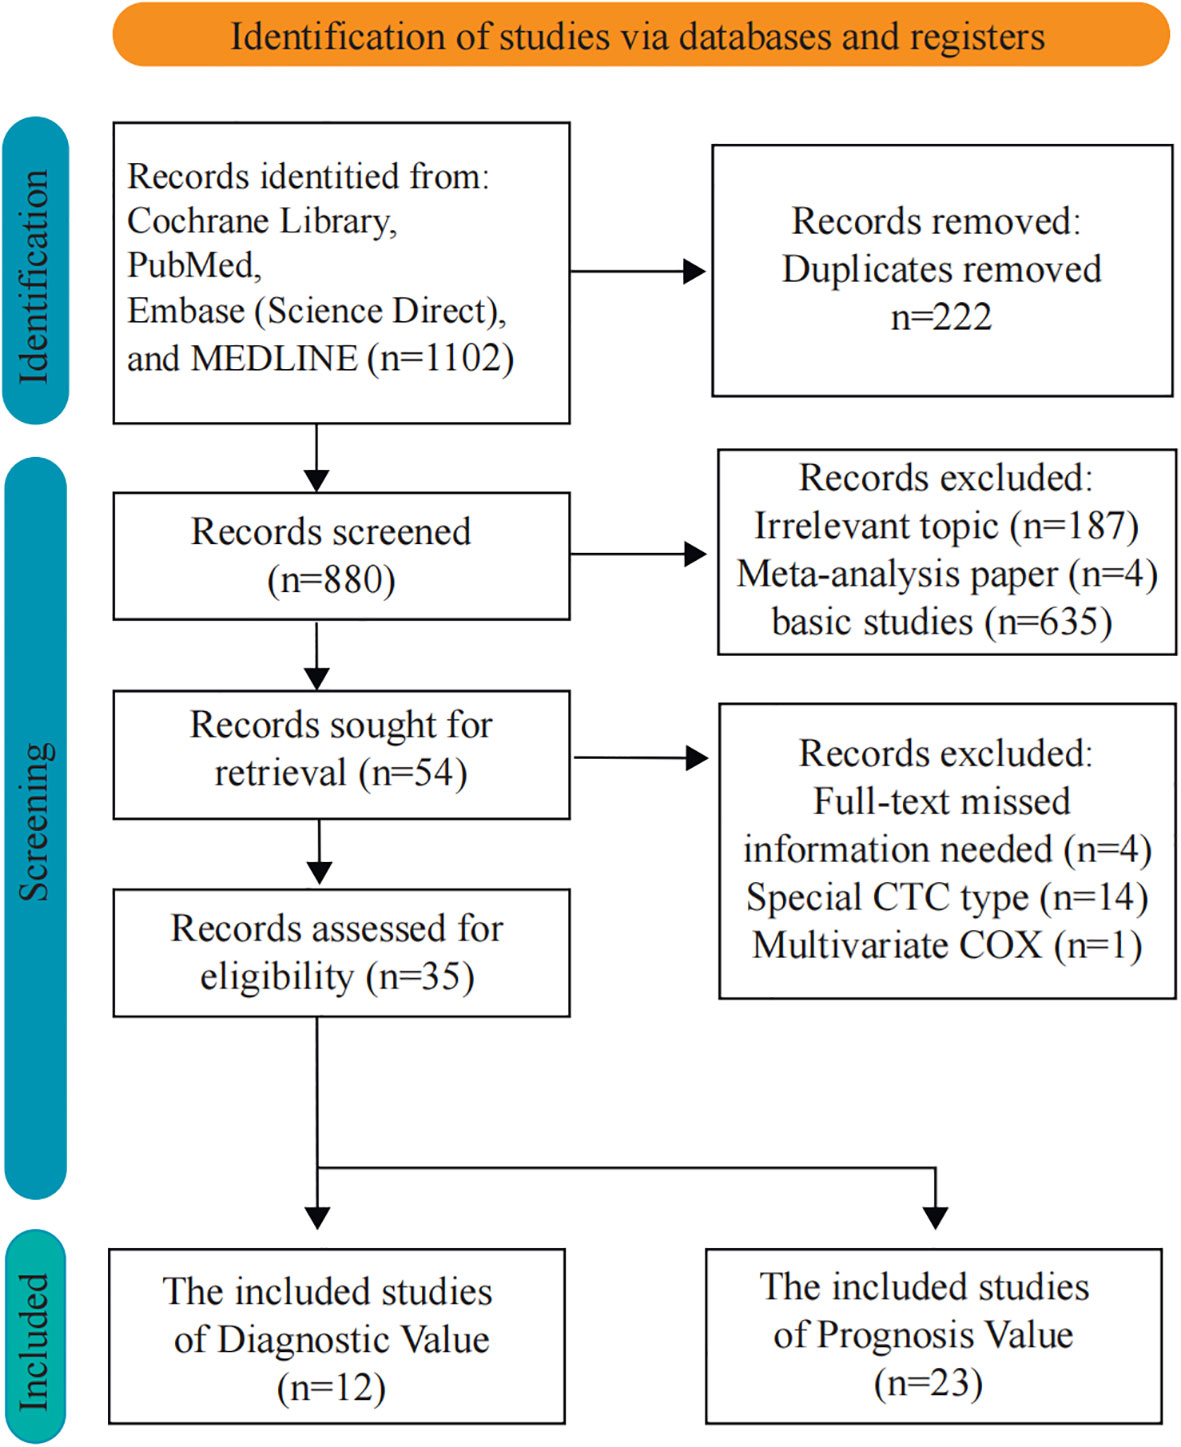
Figure 1 Flow diagram of the study selection for the present meta-analysis.
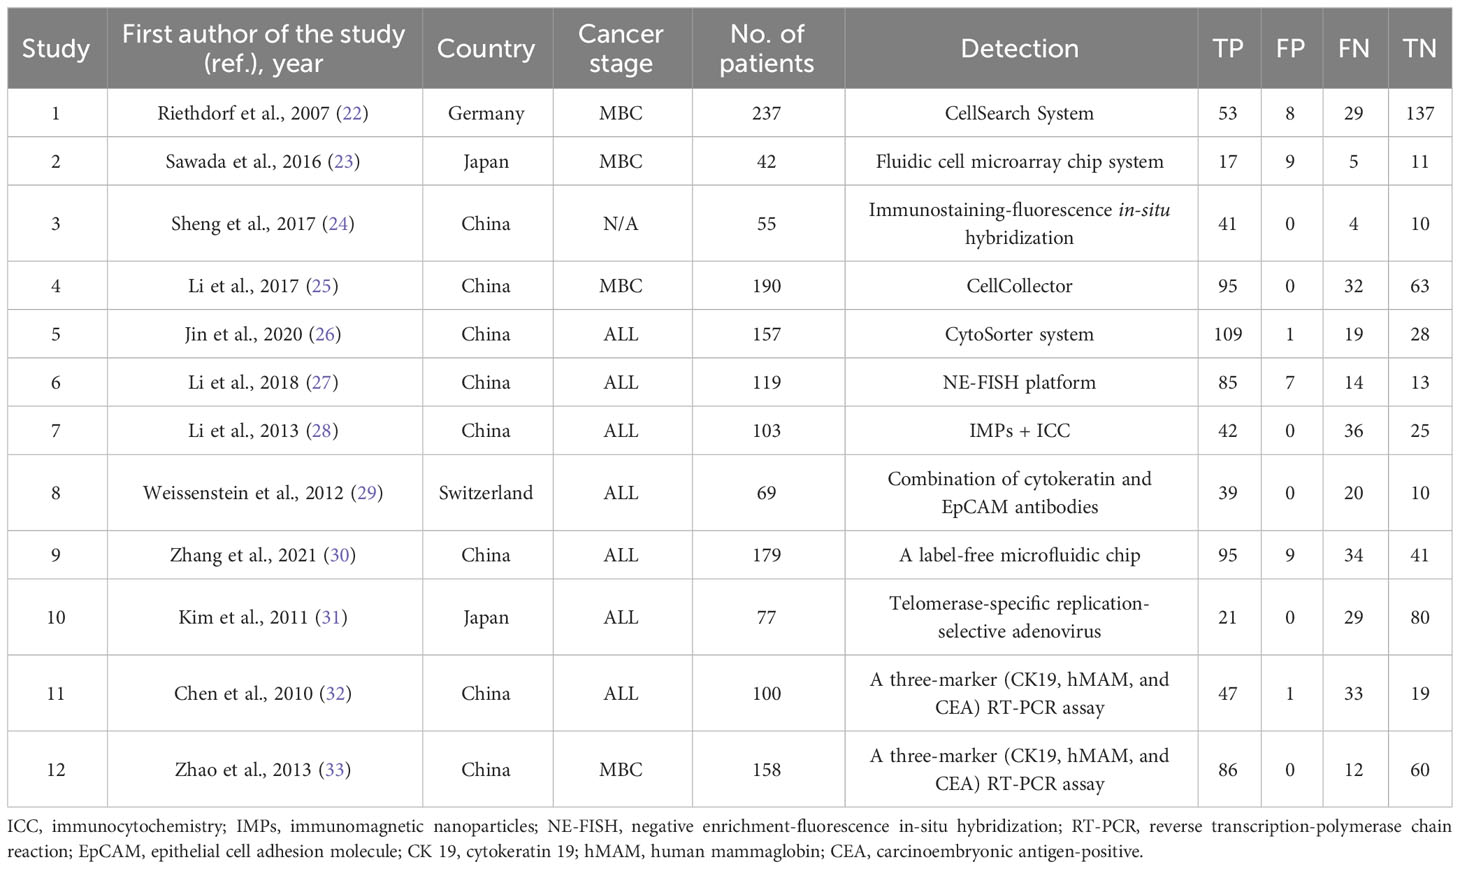
Table 1 Articles included in the diagnostic meta-analysis.
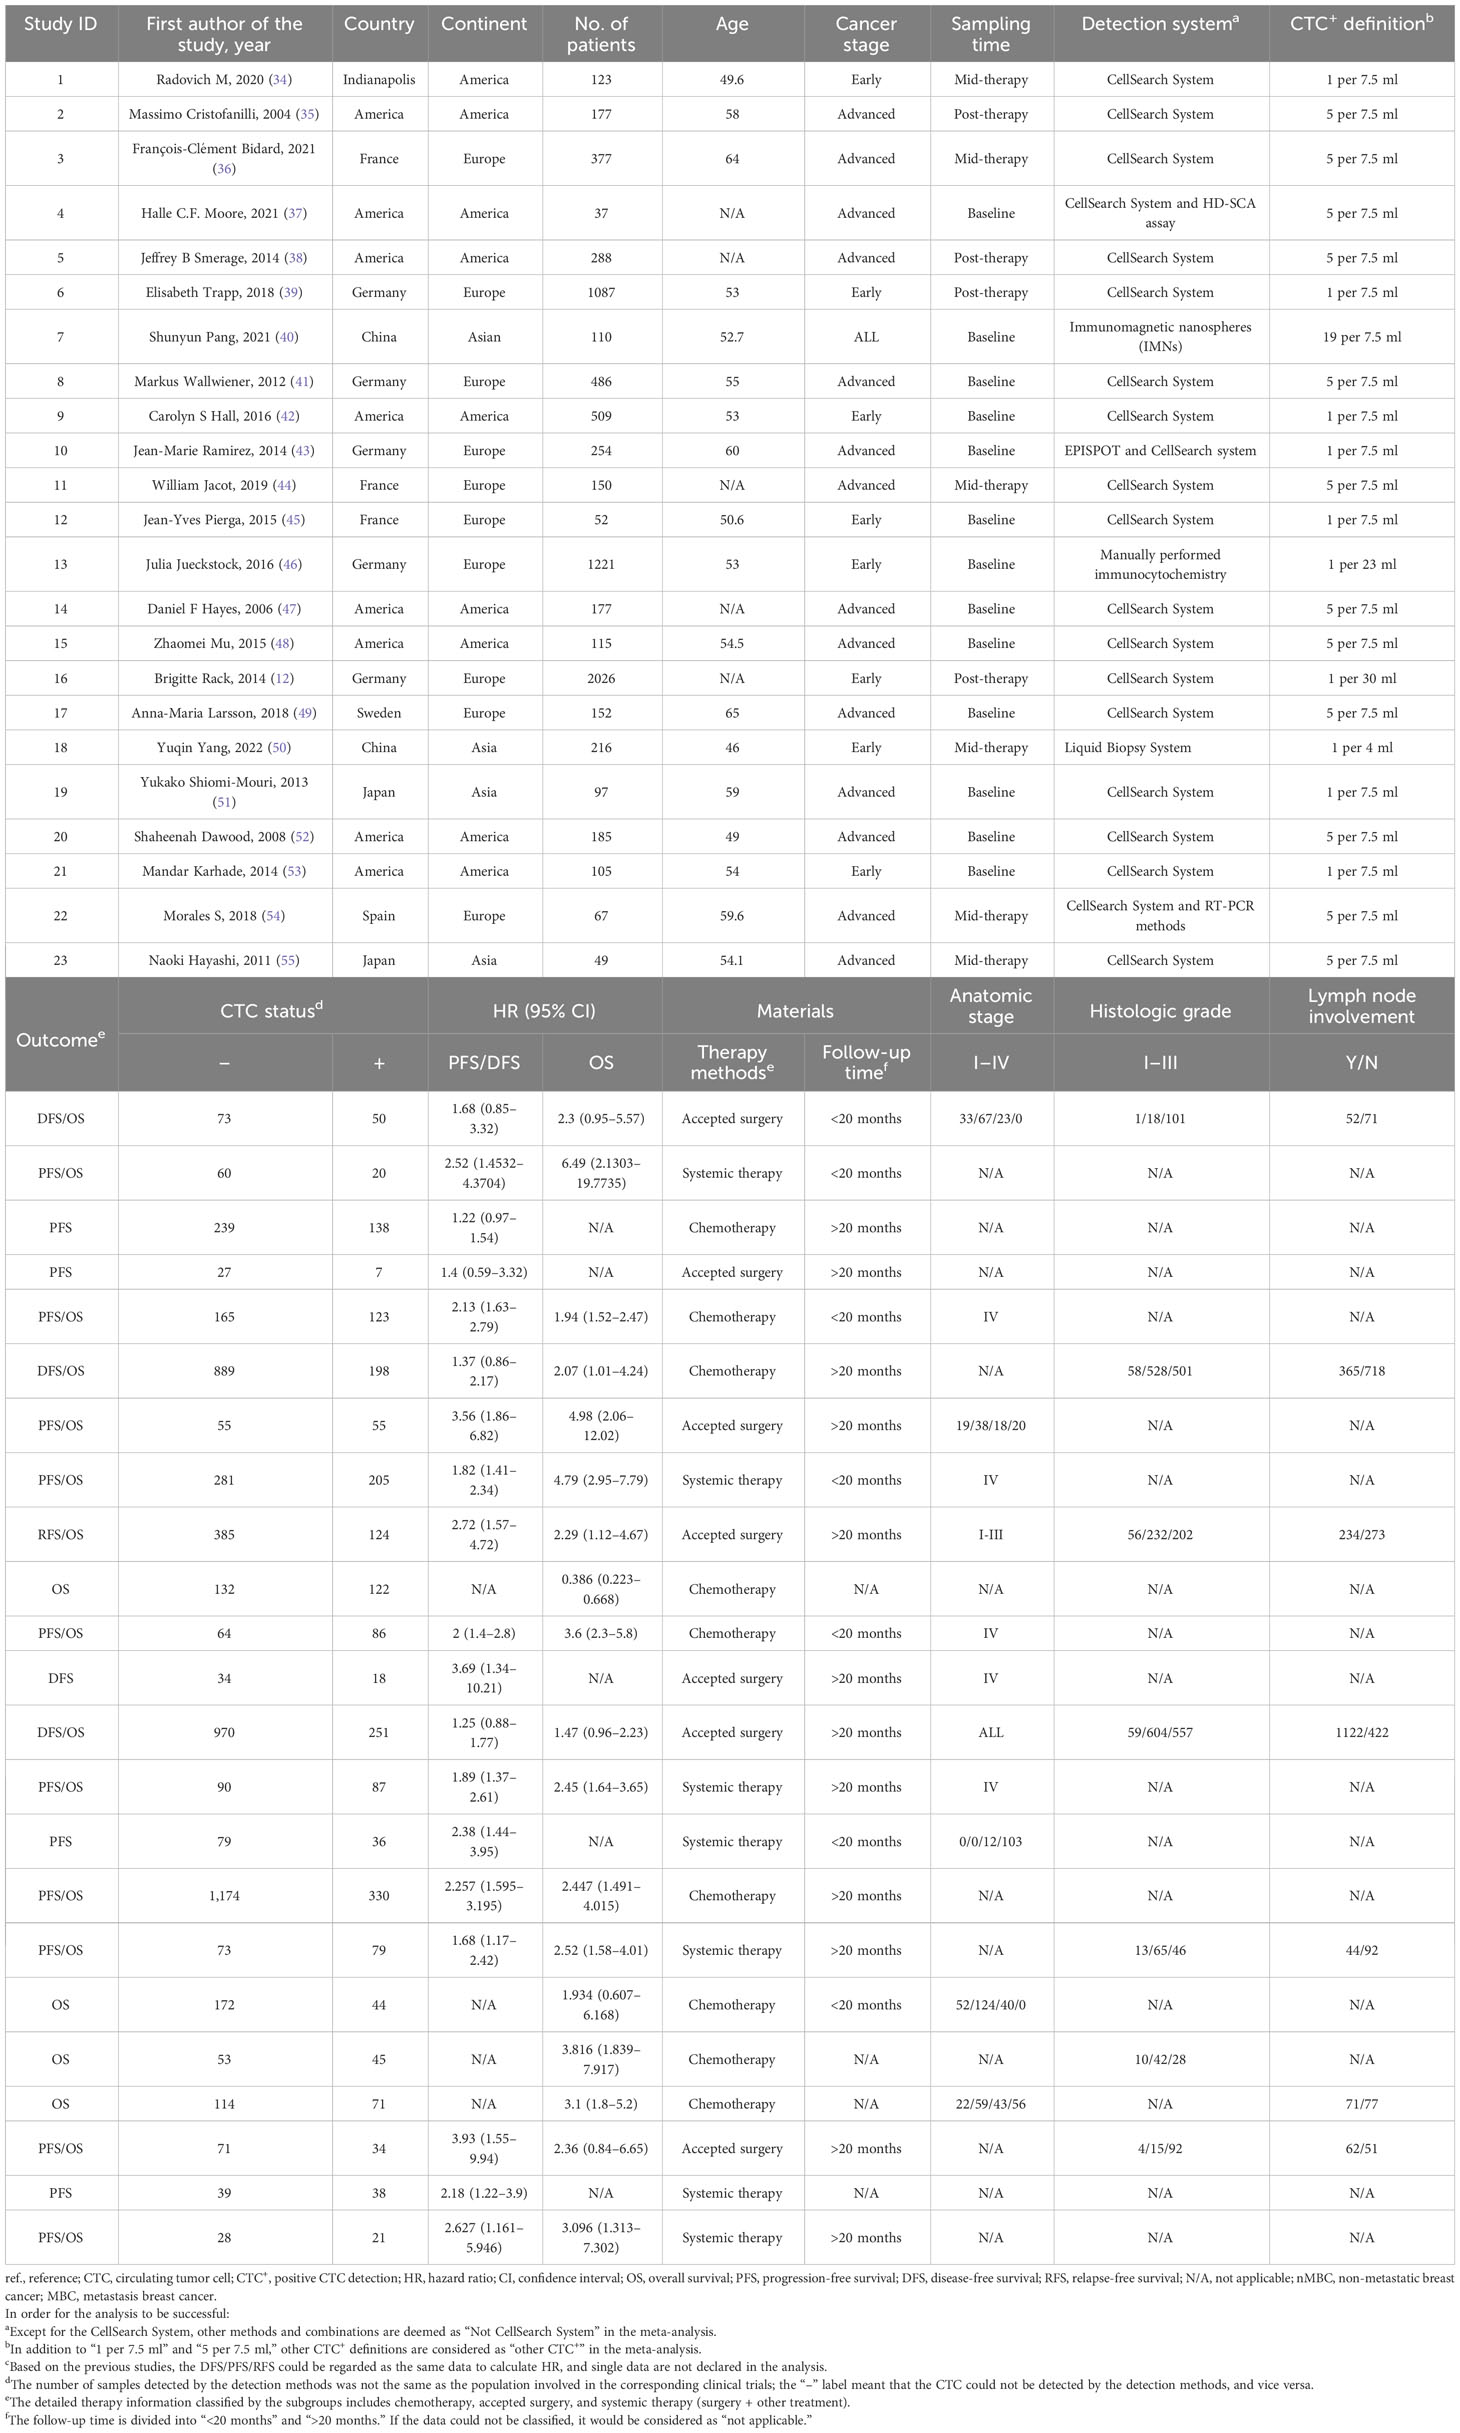
Table 2 Characteristics of the studies included in the meta-analysis.
The diagnostic performance of CTC detection
Among the 12 included studies, 7 studies investigated the diagnostic efficacy of CTC detection for all cancer stages, 4 studies mainly focused on the metastatic stage, and 1 study did not provide information on the cancer stage. The results showed a high diagnostic efficacy of CTC detection with 0.74 sensitivity (95% CI, 0.65–0.81) and 0.98 specificity (95% CI, 0.88–1.00). The diagnostic score and odds ratio were 4.85 and 127.17, respectively (Figure 2A). Positive and negative diagnostic likelihood ratios (DLRs) were 33.96 and 0.27 (Figure 2B). Remarkably, the Fogan diagram indicated that an individual who tested positive with a CTC test had a 97% chance of developing BC (Figure 2C). This indicated that the detection methods had good effectiveness for CTCs. The summary receiver operating characteristic curves (SROCs) showed an area under the curve of 0.89 (95% CI, 0.86–0.91). Combined with the diagnostic odds ratio, the result also provided evidence of the values of those CTC detection methods (Supplementary Figures S1A, B). Heterogeneity was significant in these analyses (I2 > 50%). However, the funnel plot asymmetry test with linear regression indicated a non-significant publication bias in the meta-analysis (P = 0.37) (Supplementary Figure S1C). Thus, we performed a metaregression analysis and showed that continent was the potential source of heterogeneity. Our subgroup analysis indicated that specificity would be higher in Chinese patients (Supplementary Table 7).

Figure 2 Analysis of the diagnostic values of CTC. (A) The sensitivity, specificity, diagnostic score, and odds ratio of CTCs for the diagnosis of BC; (B) the analysis of DLR positive and DLR negative; (C) the Fagan nomogram of the diagnostic values of CTCs.
Factors that influence the association between CTC and poor prognosis
In order to identify the factors that influence the CTC+ prognosis value, the variables were examined in the metaregression, including publication year, sample size, age, continent, detection method, CTC+ definition, tumor stage, therapeutic regimen, sampling time, and follow-up time (Supplementary Table 8). Our results showed that the detection method and continent were the major elements of the heterogeneity in the pooled HROS and HRPFS/DFS (P = 0.01). Then, we divided the subgroups and analyzed them according to the differences in the detection method and continent.
Previous studies demonstrated that the CellSearch System was the most used detection system for CTC detection (56). More recently, researchers have combined two systems/methods for detection, namely, immunomagnetic nanospheres (IMNs) and reverse transcription-polymerase chain reaction (RT-PCR), to improve the significance of the CTC prognostic value. Those studies were classified and analyzed as another subset in the subgroup analysis, which was named the Not CellSearch System subset (Figure 3). The calculated analysis revealed that CTC+ was associated with poor survival and could be regarded as a high-risk biomarker (HROS, 2.43; 95% CI, 1.85–3.19; HRPFS/DFS, 1.82; 95% CI, 1.66–1.99) (Figures 3A, B; Table 3). The overall heterogeneity was significant in the OS analysis (I2 = 75.5%). We suspected that heterogeneity might come from the Not CellSearch System subset (I2 = 89.2%); however, publication bias did not exist in this subset (PBegg > 0.05; PEgger = 0.652) (Supplementary Figures S2A, B; Table 4). The one-way sensitivity analysis considered that the exclusion of any article did not affect the entire outcome (Supplementary Figure S2C). The trim-and-fill analysis suggested that one study might be missed and that if it were published, the relationship would not be reversed (the adjusted HR, 0.99; 95% CI, 0.351–2.724, Supplementary Figure S2D; Table 3). Furthermore, the association between CTC+ and poor OS would be obvious if the CellSearch System was utilized as the detection system in the clinical trial (HR = 2.74; 95% CI, 2.30–3.28).
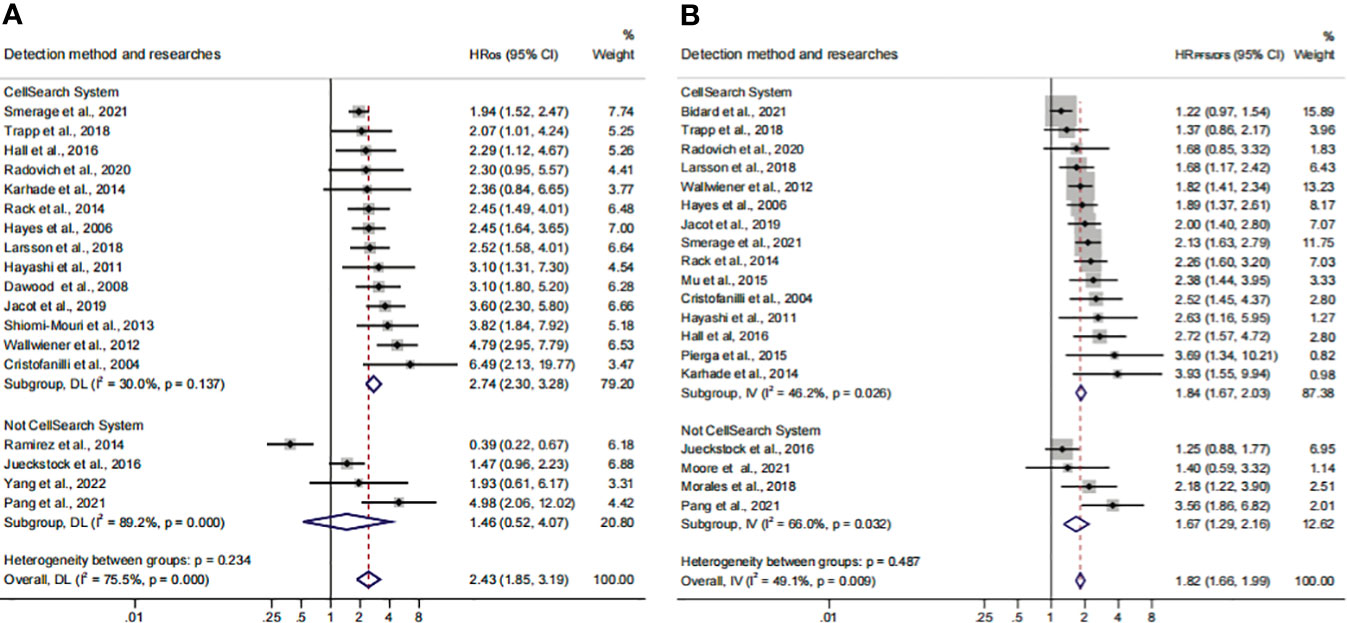
Figure 3 The subgroup analysis of detection methods in prognosis value. (A) The pooled HROS of the detection method; (B) the pooled HRPFS/DFS of the detection method.
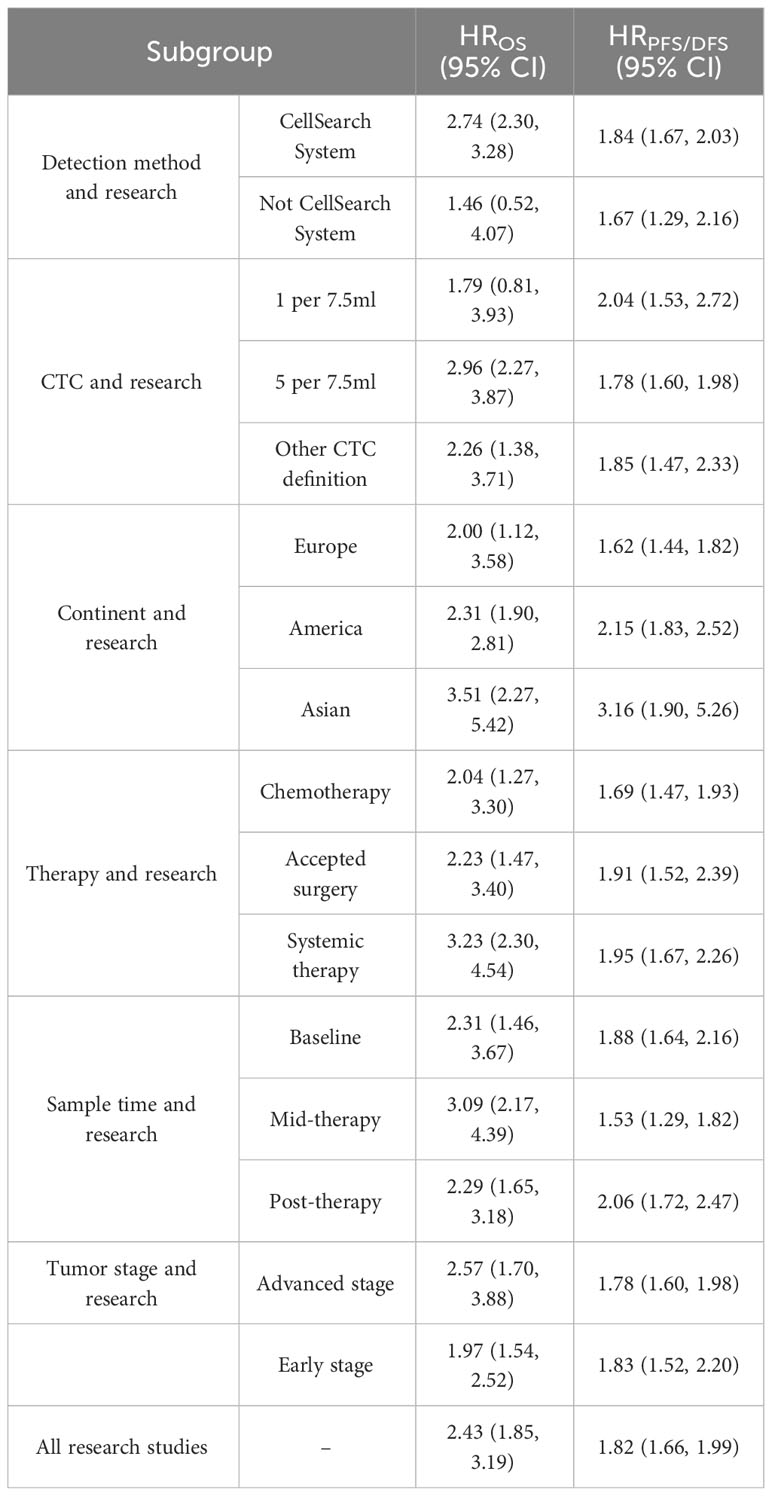
Table 3 Summary of subgroup meta-analysis for CTC prognosis value evaluation.
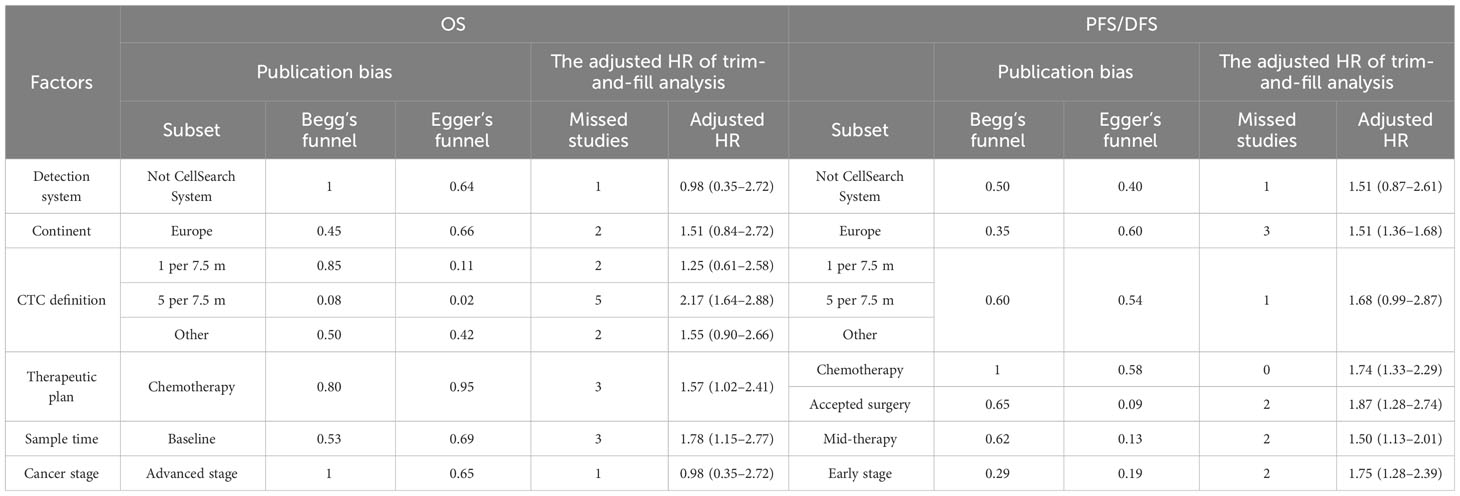
Table 4 Summary of the bias analysis and trim-and-fill analysis.
The different detection methods implied that variations existed in the threshold levels. Thus, we performed a subgroup analysis for the CTC+ definition according to the different threshold levels. The pooled results suggested that CTC+ was a stable prognosticator in poor survival assessment (HROS, 2.43; 95% CI, 1.85–3.19; HRPFS/DFS, 1.82; 95% CI, 1.66–1.99) (Figures 4A, B; Table 3). The overall heterogeneity was significant in the PFS/DFS subgroup (I2 = 75.5%). The publication bias, one-way sensitivity, and the trim-and-fill analysis demonstrated that the results were reliable and not reversed (the adjusted HR, 1.68) (Supplementary Figure S2E–H; Table 4). When the CTC+ was defined as 1 CTC per 7.5 mL, the poor PFS/DFS was significantly associated with CTC+ (HR, 2.04; 95% CI, 1.53–2.72). Meanwhile, the CTC+ was defined as 5 CTCs per 7.5 mL, and the poor OS was more significantly associated with CTC+ (HROS, 2.96; 95% CI, 2.27–3.87).
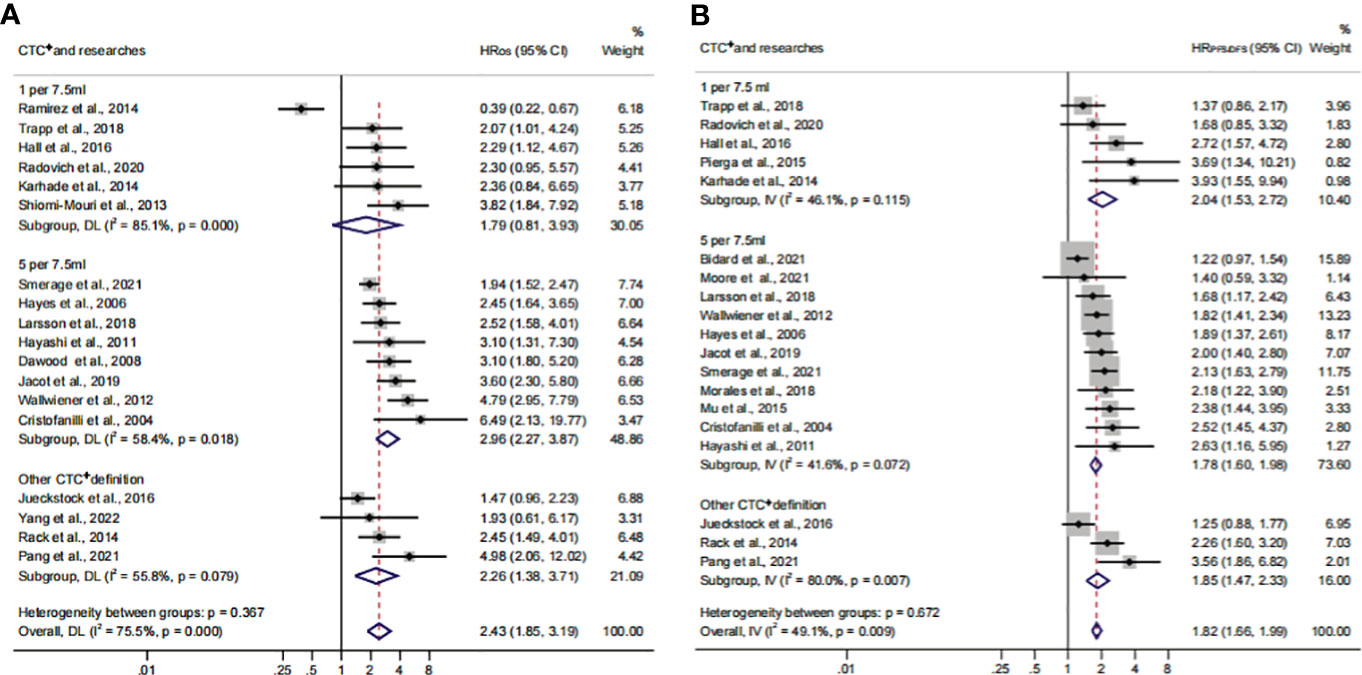
Figure 4 The subgroup analysis of CTC+ definition in prognosis value. (A) The calculated HROS of CTC+ definition; (B) the calculated HRPFS/DFS of CTC+ definition.
Association of CTC+ prognostic value in different continents
To identify another source of heterogeneity, we conducted a subgroup analysis, based on the difference of continents (Figure 5; Table 3). Our results showed that the relationship of CTC+ with poor survival was not influenced by the different regions (HROS = 2.43; 95% CI, 1.85–3.19; HRPFS/DFS = 1.82; 95% CI, 1.66–1.99) (Figures 5A, B; Table 3). The heterogeneity was moderate in the PFS/DFS subgroup (I2 = 49.1%). Furthermore, the heterogeneity might mainly come from the Europe subset (I2 = 54.8%). However, publication bias did not exist (Supplementary Figures S2I, J; Table 4). The outcome was not changed in the one-way sensitivity analysis (Supplementary Figure S2K). The adjusted HR would be 1.512 after the trim-and-fill analysis (95% CI, 1.358–1.682) (Supplementary Figure S2L; Table 4). Compared with the subsets in the subgroup analyses, CTC+ may be closely related to worse survival in Asian patients (HROS, 3.51; 95% CI, 2.27–5.42; HRPFS/DFS, 3.16; 95% CI, 1.90–5.26).
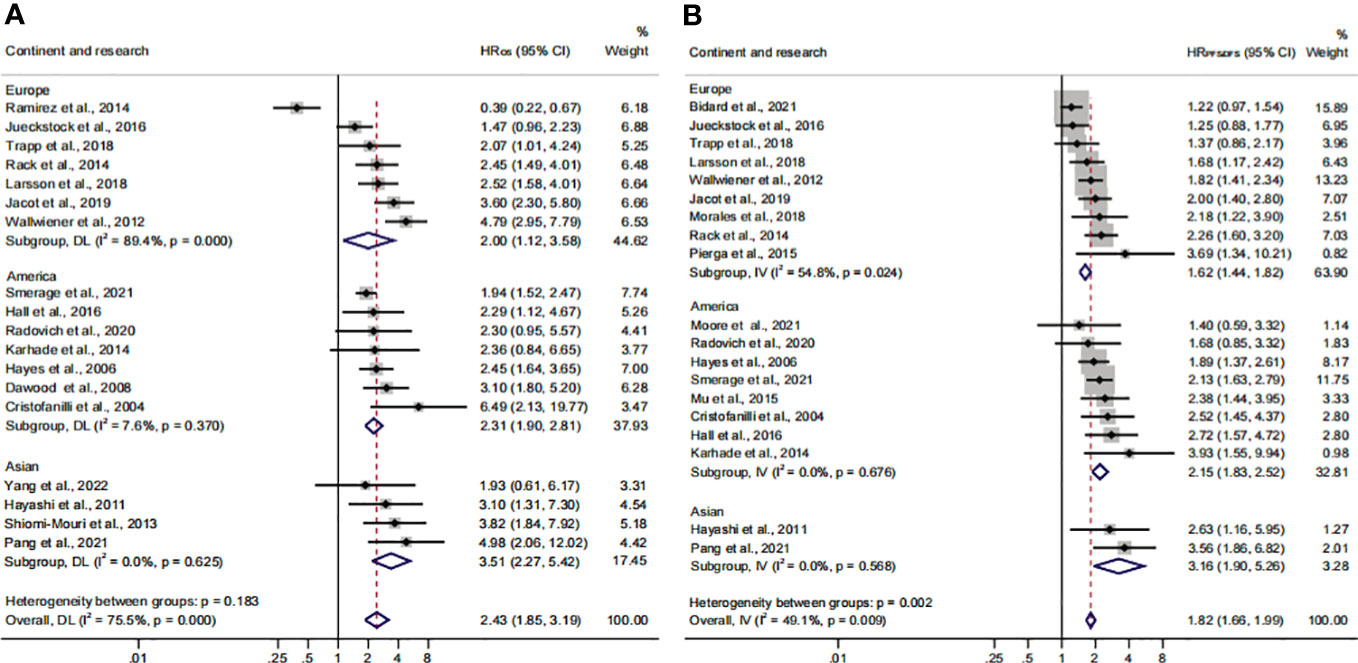
Figure 5 The continent subgroup analysis of prognosis assessment. (A) The pooled HROS of continent; (B) the pooled HRPFS/DFS of continent.
Relationship between CTC+ prognostic value and clinical therapeutic characteristics
Previous studies considered that some drugs, such as sorafenib and digitoxin, could limit or kill tumor cells detaching from the primary distant sites (57). Thus, we conducted a subgroup analysis to investigate the influence of different treatment methods and sampling times on the prognostic value of CTC+. The calculated HR suggested that the relationship was not affected by different treatment methods (HROS, 2.43; 95% CI, 1.85–3.19; HRPFS/DFS, 1.82; 95% CI, 1.66–1.99) (Figures 6A, B; Table 3). The heterogeneity was significant in the OS subgroup analysis (I2 = 75.5%). Comparing the heterogeneity of the subsets, the results indicated that the source came from the chemotherapy subset (I2 = 85.1%). However, publication bias was not discovered in this subset (Supplementary Figures S2M, N). The outcome was stable in the one-way sensitivity analysis (Supplementary Figure S2O). The adjusted HR would be 1.57 analyzed by the trim-and-fill analysis (Supplementary Figure S2P; Table 4). Furthermore, the subset results showed that the patients who received systemic therapy would have worse survival than other patients when the CTC was detected (HROS, 3.23; 95% CI, 2.30–4.45; HRPFS/DFS, 1.95; 95% CI, 1.67–2.26).
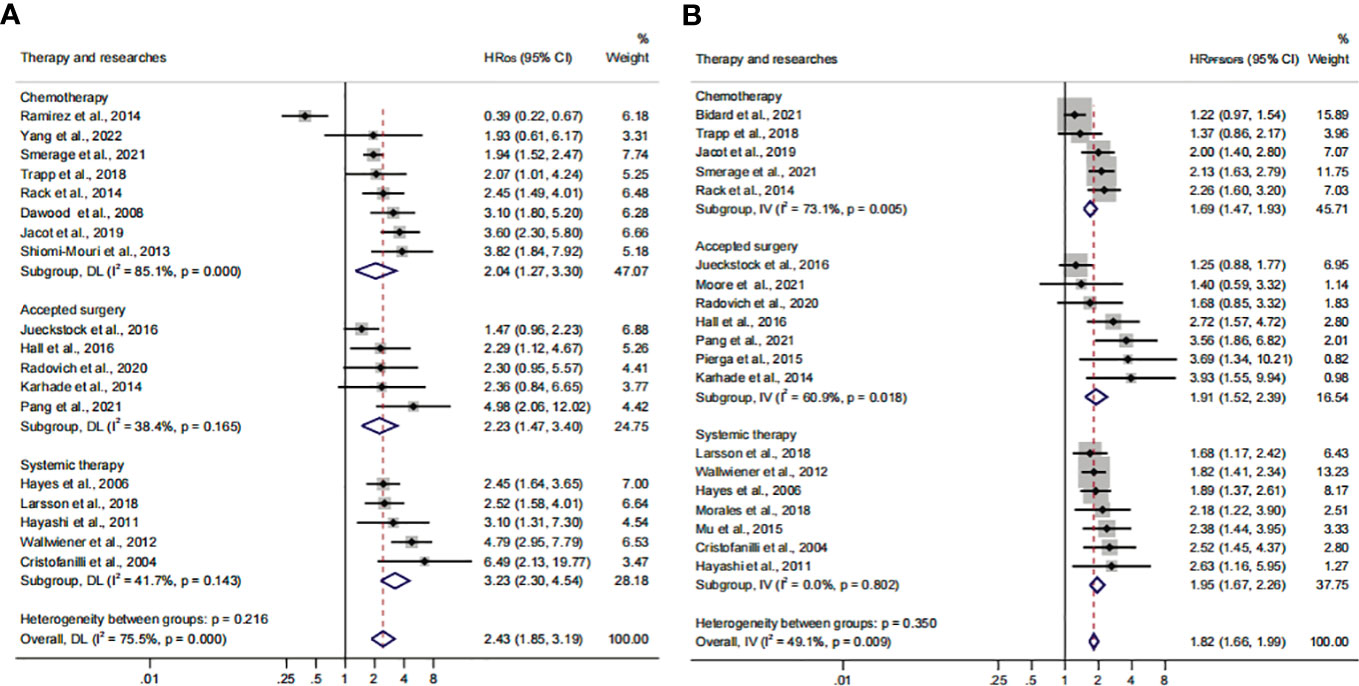
Figure 6 The therapy subgroup analysis of survival evaluation. (A) The calculated HROS of therapy; (B) the calculated HRPFS/DFS of therapy.
The subgroup analysis of sampling times indicated that the relationship between CTC+ and poor survival would be stable regardless of the treatment phases (HROS, 2.43; 95% CI, 1.85–3.19; HRPFS/DFS, 1.82; 95% CI, 1.66–1.99) (Figures 7A, B; Table 3). The heterogeneity of OS analysis was significant (I2 = 75.5%), and the heterogeneity of the subgroup might result from the baseline subset (I2 = 84.9%). The result was reliable after the publication bias, the one-way sensitivity, and the trim-and-fill analysis (Supplementary Figures S3A–D; Table 4). Consistent with a previous study, our result showed that CTC detection at mid-therapy or post-therapy could be used for monitoring therapeutic effects and had prognostic relevance (58). For instance, the subset outcomes exhibited that patients with CTC+ would have worse OS and PFS/DFS in both mid-therapy and post-therapy (HROS, 3.09; 95% CI, 2.17–4.39; HRPFS/DFS, 2.06, 95% CI, 1.72–2.47).
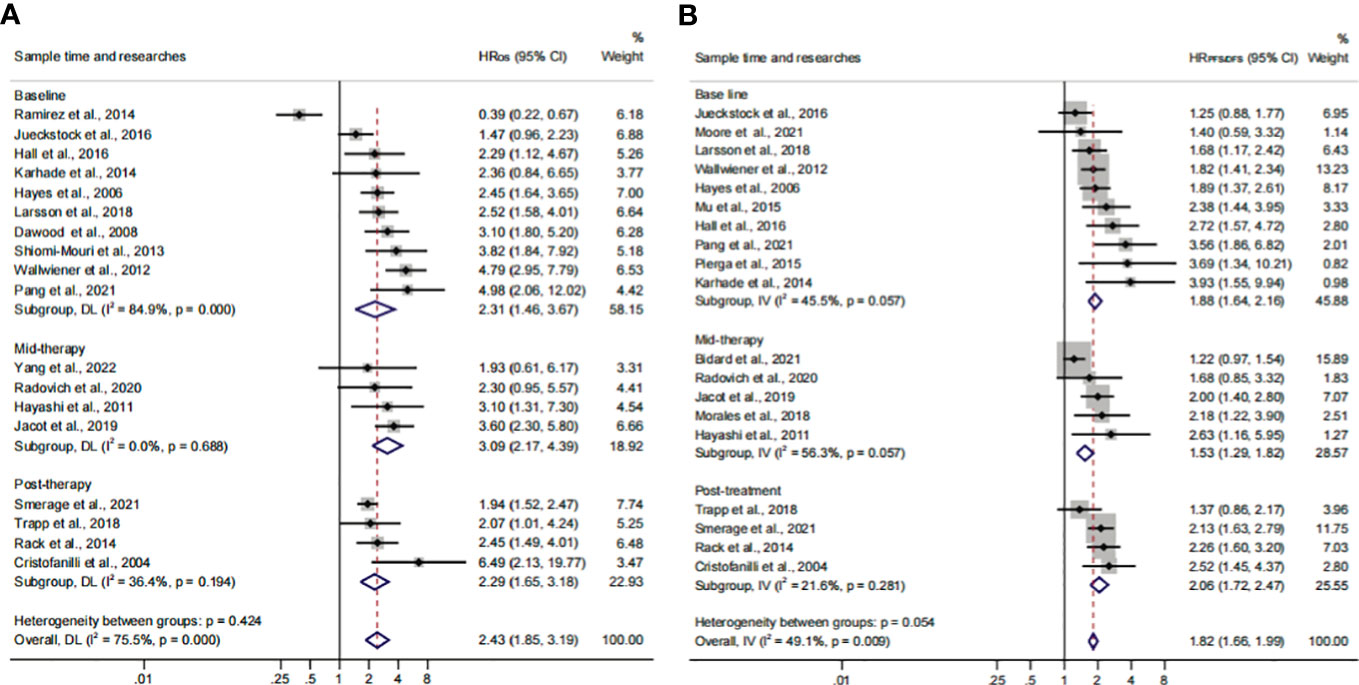
Figure 7 The sample time and therapy subgroup analysis of survival evaluation. (A) The pooled HROS of sample time; (B) the pooled HRPFS/DFS of sample time.
The analysis of CTC prognosis value for all patients and cancer stages
In order to investigate the prognostic value of CTC+ in different stages of BC, we conducted a subgroup analysis. We divided the data into subgroups according to cancer stages. The calculated analysis showed that the prognostic value of CTCs would not be affected by the cancer stages (HROS, 2.35; 95% CI, 1.78–3.10; HRPFS/DFS, 1.79; 95% CI, 1.63–1.97) (Figures 8A, B; Table 3). The OS subgroup analysis showed a significant heterogeneity (I2 = 75.9%), and it might come from the advanced stage subset (I2 = 85.5%). However, the result was stable after the publication bias, the one-way sensitivity, and the trim-and-fill analysis (Supplementary Figures S4E–H; Table 4). Furthermore, the relationship between CTC and poor OS was more obvious in the advanced BC stage (HROS, 2.57; 95% CI, 1.70–3.88). However, as for the poor PFS/DFS forecast, early BC stage patients may benefit more from the relationship (HRPFS/DFS, 1.83; 95% CI, 1.52–2.20).
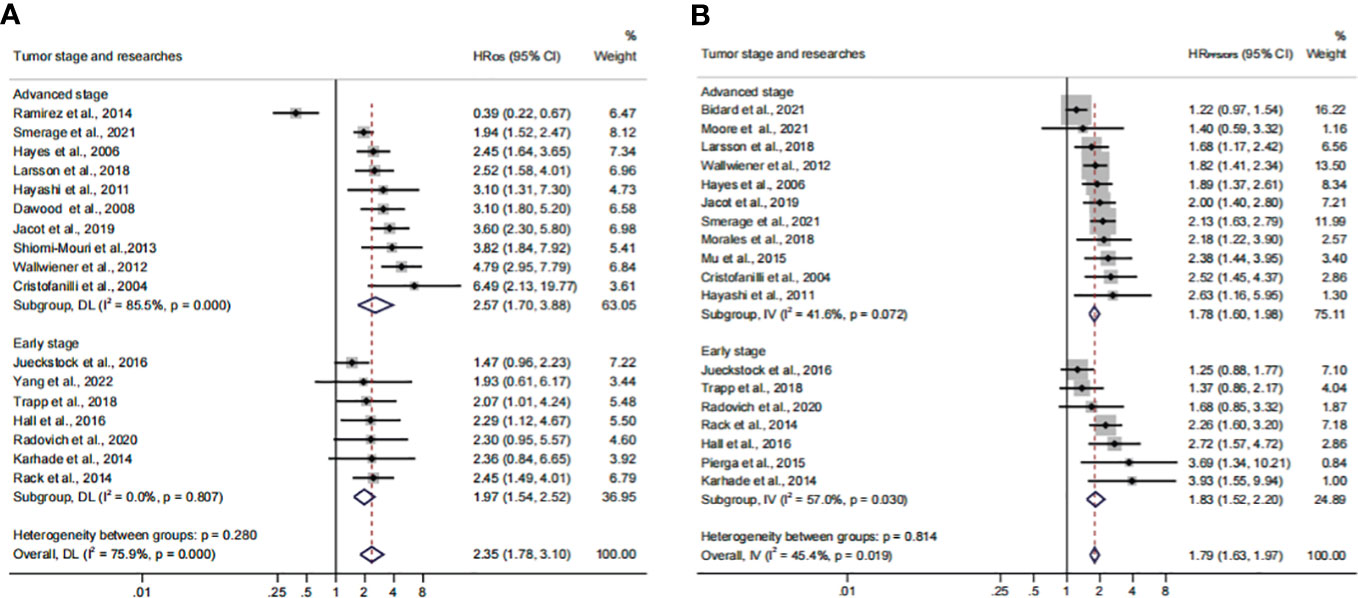
Figure 8 Analysis of prognosis values in different stages. (A) The calculated HROS of the tumor stage; (B) the calculated HRPFS/DFS of the tumor stage.
Herein, 18 available trials and 6,794 individuals could be unitized in the HROS extraction. HRPFS/DFS was available in 19 studies, which consisted of 6,696 patients. The analyzed HR indicated that CTC+ could represent poor survival in all BC patients (HROS, 2.43; 95% CI, 1.85–3.19; HRPFS/DFS, 1.82; 95% CI, 1.66–1.99) (Figures 9A, B; Table 3). The heterogeneity was significant in all BC analyses; however, the metaregression and subgroup analyses showed that the result was stable and reliable. Despite the overall heterogeneity being moderate in some subgroups (I2 < 50%) (Figures 3B, 4B, 5B, 6B, 7B, 8B), the heterogeneity analyses of the subsets in the subgroup analysis could support the stability and reliability of the analyses (I2 > 50%) (Supplementary Figures S3E–P, S4A–D, I–P, S5; Table 4).
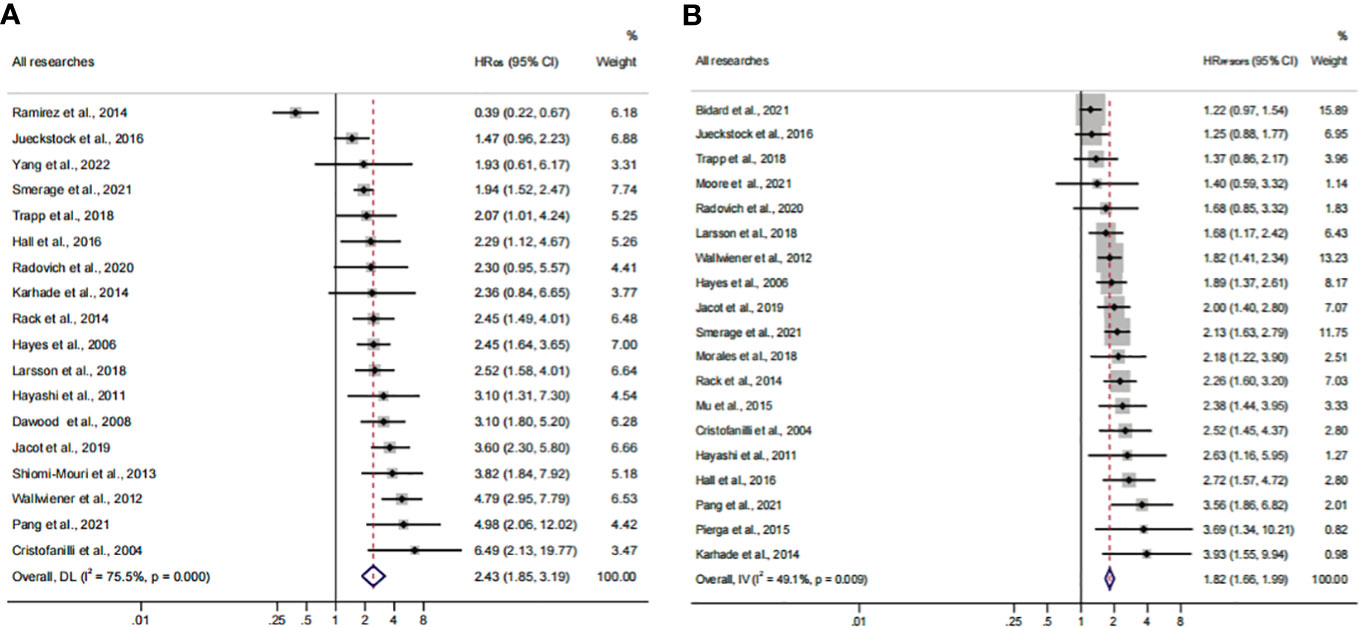
Figure 9 Analysis of prognosis values for all patients. (A) The pooled HROS of all research studies; (B) the pooled HRPFS/DFS of all research studies.
Discussion
In a rapidly evolving cancer prediction field, CTC detection technologies have attracted the attention of researchers. In this study, we investigated the diagnostic effectiveness of the widely used CTC detection approaches including the CellSearch System, ICC, and RT-PCR. Our results suggested that CTC detection was effective and had high diagnostic value for BC patients. The CellSearch System might have a higher diagnostic value compared with other detection methods. Moreover, the different threshold levels do not affect the relationship between CTC+ and poor prognosis. In the prognosis subanalysis, patients detected by the CellSearch System with CTC+ showed a worse prognosis (HROS, 2.74; 95% CI, 2.30–3.28; HRPFS/DFS, 1.84, 95% CI, 1.67–2.03). The subgroup analysis for patients from continents indicated that CTC+ was associated with a worse OS and PFS/DFS in the Asian population which was consistent with a previous study and could be regarded as a more obvious biomarker for patients from Asia (16, 59, 60). It may be caused by the differences between ethnic, but the specific reason is not yet clear and needs further research.
Most studies revealed that the presence of CTCs implied a worse prognosis at baseline. However, the relationships between CTCs and the therapeutic regimen were unclear. Our results demonstrated that CTC+ at mid-/post-therapy could not only reflect the therapeutic effect but also evaluate the prognostic relevance. The prognostic ability was not influenced by the time points of sampling. Moreover, our research also showed that the relationship between CTC+ and poor survival was changing constantly. Thus, we suggest that patients should repeat the CTC detection after the therapy to obtain a more accurate survival assessment. Comparing the three time points, the pooled HRs indicated that patients should conduct CTC detection again after treatment to obtain a more accurate evaluation of survival. Altogether, the association between CTCs and poor survival should be considered stable, regardless of the treatment methods the patient is receiving. However, the relationship between CTC+ and different therapeutic regimens was not investigated in the subgroup analysis due to insufficient information which deserves further study in the future. Previous studies have demonstrated that the prognosis of early and advanced BC was obviously different (61, 62). In line with previous studies, our findings showed that CTC+ could serve as an independent predictor for cancer progression (35, 63–65). To sum up, our study showed that CTCs could be utilized as a high-value marker for all BC patients. The value was stable after the heterogeneity analysis. Moreover, CTC detection should be conducted in different stages which could predict the prognosis and treatment response for BC patients.
With the development of detection techniques, novel methods such as microgels and antifouling nanofilm could facilitate in the separation and purification of CTCs, which could promote the CTCs to enter the clinic (66–68). Although the utility of CTC detection was not included in the clinical practice guidelines of BC, many studies have shown its great potential in the management of BC patients (69, 70). For instance, the results obtained from Chakraborty’s group encouraged the incorporation of CTC quantification as a prognostic marker and for minimally invasive tumor burden assessment in multiple myeloma (71). In the future, the level of CTCs might be an important component of stage definition for BC patients. Moreover, investigation of the genomic/transcriptional/proteomic profiles of CTCs could provide comprehensive information in choosing therapeutic strategies. For example, some CTC measurement technologies achieved the genotyping of CTCs, including crucial gene mutations and clone heterogeneity, such as TP53, PIK3CA, ERBB2, KLK10, NUMBL, GFB1, and BSG (72, 73). Those achievements would help clinicians select personalized treatment and more effective therapeutic regimens during tumor progression. The present studies suggested the clinical value of CTCs in the diagnosis, prognosis, and treatment of BC. However, the utilization of CTCs urgently needs standard detection methods and clinical guidelines, especially for the differences in populations, therapeutic schemes, BC stages, thresholds, and the appropriate time points for blood sampling (74).
CTCs could not be the unique prognostic factor due to the complex mechanism of BC development, invasion, and metastasis. The progression of BC could be regulated by the tumor microenvironment (TME) and deeply influenced by cancer-associated fibroblasts, macrophages, neutrophils, T regulatory cells, tumor-infiltrating lymphocytes, and the related secreted molecules (75). For example, the number of CD68+ macrophages, the count of tumor-infiltrating lymphocytes, and the expression of TGF-β in different genetic levels could serve as prognostic and predictive markers (76–78). Those specific cells and related secreted molecules were equally important for the evaluation of BC prognosis. The design and construct of drugs aimed at those molecules would be a promising way for BC patients. For instance, Yi and his team produced bispecific antibodies targeting TGF-β and human PD-L1 (termed YM101 and BiTP) showing antitumor activity in the TNBC. This means that CTCs, as a kind of TME-related molecule, would also have the potential possibility to be utilized by the drug design of BC (79, 80).
Some limitations exist and should be considered deliberately. First, compared with other cancers, BC was relatively general. Meanwhile, some confounding factors were not clear and discussed which are equally important including detection markers, anatomic stages, histologic grades, and the metastatic conditions of the lymph nodes/organs. These factors could not be regarded as subgroups. Second, only a fraction of the literature directly offered univariate HR, LCI, and UCI values. In order to ensure the accuracy of data, studies were not included in this analysis that do not provide original data. Some articles only exhibited survival curves. These articles were not included because extracting data from survival curves also led to measurement bias. Third, according to the funnel plot, the meta-analysis adopted a systematic retrieval strategy and did not identify significant publication bias. However, some gray publications were not taken into analysis factually including meetings and abstracts written in other languages and inaccessible articles. Fourth, a series of data were still not detailed enough in the analysis. For example, the first follow-up time and the definition of BC stages in some articles were not clear. This could also influence the analysis outcomes. Finally, in our analysis, only one male patient was involved. This meant that the final outcome may be not valuable for men.
Conclusions
Our results provided the latest evidence to support that CTCs have a high and stable value of the diagnosis and prognosis for BC, especially for patients from Asia. We suggest that patients should have CTC detection sequentially during treatment, especially when BC progression has been identified. In the future, novel techniques should be developed to improve the efficacy of CTC detection.
Author contributions
HZ: Investigation, Methodology, Writing – original draft. LW: Investigation, Methodology, Writing – original draft. CF: Conceptualization, Writing – review & editing. CL: Conceptualization, Funding acquisition, Writing – review & editing. LZ: Conceptualization, Funding acquisition, Investigation, Writing – review & editing.
Funding
The author(s) declare financial support was received for the research, authorship, and/or publication of this article. This work was supported by the National Natural Science Foundation of China (No. 82201541), China Postdoctoral Science Foundation (No. 2022M710997), and Provincial Medical Talents Project funded by Hebei Province (No. 361007).
Conflict of interest
The authors declare that the research was conducted in the absence of any commercial or financial relationships that could be construed as a potential conflict of interest.
Publisher’s note
All claims expressed in this article are solely those of the authors and do not necessarily represent those of their affiliated organizations, or those of the publisher, the editors and the reviewers. Any product that may be evaluated in this article, or claim that may be made by its manufacturer, is not guaranteed or endorsed by the publisher.
Supplementary material
The Supplementary Material for this article can be found online at: https://www.frontiersin.org/articles/10.3389/fonc.2023.1272788/full#supplementary-material
Supplementary Figure 1 | The analyses of SROC with prediction & confidence contours, diagnostic odds ratio and Deeks’ funnel plot asymmetry Test in the diagnosis effect of CTC.
Supplementary Figure 2 | The further identification and analysis of the heterogeneity. (A) the Begg’s funnel plot of the ‘Not CellSearch system’ group analysis in HROS; (B) the Egger’s publication bias plot of the ‘Not CellSearch system’ group analysis in HROS; (C) the one-way sensitivity analysis of the ‘Not CellSearch system’ group analysis in HROS; (D) the trim-and-fill analysis of the ‘Not CellSearch system’ group analysis in HROS; (E) the Begg’s funnel plot of ‘other definition of the CTC+’ group analysis in HRPFS/DFS; (F) the Egger’s publication bias plot of the ‘other definition of CTC+’ group analysis in HRPFS/DFS; (G)the one-way sensitivity analysis of ‘other definition of the CTC+’ group analysis in HRPFS/DFS; (H) the trim-and-fill analysis of the ‘other definition of CTC+’ group analysis in HRPFS/DFS; (I) the Begg’s funnel plot of the ‘Europe’ group analysis in HRPFS/DFS; (G) the Egger’s publication bias plot of the ‘Europe’ group analysis in HRPFS/DFS;(K) the one-way sensitivity analysis of the ‘Europe’ group analysis in HRPFS/DFS; (L) the trim-and-fill analysis of the ‘Europe’ group analysis in HRPFS/DFS; (M) the Begg’s funnel plot of the ‘chemotherapy’ group analysis in HROS; (N) the Egger’s publication bias plot of the ‘chemotherapy’ group analysis in HROS; (O) the one-way sensitivity analysis of the ‘chemotherapy’ group analysis in HROS; (P) the trim-and-fill analysis of the ‘chemotherapy’ group analysis in HROS.
Supplementary Figure 3 | The further identification and analysis of the heterogeneity. (A) the Begg’s funnel plot of the ‘baseline’ group analysis in HROS; (B) the Egger’s publication bias plot of the ‘baseline’ group analysis in HROS; (C) the one-way sensitivity analysis of the ‘baseline’ group analysis in HROS; (D) the trim-and-fill analysis of the ‘baseline’ group analysis in HROS; (E) the Begg’s funnel plot of the ‘Europe’ group analysis in HROS; (F) the Egger’s publication bias plot of the ‘Europe’ group analysis in HROS; (G) the one-way sensitivity analysis of the ‘Europe’ group analysis in HROS; (H) the trim-and-fill analysis of the ‘Europe’ group analysis in HROS; (I) the Begg’s funnel plot of the ‘1 per 7.5 ml’ group analysis in HROS; (G) the Egger’s publication bias plot of the ‘1 per 7.5 ml’ group analysis in HROS;(K) the one-way sensitivity analysis of the ‘1 per 7.5 ml’ group analysis in HROS; (L) the trim-and-fill analysis of the ‘1 per 7.5 ml’ group analysis in HROS; (M) the Begg’s funnel plot of the ‘5 per 7.5 ml’ group analysis in HROS; (N) the Egger’s publication bias plot of the ‘5 per 7.5 ml’ group analysis in HROS; (O) the one-way sensitivity analysis of the ‘5 per 7.5 ml’ group analysis in HROS; (P) the trim-and-fill analysis of the ‘5 per 7.5 ml’ group analysis in HROS.
Supplementary Figure 4 | The further identification and analysis of the heterogeneity. (A) the Begg’s funnel plot of the ‘other definition of CTC+’ group analysis in HROS; (B) the Egger’s publication bias plot of the ‘other definition of CTC+’ group analysis in HROS; (C) the one-way sensitivity analysis of the ‘other definition of CTC+’ group analysis in HROS; (D) the trim-and-fill analysis of the ‘other definition of CTC+’ group analysis in HROS; (E) the Begg’s funnel plot of the ‘advanced stage’ group analysis in HROS; (F) the Egger’s publication bias plot of the ‘advanced stage’ group analysis in HROS; (G) the one-way sensitivity analysis of the ‘advanced stage’ group analysis in HROS; (H) the trim-and-fill analysis of the ‘advanced stage’ group analysis in HROS; (I) the Begg’s funnel plot of the ‘Not CellSearch system’ group analysis in HRPFS/DFS; (G) the Egger’s publication bias plot of the ‘Not CellSearch system’ group analysis in HRPFS/DFS; (K) the one-way sensitivity analysis of the ‘Not CellSearch system’ group analysis in HRPFS/DFS; (L) the trim-and-fill analysis of the ‘Not CellSearch system’ group analysis in HRPFS/DFS; (M) the Begg’s funnel plot of the ‘mid-therapy’ group analysis in HRPFS/DFS; (N) the Egger’s publication bias plot of the ‘mid-therapy’ group analysis in HRPFS/DFS; (O) the one-way sensitivity analysis of the ‘mid-therapy’ group analysis in HRPFS/DFS; (P) the trim-and-fill analysis of the ‘mid-therapy’ group analysis in HRPFS/DFS.
Supplementary Figure 5 | The further identification and analysis of the heterogeneity. (A) the Begg’s funnel plot of the ‘chemotherapy’ group analysis in HRPFS/DFS; (B) the Egger’s publication bias plot of the ‘chemotherapy’ group analysis in HRPFS/DFS; (C) the one-way sensitivity analysis of the ‘chemotherapy’ group analysis in HRPFS/DFS; (D) the trim-and-fill analysis of the ‘chemotherapy’ group analysis in HRPFS/DFS; (E) the Begg’s funnel plot of the ‘accepted surgery’ group analysis in HRPFS/DFS; (F) the Egger’s publication bias plot of the ‘accepted surgery’ group analysis in HRPFS/DFS; (G) the one-way sensitivity analysis of the ‘accepted surgery’ group analysis in HRPFS/DFS; (H) the trim-and-fill analysis of the ‘accepted surgery’ group analysis in HRPFS/DFS; (I) the Begg’s funnel plot of the ‘early stage’ group analysis in HRPFS/DFS; (G) the Egger’s publication bias plot of the ‘early stage’ group analysis in HRPFS/DFS; (K) the one-way sensitivity analysis of the ‘early stage’ group analysis in HRPFS/DFS; (L) the trim-and-fill analysis of the ‘early stage’ group analysis in HRPFS/DFS.
References
1. Abbaspour M, Akbari V. Cancer vaccines as a targeted immunotherapy approach for breast cancer: an update of clinical evidence. Expert Rev Vaccines (2022) 21(3):337–53. doi: 10.1080/14760584.2022.2021884
2. Kong X, Li J, Li Y, Duan W, Qi Q, Wang T, et al. A novel long non-coding RNA AC073352.1 promotes metastasis and angiogenesis via interacting with YBX1 in breast cancer. Cell Death Dis (2021) 12(7):670. doi: 10.1038/s41419-021-03943-x
3. Shao N, Wan F, Abudurexiti M, Wang J, Zhu Y, Ye D. Causes of death and conditional survival of renal cell carcinoma. Front Oncol (2019) 9:591. doi: 10.3389/fonc.2019.00591
4. Rizvi S, Khan SA, Hallemeier CL, Kelley RK, Gores GJ. Cholangiocarcinoma - evolving concepts and therapeutic strategies. Nat Rev Clin Oncol (2018) 15(2):95–111. doi: 10.1038/nrclinonc.2017.157
5. Chen SY, Huang HY, Lin HP, Fang CY. Piperlongumine induces autophagy in biliary cancer cells via reactive oxygen species-activated Erk signaling pathway. Int J Mol Med (2019) 44(5):1687–96. doi: 10.3892/ijmm.2019.4324
6. Martins I, Ribeiro IP, Jorge J, Joana J, Gonçalves AC, Sarmento-Ribeiro AB, et al. Liquid biopsies: applications for cancer diagnosis and monitoring. Genes (Basel) (2021) 12(3):349. doi: 10.3390/genes12030349
7. Zhang W, Duan X, Zhang Z, Yang Z, Zhao C, Liang C, et al. Combination of CT and telomerase+ circulating tumor cells improves diagnosis of small pulmonary nodules. JCI Insight (2021) 6(11):e148182. doi: 10.1172/jci.insight.148182
8. Deng Z, Wu S, Wang Y, Shi D. Circulating tumor cell isolation for cancer diagnosis and prognosis. EBioMedicine (2022) 83:104237. doi: 10.1016/j.ebiom.2022.104237
9. De Giorgi U, Mego M, Scarpi E, Giordano A, Giuliano M, Valero V, et al. Association between circulating tumor cells and peripheral blood monocytes in metastatic breast cancer. Ther Adv Med Oncol (2019) 11:1–12. doi: 10.1177/1758835919866065
10. Dobiasova B, Mego M. Biomarkers for inflammatory breast cancer: diagnostic and therapeutic utility. Breast Cancer (Dove Med Press) (2020) 12:153–63. doi: 10.2147/BCTT.S231502
11. Jin F, Zhu L, Shao J, Yakoub M, Schmitt L, Reißfelder C, et al. Circulating tumour cells in patients with lung cancer universally indicate poor prognosis. Eur Respir Rev (2022) 31(166):220151. doi: 10.1183/16000617.0151-2022
12. Rack B, Schindlbeck C, Jückstock J, Andergassen U, Hepp P, Zwingers T, et al. Circulating tumor cells predict survival in early average-to-high risk breast cancer patients. J Natl Cancer Inst (2014) 106(5):dju066. doi: 10.1093/jnci/dju066
13. Meng Y, Sun J, Zheng Y, Zhang G, Yu T, Piao H. Platelets: the emerging clinical diagnostics and therapy selection of cancer liquid biopsies. Onco Targets Ther (2021) 14:3417–28. doi: 10.2147/OTT.S311907
14. Lu C, Han J, Sun X, Yang G. Electrochemical detection and point-of-care testing for circulating tumor cells: current techniques and future potentials. Sensors (Basel) (2020) 20(21):6073. doi: 10.3390/s20216073
15. Cui K, Ou Y, Shen Y, Li S, Sun Z. Clinical value of circulating tumor cells for the diagnosis and prognosis of hepatocellular carcinoma (HCC): A systematic review and meta-analysis. Med (Baltimore) (2020) 99(40):e22242. doi: 10.1097/MD.0000000000022242
16. Wang Y, Yu X, Hartmann D, Zhou J. Circulating tumor cells in peripheral blood of pancreatic cancer patients and their prognostic role: a systematic review and meta-analysis. HPB (Oxford) (2020) 22(5):660–9. doi: 10.1016/j.hpb.2019.11.003
17. Soltysova A, Sedlackova T, Dvorska D, Jasek K, Chokhachi Baradaran P, Horvathova Kajabova V, et al. Monosomy 3 influences epithelial-mesenchymal transition gene expression in uveal melanoma patients) consequences for liquid biopsy. Int J Mol Sci (2020) 21(24):9651. doi: 10.3390/ijms21249651
18. Piñeiro R, Martínez-Pena I, López-López R. Relevance of CTC clusters in breast cancer metastasis. Adv Exp Med Biol (2020) 1220:93–115. doi: 10.1007/978-3-030-35805-1_7
19. Moher D, Liberati A, Tetzlaff J, Altman DG, PRISMA Group. Preferred reporting items for systematic reviews and meta-analyses: the PRISMA statement. PloS Med (2009) 6(7):e1000097.
20. Gong Z, Tang J, Hu W, Song X, Liu X, Mu J, et al. Serum galactose-deficient immunoglobulin A1 in recurrent immunoglobulin a nephropathy after kidney transplantation: A meta-analysis. Transpl Immunol (2023) 79:101850. doi: 10.1016/j.trim.2023.101850
21. Sterne JA, Hernán MA, Reeves BC, Savović J, Berkman ND, Viswanathan M, et al. ROBINS-I: a tool for assessing risk of bias in non-randomised studies of interventions. BMJ (2016) 355:i4919. doi: 10.1136/bmj.i4919
22. Riethdorf S, Fritsche H, Müller V, Rau T, Schindlbeck C, Rack B, et al. Detection of circulating tumor cells in peripheral blood of patients with metastatic breast cancer: a validation study of the CellSearch system. Clin Cancer Res (2007) 13(3):920–8. doi: 10.1158/1078-0432.CCR-06-1695
23. Sawada T, Araki J, Yamashita T, Masubuchi M, Chiyoda T, Yunokawa M, et al. Prognostic impact of circulating tumor cell detected using a novel fluidic cell microarray chip system in patients with breast cancer. EBioMedicine (2016) 11:173–82. doi: 10.1016/j.ebiom.2016.07.027
24. Sheng Y, Wang T, Li H, Zhang Z, Chen J, He C, et al. Comparison of analytic performances of Cellsearch and iFISH approach in detecting circulating tumor cells. Oncotarget (2017) 8(5):8801–6. doi: 10.18632/oncotarget.6688
25. Li JB, Geng CZ, Yan M, Wang YS, Ouyang QC, Yin YM, et al. Circulating tumor cells in patients with breast tumors were detected by a novel device: a multicenter, clinical trial in China. Zhonghua yi xue za zhi (2017) 97(24):1857–61. doi: 10.3760/cma.j.issn.0376-2491.2017.24.003
26. Jin L, Zhao W, Zhang J, Chen W, Xie T, Wang L, et al. Evaluation of the diagnostic value of circulating tumor cells with CytoSorter® CTC capture system in patients with breast cancer. Cancer Med (2020) 9(5):1638–47. doi: 10.1002/cam4.2825
27. Li Y, Ma G, Zhao P, Chen W, Xie T, Wang L, et al. Improvement of sensitive and specific detection of circulating tumor cells using negative enrichment and immunostaining-FISH. Clin Chim Acta (2018) 485:95–102. doi: 10.1016/j.cca.2018.06.034
28. Li FR, Li Q, Zhou HX, Qi H, Deng CY. Detection of circulating tumor cells in breast cancer with a refined immunomagnetic nanoparticle enriched assay and nested-RT-PCR. Nanomedicine (2013) 9(7):1106–13. doi: 10.1016/j.nano.2013.03.002
29. Weissenstein U, Schumann A, Reif M, Link S, Toffol-Schmidt UD, Heusser P. Detection of circulating tumor cells in blood of metastatic breast cancer patients using a combination of cytokeratin and EpCAM antibodies. BMC Cancer (2012) 12:206. doi: 10.1186/1471-2407-12-206
30. Zhang X, Lu X, Gao W, Wang Y, Jia C, Cong H. A label-free microfluidic chip for the highly selective isolation of single and cluster CTCs from breast cancer patients. Transl Oncol (2021) 14(1):100959. doi: 10.1016/j.tranon.2020.100959
31. Kim SJ, Masago A, Tamaki Y, Akazawa K, Tsukamoto F, Sato J, et al. A novel approach using telomerase-specific replication-selective adenovirus for detection of circulating tumor cells in breast cancer patients. Breast Cancer Res Treat (2011) 128(3):765–73. doi: 10.1007/s10549-011-1603-2
32. Chen Y, Zou TN, Wu ZP, Zhou YC, Gu YL, Liu X, et al. Detection of cytokeratin 19, human mammaglobin, and carcinoembryonic antigen-positive circulating tumor cells by three-marker reverse transcription-PCR assay and its relation to clinical outcome in early breast cancer. Int J Biol Markers (2010) 25(2):59–68. doi: 10.1177/172460081002500201
33. Zhao S, Yang H, Zhang M, Zhang D, Liu Y, Liu Y, et al. Circulating tumor cells (CTCs) detected by triple-marker EpCAM, CK19, and hMAM RT-PCR and their relation to clinical outcome in metastatic breast cancer patients. Cell Biochem Biophys (2013) 65(2):263–73. doi: 10.1007/s12013-012-9426-2
34. Radovich M, Jiang G, Hancock BA, Chitambar C, Nanda R, Falkson C, et al. Association of circulating tumor DNA and circulating tumor cells after neoadjuvant chemotherapy with disease recurrence in patients with triple-negative breast cancer: preplanned secondary analysis of the BRE12-158 randomized clinical trial. JAMA Oncol (2020) 6(9):1410–5. doi: 10.1001/jamaoncol.2020.2295
35. Cristofanilli M, Budd GT, Ellis MJ, Stopeck A, Matera J, Miller MC, et al. Circulating tumor cells, disease progression, and survival in metastatic breast cancer. N Engl J Med (2004) 351(8):781–91. doi: 10.1056/NEJMoa040766
36. Bidard FC, Jacot W, Kiavue N, Dureau S, Kadi A, Brain E, et al. Efficacy of circulating tumor cell count-driven vs clinician-driven first-line therapy choice in hormone receptor-positive, ERBB2-negative metastatic breast cancer: the STIC CTC randomized clinical trial. JAMA Oncol (2021) 7(1):34–41. doi: 10.1001/jamaoncol.2020.5660
37. Moore HCF, Barlow WE, Somlo G, Gralow JR, Schott AF, Hayes DF, et al. A randomized trial of fulvestrant, everolimus, and anastrozole for the front-line treatment of patients with advanced hormone receptor-positive breast cancer, SWOG S1222. Clin Cancer Res (2022) 28(4):611–7. doi: 10.1158/1078-0432.CCR-21-3131
38. Smerage JB, Barlow WE, Hortobagyi GN, Winer EP, Leyland-Jones B, Srkalovic G, et al. Circulating tumor cells and response to chemotheruregapy in metastatic breast cancer: SWOG S0500. J Clin Oncol (2014) 32(31):3483–9. doi: 10.1200/JCO.2014.56.2561
39. Trapp E, Janni W, Schindlbeck C, Jückstock J, Andergassen U, de Gregorio A, et al. Presence of circulating tumor cells in high-risk early breast cancer during follow-up and prognosis. J Natl Cancer Inst (2019) 111(4):380–7. doi: 10.1093/jnci/djy152
40. Pang S, Li H, Xu S, Feng L, Ma X, Chu Y, et al. Circulating tumour cells at baseline and late phase of treatment provide prognostic value in breast cancer. Sci Rep (2021) 11(1):13441. doi: 10.1038/s41598-021-92876-8
41. Wallwiener M, Hartkopf AD, Baccelli I, Riethdorf S, Schott S, Pantel K, et al. The prognostic impact of circulating tumor cells in subtypes of metastatic breast cancer. Breast Cancer Res Treat (2013) 137(2):503–10. doi: 10.1007/s10549-012-2382-0
42. Hall CS, Karhade MG, Bowman Bauldry JB, Valad LM, Kuerer HM, DeSnyder SM, et al. Prognostic value of circulating tumor cells identified before surgical resection in nonmetastatic breast cancer patients. J Am Coll Surg (2016) 223(1):20–9. doi: 10.1016/j.jamcollsurg.2016.02.021
43. Ramirez JM, Fehm T, Orsini M, Cayrefourcq L, Maudelonde T, Pantel K, et al. Prognostic relevance of viable circulating tumor cells detected by EPISPOT in metastatic breast cancer patients. Clin Chem (2014) 60(1):214–21. doi: 10.1373/clinchem.2013.215079
44. Jacot W, Cottu P, Berger F, Dubot C, Venat-Bouvet L, Lortholary A, et al. Actionability of HER2-amplified circulating tumor cells in HER2-negative metastatic breast cancer: the CirCe T-DM1 trial. Breast Cancer Res (2019) 21(1):121. doi: 10.1186/s13058-019-1215-z
45. Pierga JY, Petit T, Lévy C, Ferrero JM, Campone M, Gligorov J, et al. Pathological response and circulating tumor cell count identifies treated HER2+ inflammatory breast cancer patients with excellent prognosis: BEVERLY-2 survival data. Clin Cancer Res (2015) 21(6):1298–304. doi: 10.1158/1078-0432.CCR-14-1705
46. Jueckstock J, Rack B, Friedl TW, Scholz C, Steidl J, Trapp E, et al. Detection of circulating tumor cells using manually performed immunocytochemistry (MICC) does not correlate with outcome in patients with early breast cancer - Results of the German SUCCESS-A- trial. BMC Cancer (2016) 16:401. doi: 10.1186/s12885-016-2454-3
47. Hayes DF, Cristofanilli M, Budd GT, Ellis MJ, Stopeck A, Miller MC, et al. Circulating tumor cells at each follow-up time point during therapy of metastatic breast cancer patients predict progression-free and overall survival. Clin Cancer Res (2006) 12(14 Pt 1):4218–24. doi: 10.1158/1078-0432.CCR-05-2821
48. Mu Z, Wang C, Ye Z, Austin L, Civan J, Hyslop T, et al. Prospective assessment of the prognostic value of circulating tumor cells and their clusters in patients with advanced-stage breast cancer. Breast Cancer Res Treat (2015) 154(3):563–71. doi: 10.1007/s10549-015-3636-4
49. Larsson AM, Jansson S, Bendahl PO, Jörgensen LT, Loman N, Graffman C, et al. Longitudinal enumeration and cluster evaluation of circulating tumor cells improve prognostication for patients with newly diagnosed metastatic breast cancer in a prospective observational trial. Breast Cancer Res (2018) 20(1):48. doi: 10.1186/s13058-018-0976-0
50. Yang Y, Li L, Tian W, Qiao Z, Qin Q, Su L, et al. A nomogram for predicting the HER2 status of circulating tumor cells and survival analysis in HER2-negative breast cancer. Front Oncol (2022) 12:943800. doi: 10.3389/fonc.2022.943800
51. Shiomi-Mouri Y, Kousaka J, Ando T, Tetsuka R, Nakano S, Yoshida M, et al. Clinical significance of circulating tumor cells (CTCs) with respect to optimal cut-off value and tumor markers in advanced/metastatic breast cancer. Breast Cancer (2016) 23(1):120–7. doi: 10.1007/s12282-014-0539-x
52. Dawood S, Broglio K, Valero V, Reuben J, Handy B, Islam R, et al. Circulating tumor cells in metastatic breast cancer: from prognostic stratification to modification of the staging system? Cancer (2008) 113(9):2422–30. doi: 10.1002/cncr.23852
53. Karhade M, Hall C, Mishra P, Anderson A, Kuerer H, Bedrosian I, et al. Circulating tumor cells in non-metastatic triple-negative breast cancer. Breast Cancer Res Treat (2014) 147(2):325–33. doi: 10.1007/s10549-014-3103-7
54. Morales S, Velasco A, Gasol A, Córdoba F, Vidal J, Serrate A, et al. Circulating tumor cells (CTCs) and cytokeratin 19 (CK19) mRNA as prognostic factors in heavily pretreated patients with metastatic breast cancer. Cancer Treat Res Commun (2018) 16:13–7. doi: 10.1016/j.ctarc.2018.04.003
55. Hayashi N, Nakamura S, Tokuda Y, Shimoda Y, Yagata H, Yoshida A, et al. Prognostic value of HER2-positive circulating tumor cells in patients with metastatic breast cancer. Int J Clin Oncol (2012) 17(2):96–104. doi: 10.1007/s10147-011-0260-0
56. Piñeiro R. Introduction - biology of breast cancer metastasis and importance of the analysis of CTCs. Adv Exp Med Biol (2020) 1220:1–10. doi: 10.1007/978-3-030-35805-1_1
57. Mu W, Chu Q, Yang H, Guan L, Fu S, Gao T, et al. Multipoint costriking nanodevice eliminates primary tumor cells and associated-circulating tumor cells for enhancing metastasis inhibition and therapeutic effect on HCC. Adv Sci (Weinh) (2022) 9(9):2101472. doi: 10.1002/advs.202101472
58. Zhang L, Riethdorf S, Wu G, Wang T, Yang K, Peng G, et al. Meta-analysis of the prognostic value of circulating tumor cells in breast cancer. Clin Cancer Res (2012) 18(20):5701–10. doi: 10.1158/1078-0432.CCR-12-1587
59. Qiao GL, Qi WX, Jiang WH, Chen Y, Ma LJ. Prognostic significance of circulating tumor cells in esophageal carcinoma: a meta-analysis. Onco Targets Ther (2016) 9:1889–97. doi: 10.2147/OTT.S100005
60. Han L, Chen W, Zhao Q. Prognostic value of circulating tumor cells in patients with pancreatic cancer: a meta-analysis. Tumour Biol (2014) 35(3):2473–80. doi: 10.1007/s13277-013-1327-5
61. Yao Y, Zhu X, Liu W, Jiang J, Jiang H. Meta-analysis of the prognostic value of circulating tumor cells in gastrointestinal cancer. Med (Baltimore) (2022) 101(42):e31099. doi: 10.1097/MD.0000000000031099
62. Huang C, Lin X, He J, Liu N. Enrichment and detection method for the prognostic value of circulating tumor cells in ovarian cancer: A meta-analysis. Gynecol Oncol (2021) 161(2):613–20. doi: 10.1016/j.ygyno.2021.02.024
63. Mansouri S, Mokhtari-Hesari P, Naghavi-Al-Hosseini F, Majidzadeh-A K, Farahmand L. The prognostic value of circulating tumor cells in primary breast cancer prior to any systematic therapy: A systematic review. Curr Stem Cell Res Ther (2019) 14(6):519–29. doi: 10.2174/1574888X14666190306103759
64. Lv Q, Gong L, Zhang T, Ye J, Chai L, Ni C, et al. Prognostic value of circulating tumor cells in metastatic breast cancer: a systemic review and meta-analysis. Clin Transl Oncol (2016) 18(3):322–30. doi: 10.1007/s12094-015-1372-1
65. Myung JH, Eblan MJ, Caster JM, Park SJ, Poellmann MJ, Wang K, et al. Multivalent binding and biomimetic cell rolling improves the sensitivity and specificity of circulating tumor cell capture. Clin Cancer Res (2018) 24(11):2539–47. doi: 10.1158/1078-0432.CCR-17-3078
66. Seyfoori A, Seyyed Ebrahimi SA, Samiei E, Akbari M. Multifunctional hybrid magnetic microgel synthesis for immune-based isolation and post-isolation culture of tumor cells. ACS Appl Mater Interfaces (2019) 11(28):24945–58. doi: 10.1021/acsami.9b02959
67. Xiang Y, Zhang H, Lu H, Wei B, Su C, Qin X, et al. Bioorthogonal microbubbles with antifouling nanofilm for instant and suspended enrichment of circulating tumor cells. ACS Nano (2023) 17(10):9633–46. doi: 10.1021/acsnano.3c03194
68. Wu X, Xiao T, Luo Z, He R, Cao Y, Guo Z, et al. A micro-/nano-chip and quantum dots-based 3D cytosensor for quantitative analysis of circulating tumor cells. J Nanobiotechnology (2018) 16(1):65. doi: 10.1186/s12951-018-0390-x
69. Zhou J, Wu J, Hao X, Li P, Zhang H, Wu X, et al. An exploratory study on the checkout rate of circulating tumor cells and the prediction of efficacy of neoadjuvant therapy and prognosis in patients with HER-2-positive early breast cancer. Front Oncol (2022) 12:966624. doi: 10.3389/fonc.2022.966624
70. Wu Y, Meng Q, Yang Z, Shi L, Hu R, Zhang P, et al. Circulating HER-2 mRNA in the peripheral blood as a potential diagnostic and prognostic biomarker in females with breast cancer. Oncol Lett (2018) 16(3):3726–34. doi: 10.3892/ol.2018.9091
71. Chakraborty R, Lentzsch S. Circulating tumor cell burden as a component of staging in multiple myeloma: ready for prime time? J Clin Oncol (2022) 40(27):3099–102. doi: 10.1200/JCO.22.01040
72. Cullinane C, Fleming C, O'Leary DP, Hassan F, Kelly L, O'Sullivan MJ, et al. Association of circulating tumor DNA with disease-free survival in breast cancer: A systematic review and meta-analysis. JAMA Netw Open (2020) 3(11):e2026921. doi: 10.1001/jamanetworkopen.2020.26921
73. Kanwar N, Balde Z, Nair R, Dawe M, Chen S, Maganti M, et al. Heterogeneity of circulating tumor cell-associated genomic gains in breast cancer and its association with the host immune response. Cancer Res (2021) 81(24):6196–206. doi: 10.1158/0008-5472.CAN-21-1079
74. Lin D, Shen L, Luo M, Zhang K, Li J, Yang Q, et al. Circulating tumor cells: biology and clinical significance. Signal Transduct Target Ther (2021) 6(1):404. doi: 10.1038/s41392-021-00817-8
75. Mittal S, Brown NJ, Holen I. The breast tumor microenvironment: role in cancer development, progression and response to therapy. Expert Rev Mol Diagn (2018) 18(3):227–43. doi: 10.1080/14737159.2018.1439382
76. Ahn J, Yoon Y, Yeu Y, Lee H, Park S. Impact of TGF-b on breast cancer from a quantitative proteomic analysis. Comput Biol Med (2013) 43(12):2096–102. doi: 10.1016/j.compbiomed.2013.09.022
77. Bahhnassy A, Mohanad M, Shaarawy S, Ismail MF, El-Bastawisy A, Ashmawy AM, et al. Transforming growth factor-β, insulin-like growth factor I/insulin-like growth factor I receptor and vascular endothelial growth factor-A: prognostic and predictive markers in triple-negative and non-triple-negative breast cancer. Mol Med Rep (2015) 12(1):851–64. doi: 10.3892/mmr.2015.3560
78. Barrett-Lee P, Travers M, Luqmani Y, Coombes RC. Transcripts for transforming growth factors in human breast cancer: clinical correlates. Br J Cancer (1990) 61(4):612–7. doi: 10.1038/bjc.1990.136
79. Yi M, Niu M, Wu Y, Ge H, Jiao D, Zhu S, et al. Combination of oral STING agonist MSA-2 and anti-TGF-β/PD-L1 bispecific antibody YM101: a novel immune cocktail therapy for non-inflamed tumors. J Hematol Oncol (2022) 15(1):142. doi: 10.1186/s13045-022-01363-8
Keywords: heterogeneity, circulating tumor cell, breast cancer, diagnosis, prognostic value
Citation: Zhao H, Wang L, Fang C, Li C and Zhang L (2023) Factors influencing the diagnostic and prognostic values of circulating tumor cells in breast cancer: a meta-analysis of 8,935 patients. Front. Oncol. 13:1272788. doi: 10.3389/fonc.2023.1272788
Received: 19 September 2023; Accepted: 03 November 2023;
Published: 27 November 2023.
Edited by:
Alberto Traverso, Maastro Clinic, NetherlandsReviewed by:
Ming Yi, Zhejiang University, ChinaBarani Kumar Rajendran, Yale University, United States
Copyright © 2023 Zhao, Wang, Fang, Li and Zhang. This is an open-access article distributed under the terms of the Creative Commons Attribution License (CC BY). The use, distribution or reproduction in other forums is permitted, provided the original author(s) and the copyright owner(s) are credited and that the original publication in this journal is cited, in accordance with accepted academic practice. No use, distribution or reproduction is permitted which does not comply with these terms.
*Correspondence: Lijian Zhang, bGlqaWFuLnpoYW5nQGFsaXl1bi5jb20=; Chunhui Li, bGljaHVuaHVpMDg2MDMxMkBzaW5hLmNvbQ==; Chuan Fang, Y2h1YW5mYW5nQGhidS5lZHUuY24=
†These authors have contributed equally to this work