 Aimy Sebastian1*†
 Kelly A. Martin1†
 Ivana Peran2
 Nicholas R. Hum1
 Nicole F. Leon1
 Beheshta Amiri1
 Stephen P. Wilson1
 Matthew A. Coleman1Elizabeth K. Wheeler1
 Stephen W. Byers2
 Gabriela G. Loots1,3*
- 1Lawrence Livermore National Laboratory, Physical and Life Science Directorate, Livermore, CA, United States
- 2Georgetown-Lombardi Comprehensive Cancer Center, Department of Oncology, Georgetown University Medical Center, Washington, DC, United States
- 3University of California Davis Health, Department of Orthopaedic Surgery, Sacramento, CA, United States
Pancreatic ductal adenocarcinoma (PDAC) is one of the top five deadliest forms of cancer with very few treatment options. The 5-year survival rate for PDAC is 10% following diagnosis. Cadherin 11 (Cdh11), a cell-to-cell adhesion molecule, has been suggested to promote tumor growth and immunosuppression in PDAC, and Cdh11 inhibition significantly extended survival in mice with PDAC. However, the mechanisms by which Cdh11 deficiency influences PDAC progression and anti-tumor immune responses have yet to be fully elucidated. To investigate Cdh11-deficiency induced changes in PDAC tumor microenvironment (TME), we crossed p48-Cre; LSL-KrasG12D/+; LSL-Trp53R172H/+ (KPC) mice with Cdh11+/- mice and performed single-cell RNA sequencing (scRNA-seq) of the non-immune (CD45-) and immune (CD45+) compartment of KPC tumor-bearing Cdh11 proficient (KPC-Cdh11+/+) and Cdh11 deficient (KPC-Cdh11+/-) mice. Our analysis showed that Cdh11 is expressed primarily in cancer-associated fibroblasts (CAFs) and at low levels in epithelial cells undergoing epithelial-to-mesenchymal transition (EMT). Cdh11 deficiency altered the molecular profile of CAFs, leading to a decrease in the expression of myofibroblast markers such as Acta2 and Tagln and cytokines such as Il6, Il33 and Midkine (Mdk). We also observed a significant decrease in the presence of monocytes/macrophages and neutrophils in KPC-Cdh11+/- tumors while the proportion of T cells was increased. Additionally, myeloid lineage cells from Cdh11-deficient tumors had reduced expression of immunosuppressive cytokines that have previously been shown to play a role in immune suppression. In summary, our data suggests that Cdh11 deficiency significantly alters the fibroblast and immune microenvironments and contributes to the reduction of immunosuppressive cytokines, leading to an increase in anti-tumor immunity and enhanced survival.
1 Introduction
Pancreatic ductal adenocarcinoma (PDAC) is one of the deadliest types of cancer with a limited survival rate of ~10% over five years (1). In general, by the time a patient presents with symptoms, the disease has advanced to a surgically unresectable stage and likely metastasized to other vital organs leading to rapid mortality (2). Since conventional chemotherapy (FOLFIRINOX, gemcitabine, gemcitabine + abaraxane, etc.) prolongs patients’ lives for only a few months (3), it is necessary to identify new therapies or better therapeutic targets.
Our immune system, when activated, can elicit an antitumor response that can have long-term clinical benefits and could contribute to prolonged survival. Infiltration of immune cells into the tumor microenvironment (TME) has been associated with various disease prognoses depending on the type of immune cells present and has been leveraged to improve patient survival through immunotherapy in several types of cancers (4, 5). For example, T cells are conventionally the focus of already approved immunotherapies (6–9), and B cells show great promise for future immunotherapies as high B cell infiltration correlates with better survival in PDAC patients (10). As compared to “hot” tumors with inflammation and infiltrated T cells, PDACs are considered to be immunologically “cold” with low levels of tumor-infiltrating lymphocytes, which presents a challenge to established immunotherapies (11–13). A deeper understanding of PDAC immunobiology is necessary to make PDACs amenable to immune-based therapies.
PDAC tends to be surrounded by cells that suppress anti-tumor immune responses. Major immune suppressive cells in the TME include tumor-associated macrophages (TAMs), myeloid-derived suppressor cells (MDSCs), tumor-associated neutrophils (TANs) and regulatory T cells (Treg) (14). These immunosuppressive cells hinder CD4 and CD8 T cell response as well as the ability of natural killer (NK) and antigen-presenting cells (APC) to exert effective tumor surveillance, consequently leading to an inhibition of the anti-tumor immune responses (15). Cancer associated fibroblasts (CAFs) are another major cell type in the TME that can contribute to immunosuppression (14). CAFs are a vastly heterogeneous cell population and are the most prominent stromal cell type in pancreatic cancer (16). CAFs promote tumor proliferation, invasion and metastasis by secreting various growth factors and cytokines and by modifying the tumor extracellular matrix (ECM) (14, 17, 18). In addition, CAFs contribute to an immunosuppressive microenvironment through secretion of multiple cytokines and chemokines and reciprocal interactions with immune cells that mediate the recruitment and functional differentiation of these cells (16). A deeper understanding of the PDAC TME, specifically the coordinated actions of tumor supporting immune cells and CAFs against lymphocytes is necessary to make immune-based therapies feasible for effectively treating PDAC.
Cadherin 11 (Cdh11) is a mechanosensitive transmembrane protein involved in cell adhesion (19, 20) and plays a role in WNT signaling by modulating β-catenin (21, 22). In PDAC, it is primarily expressed by CAFs, and it was recently shown that Cdh11 deficiency induces antitumor immunity, reduces immunosuppression, and increases survival in tumor bearing mice (23). Furthermore, the administration of a small molecule inhibitor blocking Cdh11 increased the efficacy of gemcitabine, a common anti-cancer chemotherapeutic (23). However, the Cdh11 inhibitor, was ineffective in reducing tumor burden of mT3 pancreatic tumor bearing immunosuppressed Rag1-mutant mice, suggesting that T and B cells are required for immunomodulation of PDAC mediated by Cdh11 inhibition (23). Also, Cdh11 deficiency induced immune memory in Cdh11-/- mice that cleared tumors; these mice did not form new tumors upon subsequent re-challenges with the same cancer cells (23). The cellular and molecular mechanisms behind Cdh11 deficiency-induced antitumor activity and its relationship to immunosuppression are not yet fully understood.
Understanding how Cdh11 promotes an immunosuppressive tumor microenvironment in PDAC will provide invaluable insights into developing new clinical approaches for effective eradication of cancer cells, in solid tumors that are classically immunodeficient. Using an established genetically engineered PDAC mouse model (GEMM) (p48-Cre;LSL-KrasG12D/+;LSL-Trp53R172H/+) that has a median survival of 5 months (known as KPC mice) (24), we investigated Cdh11-deficiency induced changes in PDAC immune microenvironment. Using single-cell RNA sequencing (scRNA-seq) we compared the tumor microenvironment of Cdh11-deficient (KPC-Cdh11+/-) and wildtype (KPC-Cdh11+/+) mice with pancreatic tumors and identified immune subpopulations that correlate with decreased tumor burden and improved survival. Our study suggests that Cdh11 deficiency alters the molecular profiles of CAFs resulting in decreased expression of immunosuppressive cytokines within the TME. We also observed an increase in T cell infiltration and a loss of TAMs/MDSCs and neutrophils in the tumor of KPC-Cdh11+/- mice and identified several genes differentially expressed in these populations as a result of Cdh11-deficency. Knowledge of immune cell subtypes and genes found as altered in the TME as a result of a Cdh11-deficiency and their relationship to tumor prognosis will provide a basis for further development of novel therapies for PDAC.
2 Methods
2.1 Animal husbandry
Cdh11-/- (https://www.jax.org/strain/023494) (25) and KPC (p48-Cre;LSL-KrasG12D/+;LSL-Trp53R172H/+) mice were bred to each other to generate cohorts of KPC-Cdh11+/+, and KPC-Cdh11+/- as previously described (23). Mice were housed in a pathogen-free environment under standard conditions at Georgetown University (GU) and Lawrence Livermore National Laboratory (LLNL). All animal work was conducted under approved Institutional Animal Care and Use Committee (IACUC) protocols at GU and LLNL and conformed to the National Institute of Health (NIH) guide for the care and use of laboratory animals.
2.2 Pancreas collection and single-cell isolation
KPC-Cdh11+/+, KPC-Cdh11+/- and Cdh11+/+ cohorts (n≥4, mixed sex) were euthanized at 4-5 months of age (23). Pancreases were excised and single-cell suspensions were prepared using a collagenase digestion solution (3 mg/ml Collagenase I (ThermoFisher Scientific Catalog #17018029), 100 µg/mL DNase I (Roche Catalog #11284932001), Dispase II (Roche Catalog #4942078001) in RPMI1640 media supplemented with 10% FBS (ThermoFisher Scientific, Catalog #11875101) for 1 hour with shaking at 37°C. Digests were filtered through a 100 µm cell strainer and depleted of red blood cells using ACK lysis buffer, per manufacturer guidelines (Gibco, Catalog #A1049201). Remaining cells were analyzed for viability and CD45 expression. CD45-/7-AAD- (non-immune) and CD45+/7-AAD- (immune) cells populations were sorted via fluorescently activated cell sorting (FACS) and collected for scRNA-seq preparation.
2.3 FACS analysis
Cells from digested pancreases were stained in a 1:100 dilution of APC/Cyanine7 anti-mouse CD45 (Biolegend, Catalog #103116) in PBS with 1% FBS and incubated for 20 minutes in the dark. Cells were resuspended in 7-AAD Viability Staining Solution (BioLegend, Catalog #420404) and analyzed on a BD FACSMelody cytometer, sorting CD45+/7-AAD- and CD45+/7-AAD- populations for scRNA-seq analysis.
2.4 scRNA-seq and data analysis
Single-cell libraries were prepared from sorted cell populations from KPC-Cdh11+/+, KPC-Cdh11+/- and Cdh11+/- mice using the Chromium Single Cell 3′ GEM, Library & Gel Bead Kit v3 (10x Genomics, Pleasanton, CA, USA; catalog no. 1000075) on a 10x Genomics Chromium Controller following manufacturers protocol and sequenced using an Illumina (San Diego, CA, USA) NextSeq 500 sequencer as described before (26). The scRNA-seq data was demultiplexed and aligned against mouse reference genome mm10 using Cell Ranger Single-Cell Software Suite (10x Genomics, Pleasanton, CA, USA) to obtain Unique Molecular Identifier (UMI) counts. Subsequent analysis was performed in Seurat (27) as described before (26). Briefly, after pre-processing, normalization, feature selection and data scaling, data from various experimental groups were integrated to generate an integrated dataset. Subsequently, dimensional reduction by principal component analysis (PCA), clustering, Uniform Manifold Approximation and Projection (UMAP) reduction, and visualization of clusters were performed in Seurat as described before (26). Genes differentially expressed between clusters were identified using ‘FindMarkers’ function implemented in Seurat. For each experimental group, the cell type proportions were estimated as a ratio of the number of cells in each cell cluster relative to the total number of cells sequenced. Any CD45+ clusters found in non-immune scRNA-seq data or CD45- clusters found in immune data were excluded from the analysis.
2.5 Analysis of human PDAC samples
Human PDAC scRNA-seq data from early and metastatic tumors (28) were obtained from the Gene Expression Omnibus database (GSE205013). The raw barcode, feature, and matrix were downloaded and analyzed using Seurat (29), as described above to identify the cell types and cell type-specific gene expression as outlined in the original analysis (28). Correlation between CDH11 expression and immune cell infiltration was determined using TIMER (http://timer.cistrome.org/). Correlation between the expression of CDH11 and other genes in human tumors was determined using TNMplot (https://tnmplot.com/). UALCAN (https://ualcan.path.uab.edu) was used to determine protein expression of CDH11 in PDAC patient tumors, using data from Clinical Proteomic Tumor Analysis Consortium (CPTAC).
2.6 Immunohistochemical analysis
Tissues were embedded and sectioned as previously described (23). Formalin-Fixed Paraffin-Embedded (FFPE) 5µm thick sections were deparaffinized with xylene and rehydrated through a series of decreasing ethanol concentrations. Heat induced antigen retrieval method (HIER) using either sodium citrate (pH 6) at 65 °C or universal antigen retrieval solution (Unitrieve) at 65°C for 45 minutes was used to expose antigens for immunohistochemical staining. Slides were counterstained with DAPI and stained for proteins of interest using the following primary and secondary antibodies: Pdgfra (Abcam, ab203491), Cdh11 (ThermoFisher 32-1700), Il33 (ThermoFisher, PA5-47007), CD8a (Abcam, ab21769), F4/80 (Abcam, ab111101) and Ly6g (Abcam, ab238132), anti-rabbit IgG Alexa Fluor 488 (Catalog #A21441, ThermoFisher Scientific), anti-rat IgG2a Alexa Fluor 488 (Catalog #A11006, ThermoFisher Scientific) and anti-rabbit IgG Alexa Fluor 594 (Catalog #A11037, ThermoFisher Scientific). IL33, F4/80 and Ly6g IHC staining was quantified using ImageJ (https://imagej.nih.gov/ij/). Total cell numbers were estimated based on DAPI nuclear staining and cell types of interest were identified as cells with positive signal for IL33, F4/80 or Ly6g that colocalized with the nuclear DAPI stain. Cells exhibiting positive signal were then quantitated relative to the total number of cells within an image. CD8a expression was quantified with a Vectra quantitative pathology imaging system and Inform software.
2.7 Cytokine array analysis
Sera and pancreases collected at the time of euthanasia from KPC-Cdh11+/+ and KPC-Cdh11+/- mice were analyzed for cytokine expression using Mouse XL Cytokine Array (R&D Systems). Equal amount of protein lysates or serum belonging to the same experimental group were pooled together before analysis. This data has been previously described (23).
2.8 Statistical analysis
Two-proportion Z-test was used to identify statistically significant differences between cell proportions. A p value <0.05 was considered as significant.
3 Results
3.1 Cdh11 deficiency alters CAF profile in PDAC
To investigate the role of Cdh11 in PDAC, we isolated non-immune (CD45-) and immune (CD45+) cells from pancreases of KPC-Cdh11+/+ and KPC-Cdh11+/- mice and both fractions were analyzed separately using scRNA-seq (Figure 1A). First, non-immune scRNA-seq data was computationally analyzed to determine Cdh11 deficiency-induced changes in cancer and stromal cells. CD45- cells were clustered using an unbiased clustering approach which identified eleven clusters with distinct gene expression profiles (Figures 1B-D). The identity of each cluster was determined based on the expression of previously established cell type-specific markers (Figures 1B, C) (23, 26, 30, 31).
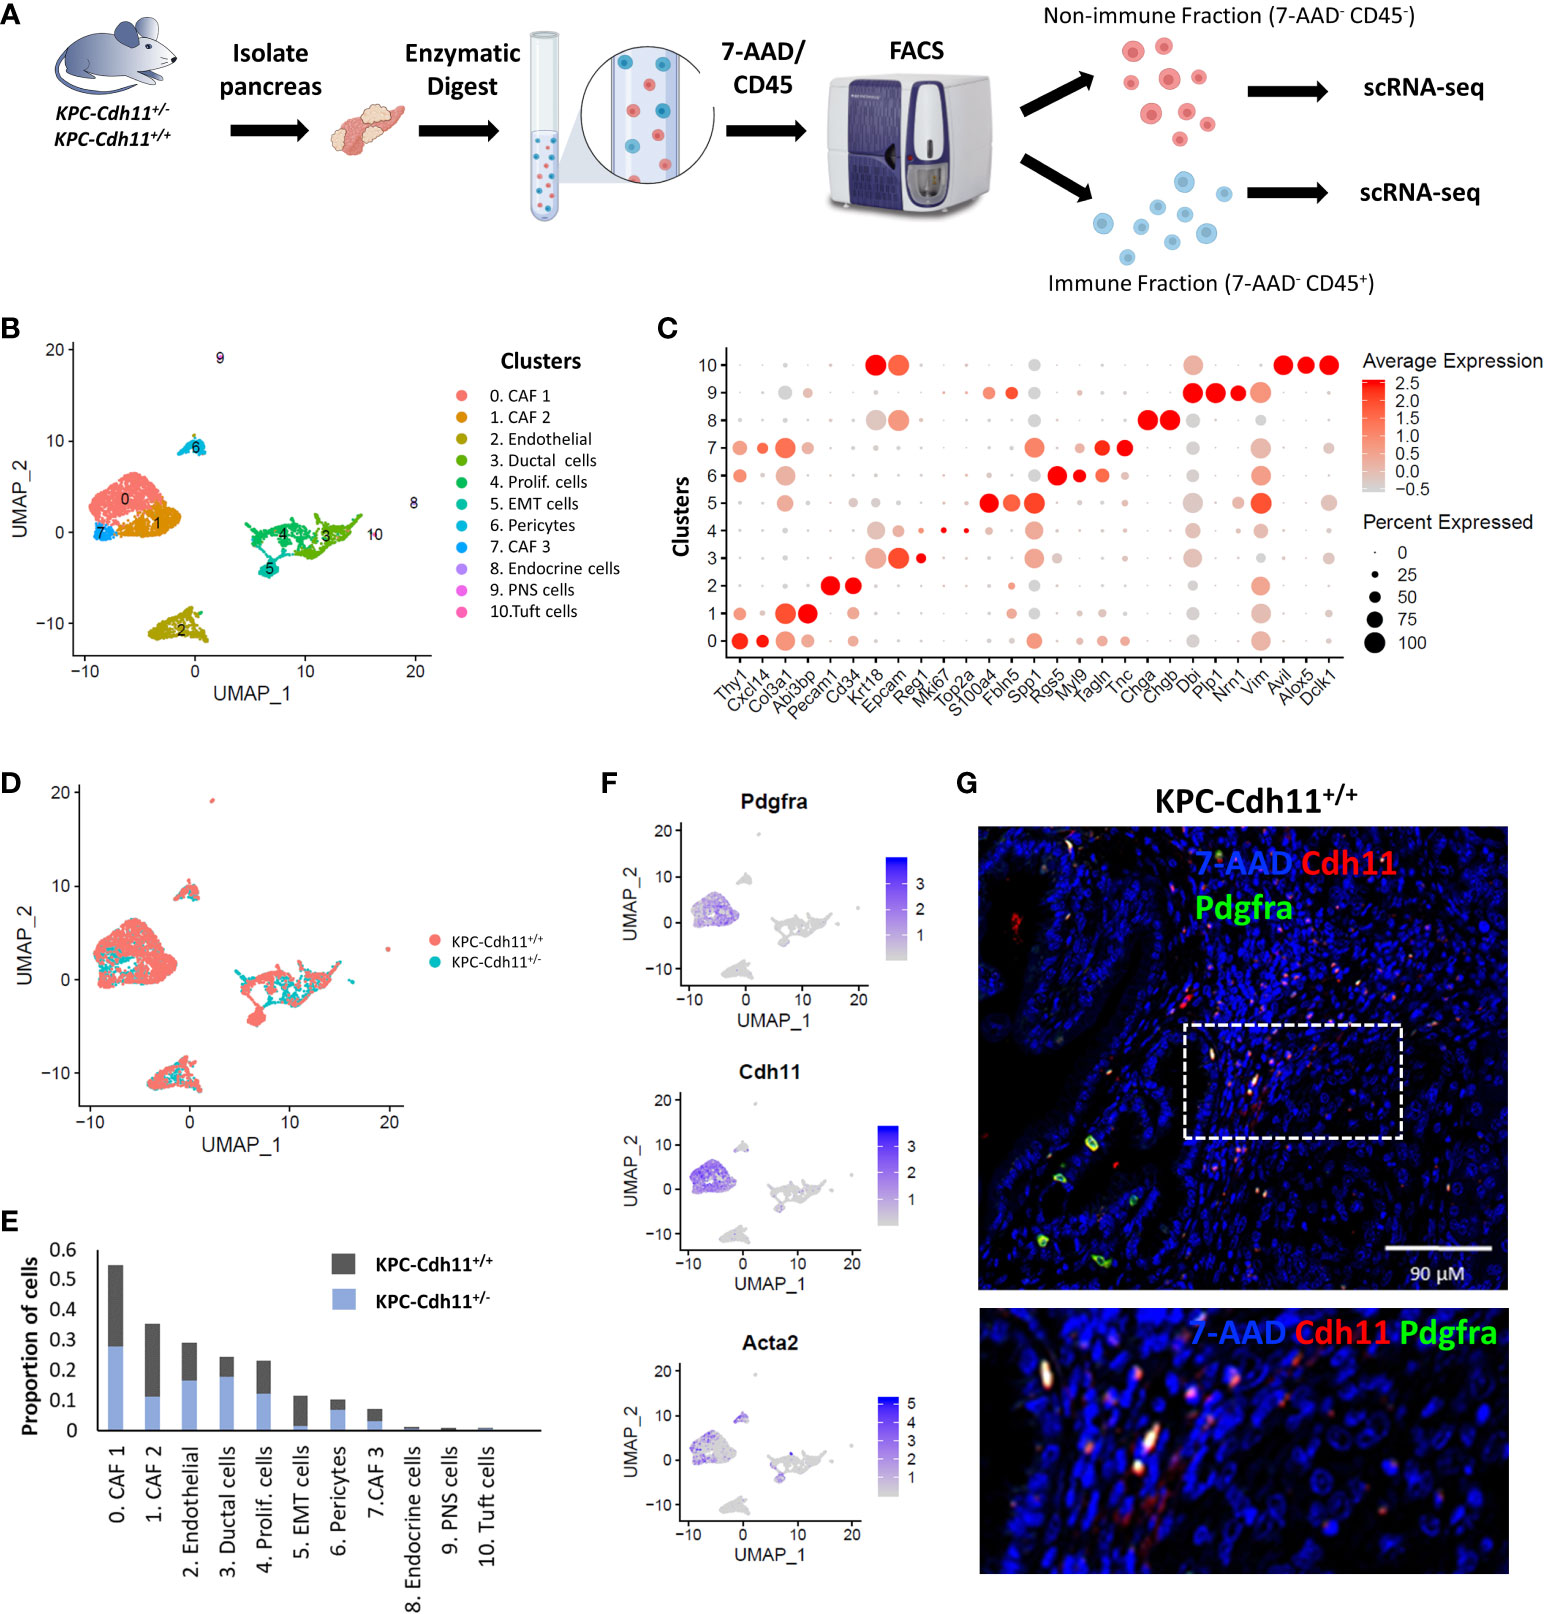
Figure 1 Single-cell level analysis of Cdh11 deficiency-induced changes in stromal cells. (A) Experimental design. CD45+ (immune) and CD45- (non-immune) cells from pancreases of KPC-Cdh11+/+ and KPC-Cdh11+/- mice were isolated and both fractions were analyzed separately using scRNA-seq. (B) Non-immune cell clusters from both KPC-Cdh11+/+ and KPC-Cdh11+/- mice visualized by Uniform Manifold Approximation and Projection (UMAP). Each color represents a cell type/subtype with distinct transcriptomic profiles. (C) Dot plot showing the expression of cell type markers corresponding to the cell clusters shown in panel (A). Dot size represents the fraction of cells expressing a gene in a cluster and intensity of color indicates the average expression level in that cluster. (D) UMAP plot colored by experimental condition. (E) Graph showing the proportion of various cell types in each experimental group, calculated using scRNA-seq data. (F) Feature plot showing the enrichment of Pdgfra, Cdh11 and myofibroblast marker Acta2 in CAF clusters. (G) IHC showing co-expression of Cdh11 and Pdgfra in KPC-Cdh11+/+ mice. The dotted boxed area is shown on the bottom with higher magnification.
CAFs were one of the most abundant cell types identified in pancreatic cancer TME and robustly expressed markers such as Pdgfra, Col3a1 and Dcn (Figures 1C, F). Based on scRNA-seq data, KPC-Cdh11+/+ mice had ~22.6% more CAFs in their TME compared to KPC-Cdh11+/- mice (Two-proportion z-test; p value <0.00001). Consistent with Cdh11 known expression in CAFs, Cdh11 expression was primarily observed in CAF clusters, which also had robust expression of CAF marker Pdgfra (Figure 1F). Further IHC analysis showed co-expression of Pdgfra and Cdh11 in KPC-Cdh11+/+ mice, confirming that CAFs in PDAC robustly express Cdh11 (Figure 1G, S1). Analysis of pancreases from wildtype mice without tumors (Cdh11+/+) revealed that normal fibroblasts also express Cdh11, suggesting that Cdh11 may play a significant role in healthy resident fibroblasts as well (Figure S2). Low level of Cdh11 expression was also observed in cells undergoing epithelial-to-mesenchymal transition (EMT) in PDAC (Figure S3A). Interestingly, KPC-Cdh11+/+ mice had significantly more EMT cells than KPC-Cdh11+/- mice (Figure 1E). We also analyzed previously published human ‘early’ and ‘metastatic’ PDAC scRNA-seq data (28) and found that CDH2+ EMT cells expressed low levels of CDH11 (Figure S3B-C). However, in human tumors also CAFs were the predominant CDH11-expressing cells (Figure S3C).
To further understand Cdh11 deficiency-induced changes in CAFs, we extracted cells from CAF clusters (cluster 0, 1 and 7; Figure 1B) and analyzed them in more detail. This analysis identified three CAF subtypes including Acta2high myofibroblasts (myCAFs), Il33high inflammatory CAFs (iCAFs), and a Thy1high fibroblast cluster (Figures 2A-C). Consistent with our previous findings (23), CAFs from KPC-Cdh11+/+ mice expressed higher levels of Acta2 than KPC-Cdh11+/- mice (Figure 2D). Expression of other myofibroblast markers such as Tagln and Myl9 were also elevated in KPC-Cdh11+/+ mice (Figure 2D). We also identified several other genes differentially expressed between KPC-Cdh11+/+ and KPC-Cdh11+/- derived CAFs. These genes included cystatin C (Cst3), inflammatory cytokines Ccl11, Il33, Il11 and Il6, insulin growth factor 1 (Igf1) and heparin binding growth factors midkine (Mdk) and pleiotrophin (Ptn), all of which had higher expression in KPC-Cdh11+/+ mice. Proteases Adamts9 and Mmp13 and Wnt inhibitor Dkk2 were found to be upregulated in KPC-Cdh11+/- mice (Figure 2D). Furthermore, a cytokine array analysis showed increased Il33 and Cst3 expression in both tumor and serum from KPC-Cdh11+/+ mice compared to KPC-Cdh11+/- mice, while Il11 was highly enriched in KPC-Cdh11+/+ serum alone and Ccl11 was enriched in tumor alone (Figure 2E). Il33 is a member of the IL-1 family of cytokines, secreted by a variety of cells including epithelial, endothelial and fibroblast-like cells (32). It has been suggested that the increased expression of IL33 in CAFs promotes tumor growth and metastasis via modulation of the immune system (32). Consistent with the cytokine data, IHC confirmed a higher number of Il33-expressing CAFs in KPC-Cdh11+/+ mice (Figure 3, S4). Il11, Il6, Ccl11, Mdk and Ptn have also been shown to play key roles in cancer progression and immune modulation (33–38), suggesting that altered expression of these genes in KPC-Cdh11+/- mice may contribute to changes in tumor immune profile. Igf1 signaling has also been implicated in tumor growth, metastasis, drug resistance in PDAC (39).
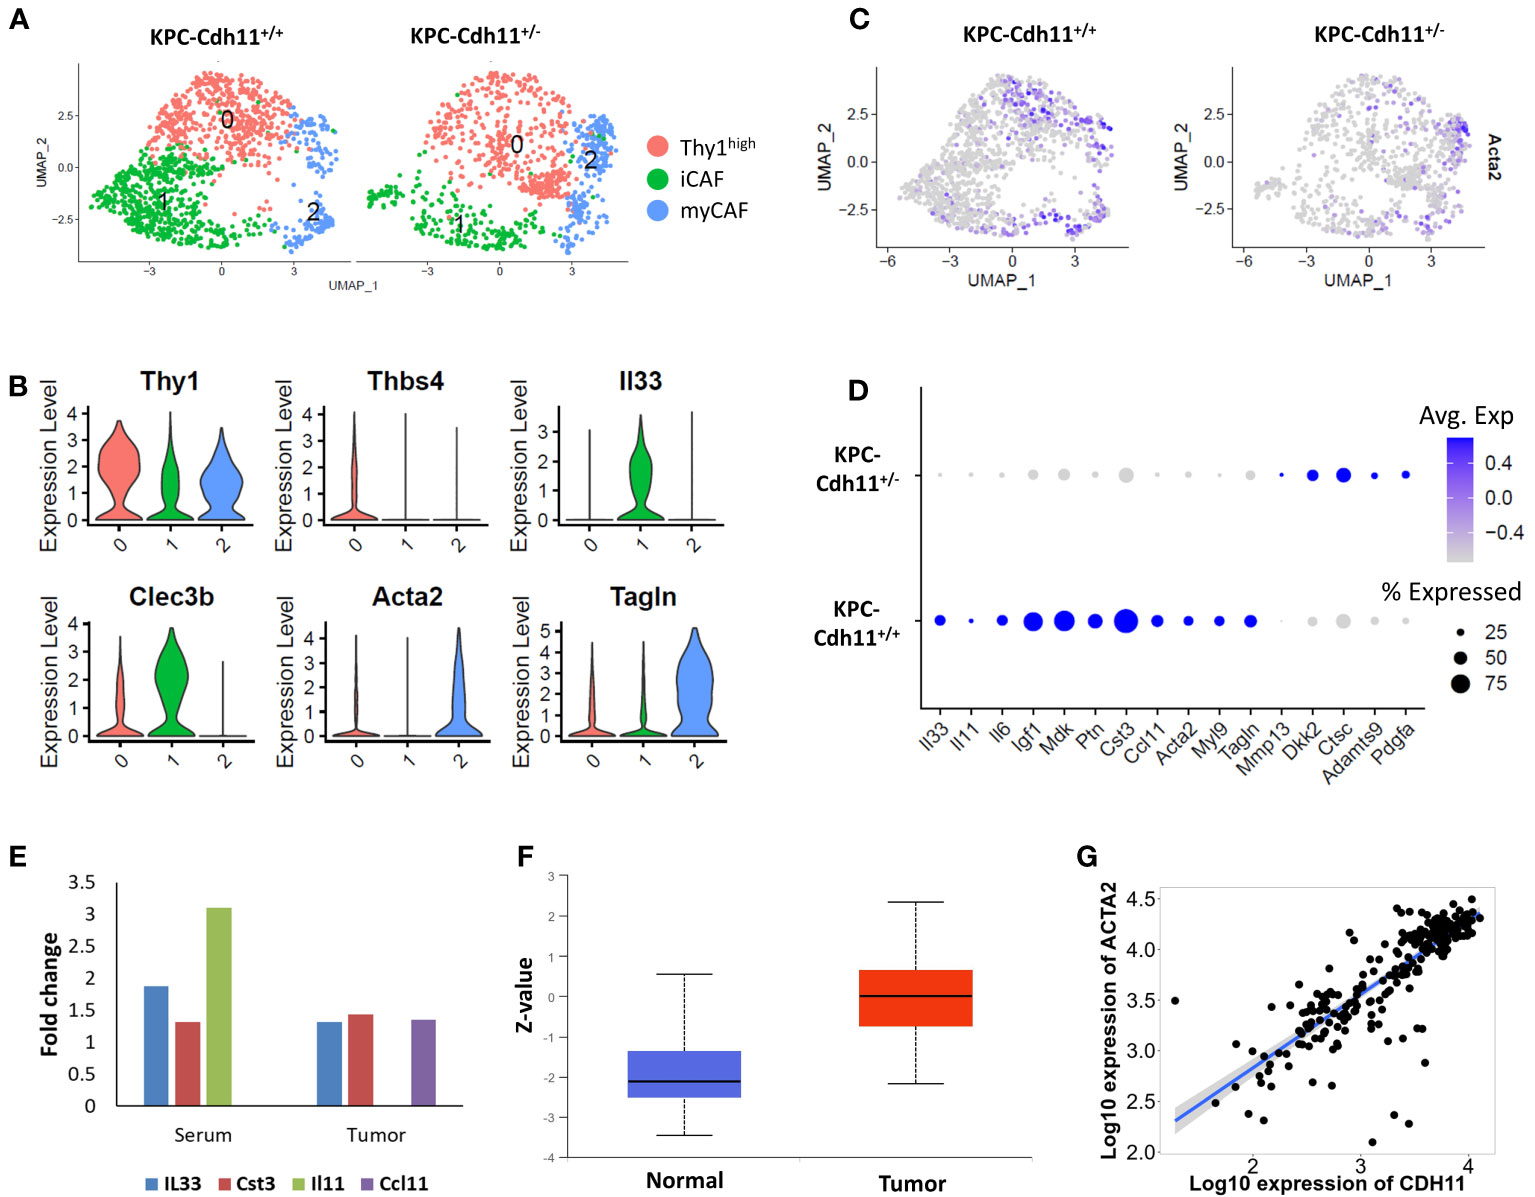
Figure 2 Comparative analysis of KPC-Cdh11+/+ and KPC-Cdh11+/- derived CAFs. (A) UMAP plot showing various CAF subtypes identified in KPC-Cdh11+/+ and KPC-Cdh11+/- mice. (B) Violin plot showing the expression of selected CAF subtype markers in scRNA-seq data from both KPC-Cdh11+/+ and KPC-Cdh11+/- tumors. (C) Feature plot showing the expression of myofibroblast marker Acta2 in each experimental group. (D) Dot plot showing a subset of CAF genes differentially expressed between KPC-Cdh11+/- and KPC-Cdh11+/+ mice. (E) Cytokine array analysis showing fold increase in the expression of various cytokines in serum and tumor samples from KPC-Cdh11+/+ mice compared to KPC-Cdh11+/- mice. (F) CDH11 protein expression in human pancreatic cancer (CPTAC data from UALCAN). Z-values (Y-axis) represent standard deviations from the median protein expression across samples. (G) Correlation between the expression of CDH11 and ACTA2 genes in human PDAC.
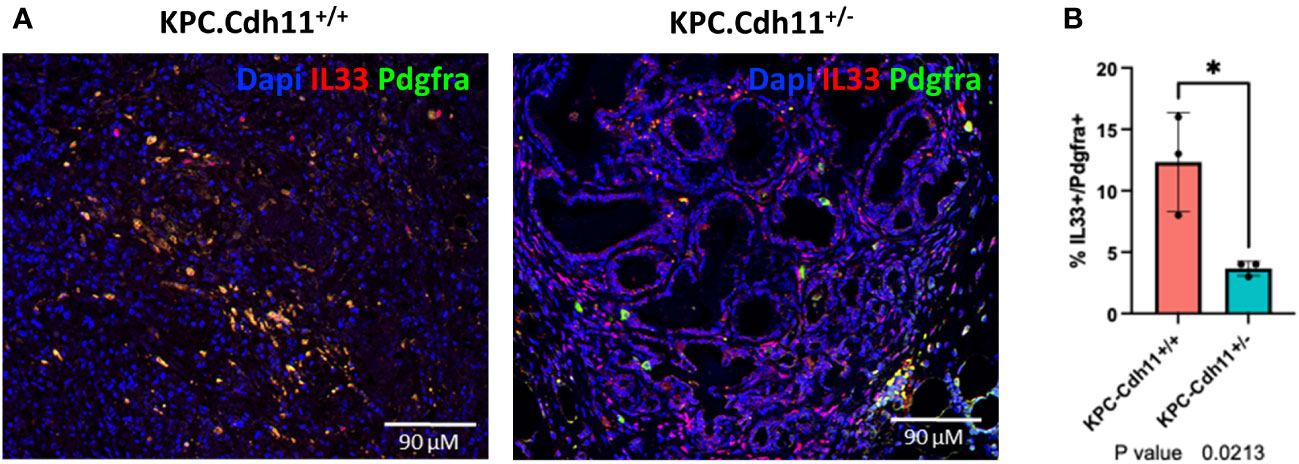
Figure 3 Il33 expression in CAFs. (A) IHC analysis showed an increased number of Il33-expressing CAFs (Pdgfra+ cells) in KPC-Cdh11+/+ pancreas compared to KPC-Cdh11+/- pancreas. (B) IHC quantification of Il33 in CAFs (Pdgfra+ cells) from KPC-Cdh11+/+ and KPC-Cdh11+/- pancreases. *P value <0.05.
Next, we analyzed publicly available human pancreatic cancer data (data from CPTAC) and found that CDH11 protein expression was significantly elevated in tumor samples compared to normal (Figure 2F). Additionally, we observed a strong positive correlation between the expressions of CDH11 and ACTA2 genes in human PDAC (Figure 2G). Consistent with our scRNA-seq data, genes such as IL33 and IGF1 also showed a positive correlation with CDH11 expression while PDGFA was negatively correlated (Figure S5). Together, these findings further confirm the role of Cdh11 in cancer progression and suggest that Cdh11 deficiency in stromal cells may significantly alter the TME.
3.2 Cdh11-deficient stroma promotes immune infiltration in KPC tumors
Next, we investigated how the lack of Cdh11 in the stroma impacts the tumor immune microenvironment. CD45-expressing cells purified and quantified by FACS were found in higher proportion in the KPC-Cdh11+/- than in the KPC-Cdh11+/+ pancreas (Figure S6A), suggesting an increase in immune infiltration when the Cdh11 is absent from the PDAC stroma. scRNA-seq analyses of these CD45+ cells from KPC-Cdh11+/+ and KPC-Cdh11+/- mice identified twelve distinct immune cell subtypes including macrophages, neutrophils, dendritic cells (DCs), plasmacytoid dendritic cells (pDCs), B cells and T cells (Figure 4A). Cells in cluster 0 had high expression levels for members of the B cell receptor (BCR) signaling complex: Cd79a and Cd79b (40). This cluster also expressed Ms4a1 (CD20) and was identified as CD20hi B cells (Figure 4B). Cluster 8 also expressed moderate levels of Cd79a and Cd79b, in addition to showing enrichment for Jun and Mef2c. This cluster was identified as Junhi B cells. Cluster 1 had high transcript levels of monocyte/macrophage genes Cd14 and Csf1r, designating this grouping of cells as monocytes/macrophages (Mono-Mac) (41) (Figure 4B). Genes critical to T cell signaling including Thy1, Cd3e and Cd3d were highly expressed in clusters 3, 4, 5 and 10 (42). Cluster 5 had additional markers including Foxp3 and Rora and was identified as Foxp3 T cells while cluster 4 was identified as Cd8 T cells based on the expression of cytotoxic T cell markers Cd8a and Nkg7 (Figure 4B). Cluster 10 represented a small proportion of cells expressing high levels of Il22 and Ccr6 and was identified as Il22hi T cells. Cluster 2 was identified as neutrophils based on high expression of S100a8 and S100a9 and cluster 6 was annotated as proliferating cells based on the expression of Mki67 and Top2a (Figures 4A, B). Cluster 7 expressed DC markers while cluster 11 expressed markers of pDCs. Jchain and Igkc, two genes highly expressed in plasma cells were enriched in cluster 9 (43–46).
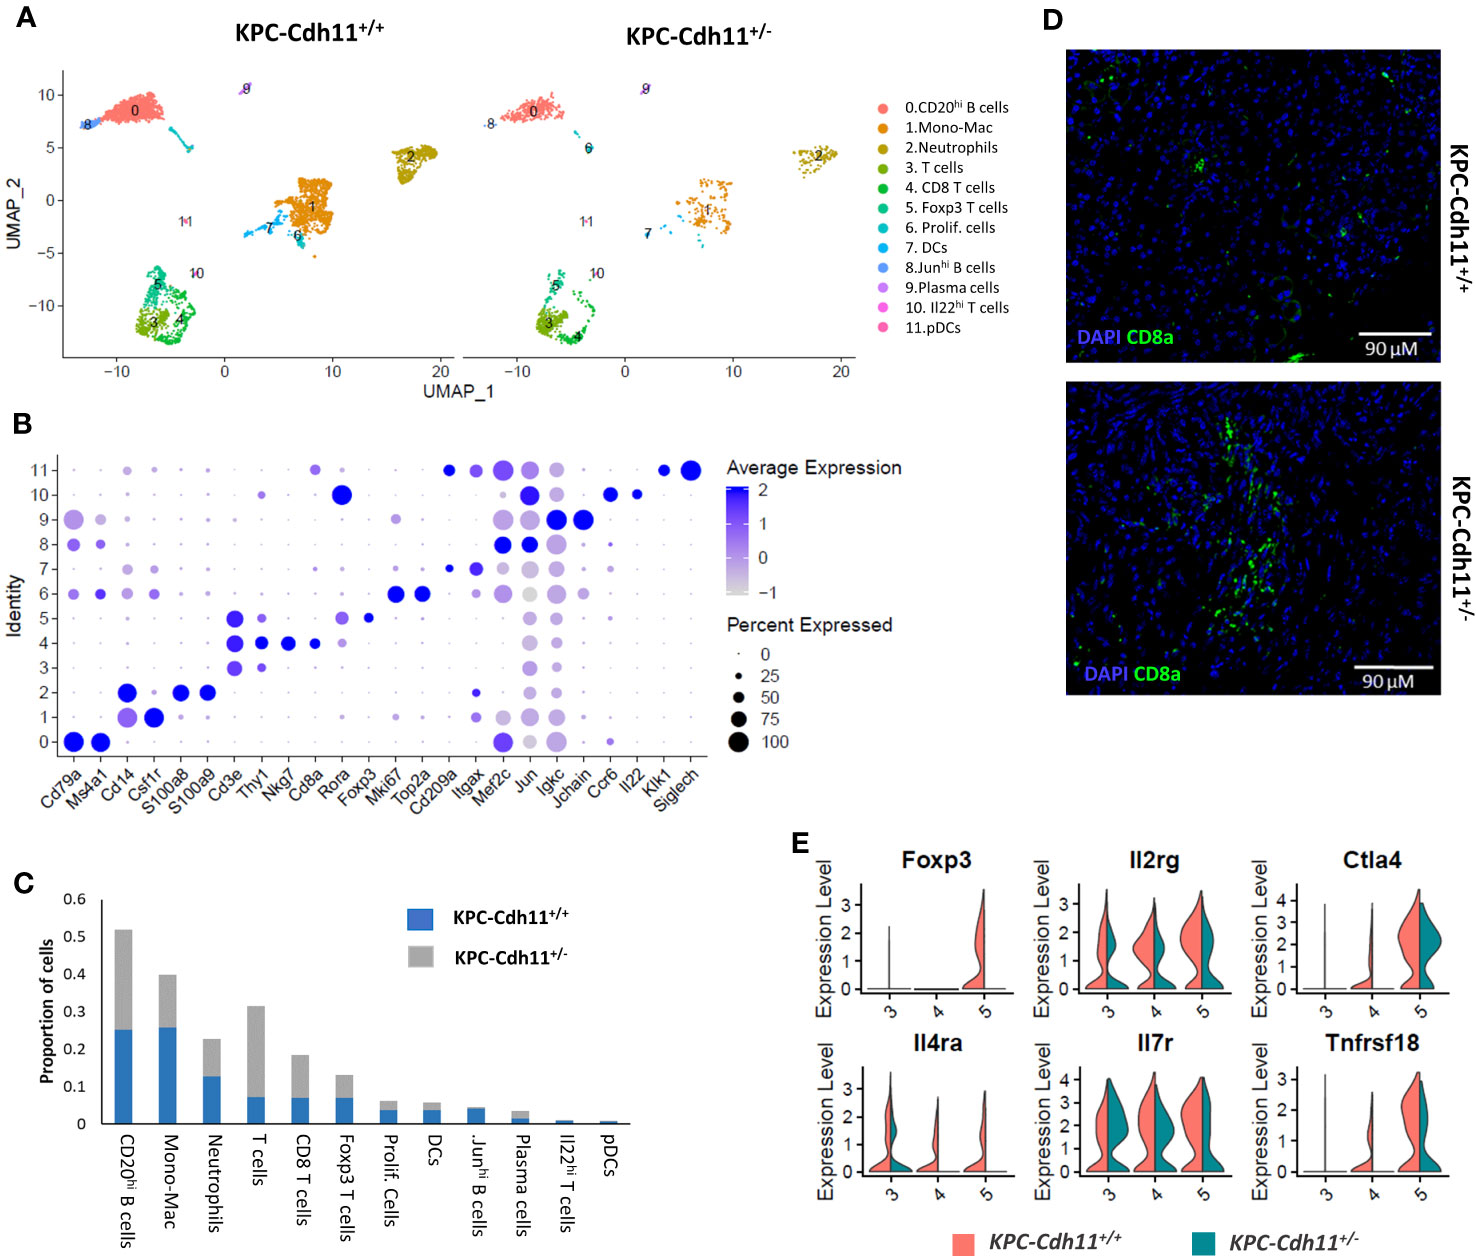
Figure 4 Characterization of pancreas-derived immune cells. (A) Immune cell clusters from KPC-Cdh11+/+ and KPC-Cdh11+/- mice visualized by UMAP. (B) Dot plot showing the expression of immune cell markers in scRNA-seq data from both KPC-Cdh11+/+ and KPC-Cdh11+/- mice. Dot size signifies the percentage of cells in that cluster that express a particular gene, while strength of color denotes average expression in that cluster. (C) Bar graph showing the proportion of each cell type in both experimental groups, calculated from the scRNA-seq data. (D) IHC showing CD8 T cell infiltration in tumors. (E) Violin plot showing the differential expression of selected T cell genes in various T cell clusters.
Consistent with our previous finding (23), T cells and Cd8 T cells were found in high abundance in scRNA-seq data from KPC-Cdh11+/- tumors (Two-proportion z-test; p<0.05). (Figure 4C). IHC analysis further confirmed increased Cd8 T cell infiltration in KPC-Cdh11+/- tumors (Figure 4D, S6B-C). We also found that KPC-Cdh1+/+ tumors had a slightly higher proportion of FOXP3+ T cells compared to KPC-Cdh11+/- (P value: 0.18). In addition, we observed elevated expression of FoxP3, interleukin 2 receptor gamma (Il2rg), Il4ra, Il7r, cytotoxic T-lymphocyte-associated protein 4 (Ctla4), and glucocorticoid-induced tumor necrosis factor receptor-related protein (Tnfrsf18) in KPC-Cdh1+/+ tumors (Figure 4E), many of which have been previously suggested to play critical roles in Treg differentiation or function (23, 47–49). We also observed a small (not statistically significant) increase in the proportion of Cd20hi B cells in KPC-Cdh11+/- mice while Junhi B cells were significantly reduced.
3.3 Myeloid infiltration is decreased in Cdh11-deficient tumors
The monocyte/macrophage population was dramatically reduced in KPC-Cdh11+/- mice compared to KPC-Cdh11+/+ mice (Two-proportion z-test; p<0.00001) (Figure 4C). To further analyze differences in monocyte and macrophage subpopulations between KPC-Cdh11+/+ and KPC-Cdh11+/-, all cells from the Mono-Mac cluster (cluster 1; Figure 4A) were extracted and re-analyzed using Seurat which resulted in five different groups with distinct transcriptional profiles (Figure 5A). Cluster 3 expressed monocyte markers such as Plac8 and Ly6c2 while all other clusters highly expressed tumor associated macrophage (TAM) marker Mrc1 and Trem2 (Figure 5B, S7A). However, these macrophage-like clusters had distinct gene expression profiles. Cluster 0 showed enrichment for Apoe and several cytokines including Ccl7, Ccl8 and Ccl12 whereas cluster 1 highly expressed markers of M2-like polarization including Arg1 and Chil3 (Figure 5C). Cluster 2 showed enrichment for Il1r2, Mmp12 and Dcstamp while cluster 4 expressed osteoclasts markers including Acp5, Ctsk and Mmp9 and likely represent osteoclast-like giant-cells (50). We also observed that monocytes and macrophages from KPC-Cdh11+/+ mice expressed higher levels of chemokines including Ccl2, Ccl4, Ccl6, Ccl7, Ccl8 and Osm compared to KPC-Cdh11+/- mice (Figure 5D). Increased expression of TAM marker Trem2 (51) was also observed in KPC-Cdh11+/+ mice (Figure 5D). Furthermore, IHC analysis showed that KPC-Cdh11+/+ mice had more F4/80 expressing TAMs than KPC-Cdh11+/- mice (Figure 5E, S7B-C).
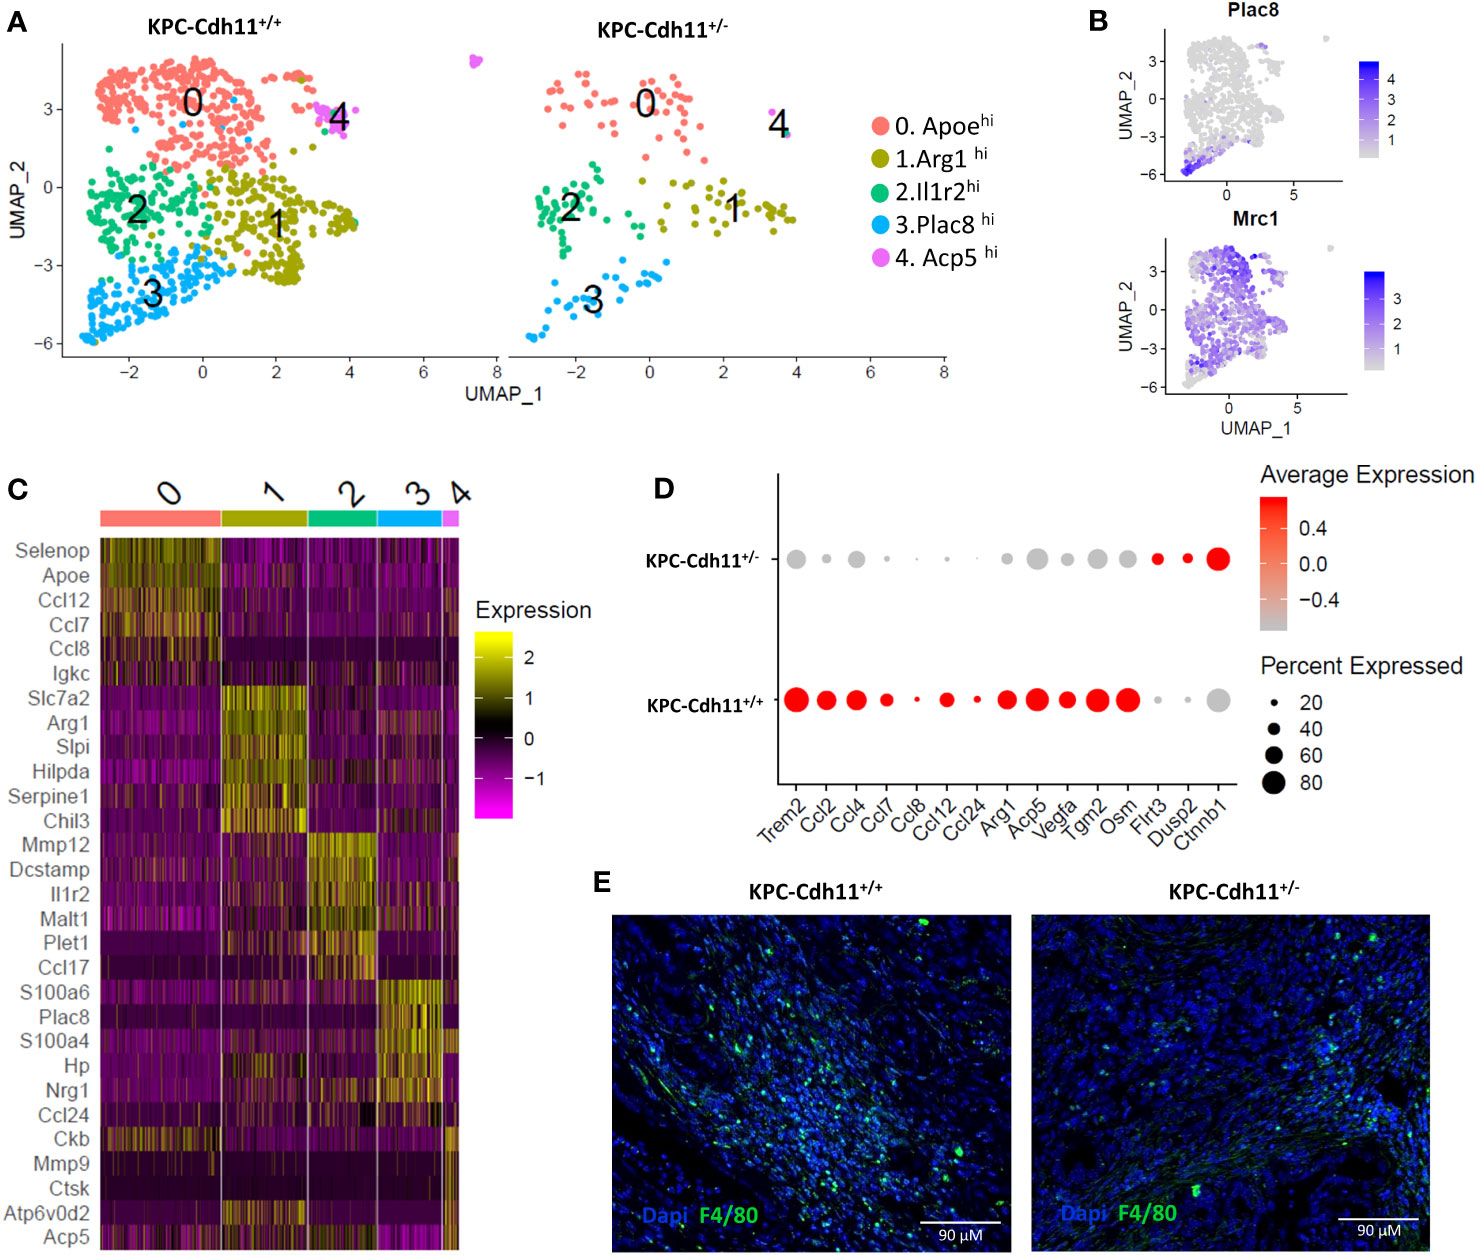
Figure 5 Monocytes and macrophages from pancreases of KPC-Cdh11+/- and KPC-Cdh11+/+ mice. (A) UMAP plot showing subtypes of Mono-Mac cells across mice of different Cdh11 status. (B) Feature plots denoting expression of Mrc1 and Plac8. (C) Heatmap showing expression of selected immune signaling molecules enriched in clusters 0-4. (D) Dot plot showing differential expression of cytokines and other selected genes in Mono-Macs from KPC-Cdh11+/- and KPC-Cdh11+/+ mice. (E) IHC showing F4/80 expressing macrophages in KPC-Cdh11+/- and KPC-Cdh11+/+ mice.
Neutrophils were another major immune cell type identified in the PDAC TME and the proportion of neutrophils was reduced in KPC-Cdh11+/- mice compared to KPC-Cdh11+/+ mice (Two-proportion z-test; p <0.01) (Figure 4C, 6A, S8A-B). Compared to other immune cell clusters, neutrophils showed significant enrichment for inflammatory genes Il1b, Tnf, Ptgs2, Cxcl2, Cxcl3, and Csf1, a cytokine involved in macrophage recruitment and differentiation (Figure 6B). Neutrophils also expressed additional cytokines and chemokines including oncostatin M (Osm), Ccl6 and Cxcl1 and proteases such as Cathepsin A (Ctsa), Ctsb, Ctsc and Ctsc, although Mono-Mac cluster had the highest expression values for these genes (Figure 6B). We observed that neutrophils from KPC-Cdh11+/- mice had lower levels of Csf1 compared to KPC-Cdh11+/+ mice, which may have contributed to decreased number of TAMs in these mice (Figure 6C). In addition, cytokines and chemokines including Osm, Cxcl2, Cxcl3, Ccl3, Ccl4, Ccl6 and Il1b were also downregulated in neutrophils from KPC-Cdh11+/- mice (Figure 6C). Cathepsins including Ctsa, Ctsb and Ctsd were also significantly downregulated in neutrophils from Cdh11-deficient mice (Figure 6D). In addition to Mono-Macs and neutrophils, proportion of DCs was also reduced in KPC-Cdh11+/- mice (Figure 4C). Consistent with these results, we found a strong positive correlation between CDH11 expression and neutrophil and myeloid DC infiltration in human PDAC (Rho > 65, P <0.0001; Figure S8C), suggesting that reduced CDH11 expression in PDAC may contribute to reduced myeloid infiltration to the TME.
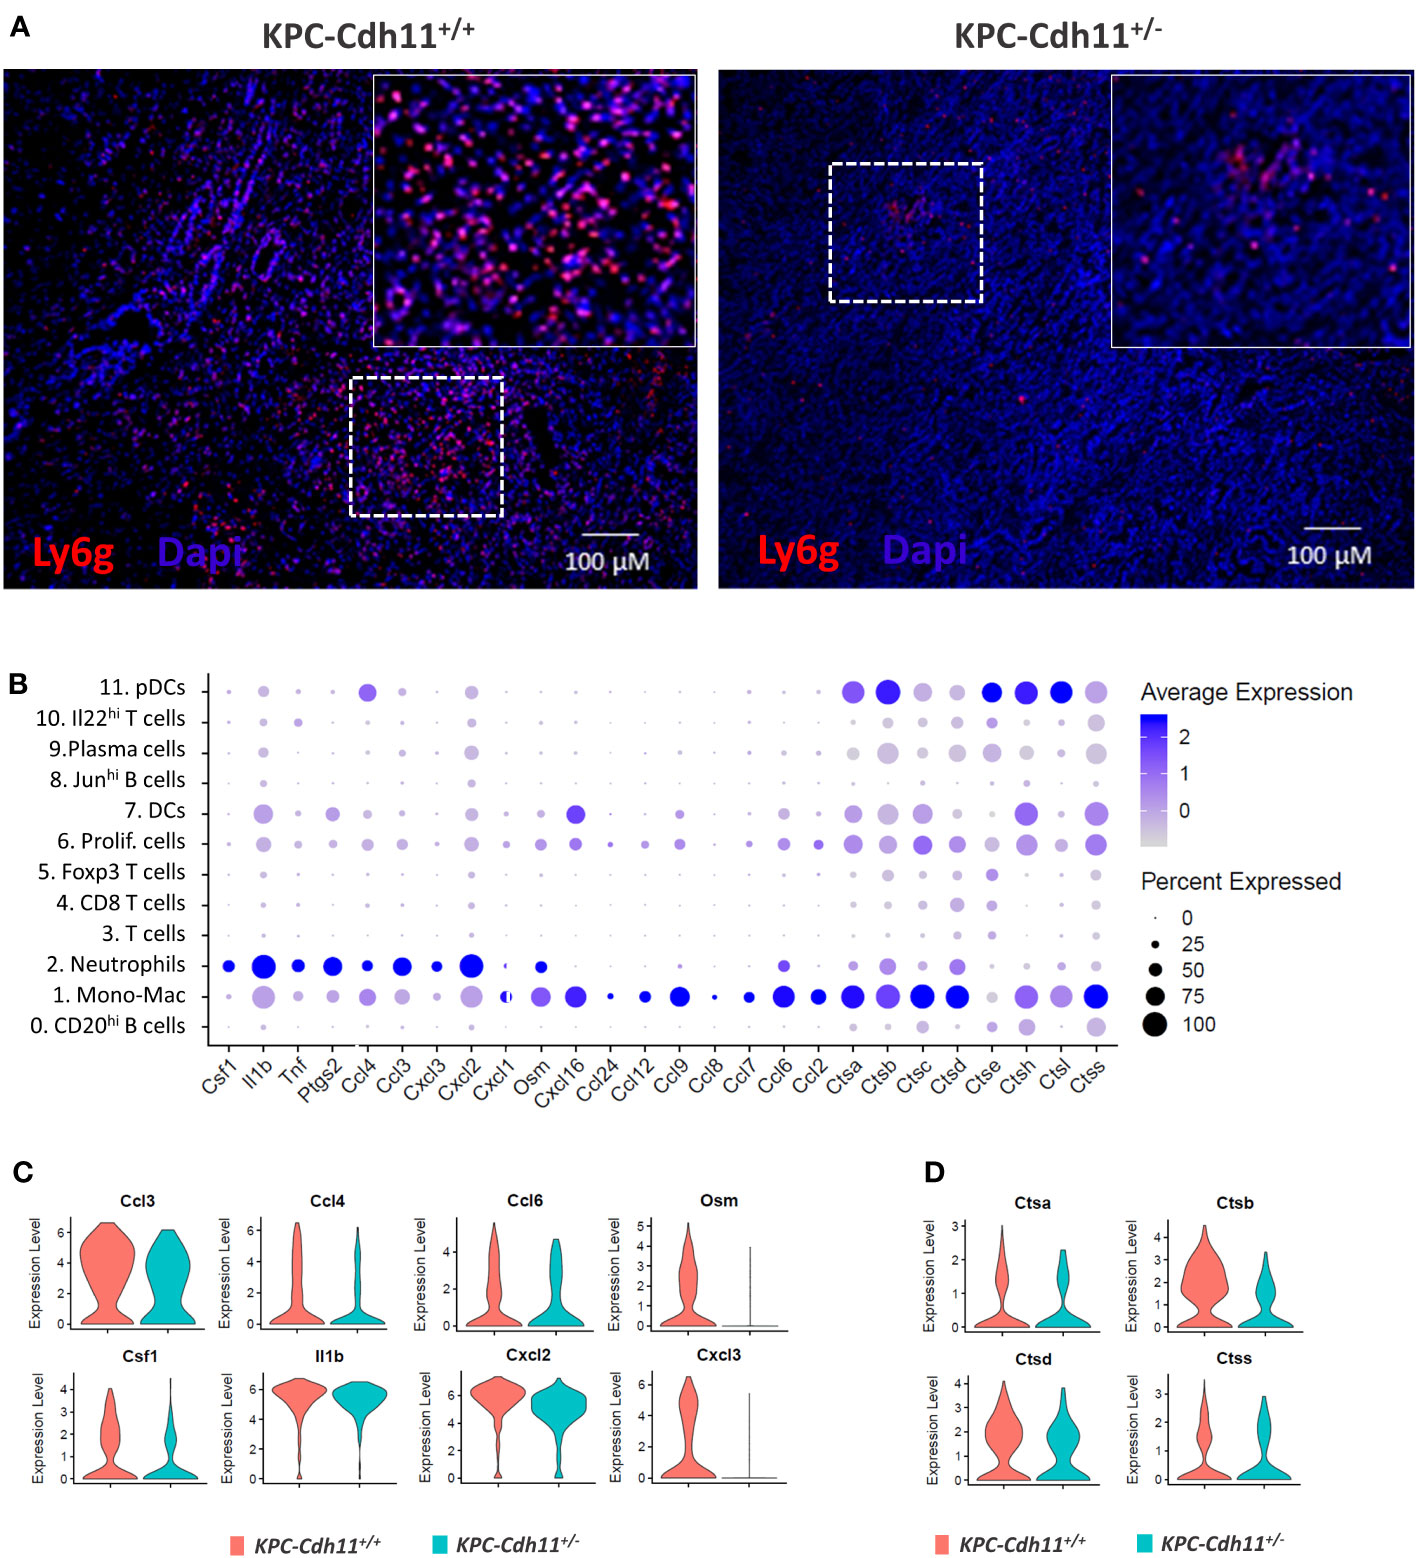
Figure 6 Neutrophils from pancreases of KPC-Cdh11+/- and KPC-Cdh11+/+ mice. (A) IHC analysis showing increased neutrophil infiltration in KPC-Cdh11+/+ mice. The dotted boxed area is shown on the right with higher magnification. (B) Dot plot showing cytokine expression in various immune cell clusters from both KPC-Cdh11+/- and KPC-Cdh11+/+ tumors. Dot size signifies the percentage of cells in each immune cluster that express a particular gene, while strength of color denotes average expression in that cluster. (C) Violin plots showing a subset of immune modulatory cytokine genes differentially expressed between neutrophils from KPC-Cdh11+/- and KPC-Cdh11+/+ mice. (D) Increased expression of cathepsins in neutrophils from KPC-Cdh11+/+ mice compared to KPC-Cdh11+/+ mice.
A survey of The Cancer Genome Atlas (TCGA) suggests that CDH11 expression is also elevated in many other cancers including breast cancer (BRCA), cholangiocarcinoma (CHOL), colon adenocarcinoma (COAD), esophageal carcinoma (ESCA), head and neck cancer (HNSC), stomach adenocarcinoma (STAD) and glioblastoma (GBM) (Figure S9). It has previously been suggested that increased CDH11 expression indicates a poor prognosis in advanced gastric cancer (52) and triple negative breast cancer (TNBC) (22). These findings suggest that Cdh11 plays a role in multiple cancer types and Cdh11 inhibition may promote survival in these cancers.
4 Discussion
Here we describe several key cellular and molecular changes in stromal and immune cell populations associated with the loss of Cdh11 in PDAC. Particularly, we show significant changes in CAFs in response to the Cdh11 deficiency. In both human and mouse PDAC, CDH11 was primarily expressed by CAFs. CAFs from KPC-Cdh11+/- mice had significantly lower expression of myofibroblast markers and several immune modulatory factors including Il6, Il11, Il33, Ccl11, Mdk and Ptn. Consistent with this, we observed a reduction in monocyte, macrophage, DC and neutrophil infiltration in these Cdh11-deficient tumors while the proportion of T cells increased. This suggests that Cdh11 deficiency in CAFs may alter the tumor’s immune profile.
While changes in infiltrating T cell populations have been previously observed as a result of Cdh11 deficiency (23), here we further highlight CD8+ T cells to be correlative with Cdh11 deficient tumors. These cytotoxic T cells may be directly responsible for the reduced tumor burden, and enhanced response to gemcitabine treatment and extended survival of KPC-Cdh11+/-mice relative to KPC- Cdh11+/+(23). Consistent with previously reported findings by Peran et al., we also observed a significant decrease in the expression of genes such as Foxp3, Il2rg, Il4ra, Ctla4 and Tnfrsf18 that play a role in differentiation, activation or function of Tregs (47–49, 53), in KPC-Cdh11+/- pancreases (Figure 4E).
MDSCs in tumors have been identified to block the recruitment of anti-tumor T/NK cells (54, 55). Reduction in myeloid cells (Figure 4C) associated with Cdh11 deficiency may have contributed to increased T cell infiltration and enhanced survival observed in these mice (23). Furthermore, several chemokines including Ccl2, Ccl4, Ccl6, Ccl8, Ccl9 and Osm were upregulated in monocyte/macrophages of KPC-Cdh11+/+ mice, suggesting possible candidates that can be therapeutically targeted to reduce the immunosuppressive nature and improve efficacy of existing therapeutics against PDAC. Inhibition of CCL2-CCR2 signaling has previously been shown to block the recruitment of inflammatory immune cells to the TME and inhibit cancer cell metastasis (56). Additionally, it has been suggested that CCL4 can promote tumor development and progression by recruiting regulatory T cells and pro-tumorigenic macrophages and acting on other stromal cells present in the tumor microenvironment, such as fibroblasts and endothelial cells, to facilitate their pro-tumorigenic abilities (57). Ccl7 and Ccl9 may also facilitate tumor progression and metastasis (58, 59). Cdh11 deficiency in the tumor microenvironment also altered the transcriptional profile of neutrophils. Neutrophils from Cdh11-deficient tumors had reduced expression of macrophage differentiation factor Csf1 as well as several cytokines including Ccl3, Ccl4, Ccl6, Il1b and Osm. Cdh11 deficiency in TME also contributed to downregulation of several cathepsins in monocyte/macrophages, neutrophils and DCs, many of which have already been shown to play a role in tumor progression and immune modulation (60). Future work aimed at therapeutically altering Cdh11 and these cytokines and proteases may provide insight into successful approaches for modulating the immunosuppressive nature of the pancreatic TME.
These findings suggest that Cdh11 deficiency in CAFs may alter the tumor immune microenvironment and contribute to an increased anti-tumor immune response. Our studies utilized mice that lack Cdh11 since birth and therefore it is unknown if the lack of Cdh11 from birth fundamentally changes fibroblast or any other Cdh11-expressing cells, priming an anti-tumor microenvironment. Further studies utilizing conditional knockouts and Cdh11 inhibition post-tumor formation will be required to confirm the role of CAF-derived Cdh11 in altering the tumor immune microenvironment.
We also observed low Cdh11 expression in cancer cells undergoing EMT in both mice and human PDAC. Cdh11 has previously been shown to be associated with EMT in cancer (61) and antibody targeting of CDH11 inhibited EMT and suppressed metastasis in breast cancer (62). Interestingly, KPC-Cdh11+/+ mice had significantly more EMT cells than KPC-Cdh11+/- mice. The reduced presence of EMT cells in Cdh11-deficient mice may have also contributed to the enhanced survival observed in these mice (23). In addition to PDAC, increased Cdh11 expression was observed in many other cancers including breast cancer, stomach and colon cancer. These findings suggest that targeting Cdh11 with small molecule inhibitors or function-blocking antibodies may be an effective strategy in treating aggressive tumors including PDACs.
Cdh11 transcripts have been previously found in the peripheral blood as indicators of severe disease as in rheumatoid arthritis (63). The increased presence of CDH11 in the peripheral blood of cancer patients may be indicative of an advanced disease state. The set of immune cell signatures identified in Cdh11-deficient mice may represent hallmarks of positive disease prognosis in pancreatic cancer, and maybe other solid tumors such as breast, head and neck and colorectal cancers. Targeting these specific immune cell subtypes or genes differentially expressed in these immune subpopulations as a result of Cdh11 deficiency may be an effective therapeutic strategy to treat Cdh11-expressing cancers and fibrotic disease.
Data availability statement
The datasets presented in this study can be found in online repositories. The names of the repository/repositories and accession number(s) can be found below: https://datadryad.org/stash, doi:10.5061/dryad.gxd2547s0.
Ethics statement
The animal study was approved by Lawrence Livermore National Laboratory and GU IACUC. The study was conducted in accordance with the local legislation and institutional requirements.
Author contributions
AS: Conceptualization, Data curation, Formal Analysis, Funding acquisition, Investigation, Methodology, Project administration, Supervision, Visualization, Writing – original draft, Writing – review and editing. KAM: Data curation, Formal Analysis, Funding acquisition, Investigation, Methodology, Validation, Visualization, Writing – review and editing. IP: Data curation, Formal Analysis, Investigation, Methodology, Resources, Validation, Visualization, Writing – review and editing. NRH: Investigation, Methodology, Writing – review and editing, Writing – original draft. NFL: Methodology, Validation, Visualization, Writing – review and editing. BA: Methodology, Validation, Visualization, Writing – review and editing. SPW: Data curation, Formal Analysis, Methodology, Validation, Visualization, Writing – review and editing. MAC: Funding acquisition, Project administration, Resources, Supervision, Writing – review and editing. EKW: Funding acquisition, Project administration, Supervision, Writing – review and editing. SWB: Conceptualization, Funding acquisition, Methodology, Project administration, Resources, Supervision, Writing – review and editing. GGL: Conceptualization, Funding acquisition, Project administration, Resources, Supervision, Visualization, Writing – review and editing.
Funding
The author(s) declare financial support was received for the research, authorship, and/or publication of this article. The research was supported by LLNL internal grants LLNL-LDRD- 22-LW-061 and LDRD-18-SI-003. GL was also supported in part by a UC Davis Comprehensive Cancer Center Support Grant (CCCSG) awarded by the National Cancer Institute (NCI P30CA093373). This study was also supported by 2017 AACR-AstraZeneca Fellowship in Immuno-oncology Research, grant number 17-40-12-PERA (to IP); The Ruesch Center for the Cure of Gastrointestinal Cancers grant award in 2016 (to IP) and 2017 (to IP and SWB). The funders were not involved in the study design, collection, analysis, interpretation of data, the writing of this article or the decision to submit it for publication.
Acknowledgments
This work was performed under the auspices of the U.S. Department of Energy by Lawrence Livermore National Laboratory under Contract DE-AC52-07NA27344. IM Release Number: LLNL-JRNL-823440.
Conflict of interest
The authors declare that the research was conducted in the absence of any commercial or financial relationships that could be construed as a potential conflict of interest.
Publisher’s note
All claims expressed in this article are solely those of the authors and do not necessarily represent those of their affiliated organizations, or those of the publisher, the editors and the reviewers. Any product that may be evaluated in this article, or claim that may be made by its manufacturer, is not guaranteed or endorsed by the publisher.
Supplementary material
The Supplementary Material for this article can be found online at: https://www.frontiersin.org/articles/10.3389/fonc.2023.1286861/full#supplementary-material
References
1. Siegel RL, Miller KD, Fuchs HE, Jemal A. Cancer statistics 2021. CA Cancer J Clin (2021) 71:7–33. doi: 10.3322/caac.21654
2. Singhi AD, Koay EJ, Chari ST, Maitra A. Early detection of pancreatic cancer: opportunities and challenges. Gastroenterology (2019) 156:2024–40. doi: 10.1053/j.gastro.2019.01.259
3. Raufi AG, Manji GA, Chabot JA, Bates SE. Neoadjuvant treatment for pancreatic cancer. Semin Oncol (2019) 46:19–27. doi: 10.1053/j.seminoncol.2018.12.002
4. Dumauthioz N, Labiano S, Romero P. Tumor resident memory T cells: new players in immune surveillance and therapy. Front Immunol (2018) 9:2076. doi: 10.3389/fimmu.2018.02076
5. Park SY, Kim IS. Harnessing immune checkpoints in myeloid lineage cells for cancer immunotherapy. Cancer Lett (2019) 452:51–8. doi: 10.1016/j.canlet.2019.03.018
6. Kalyan S, Kabelitz D. When neutrophils meet T cells: beginnings of a tumultuous relationship with underappreciated potential. Eur J Immunol (2014) 44:627–33. doi: 10.1002/eji.201344195
7. Mensurado S, Rei M, Lanca T, Ioannou M, Goncalves-Sousa N, Kubo H, et al. Tumor-associated neutrophils suppress pro-tumoral IL-17+ gammadelta T cells through induction of oxidative stress. PloS Biol (2018) 16:e2004990. doi: 10.1371/journal.pbio.2004990
8. Alibashe-Ahmed M, Roger T, Serre-Beinier V, Berishvili E, Reith W, Bosco D, et al. Macrophage migration inhibitory factor regulates TLR4 expression and modulates TCR/CD3-mediated activation in CD4+ T lymphocytes. Sci Rep (2019) 9:9380. doi: 10.1038/s41598-019-45260-6
9. Oberg HH, Wesch D, Kalyan S, Kabelitz D. Regulatory interactions between neutrophils, tumor cells and T cells. Front Immunol (2019) 10:1690. doi: 10.3389/fimmu.2019.01690
10. Delvecchio FR, Goulart MR, Fincham REA, Bombadieri M, Kocher HM. B cells in pancreatic cancer stroma. World J Gastroenterol (2022) 28:1088–101. doi: 10.3748/wjg.v28.i11.1088
11. Bonaventura P, Shekarian T, Alcazer V, Valladeau-Guilemond J, Valsesia-Wittmann S, Amigorena S, et al. Cold tumors: A therapeutic challenge for immunotherapy. Front Immunol (2019) 10:168. doi: 10.3389/fimmu.2019.00168
12. Orhan A, Vogelsang RP, Andersen MB, Madsen MT, Holmich ER, Raskov H, et al. The prognostic value of tumour-infiltrating lymphocytes in pancreatic cancer: a systematic review and meta-analysis. Eur J Cancer (2020) 132:71–84. doi: 10.1016/j.ejca.2020.03.013
13. Song Y, Yan S, Fan W, Zhang M, Liu W, Lu H, et al. Identification and validation of the immune subtypes of lung adenocarcinoma: implications for immunotherapy. Front Cell Dev Biol (2020) 8:550. doi: 10.3389/fcell.2020.00550
14. Lu C, Rong D, Zhang B, Zheng W, Wang X, Chen Z, et al. Current perspectives on the immunosuppressive tumor microenvironment in hepatocellular carcinoma: challenges and opportunities. Mol Cancer (2019) 18:130. doi: 10.1186/s12943-019-1047-6
15. Haist M, Stege H, Grabbe S, Bros M. The functional crosstalk between myeloid-derived suppressor cells and regulatory T cells within the immunosuppressive tumor microenvironment. Cancers (Basel) (2021) 13(2):210. doi: 10.3390/cancers13020210
16. Monteran L, Erez N. The dark side of fibroblasts: cancer-associated fibroblasts as mediators of immunosuppression in the tumor microenvironment. Front Immunol (2019) 10:1835. doi: 10.3389/fimmu.2019.01835
17. Cirri P, Chiarugi P. Cancer associated fibroblasts: the dark side of the coin. Am J Cancer Res (2011) 1:482–97.
18. Weber CE, Kuo PC. The tumor microenvironment. Surg Oncol (2012) 21:172–7. doi: 10.1016/j.suronc.2011.09.001
19. Marie PJ, Hay E, Modrowski D, Revollo L, Mbalaviele G, Civitelli R. Cadherin-mediated cell-cell adhesion and signaling in the skeleton. Calcif Tissue Int (2014) 94:46–54. doi: 10.1007/s00223-013-9733-7
20. Chen X, Xiang H, Yu S, Lu Y, Wu T. Research progress in the role and mechanism of Cadherin-11 in different diseases. J Cancer (2021) 12:1190–9. doi: 10.7150/jca.52720
21. Koehler A, Schlupf J, Schneider M, Kraft B, Winter C, Kashef J. Loss of Xenopus cadherin-11 leads to increased Wnt/beta-catenin signaling and up-regulation of target genes c-myc and cyclin D1 in neural crest. Dev Biol (2013) 383:132–45. doi: 10.1016/j.ydbio.2013.08.007
22. Satriyo PB, Bamodu OA, Chen JH, Aryandono T, Haryana SM, Yeh CT, et al. Cadherin 11 inhibition downregulates beta-catenin, deactivates the canonical WNT signalling pathway and suppresses the cancer stem cell-like phenotype of triple negative breast cancer. J Clin Med (2019) 8(2):148. doi: 10.3390/jcm8020148
23. Peran I, Dakshanamurthy S, Mccoy MD, Mavropoulos A, Allo B, Sebastian A, et al. Cadherin 11 promotes immunosuppression and extracellular matrix deposition to support growth of pancreatic tumors and resistance to gemcitabine in mice. Gastroenterology (2021) 160:1359–1372 e1313. doi: 10.1053/j.gastro.2020.11.044
24. Ariston Gabriel AN, Jiao Q, Yvette U, Yang X, Al-Ameri SA, Du L, et al. Differences between KC and KPC pancreatic ductal adenocarcinoma mice models, in terms of their modeling biology and their clinical relevance. Pancreatology (2020) 20:79–88. doi: 10.1016/j.pan.2019.11.006
25. Horikawa K, Radice G, Takeichi M, Chisaka O. Adhesive subdivisions intrinsic to the epithelial somites. Dev Biol (1999) 215:182–9. doi: 10.1006/dbio.1999.9463
26. Sebastian A, Hum NR, Martin KA, Gilmore SF, Peran I, Byers SW, et al. Single-cell transcriptomic analysis of tumor-derived fibroblasts and normal tissue-resident fibroblasts reveals fibroblast heterogeneity in breast cancer. Cancers (Basel) (2020) 12(5):1307. doi: 10.3390/cancers12051307
27. Stuart T, Butler A, Hoffman P, Hafemeister C, Papalexi E, Mauck WM, et al. Comprehensive integration of single-cell data. Cell (2019) 177:1888–1902 e1821. doi: 10.1016/j.cell.2019.05.031
28. Werba G, Weissinger D, Kawaler EA, Zhao E, Kalfakakou D, Dhara S, et al. Single-cell RNA sequencing reveals the effects of chemotherapy on human pancreatic adenocarcinoma and its tumor microenvironment. Nat Commun (2023) 14:797. doi: 10.1038/s41467-023-36296-4
29. Hao Y, Hao S, Andersen-Nissen E, Mauck WM, 3rd, Zheng S, Butler A, et al. Integrated analysis of multimodal single-cell data. Cell (2021) 184:3573–3587 e3529. doi: 10.1016/j.cell.2021.04.048
30. Petri A, Ahnfelt-Ronne J, Frederiksen KS, Edwards DG, Madsen D, Serup P, et al. The effect of neurogenin3 deficiency on pancreatic gene expression in embryonic mice. J Mol Endocrinol (2006) 37:301–16. doi: 10.1677/jme.1.02096
31. Ruppert AL, Keshavarz M, Winterberg S, Oberwinkler J, Kummer W, Schutz B. Advillin is a tuft cell marker in the mouse alimentary tract. J Mol Histol (2020) 51:421–35. doi: 10.1007/s10735-020-09893-6
32. Yeoh WJ, Vu VP, Krebs P. IL-33 biology in cancer: An update and future perspectives. Cytokine (2022) 157:155961. doi: 10.1016/j.cyto.2022.155961
33. Ernst M, Putoczki TL. Molecular pathways: IL11 as a tumor-promoting cytokine-translational implications for cancers. Clin Cancer Res (2014) 20:5579–88. doi: 10.1158/1078-0432.CCR-13-2492
34. Mazur PK, Sage J. Pancreatic cancer takes its Toll. J Exp Med (2015) 212:1988. doi: 10.1084/jem.21212insight1
35. Filippou PS, Karagiannis GS, Constantinidou A. Midkine (MDK) growth factor: a key player in cancer progression and a promising therapeutic target. Oncogene (2020) 39:2040–54. doi: 10.1038/s41388-019-1124-8
36. Wang R, Huang K. CCL11 increases the proportion of CD4+CD25+Foxp3+ Treg cells and the production of IL−2 and TGF−beta by CD4+ T cells via the STAT5 signaling pathway. Mol Med Rep (2020) 21:2522–32. doi: 10.3892/mmr.2020.11049
37. Bent EH, Millan-Barea LR, Zhuang I, Goulet DR, Frose J, Hemann MT. Microenvironmental IL-6 inhibits anti-cancer immune responses generated by cytotoxic chemotherapy. Nat Commun (2021) 12:6218. doi: 10.1038/s41467-021-26407-4
38. Ganguly D, Schmidt MO, Coleman M, Ngo TC, Sorrelle N, Dominguez ATA, et al. Pleiotrophin drives a prometastatic immune niche in breast cancer. J Exp Med (2023) 220(5):e20220610. doi: 10.1084/jem.20220610
39. Thomas D, Radhakrishnan P. Role of tumor and stroma-derived IGF/IGFBPs in pancreatic cancer. Cancers (Basel) (2020) 12(5):1228. doi: 10.3390/cancers12051228
40. Davis RE, Ngo VN, Lenz G, Tolar P, Young RM, Romesser PB, et al. Chronic active B-cell-receptor signalling in diffuse large B-cell lymphoma. Nature (2010) 463:88–92. doi: 10.1038/nature08638
41. Tran MTN, Hamada M, Jeon H, Shiraishi R, Asano K, Hattori M, et al. MafB is a critical regulator of complement component C1q. Nat Commun (2017) 8:1700. doi: 10.1038/s41467-017-01711-0
42. Wang Q, Li P, Wu W. A systematic analysis of immune genes and overall survival in cancer patients. BMC Cancer (2019) 19:1225. doi: 10.1186/s12885-019-6414-6
43. Andreani V, Ramamoorthy S, Pandey A, Lupar E, Nutt SL, Lammermann T, et al. Cochaperone Mzb1 is a key effector of Blimp1 in plasma cell differentiation and beta1-integrin function. Proc Natl Acad Sci U.S.A. (2018) 115:E9630–9. doi: 10.1073/pnas.1809739115
44. Miyagawa-Hayashino A, Yoshifuji H, Kitagori K, Ito S, Oku T, Hirayama Y, et al. Increase of MZB1 in B cells in systemic lupus erythematosus: proteomic analysis of biopsied lymph nodes. Arthritis Res Ther (2018) 20:13. doi: 10.1186/s13075-018-1511-5
45. Da Silva F, Pascoal LB, Dotti I, Setsuko Ayrizono ML, Aguilar D, Rodrigues BL, et al. Whole transcriptional analysis identifies markers of B, T and plasma cell signaling pathways in the mesenteric adipose tissue associated with Crohn's disease. J Transl Med (2020) 18:44. doi: 10.1186/s12967-020-02220-3
46. Xu AQ, Barbosa RR, Calado DP. Genetic timestamping of plasma cells in vivo reveals tissue-specific homeostatic population turnover. Elife (2020) 9:e59850. doi: 10.7554/eLife.59850
47. Fontenot JD, Rasmussen JP, Gavin MA, Rudensky AY. A function for interleukin 2 in Foxp3-expressing regulatory T cells. Nat Immunol (2005) 6:1142–51. doi: 10.1038/ni1263
48. Ronchetti S, Ricci E, Petrillo MG, Cari L, Migliorati G, Nocentini G, et al. Glucocorticoid-induced tumour necrosis factor receptor-related protein: a key marker of functional regulatory T cells. J Immunol Res (2015) 2015:171520. doi: 10.1155/2015/171520
49. Schmaler M, Broggi MA, Lagarde N, Stocklin BF, King CG, Finke D, et al. IL-7R signaling in regulatory T cells maintains peripheral and allograft tolerance in mice. Proc Natl Acad Sci U.S.A. (2015) 112:13330–5. doi: 10.1073/pnas.1510045112
50. Wang X, Miao J, Wang S, Shen R, Zhang S, Tian Y, et al. Single-cell RNA-seq reveals the genesis and heterogeneity of tumor microenvironment in pancreatic undifferentiated carcinoma with osteoclast-like giant-cells. Mol Cancer (2022) 21:133. doi: 10.1186/s12943-022-01596-8
51. Nakamura K, Smyth MJ. TREM2 marks tumor-associated macrophages. Signal Transduct Target Ther (2020) 5:233. doi: 10.1038/s41392-020-00356-8
52. Wang Q, Jia Y, Peng X, Li C. Clinical and prognostic association of oncogene cadherin 11 in gastric cancer. Oncol Lett (2020) 19:4011–23. doi: 10.3892/ol.2020.11531
53. Kim GR, Kim WJ, Lim S, Lee HG, Koo JH, Nam KH, et al. In vivo induction of regulatory T cells via CTLA-4 signaling peptide to control autoimmune encephalomyelitis and prevent disease relapse. Adv Sci (Weinh) (2021) 8:2004973. doi: 10.1002/advs.202004973
54. Fleming V, Hu X, Weber R, Nagibin V, Groth C, Altevogt P, et al. Targeting myeloid-derived suppressor cells to bypass tumor-induced immunosuppression. Front Immunol (2018) 9:398. doi: 10.3389/fimmu.2018.00398
55. Vonderheide RH, Bear AS. Tumor-derived myeloid cell chemoattractants and T cell exclusion in pancreatic cancer. Front Immunol (2020) 11:605619. doi: 10.3389/fimmu.2020.605619
56. Hao Q, Vadgama JV, Wang P. CCL2/CCR2 signaling in cancer pathogenesis. Cell Commun Signal (2020) 18:82. doi: 10.1186/s12964-020-00589-8
57. Mukaida N, Sasaki SI, Baba T. CCL4 signaling in the tumor microenvironment. Adv Exp Med Biol (2020) 1231:23–32. doi: 10.1007/978-3-030-36667-4_3
58. Yan HH, Jiang J, Pang Y, Achyut BR, Lizardo M, Liang X, et al. CCL9 induced by TGFbeta signaling in myeloid cells enhances tumor cell survival in the premetastatic organ. Cancer Res (2015) 75:5283–98. doi: 10.1158/0008-5472.CAN-15-2282-T
59. Liu Y, Cai Y, Liu L, Wu Y, Xiong X. Crucial biological functions of CCL7 in cancer. PeerJ (2018) 6:e4928. doi: 10.7717/peerj.4928
60. Jakos T, Pislar A, Jewett A, Kos J. Cysteine cathepsins in tumor-associated immune cells. Front Immunol (2019) 10:2037. doi: 10.3389/fimmu.2019.02037
61. Feng Z, Li X, Ren Z, Feng J, He X, You C. Prognostic and predictive value of cadherin 11 for patients with gastric cancer and its correlation with tumor microenvironment: results from microarray analysis. BioMed Res Int (2020) 2020:8107478. doi: 10.1155/2020/8107478
62. Chen JH, Huang WC, Bamodu OA, Chang PM, Chao TY, Huang TH. Monospecific antibody targeting of CDH11 inhibits epithelial-to-mesenchymal transition and represses cancer stem cell-like phenotype by up-regulating miR-335 in metastatic breast cancer, in vitro and in vivo. BMC Cancer (2019) 19:634. doi: 10.1186/s12885-019-5811-1
Keywords: PDAC, CDH11, CAF, IL33, MDSC, T cells
Citation: Sebastian A, Martin KA, Peran I, Hum NR, Leon NF, Amiri B, Wilson SP, Coleman MA, Wheeler EK, Byers SW and Loots GG (2023) Loss of Cadherin-11 in pancreatic ductal adenocarcinoma alters tumor-immune microenvironment. Front. Oncol. 13:1286861. doi: 10.3389/fonc.2023.1286861
Received: 31 August 2023; Accepted: 12 October 2023;
Published: 26 October 2023.
Edited by:
Lubor Borsig, University of Zurich, SwitzerlandReviewed by:
Marko Roblek, Medical University of Vienna, AustriaStefano Ugel, University of Verona, Italy
Copyright © 2023 Sebastian, Martin, Peran, Hum, Leon, Amiri, Wilson, Coleman, Wheeler, Byers and Loots. This is an open-access article distributed under the terms of the Creative Commons Attribution License (CC BY). The use, distribution or reproduction in other forums is permitted, provided the original author(s) and the copyright owner(s) are credited and that the original publication in this journal is cited, in accordance with accepted academic practice. No use, distribution or reproduction is permitted which does not comply with these terms.
*Correspondence: Aimy Sebastian, c2ViYXN0aWFuNEBsbG5sLmdvdg==; Gabriela G. Loots, Z2xvb3RzQHVjZGF2aXMuZWR1
†These authors have contributed equally to this work