 Hongyan Hu1*†
 Jing Yang2†Jin Miao1†Chen Li3Cao Wang4Fengming Ran1Jie Zou1Yi Zhang5
 Liufang Zhao6Wentao Zhao7
 Conghui Ai8*
- 1Department of Pathology, Yunnan Cancer Hospital, The Third Affiliated Hospital of Kunming Medical University, Peking University Cancer Hospital Yunnan, Kunming, China
- 2Department of Oncology, First People’s Hospital of Kunming, Kunming, China
- 3Scientific Research Department, Yunnan Cancer Hospital, The Third Affiliated Hospital of Kunming Medical University, Peking University Cancer Hospital Yunnan, Kunming, China
- 4Department of Orthopedics, Yunnan Cancer Hospital, The Third Affiliated Hospital of Kunming Medical University, Peking University Cancer Hospital Yunnan, Kunming, China
- 5Department of Gynecology, Yunnan Cancer Hospital, The Third Affiliated Hospital of Kunming Medical University, Peking University Cancer Hospital Yunnan, Kunming, China
- 6Department of Head and Neck Cancer, Yunnan Cancer Hospital, The Third Affiliated Hospital of Kunming Medical University, Peking University Cancer Hospital Yunnan, Kunming, China
- 7Department of Gastrointestinal Oncology, Yunnan Cancer Hospital, The Third Affiliated Hospital of Kunming Medical University, Peking University Cancer Hospital Yunnan, Kunming, China
- 8Department of Radiology, Yunnan Cancer Hospital, The Third Affiliated Hospital of Kunming Medical University, Peking University Cancer Hospital Yunnan, Kunming, China
Introduction: Melanoma exhibited a poor prognosis due to its aggression and heterogeneity. The effect of glutamate metabolism promoting tumor progression on cutaneous melanoma remains unknown. Herein, glutamine metabolism-related genes (GRGs) were identified followed by constructing a prognostic model for melanoma via bioinformatics analysis.
Methods: Patient data were collected from ,Gene Expression Omnibus (GEO) and The Cancer Genome Atlas—Skin Cutaneous Melanoma (TCGA-SKCM). In addition, GRGs were extracted from the MSigDB database, and the R package "Seurat" was used for scRNA-seq data processing.
Results: eight key genes (CHMP4A, IFFO1, ANKRD10, ZDHHC11, CLPB, ANKMY1, TCAP and POLG2) were identified to construct a risk model. Based on univariate and multivariate Cox regression analyses, clinical characteristics including Clark stage and ulcer status were identified as independent prognostic factors, and a nomogram was successfully constructed. Survival analysis demonstrated that the overall survival rates of the high-risk group were lower than those of the low-risk group. The gene set enrichment analysis (GSEA) results showed that only ANKRD10, ANKMY1 and TCAP were enriched in the “glycolysis gluconeogenesis” pathway. The high-risk and low-risk groups displayed significant differences in immune cell infiltration and immune checkpoint expression. Analysis on drug sensitivity revealed that the high-risk group was highly sensitive to rapamycin. Additionally, it was verified that IFFO1, ANKRD10 and POLG2 were markedly upregulated and CHMP4A was also markedly downregulated in A375 cells by RT-PCR, which was consistent with the partial results of biological analysis.
Discussion: Overall, it would provide valuable information about the GRGs of prognosis and immune status in melanoma.
1 Introduction
Melanoma has high malignancy and propensity for metastasis, triggering widespread interest (1). There is an increasing incidence of melanoma in teenagers and middle-aged people. Only 14% of cutaneous melanoma (CM) patients with metastasis reach survival beyond 5 years (2). Standard chemotherapy is largely ineffective against advanced or metastatic melanoma (3). In recent years, targeted immunotherapy has shown significant efficacy in advanced melanoma patients, but the 5-year survival rate of the patients still remains low (4), and tumor heterogeneity and drug resistance are the primary causes (5). Therefore, it is necessary to comprehensively study the mechanisms of tumorigenesis so as to explore new potential molecular biomarkers, which could be crucial for early diagnosis, targeted treatment, and prognosis assessment of melanoma patients.
Glutamine (Gln), as the most abundant non-essential amino acid, plays a pivotal role in energy metabolism. As a key source of carbon and nitrogen, it promotes tumor cell biosynthesis, energy production, and cellular homeostasis (6, 7). Gln metabolism, as an alternative source, can promote the tricarboxylic acid cycle in cancer cells and facilitate fatty acid synthesis through reductive carboxylation (8). The proliferation of cancer cells is addicted to Gln metabolism. Cancer cells cannot survive due to the absence of exogenous Gln (9). Thus, Gln metabolism can be a target for anticancer therapy (10, 11). The inhibition of Gln metabolism can enhance the antitumor effect of anti-PD-1 and the cytotoxic function of effector T cells (12, 13). One study has indicated a correlation between Gln and glycolysis in melanoma, highlighting the regulatory role of Gln metabolism in melanoma progression (14). Therefore, the genes related to Gln metabolism should be further investigated to predict treatment efficacy and clinical prognosis.
Thus, melanoma-related data from public databases were used to identify prognostic genes associated with Gln in melanoma patients via bioinformatics methods. A prognostic model was constructed to analyze the biological pathways associated with these prognostic genes. The relationships among clinical characteristics, the immune microenvironment, and drug sensitivity were established. This study focused on developing novel immunotherapy, targeted therapy strategies, and valuable prognosis of melanoma.
2 Materials and methods
2.1 Data sources
The Cancer Genome Atlas (TCGA) skin cutaneous melanoma (SKCM) dataset, which included 98 primary and 356 metastatic melanoma samples with survival information, was retrieved from UCSC Xena (https://xenabrowser.net/datapages/). The GSE46517 (GPL96) dataset, which contained 31 samples of primary melanoma, 73 samples of metastatic melanoma, and seven control samples, was mined from the Gene Expression Omnibus (GEO) database (https://www.ncbi.nlm.nih.gov/geo/). TCGA-SKCM and GSE46517 datasets were used as training sets 1 and 2, respectively. The validation set GSE65904 (GPL10558), which contained survival information of 210 melanoma tumor samples, and the single-cell dataset GSE72056 (GPL18573), which contained gene expression data for 4,645 quality-controlled (QC) cells, were obtained from the GEO database. Gln metabolism-related genes (GRGs) were mined from the Molecular Signatures Database (MSigDB) (https://www.gsea-msigdb).
2.2 Identification of differentially expressed genes and gene enrichment analysis
The differentially expressed genes (DEGs) between the melanoma and control groups in training set 2 were selected using the R language limma package (v 3.52.4) (15), with adj. p < 0.05 and |log2FC| ≥ 0.5. Moreover, the enrichment analysis of Gene Ontology (GO) [including cellular component (CC), molecular function (MF), and biological process (BP) analyses] and Kyoto Encyclopedia of Genes and Genomes (KEGG) enrichment analyses of the DEGs were completed using the clusterProfiler package (v 4.4.4) (16). The single-sample gene set enrichment analysis (ssGSEA) algorithm of the GSVA package (v 1.44.5) (17) was applied to compute the Gln metabolism score (GMS) in all samples of training set 1, with GRGs serving as the background gene set. Then, all genes of training set 1 were assigned to modules utilizing weighted gene coexpression network analysis (WGCNA) (v 1.71) (18). Modules relevant to GMS (p < 0.05) were confirmed as key modules, and key module genes were utilized for subsequent analyses.
2.3 Single-cell sequencing data analysis
Data from the single-cell dataset were integrated using the Seurat package for R (v 4.3.0) (19), with QC for the number of genes contained in the cells >1,700, housekeeping expression (corrected) >3, and all genes expressed >2% in at least five cells. The vst method was selected to screen the top 2,000 highly variable genes for downstream analysis. Subsequently, Uniform Manifold Approximation and Projection (UMAP) was utilized to reduce the dimensions. Using GRGs as the background gene set, the RcentageFeatureSet was utilized to calculate the percentage of GRG expression levels in each cell, and all cells were categorized into high- and low-expression groups to select intercellular differentially expressed GRGs (DE-GRGs) according to the median percentages.
2.4 Screening and analysis of candidate genes
Overlapping DEGs and key module genes were obtained from intersecting genes. Based on the intersecting genes, a protein–protein interaction (PPI) network was constructed. Then, the correlations between the intersecting genes and the DE-GRGs were computed according to Pearson’s correlation in training set 2, and the genes with |r| > 0.3, at least one differential GRG, and p < 0.05 were retained as candidate genes.
2.5 Construction and validation of the risk model
Based on the candidate genes via the glmnet package (v 4.1-4), key genes were selected via univariate Cox regression and least absolute shrinkage and selection operator (LASSO) regression analyses. Then, according to the correlation between expression of key genes and overall survival (OS), a risk model was constructed via LASSO (19). Risk scores were assessed utilizing the following formula:
where coef and X indicate coefficients and gene expression, respectively. Moreover, the samples of training set 1 and the validation set were sorted into the high- and low-risk groups based on the median risk score. The Kaplan–Meier (K–M) survival curves were drawn using the survival package (v 3.4-0) for both risk groups in training set 1 and the validation set (20). To further assure the validity of the risk model, receiver operating characteristic (ROC) curves were generated at 3, 5, and 7 years, and the area under the curve (AUC) values were computed using survivalROC (v 0.4) (21).
2.6 Independent prognostic analysis and correlation analysis of clinical characteristics
Risk scores and seven clinical characteristics (age, sex, Clark stage, metastasis status, Breslow status, and ulcer status) were entered into the risk model for univariate and multivariate Cox regression analyses. Then, independent prognostic factors were selected to construct a nomogram via rms (v 6.3-0) (22). The 3-, 5-, and 7-year survival rates were predicted depending on the total points (the higher the points, the lower the survival rate). The predictive ability of the nomogram was assessed using calibration curves. Correlations between the risk score and eight clinical characteristics were analyzed via correlation analysis.
2.7 GSEA
To understand prognostic gene-related biological functions and signaling pathways, the correlations between prognostic genes and other genes were calculated and sequenced separately in training set 1. Based on the C2:KEGG gene set downloaded from the msigdbr package in R (v 7.5.1), the sequenced genes were enriched using the GSEA function in R (adj. p < 0.05).
2.8 Immune microenvironment analysis and regulatory networks for prognostic genes
The immune-related genes identified in the literature were used as background gene sets (23), and the samples in the training set were analyzed using ssGSEA to obtain enrichment scores for 28 immune cell types. Differences in enrichment scores for each immune cell between the melanoma and control groups were analyzed via the Wilcoxon test. The stromal score, immune score, and ESTIMATE score (summed over the first two) of the samples in training set 1 were estimated using the estimate package in R (v 1.0.13). Moreover, the expression of common immune checkpoints, including PD-L1, CTLA-4, LAG-3, GAL9, TIM-3, PD-1, PD-1LG2, and TIGIT, was compared between the high- and low-risk groups. Prognostic gene-related miRNAs were predicted using the starBase database.
2.9 Drug sensitivity analysis
The 50% inhibitory concentration (IC50) values of 198 chemotherapeutic drugs were computed and compared according to the Genomics of Drug Sensitivity in Cancer database using the OncoPredict package (v 0.2).
2.10 Cell line culture
The cell lines A375 (primary cutaneous melanoma) and A2058 (metastatic melanoma), purchased from ATCC (cat. nos. CRL-1619 and CRL-11147), were cultured in Dulbecco’s modified Eagle’s medium (DMEM; #12634-010, USA) supplemented with 10% fetal bovine serum (FBS; No. SH30070.02, HyClone, Utah, USA) in incubators with 5% CO2 at 37°C. The human immortalized keratinocyte HaCaT cell line (CVCL-0038) as the control cell line was purchased from the Kunming Institute of Zoology and cultured in Dulbecco’s modified Eagle’s medium.
2.11 RT-qPCR
Total RNA was extracted from melanoma cell lines by TRIzol (15596018, Thermo, Beijing, China). A PrimeScript™ RT kit (R232-01, Vazyme, Nanjing, China) was applied to synthesize cDNA. Real-time polymerase chain reaction (RT-PCR) was achieved using SYBR Green Master Mix (Q111-02, Vazyme), and the expression levels were confirmed via the 2−ΔΔCt method. The expression of each mRNA was standardized to the expression of GAPDH mRNA. All primers, as shown in Supplementary Table 1, were purchased from Tsingke Biotech (Beijing, China).
3 Results
3.1 Identification and functional analysis of DEGs
A total of 3,216 DEGs (1,784 upregulated and 1,432 downregulated) between the melanoma and control groups were selected from training set 2 (Figures 1A, B). Functional enrichment analysis indicated that DEGs were related to 1,238 GO terms (Figure 1C), including 83 CCs (e.g., “collagen-containing”, “extracellular matrix”, and “cornified envelope membrane raft”), 56 MFs (e.g., “cytokine binding”, “cytokine activity”, and “actin binding”), and 1,099 BPs (e.g., “epidermis development”, “skin development”, and “epithelial cell proliferation”). In addition, 76 functional pathways were enriched according to the KEGG analysis. The KEGG enrichment analysis results displayed that chemical carcinogenesis-receptor activation, focal adhesion, and apoptosis were the pathways enriched in the DEGs (Figure 1D).
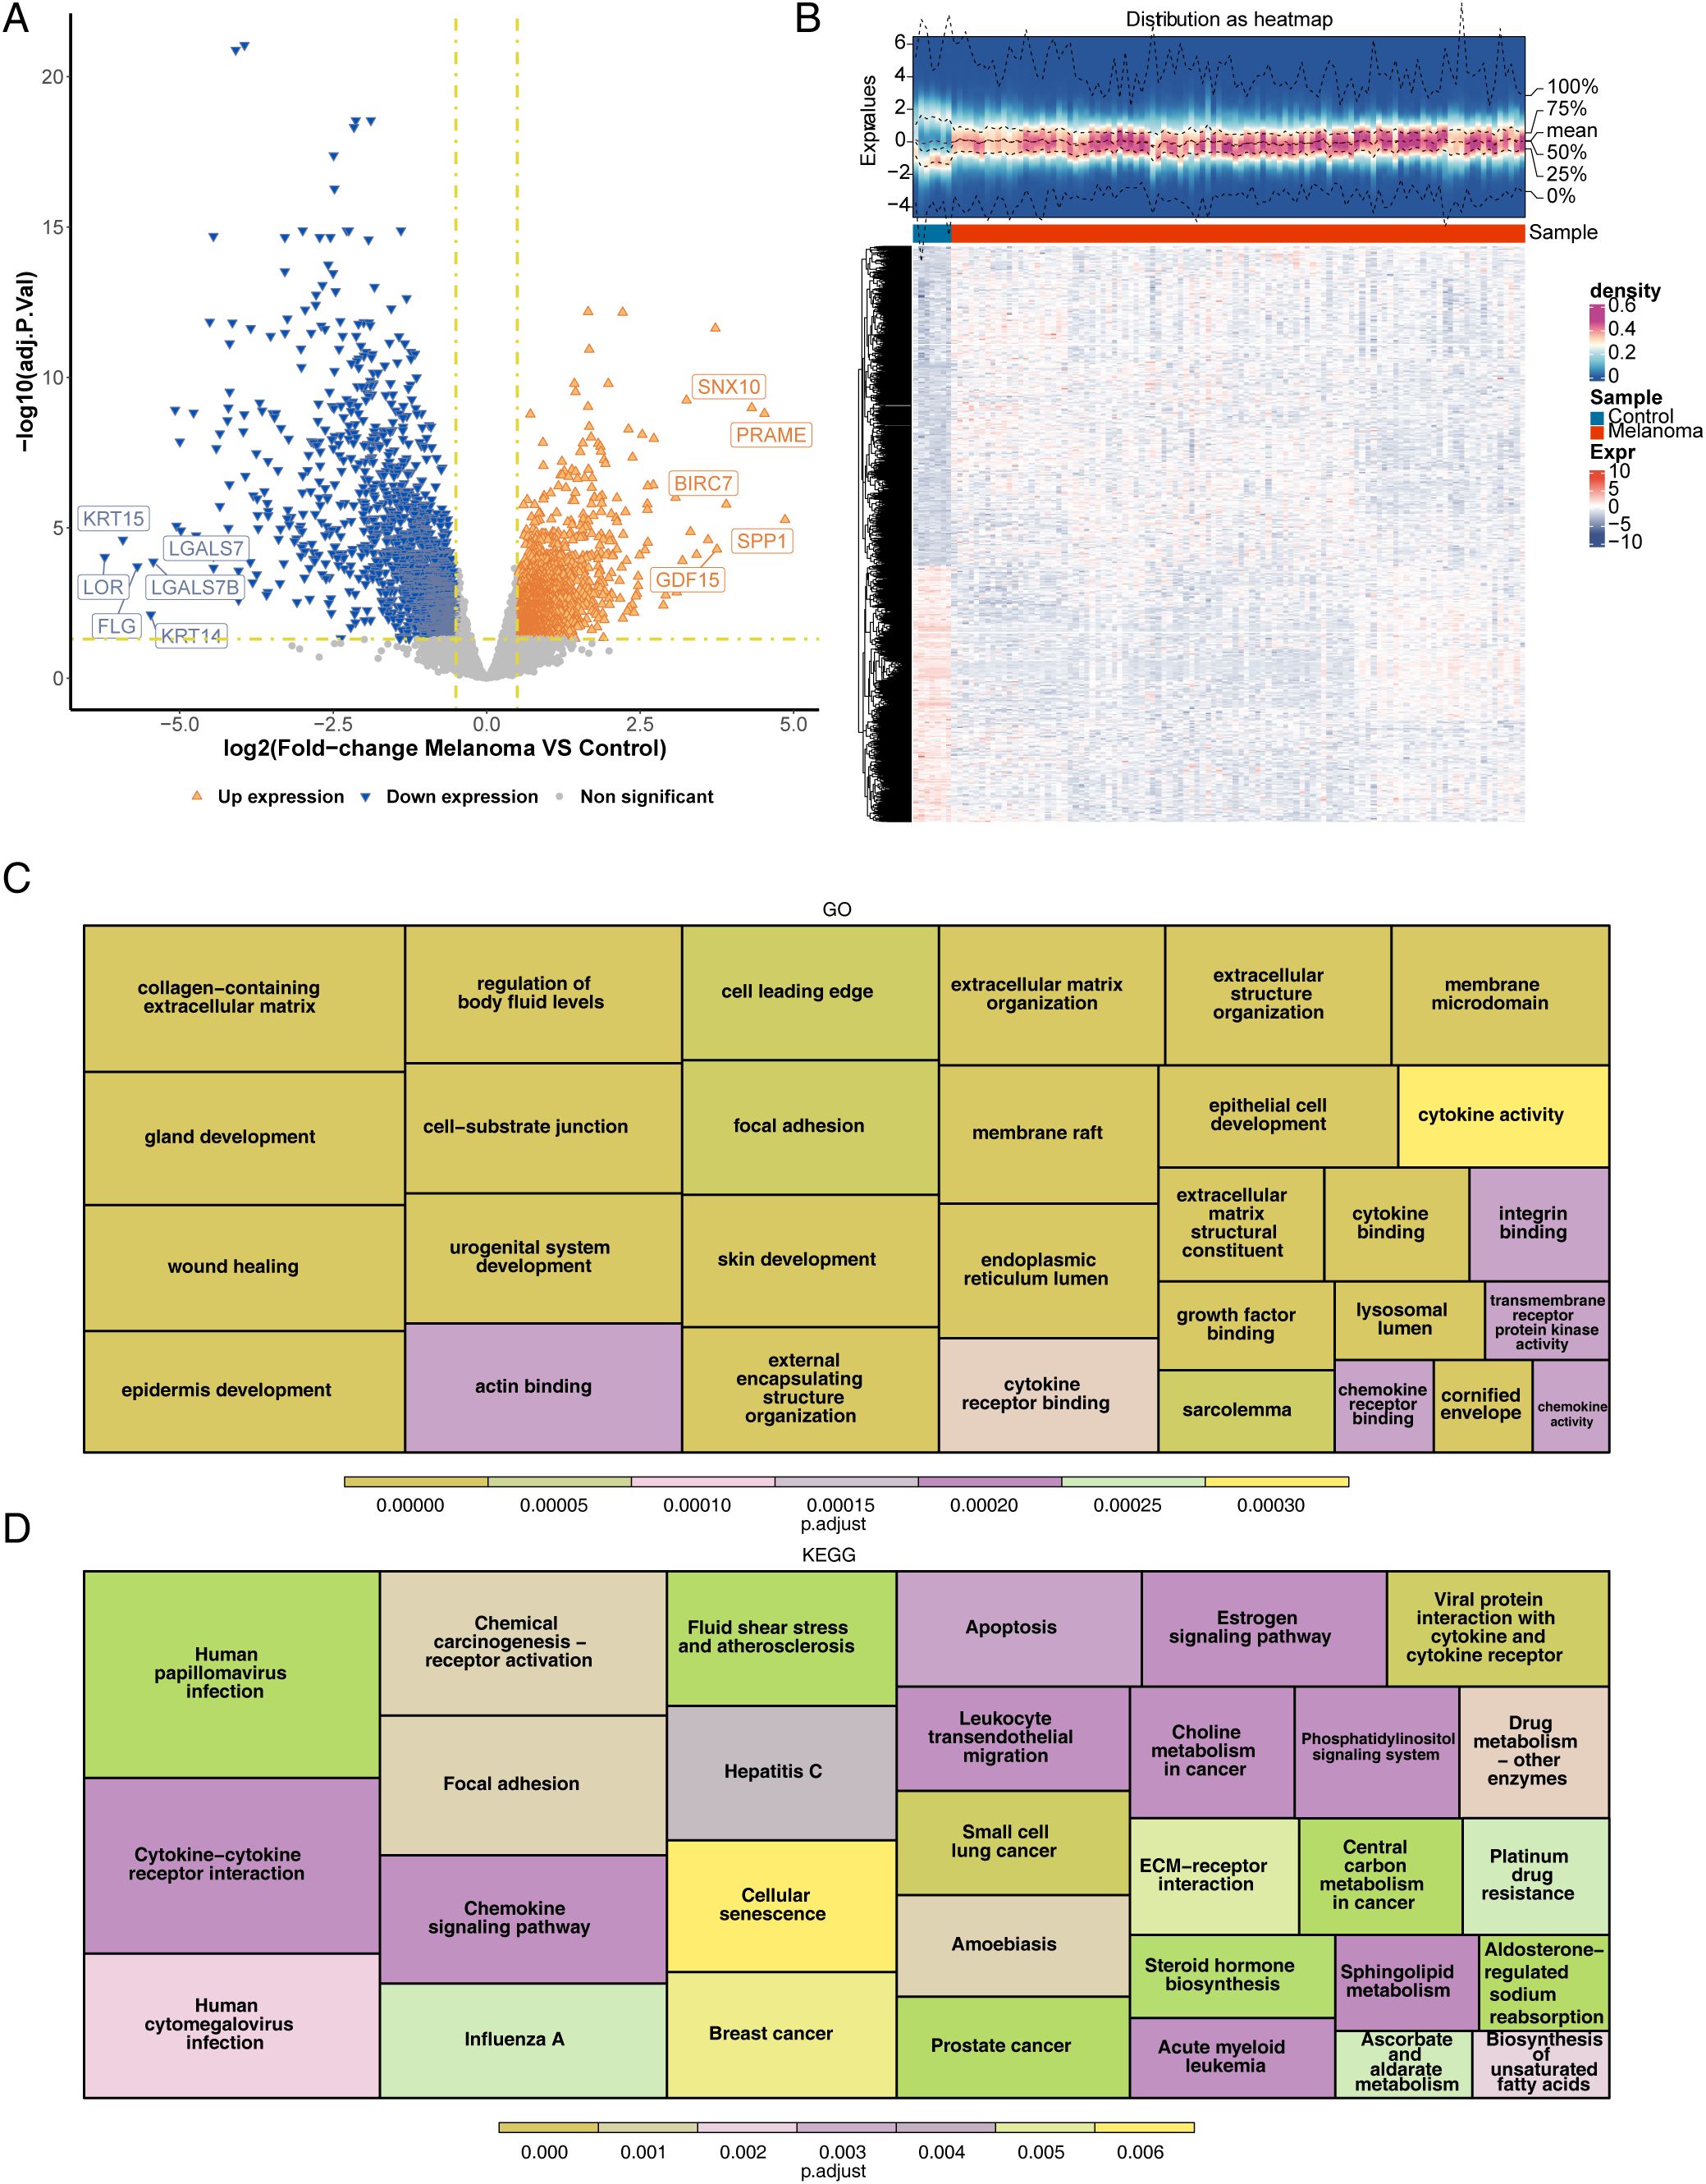
Figure 1. Identification and functional enrichment analysis of DEGs between melanoma patients and controls. (A) Volcano plot of DEGs between melanoma and control in GEO. p < 0.05 and |log2FC| ≥ 0.5 were used to identify significant DEGs. The red dots represent upregulated genes, and the blue dots represent downregulated genes. (B) Heatmap of DEGs. (C) Functional enrichment of differential genes for GO (displaying the top 10 functional items in each section). (D) Functional enrichment of differential genes for KEGG (displaying the top 30 functional pathways). DEGs, differentially expressed genes; GEO, Gene Expression Omnibus; log2FC, log2 fold change; GO, Gene Ontology; KEGG, Kyoto Encyclopedia of Genes and Genomes.
3.2 WGCNA and the acquisition of intersecting genes
First, samples from the training set were used to construct a clustering tree (Figure 2A). A soft threshold of 7 (R2 = 0.98) was applied to construct a scale-free network (Figure 2B). Then, an adjacency matrix and topological overlap matrix were constructed (Figure 2C). Finally, 13 modules were obtained based on average hierarchical clustering and dynamic tree clipping (Figure 2D). The blue module (|cor| = −0.34, p < 0.05, containing 2,165 module genes) was associated with GMS, which was identified as a key module (Figure 2E). Subsequently, 75 intersecting genes were obtained by overlapping DEGs and module genes (Figure 2F). A PPI network of 75 intersecting genes showed multiple pairs of relationships for intersecting genes. For example, CYP2E1 was associated with multiple genes, such as GPT and NR1I2 (Figure 2G).
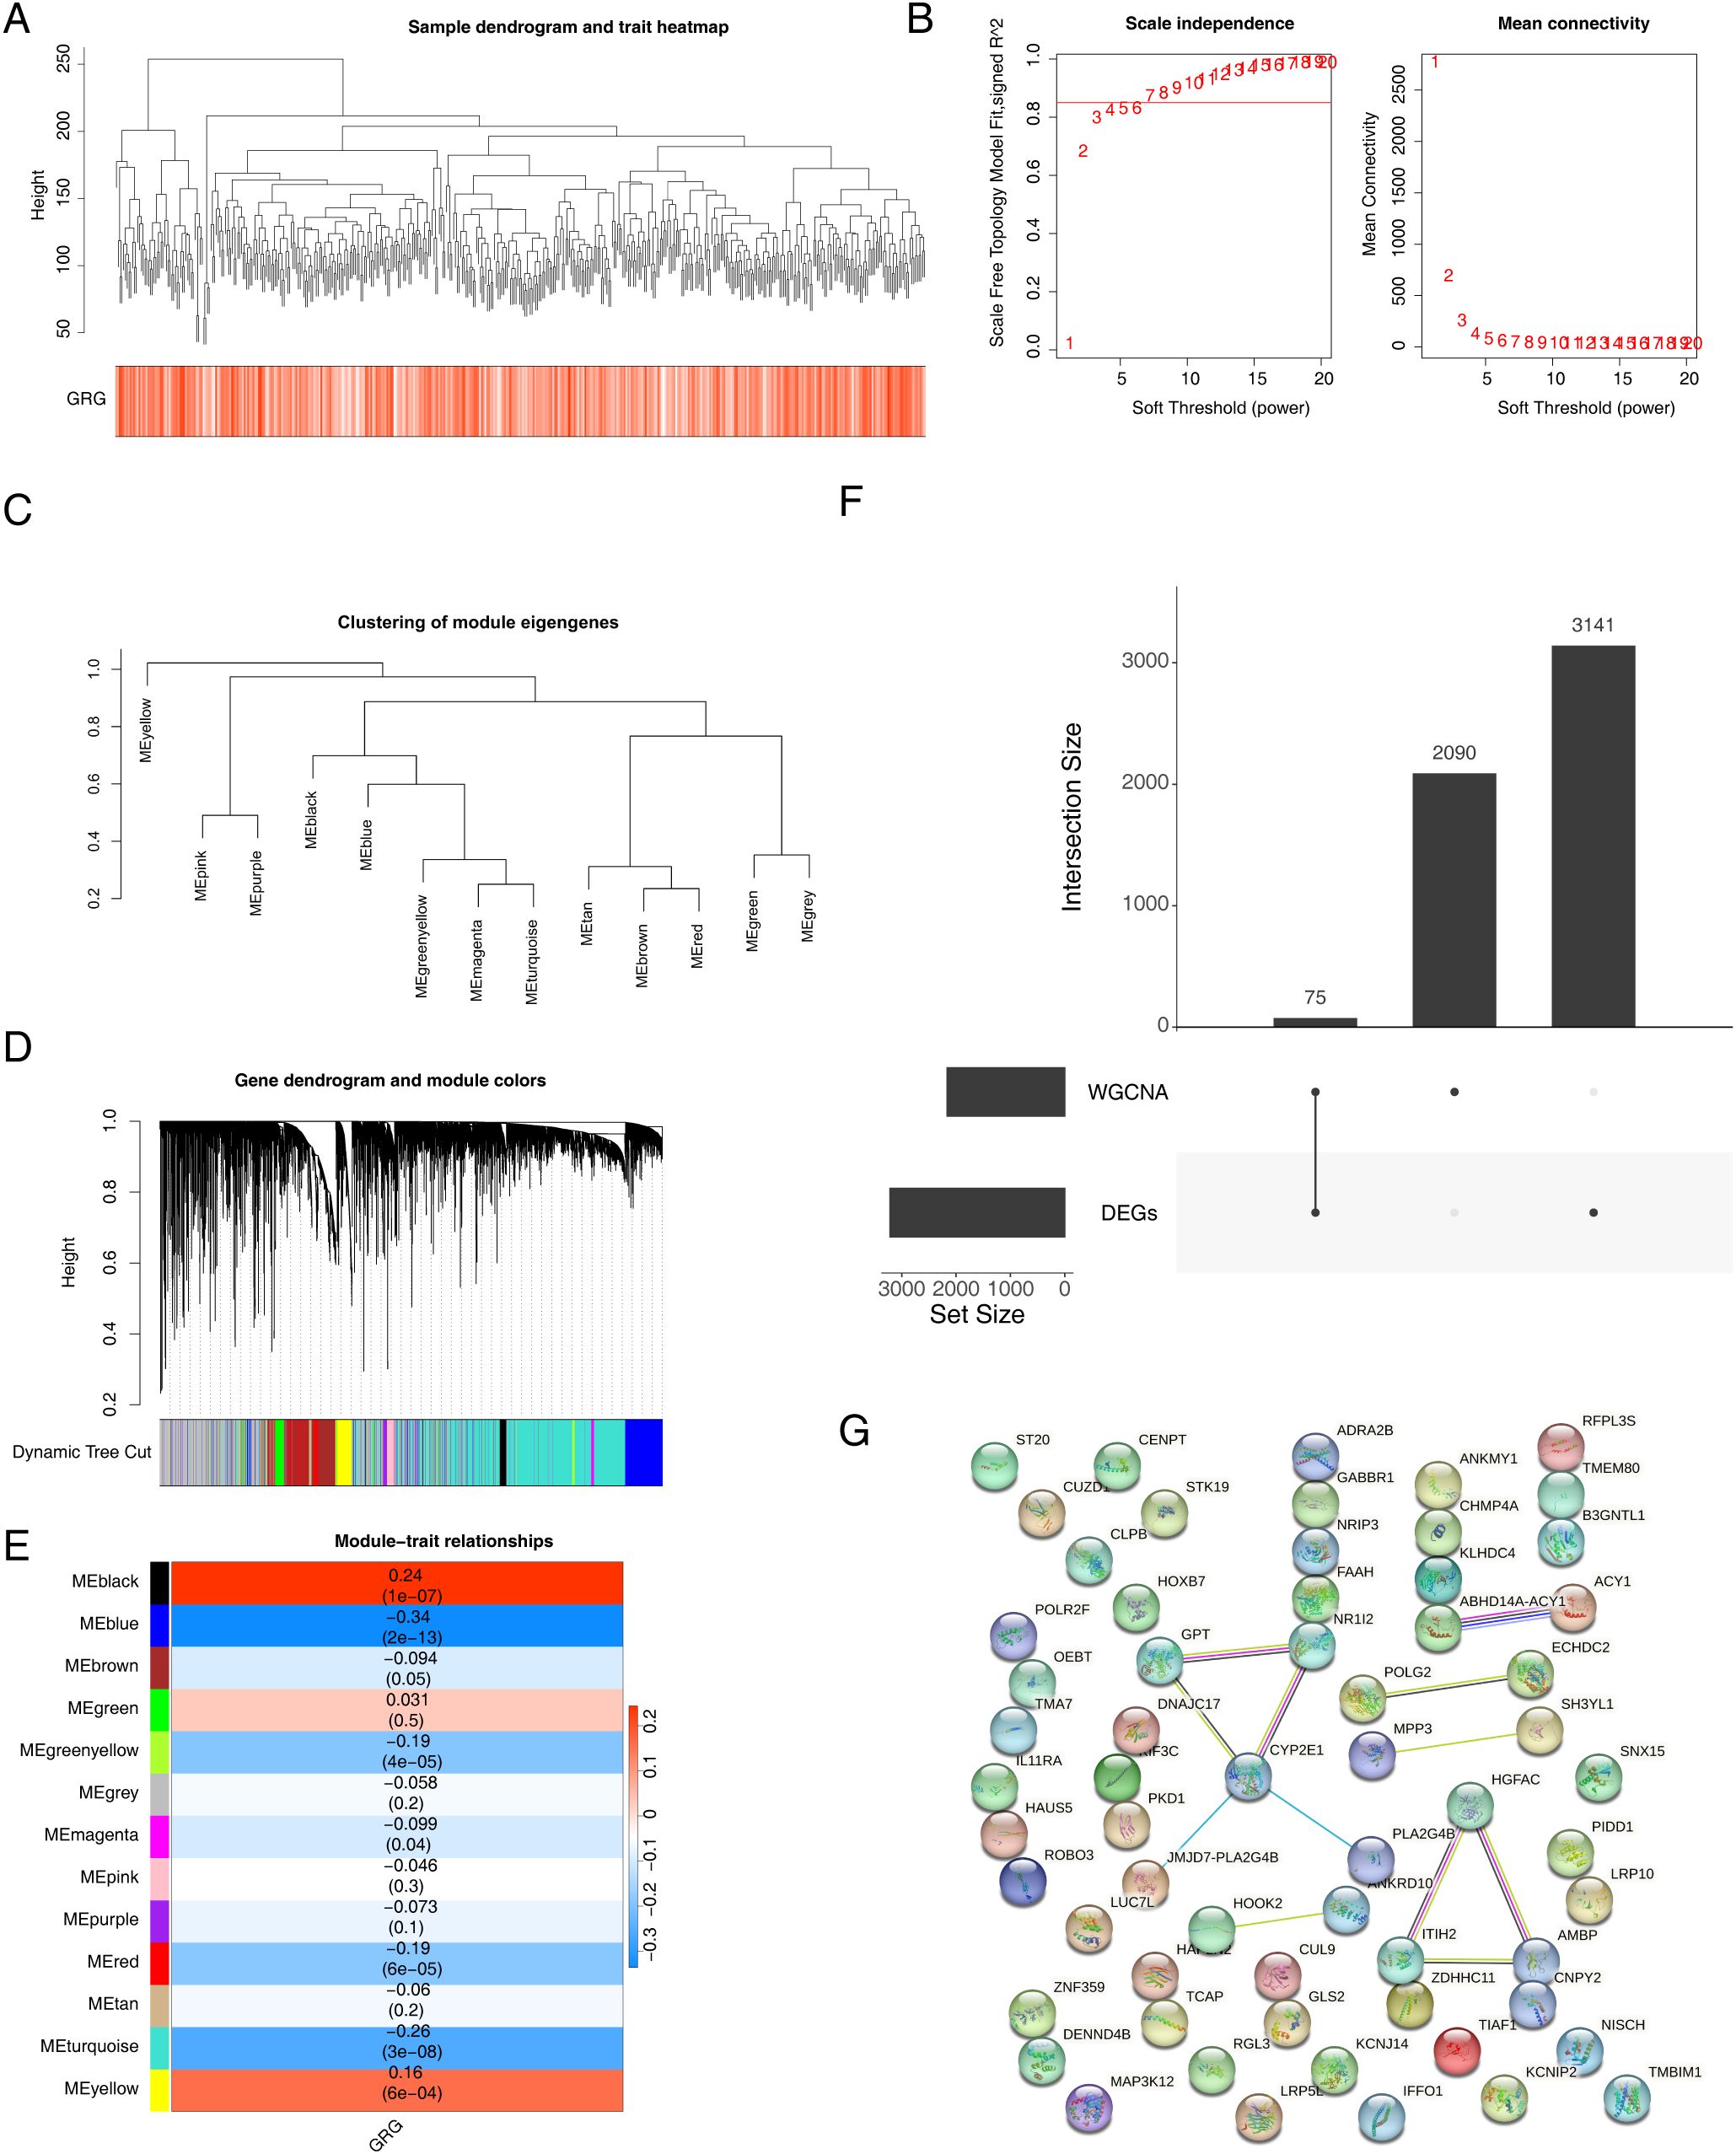
Figure 2. Melanoma-related genes were screened via WGCNA. (A) Sample clustering tree. (B) Analysis of the scale-free index for various soft-threshold powers (β). (C) The minimum number of genes per module was 300, and 13 modules were obtained when MEDissThres was equal to 0.2. (D) Cluster dendrogram of the coexpression network modules (1 − Topological Overlap Matrix (TOM)). (E) Analysis of correlations between the modules and melanoma; p-values are shown. (F) Wayne diagram of intersecting genes. (G) PPI network of significantly differentially expressed glutamine metabolism-related genes. WGCNA, weighted gene coexpression network analysis; PPI, protein–protein interaction.
3.3 Single-cell analysis and screening of candidate genes
After QC, 2,887 cells and 23,684 genes remained in the single-cell dataset (Figure 3A). Then, 2,000 highly variable genes were selected for subsequent analysis (Figure 3B). The cells were clustered into 13 clusters based on distance and were annotated to six cell types [T cells, B cells, Cancer-Associated Fibroblasts (CAFs), macrophages, natural killer (NK) cells, and endothelial cells] via marker genes (Figures 3C, D). Furthermore, 81 DEGs were screened between the high- and low-expression groups (min.pct = 0.25, logfc.threshold = 0.25) and were crossed with 80 GRGs to obtain 14 DE-GRGs (ALDH18A1, ASL, ASNSD1, ATP2B4, ALDH18A1, ASL, ASNSD1, ATP2B4, CLN3, FPGS, GLS, GLUD1, GMPS, GOT2, MTHFS, NIT2, OAT, and UCP2) (Figures 3E, F). In addition, 65 candidate genes were obtained based on Pearson’s correlation analysis of the intersecting genes and DE-GRGs (Figure 3G).
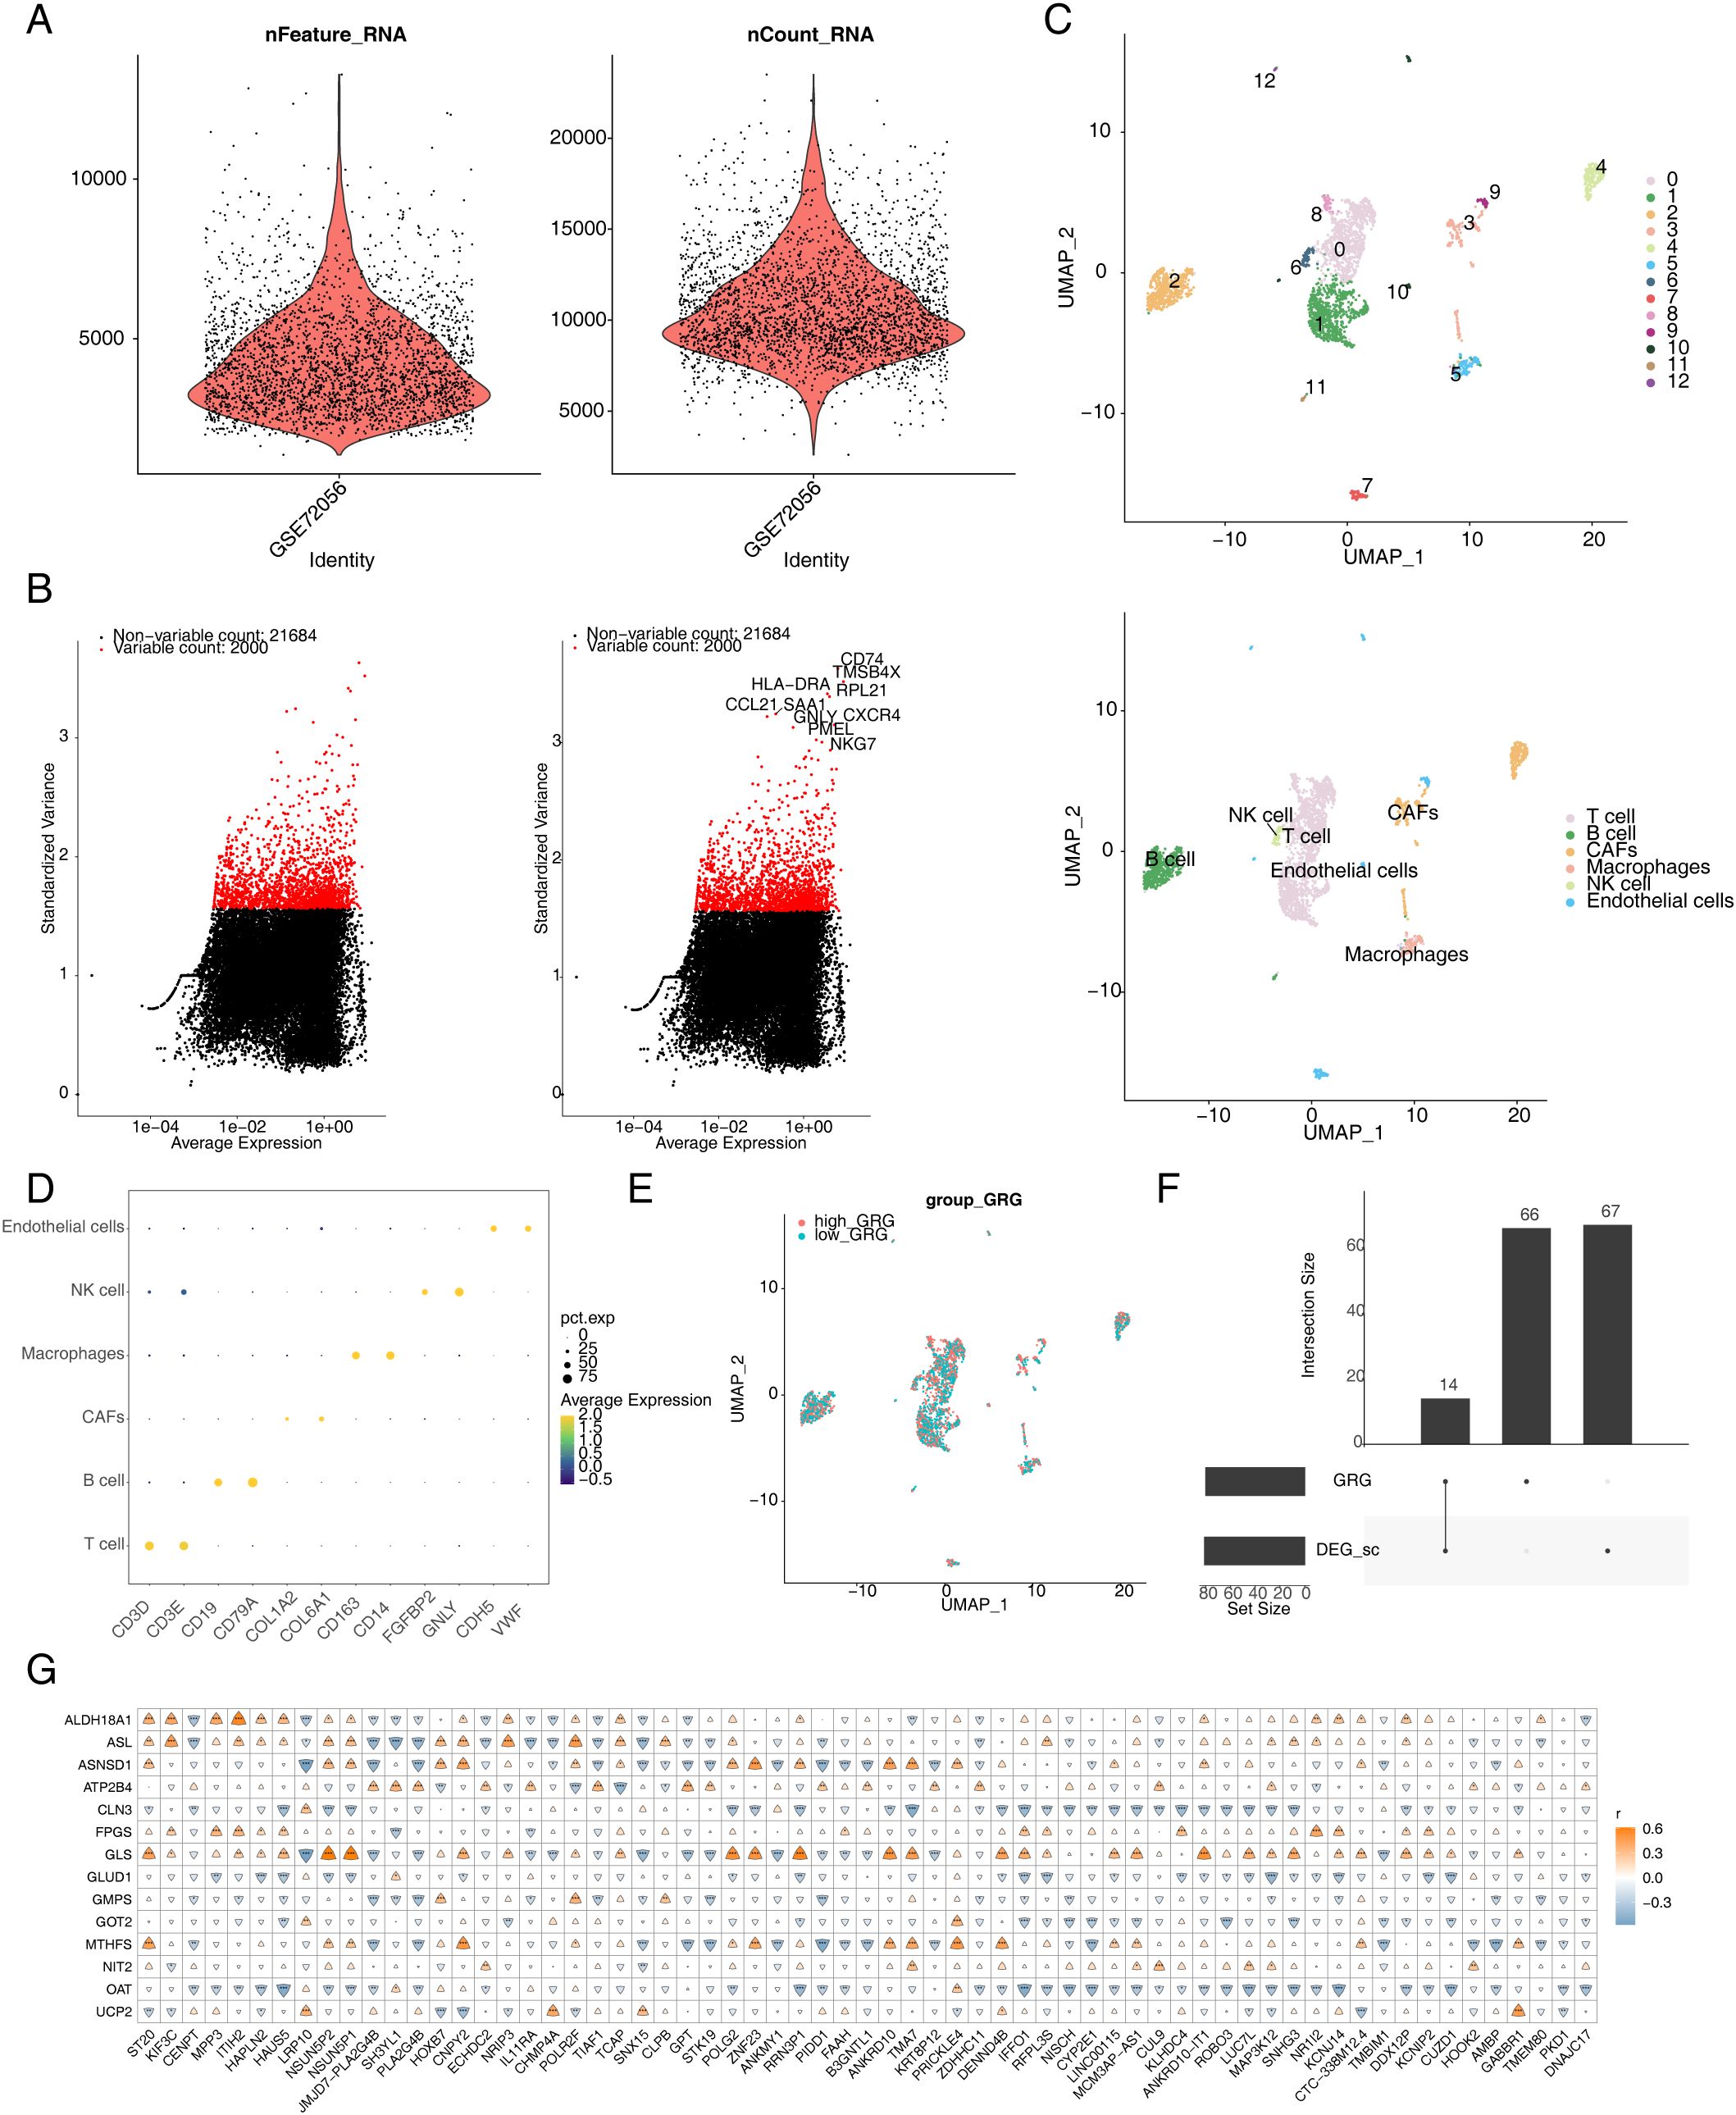
Figure 3. Annotation of cell subsets from single-cell sequencing data and identification of differentially expressed genes. (A) After quality control of scRNA-seq, 2,887 core cells and 23,684 genes were identified. (B) The variance diagram shows the variation of gene expression in all melanoma cells. The red dots represent highly variable genes, and the black dots represent non-variable genes. (C) shows the clustering and subgroup annotation results of single-cell analysis cells. (D) The bubble diagram shows the expression of marker genes for each cell cluster. (E) Glutamine metabolism score in each cell cluster. (F) Wayne diagram of glutamine metabolism-related genes. (G) Heatmap of candidate genes and differentially expressed genes. scRNA-seq, single-cell RNA-seq.
3.4 Construction, evaluation, and validation of a risk model
A total of nine genes were identified via univariate Cox regression analysis (Figure 4A), and further eight key genes (CHMP4A, IFFO1, ANKRD10, ZDHHC11, CLPB, ANKMY1, TCAP, and POLG2) were identified via LASSO based on 65 candidate genes (Figure 4B). Subsequently, a risk model was constructed according to the expression of eight key genes, and risk scores were also computed. Risk curves (Figure 4C) and gene expression data of the two risk groups were plotted based on risk scores (Figure 4D). It was observed from the K–M curves that the difference in the survival of melanoma patients was highly significant (p < 0.005) (Figure 4E). The AUC values exceeded 0.6 at 3, 5, and 7 years for melanoma patients. It suggested that the eight key genes could reliably predict survival status (Figure 4F).
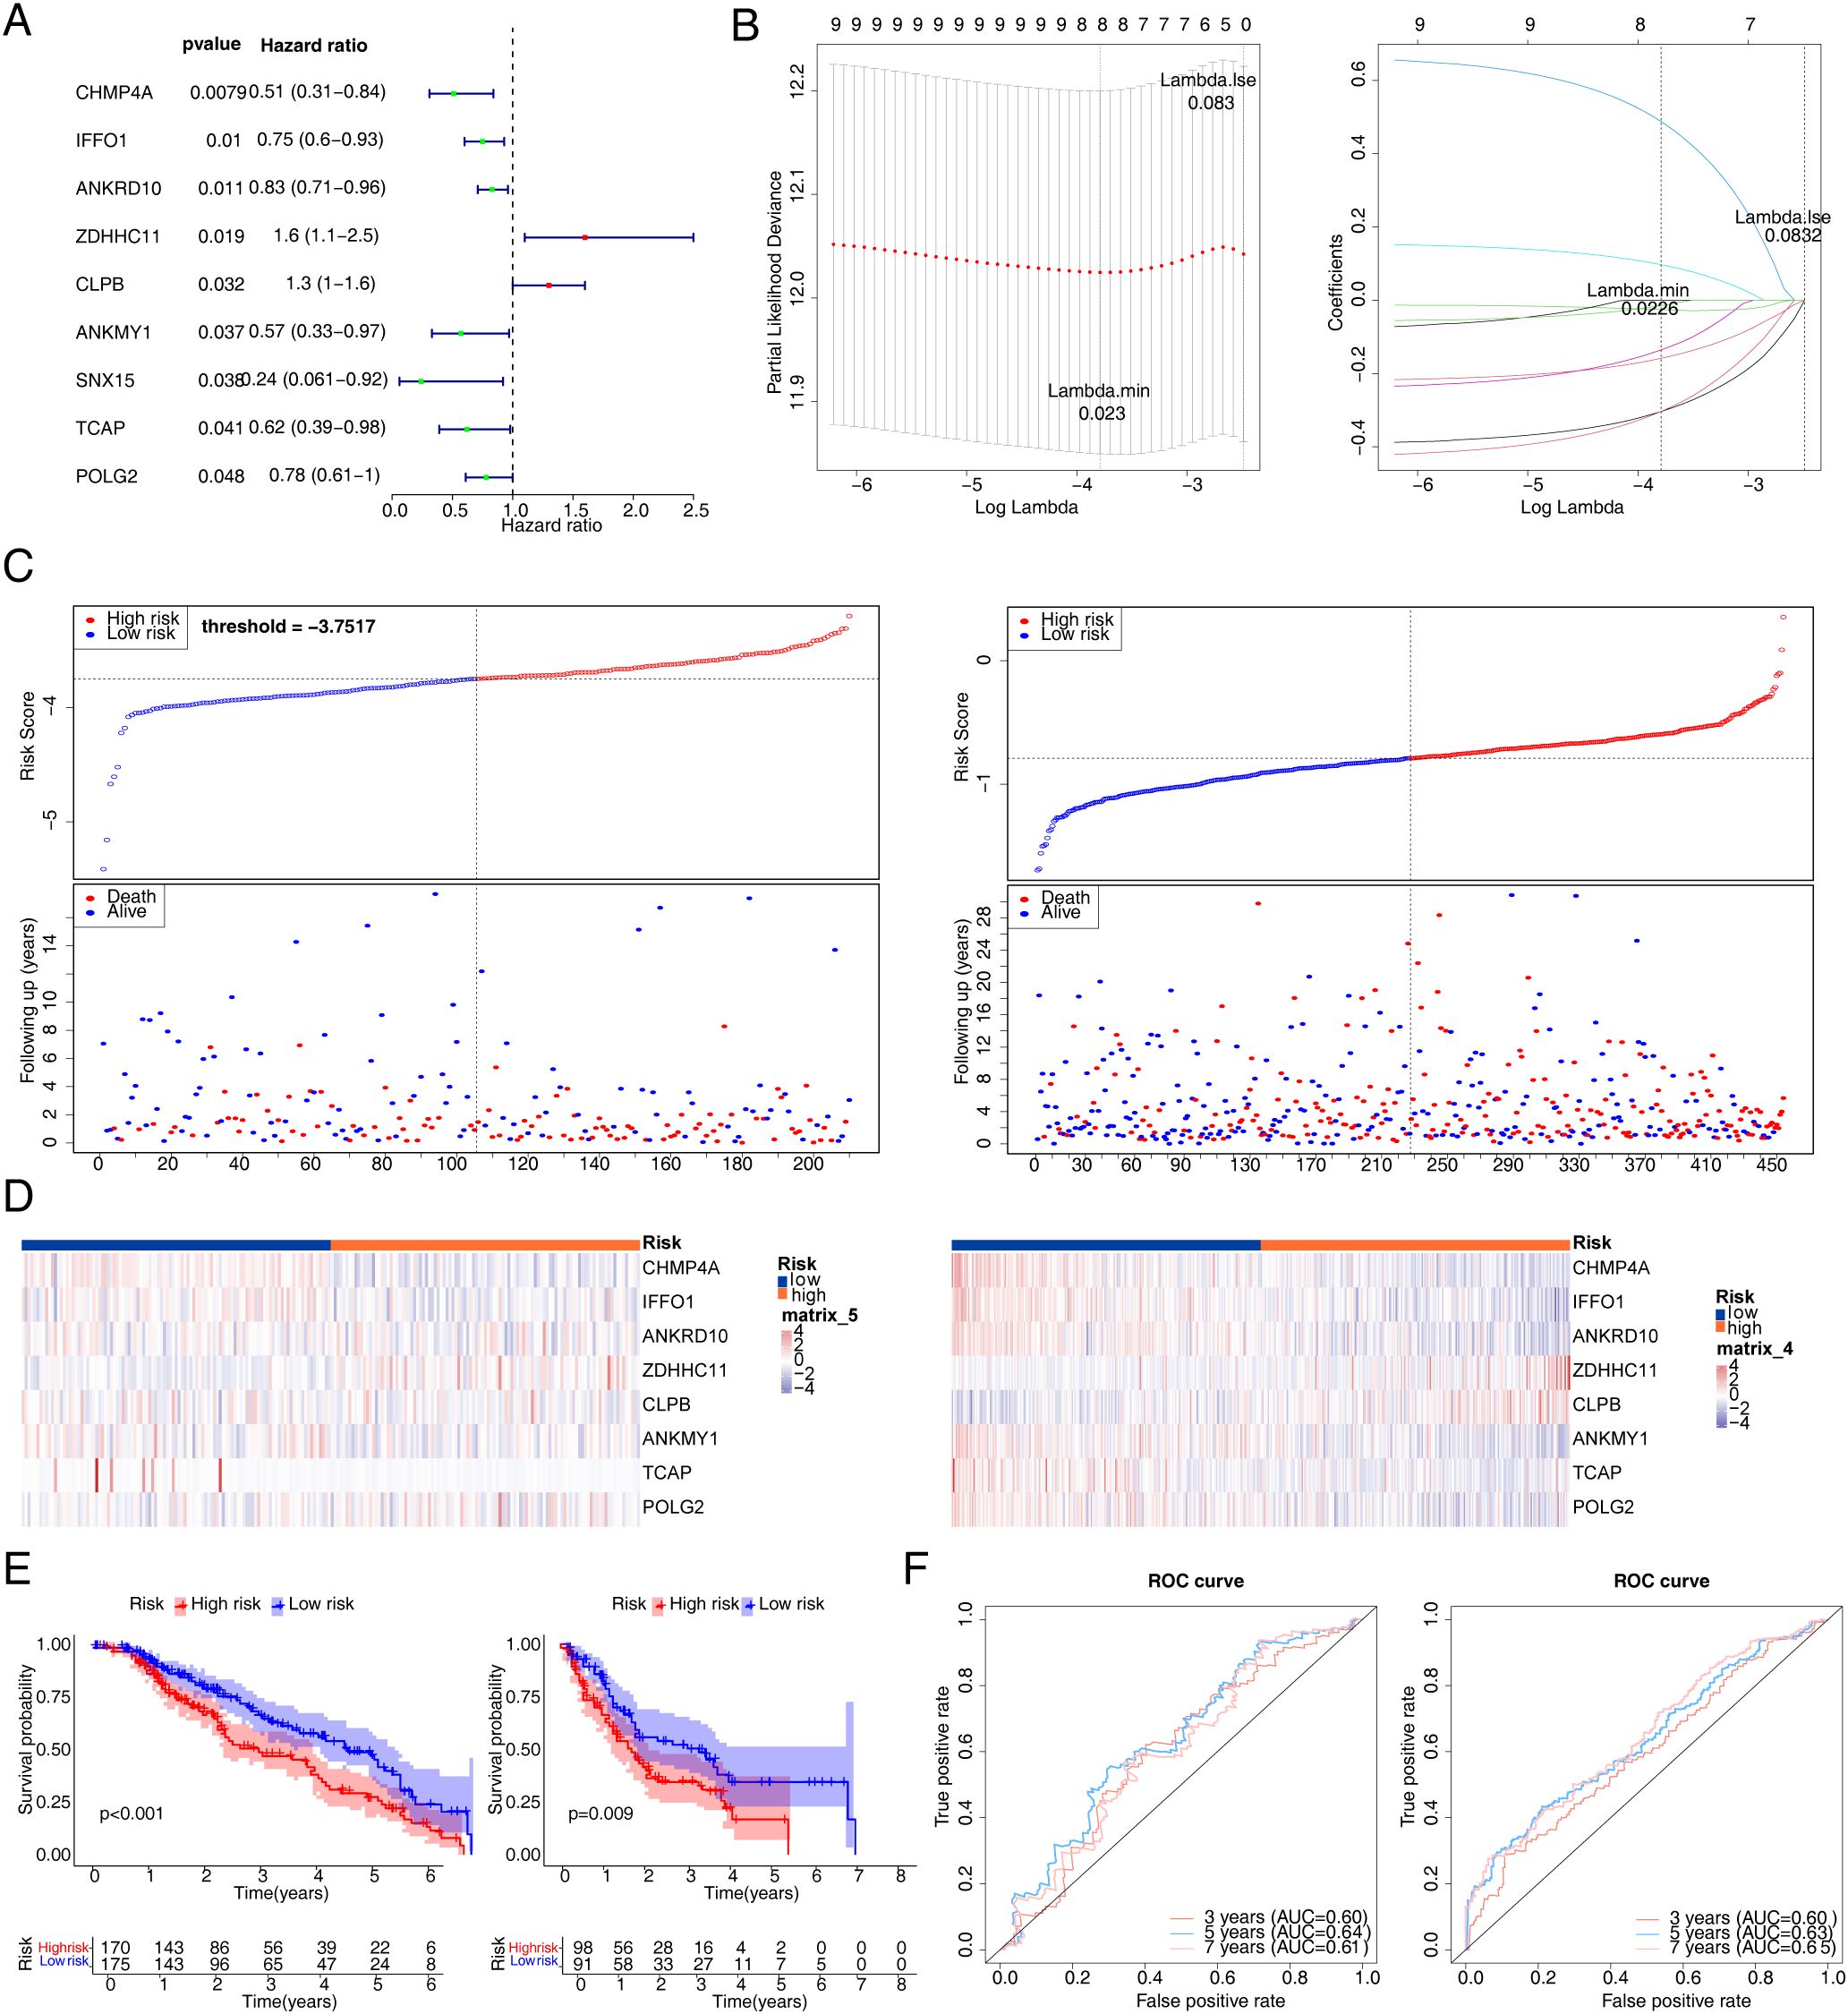
Figure 4. Construction of risk signature in TCGA cohort. (A) Univariate Cox regression analysis of OS. (B) LASSO regression of OS-related genes. (C) Risk survival status plot (C1 for training set 1; C2 for validation set). (D) The representative gene variants in the high- and low-risk groups (D1 for training set 1; D2 for validation set). (E) Kaplan–Meier curve (E1 for training set 1; E2 for validation set). (F) The AUC of the prediction of 3-, 5-, and 7-year survival rates of melanoma patients. TCGA, The Cancer Genome Atlas; OS, overall survival; LASSO, least absolute shrinkage and selection operator; AUC, area under the curve.
3.5 Construction of an independent prognostic model and correlation analysis of risk scores and clinical characteristics
To screen independent prognostic factors, clinical characteristics and risk scores were subjected to univariate and multivariate Cox analyses. The risk score, Clark stage, and ulcer status were identified as independent prognostic factors, which were used to construct a nomogram (Figures 5A–C). The slope of each calibration curve was close to 1, indicating favorable prediction accuracy of the nomogram (Figure 5D). In addition, correlation analysis of seven clinical characteristics and CD274 expression demonstrated that major differences existed in Clark stage and CD274 expression in melanomas (p = 0.019 and p < 0.001, respectively; Figure 6A). There was a marked difference in the survival status of the samples in the Clark subgroups (Figure 6B).
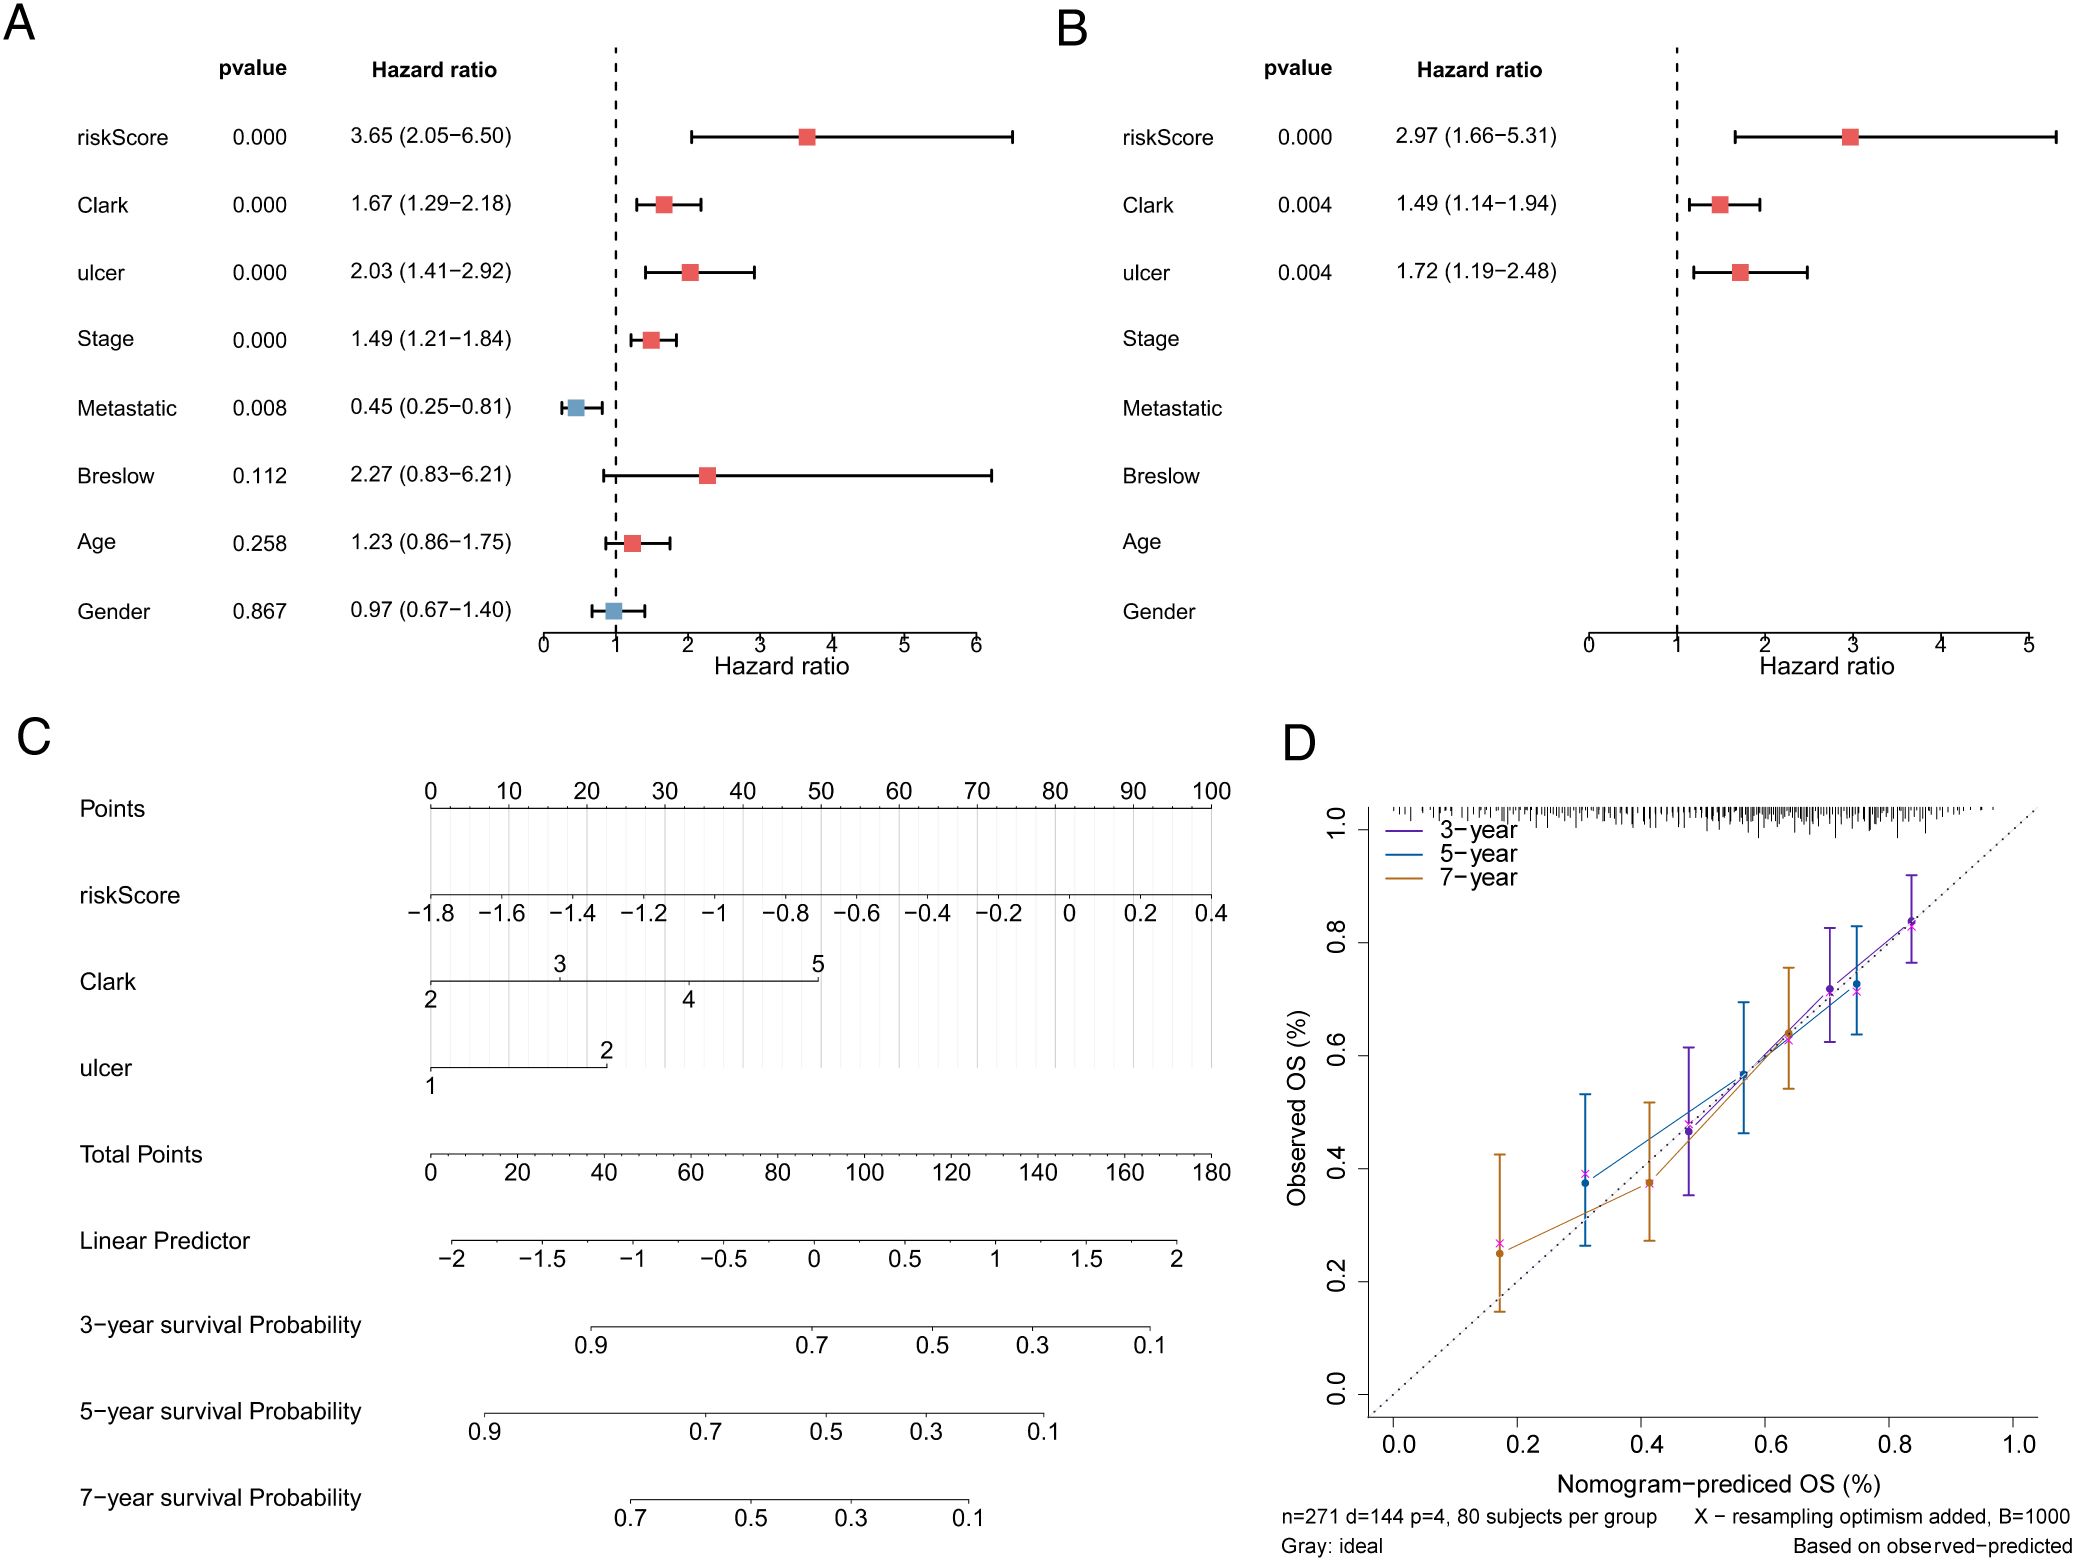
Figure 5. Nomogram to assess the risk of melanoma patients. (A) Univariate Cox analysis of risk scores and clinical characteristics. (B) Multifactorial Cox analysis. (C) Construction of the nomogram model. (D) The calibration curve of the nomogram.
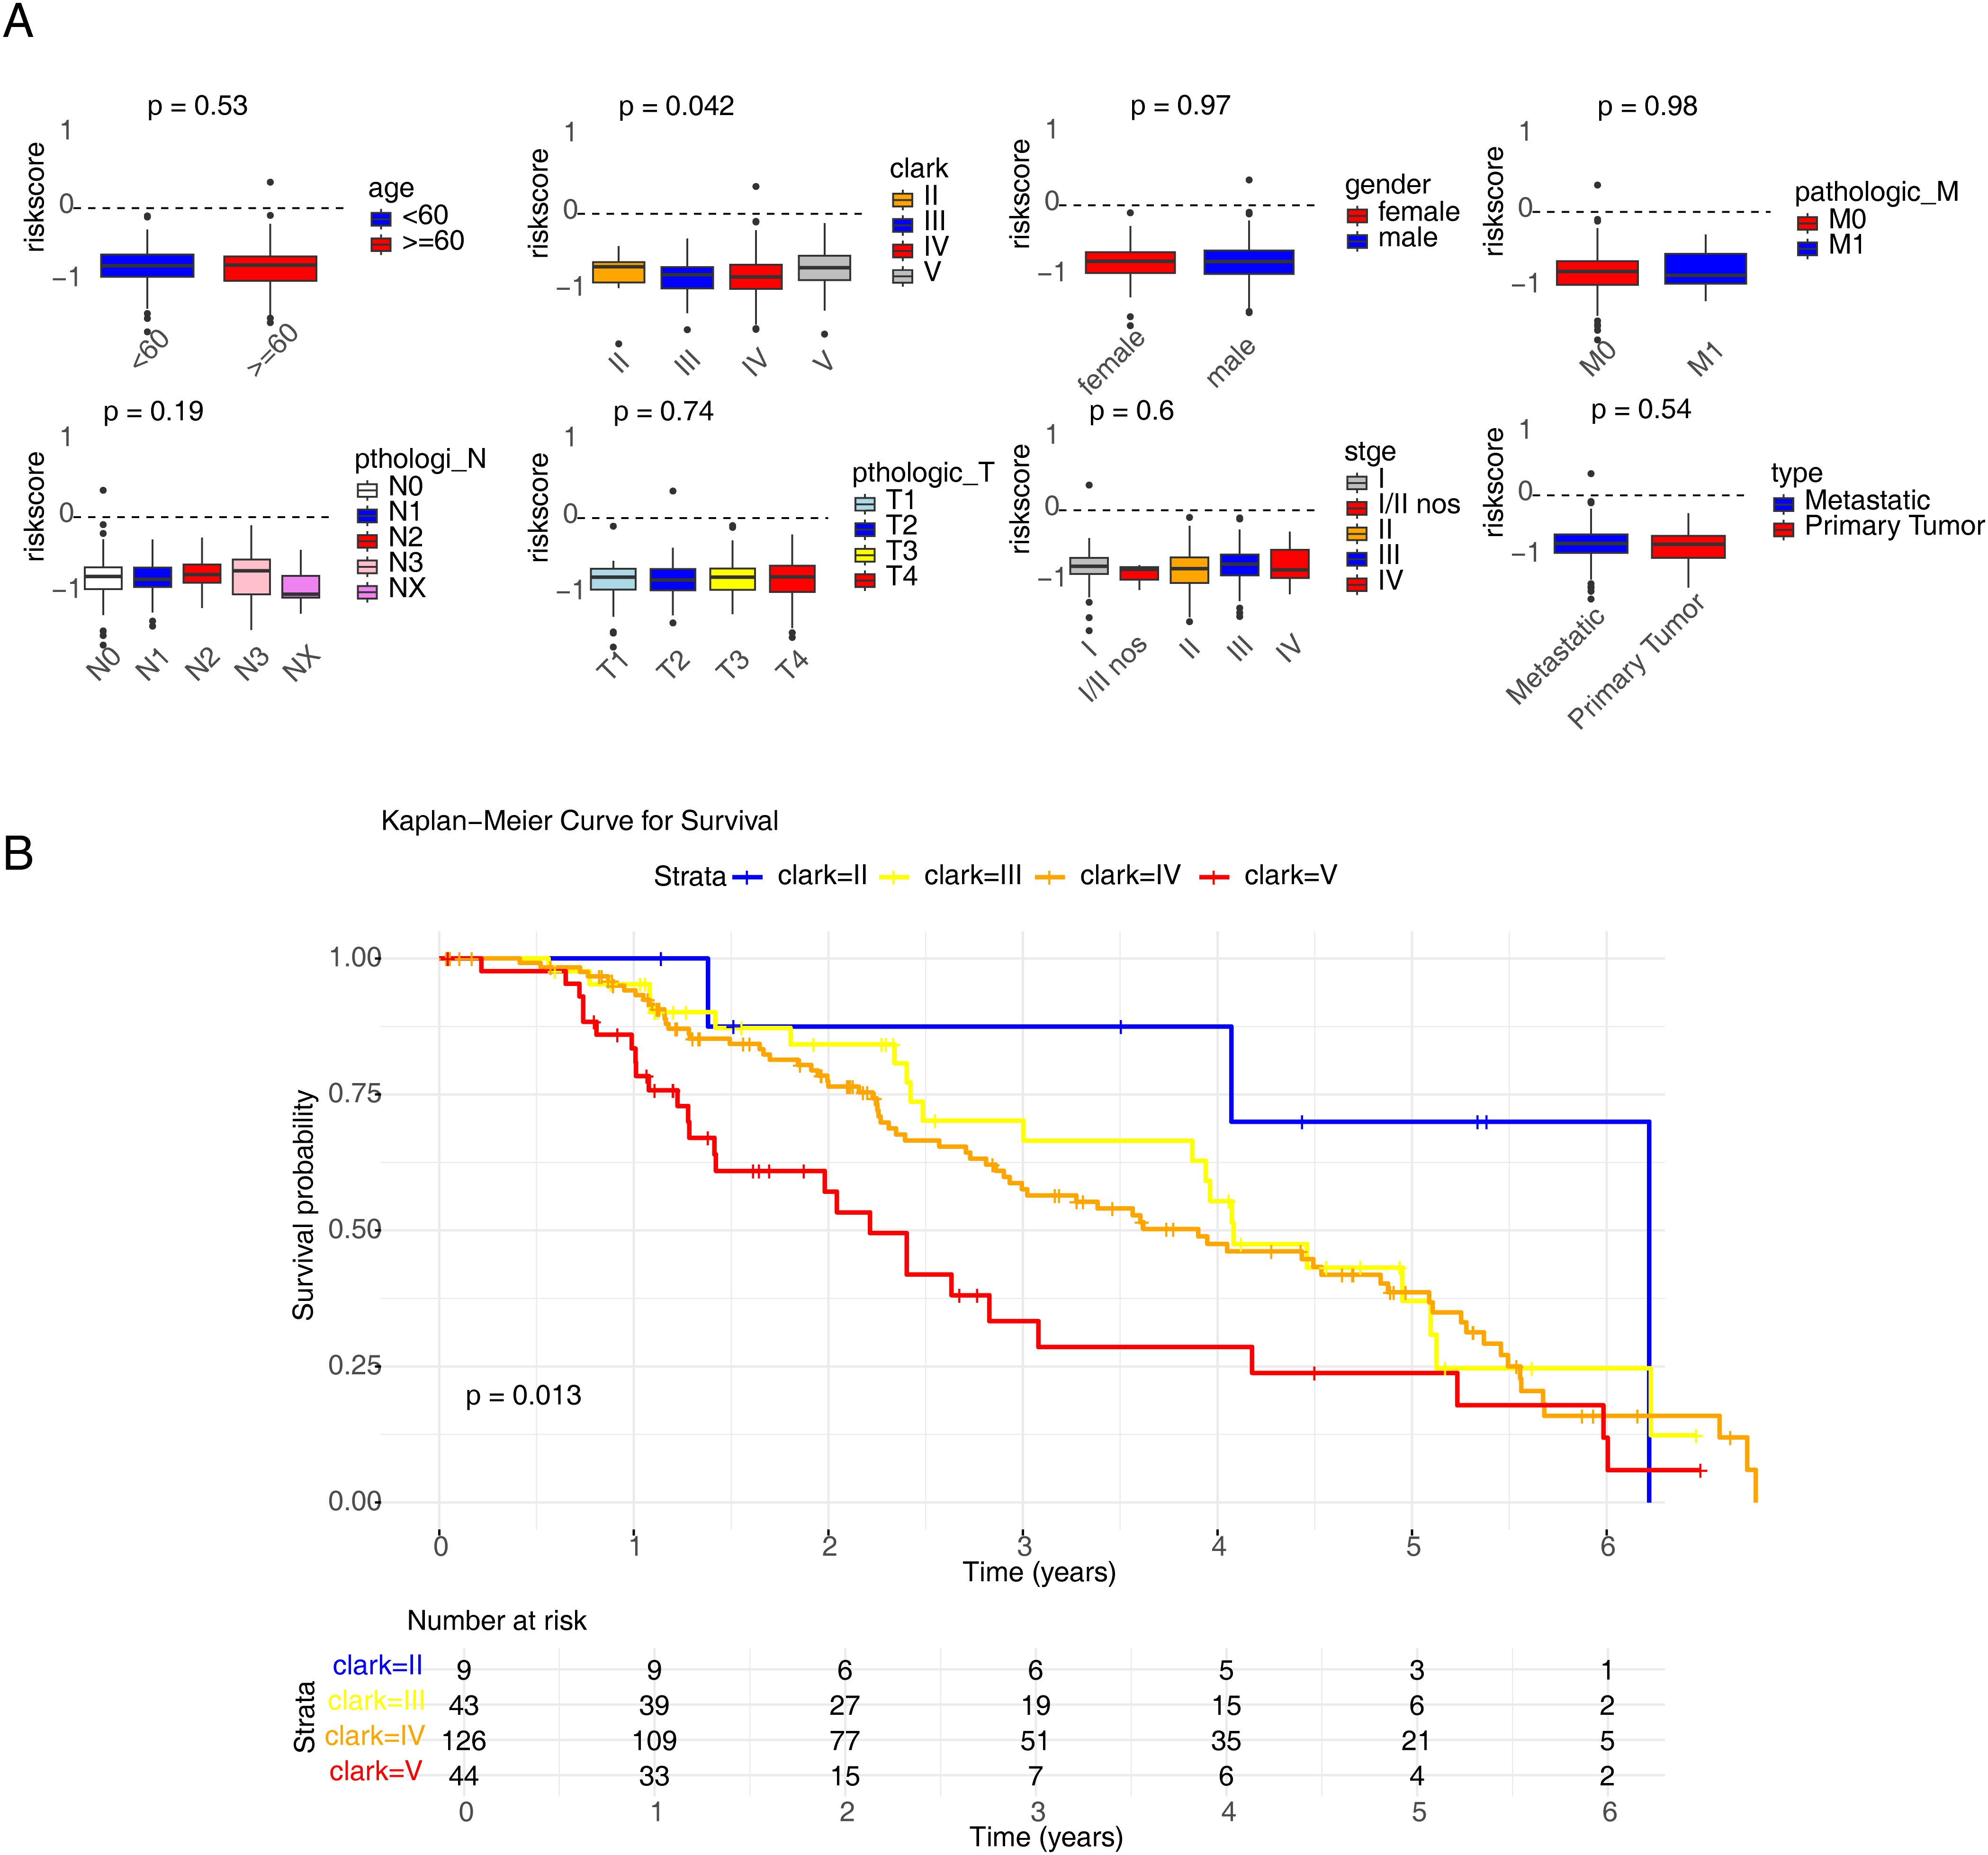
Figure 6. Correlation analysis of risk scores with clinical characteristics. (A) The analysis model of age, gender, Clark, stage, primary and metastatic tumors, Breslow, ulcer status, and the expression of CD274. (B) Kaplan–Meier curve result of Clark groups.
3.6 GSEA in training set 1 and the landscape of the immune microenvironment in the two risk groups
GSEA demonstrated that eight key genes were enriched in KEGG pathways (Figure 7).
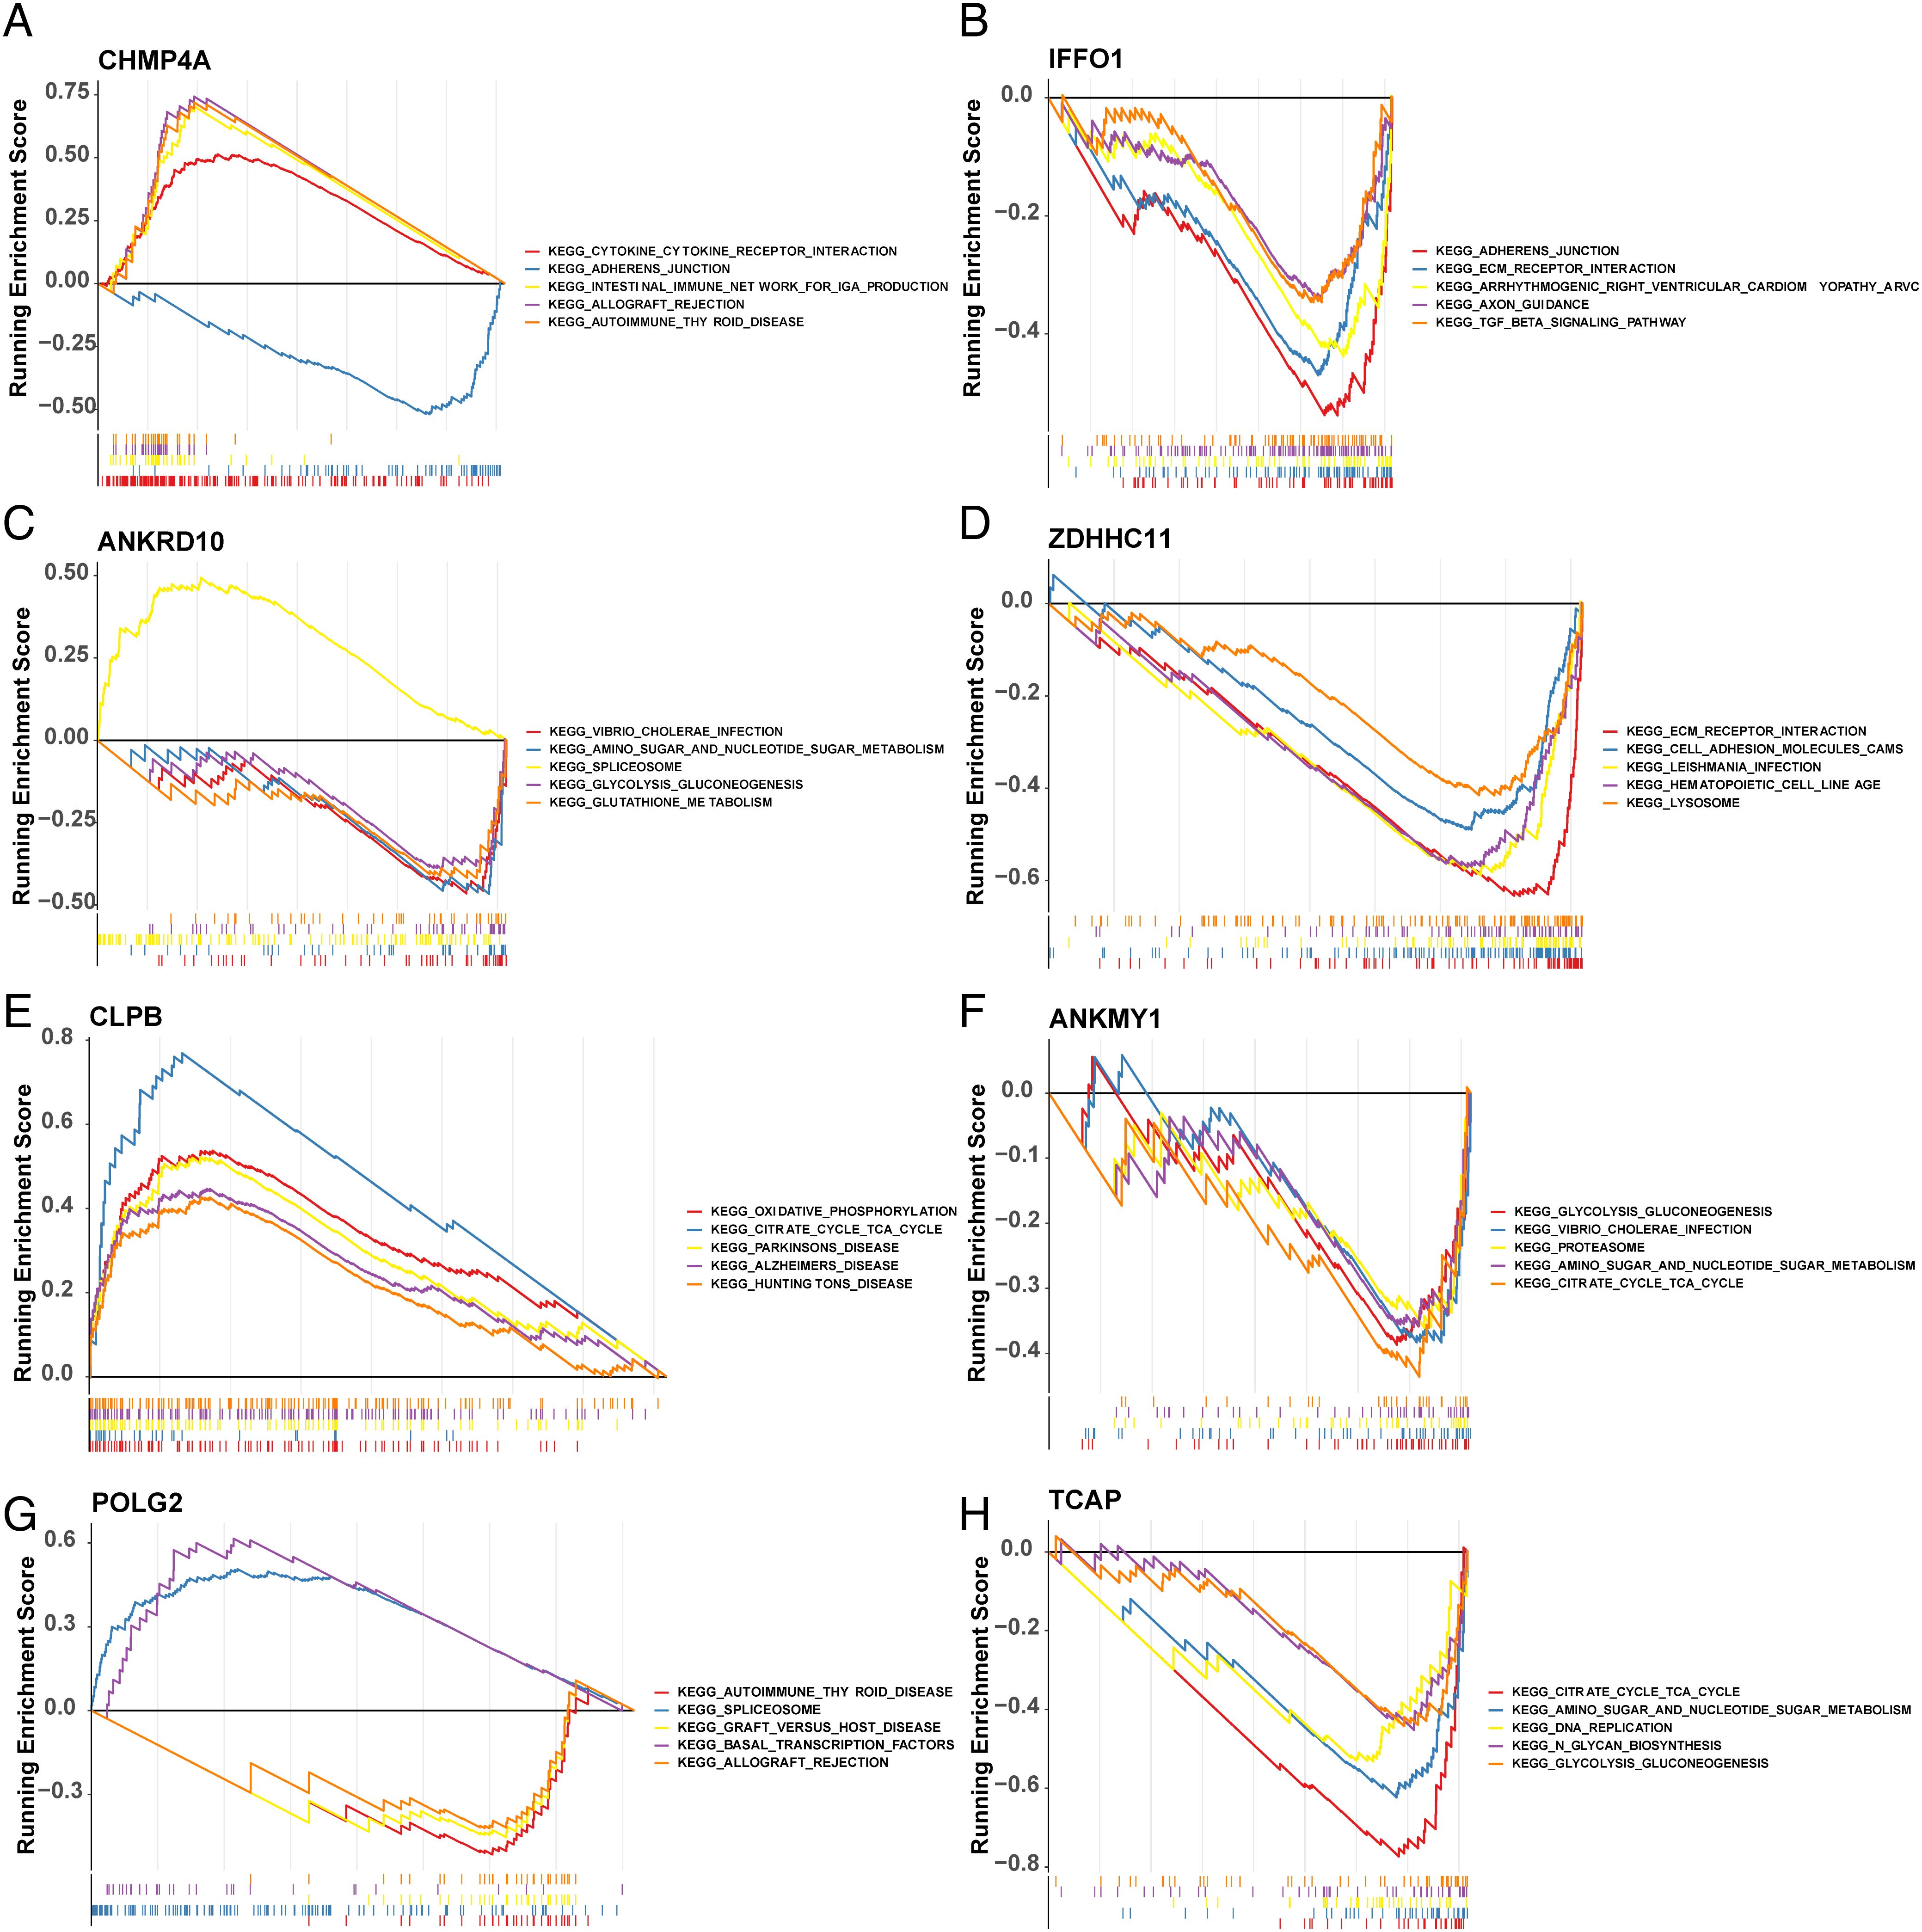
Figure 7. Biological characteristics between high- and low-risk groups. GSEA of GO and KEGG between high- and low-risk groups. GSEA, gene set enrichment analysis; GO, Gene Ontology; KEGG, Kyoto Encyclopedia of Genes and Genomes. (A–H) represent the GSEA results of CHMP4A, IFFO1, ANKRD10, ZDHHC11, CLPB, ANKMY1, POLG2, TCAP, respectively.
There were significantly different enrichment scores of the 16 immune cells between the high- and low-risk groups (p < 0.05). The expression of immune cells in the high-risk group, except for CD56dim NK cells, was higher than that of the low-risk group (Figure 8A). A heatmap of the correlation between the eight key genes and risk scores of the 16 immune cells was also drawn in Figure 8B. The stromal, immune, and ESTIMATE scores were substantially different between the two risk groups (p < 0.05), and all were low in the high-risk group (Figure 8C). In addition, all immune checkpoint genes exhibited low expression in the high-risk group (p < 0.001) (Figure 8D).
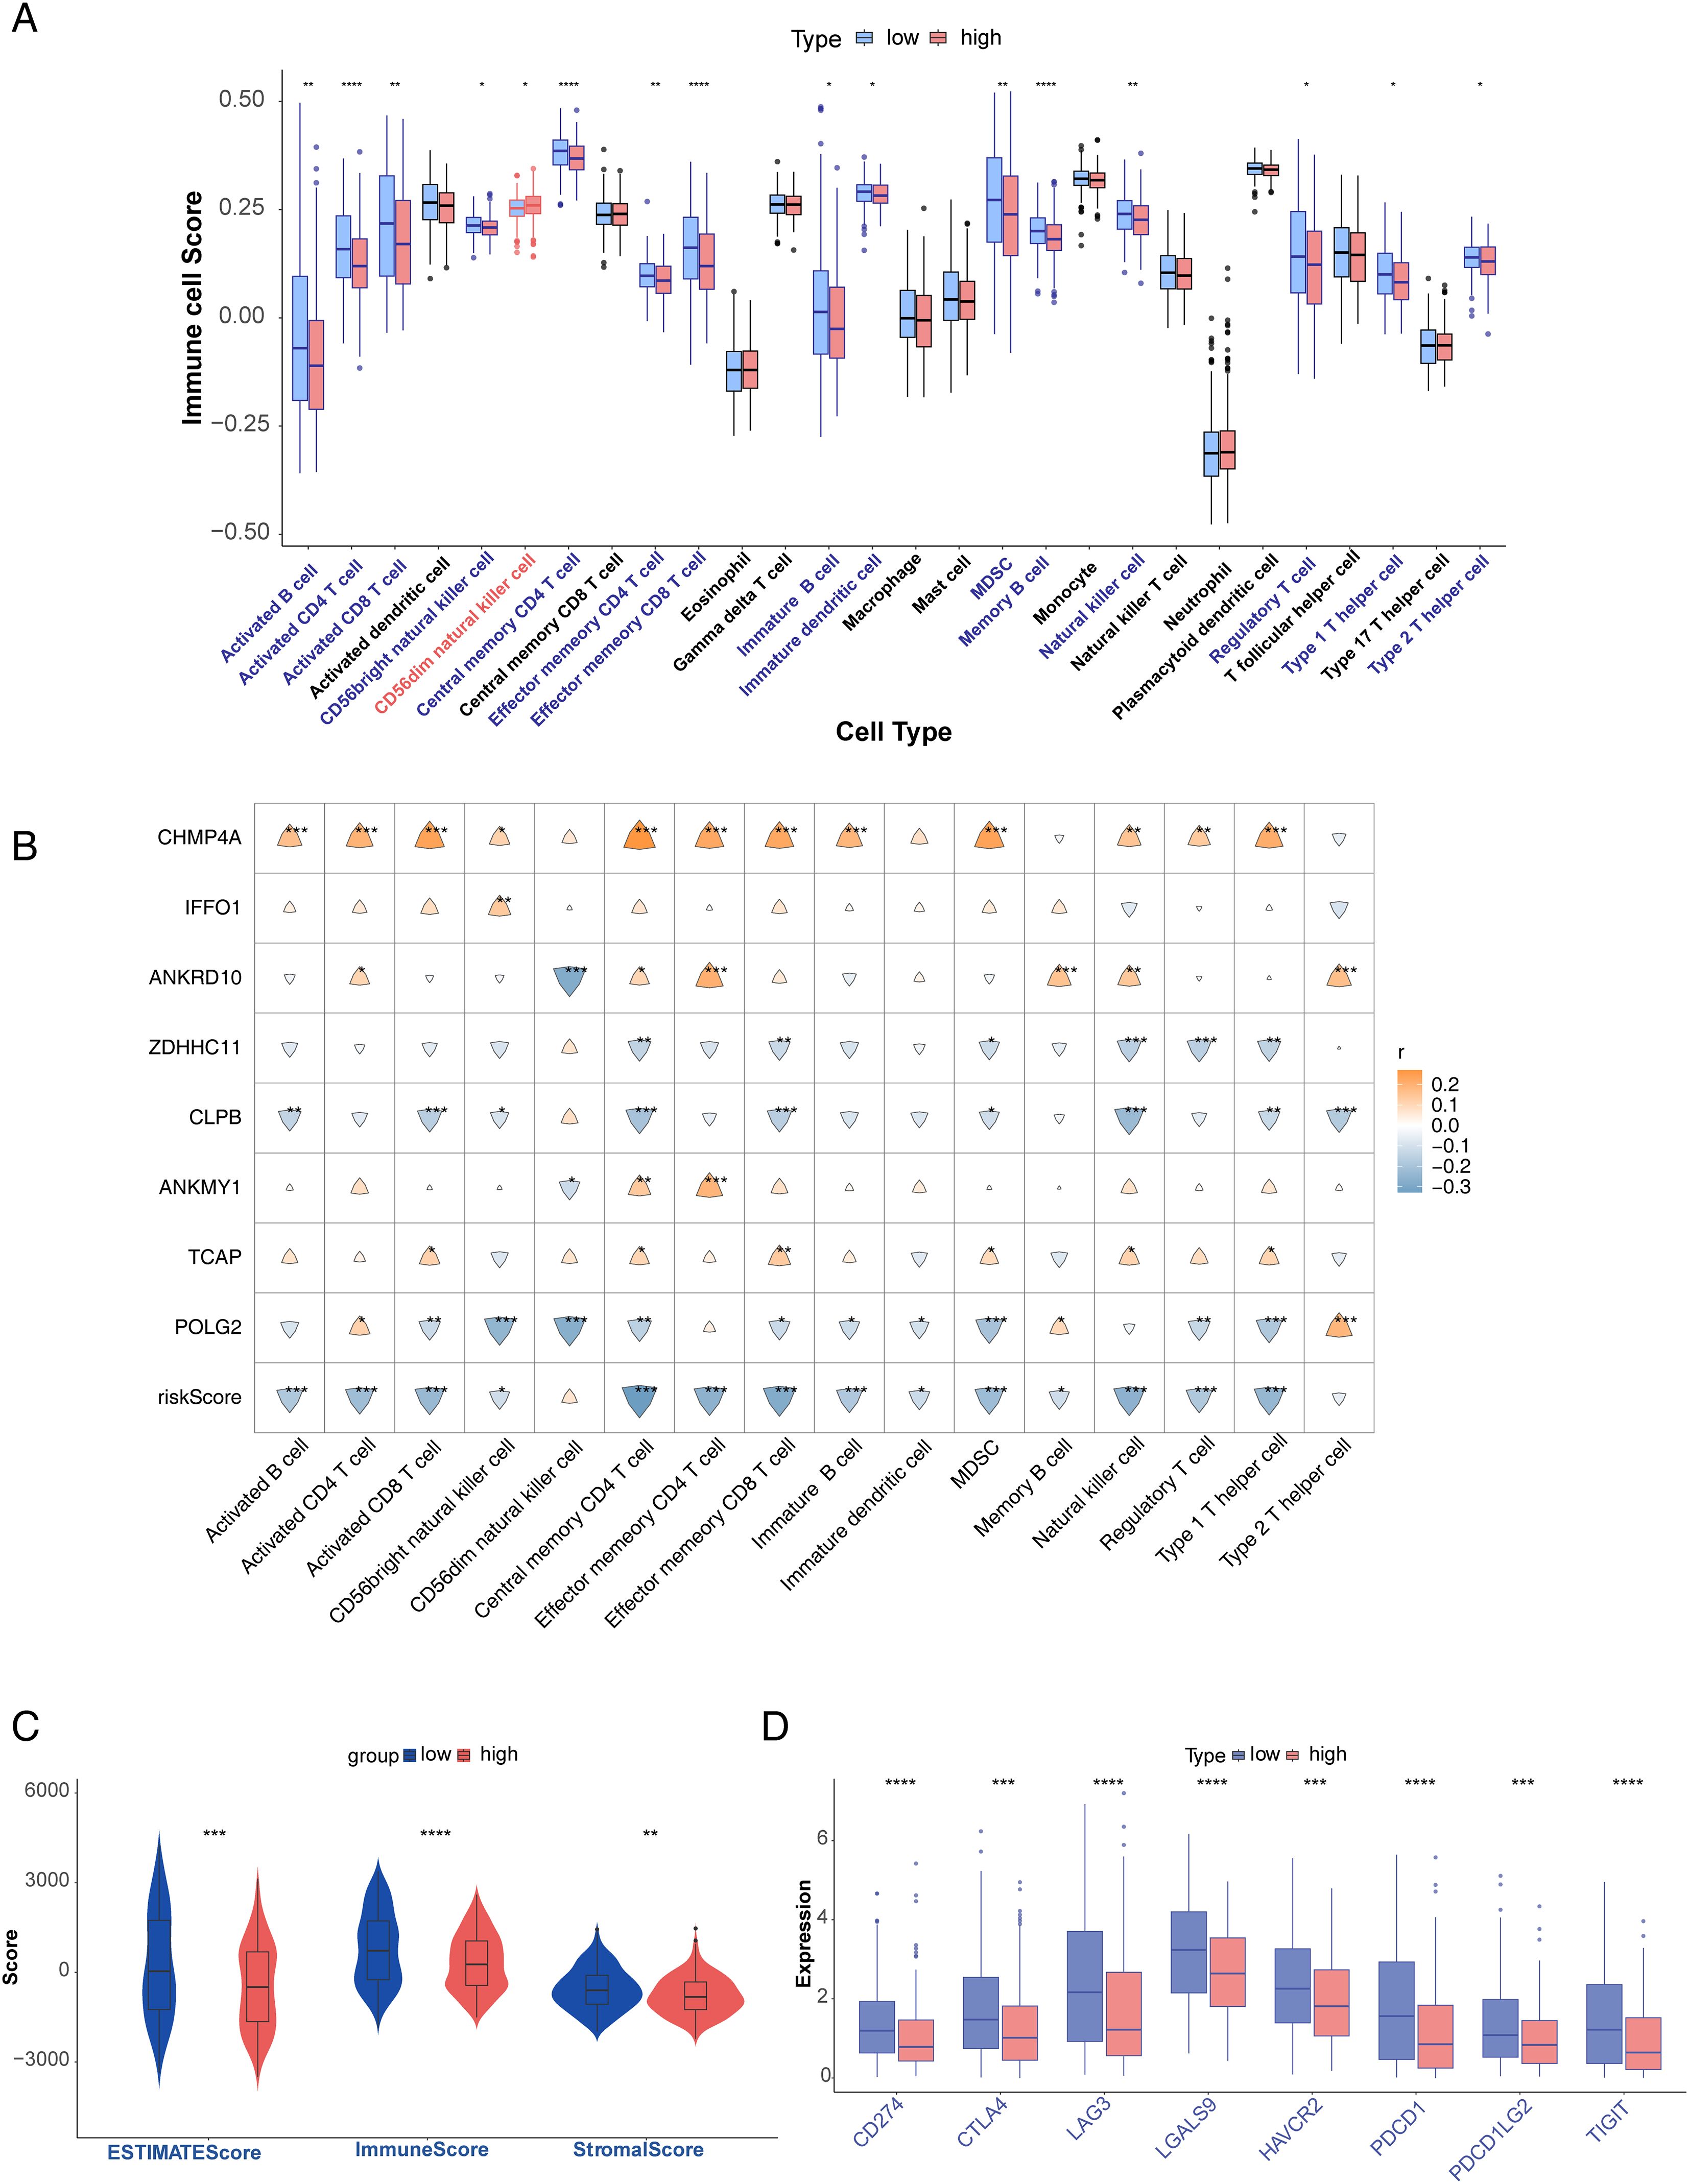
Figure 8. Analysis of immune microenvironment. (A) Differences in immune cell enrichment scores. (B) Correlation analysis of immune cells and prognostic genes. (C) ESTIMATE score and risk score, immune score and risk score, and stromal score and risk score. (D) Differential expression of immune checkpoints in high- and low-risk groups. *p<0.05, **p<0.01, ***p<0.001, and ****p<0.0001.
3.7 mRNA–miRNA network construction and drug sensitivity analysis
Drug sensitivity analysis revealed that the high-risk group was strongly sensitive to rapamycin (p < 0.0001, Figures 9A, B). A total of 81 miRNAs (e.g., hsa-miR-421, hsa-miR-449a, and hsa-miR-375) associated with the key genes were predicted using the starBase database (Figure 9C).
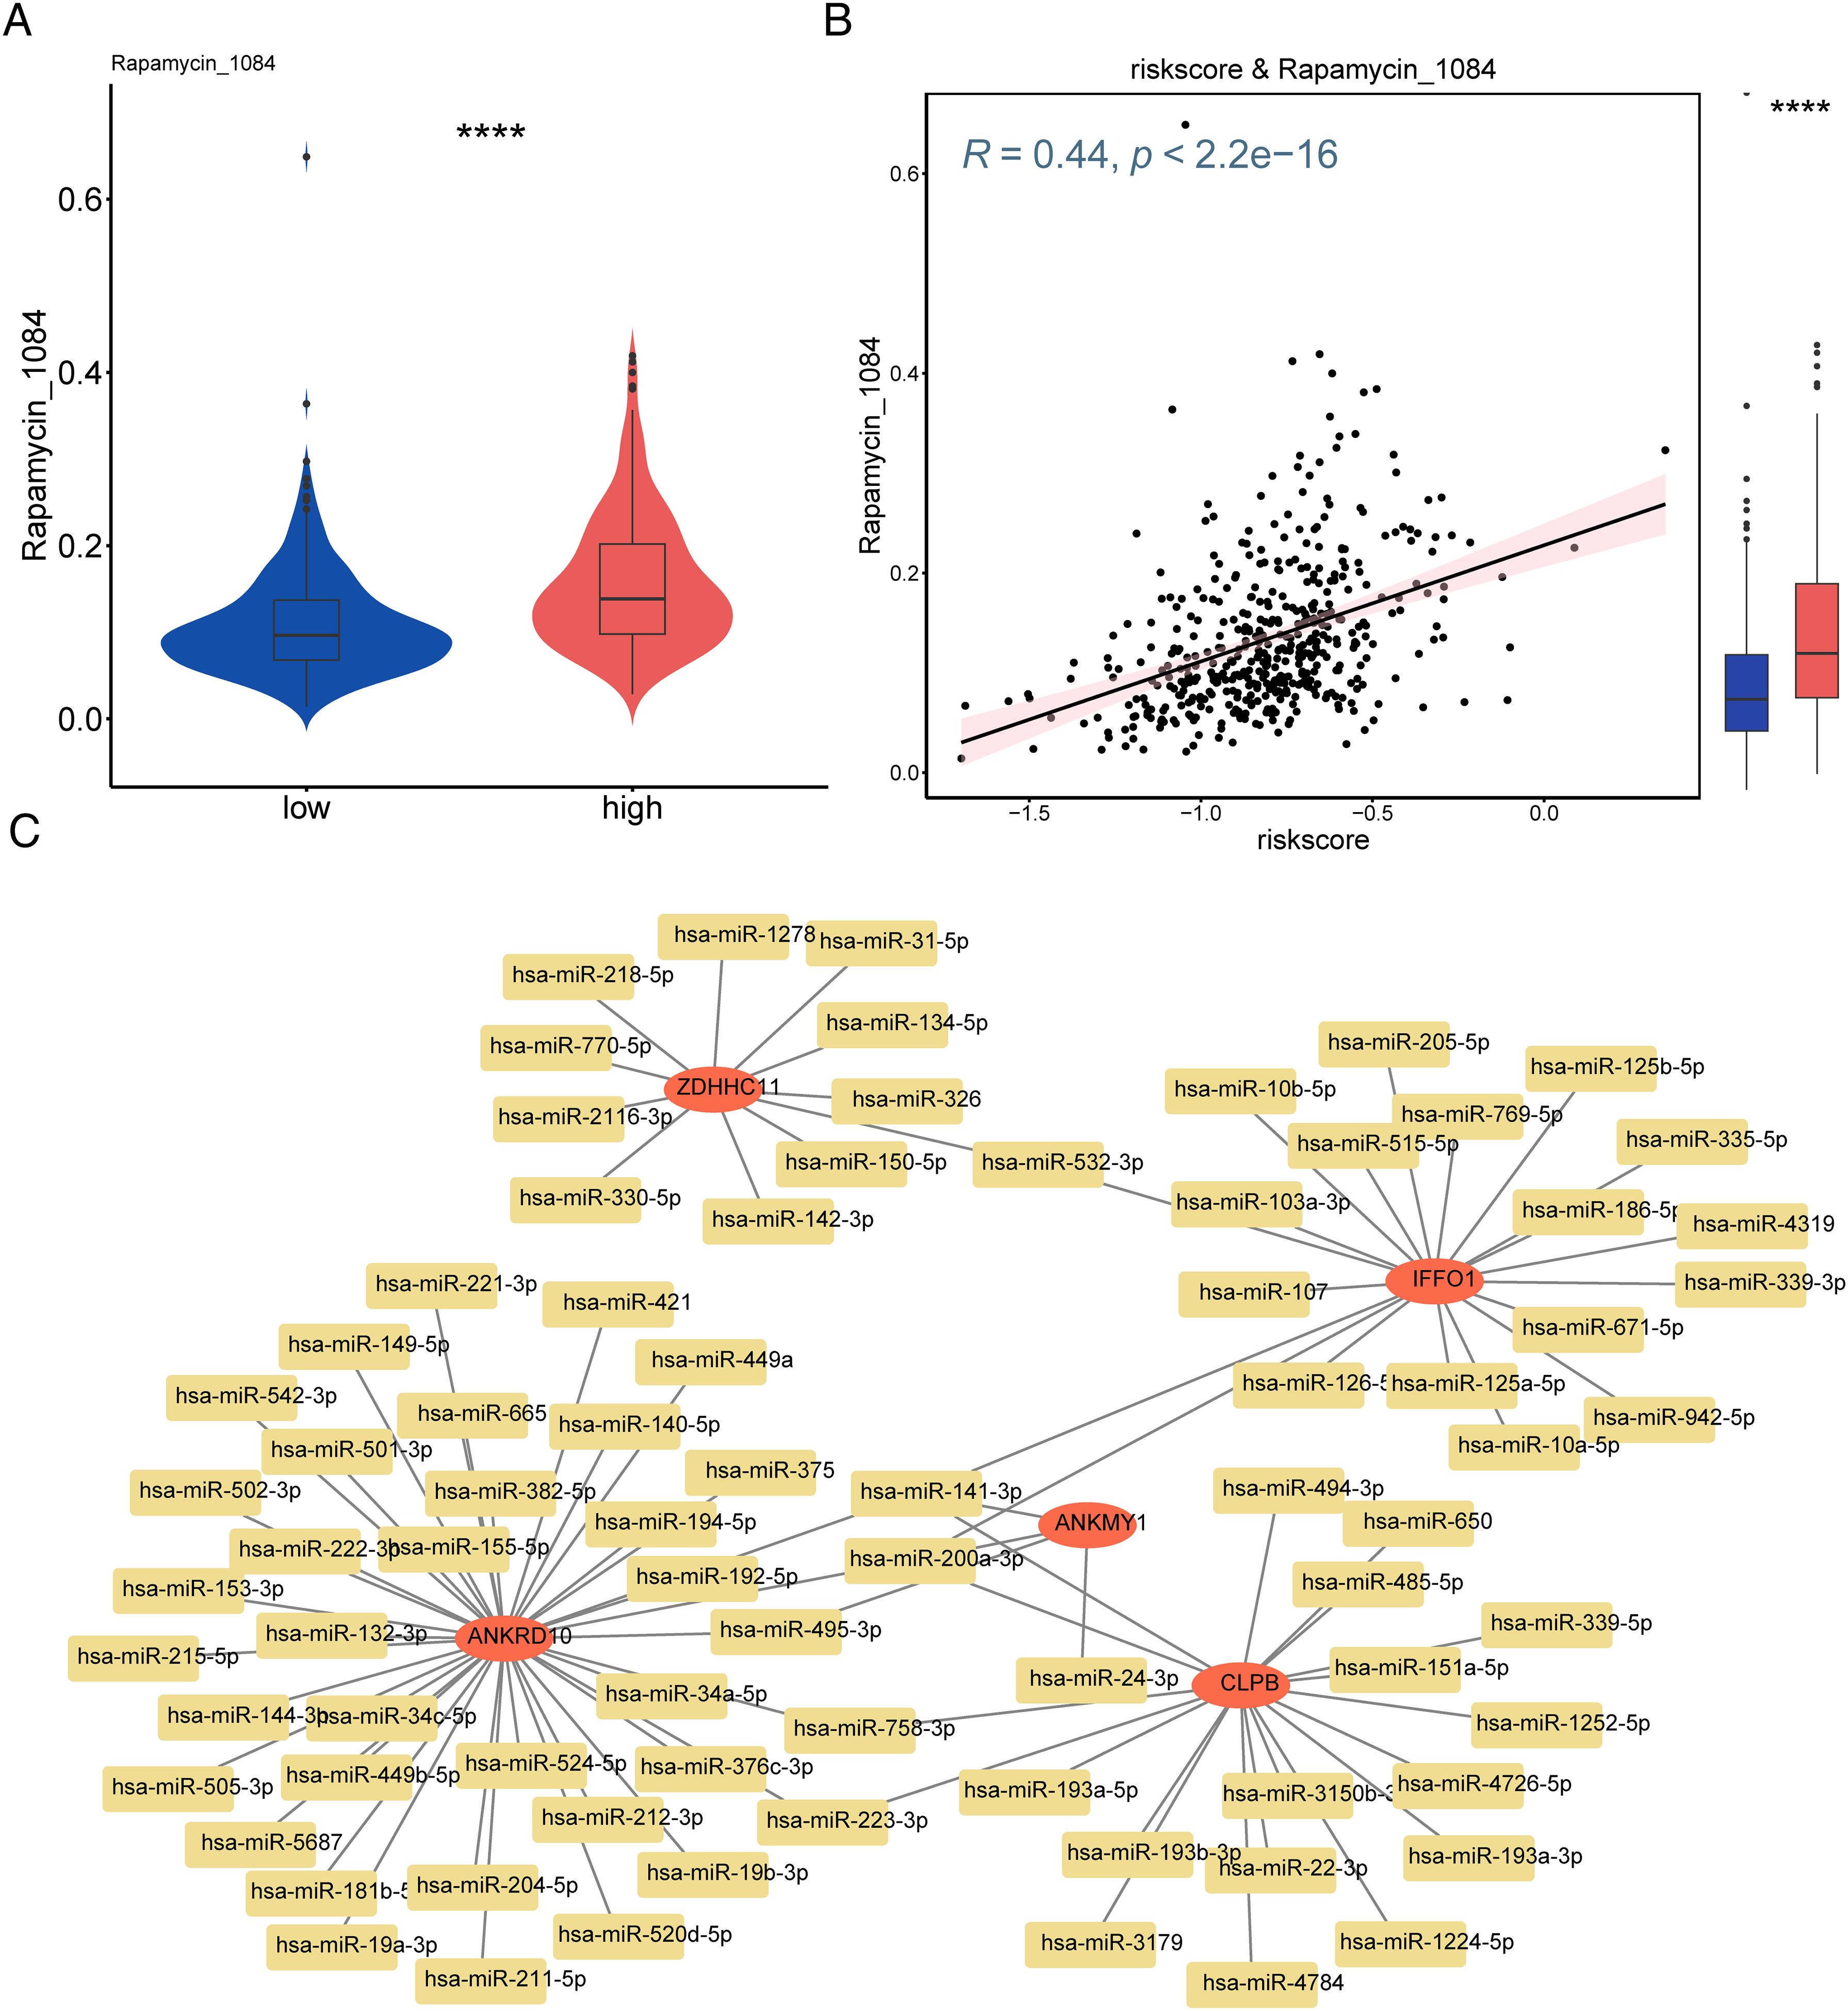
Figure 9. Screening of therapeutic agents for melanoma and constructed mRNA–miRNA network based on risk models. (A) Differences in drugs between high- and low-risk groups. (B) Scatter plot visualizing the correlation between drugs and risk scores. (C) Construction of the mRNA–miRNA interaction network. ****p<0.0001.
3.8 The expression of eight key genes in control individuals and patients with melanoma
In GSE46517, IFFO1, ANKRD10, CLPB, TCAP, and POLG2 displayed high expression, but the expression levels of CHMP4A, ZDHHC11, and ANKMY1 were low in the melanoma group (Figure 10A). The expression of these genes was further examined via RT-PCR in HACAT and melanoma cells (A375 and A2058). It was interesting that IFFO1, ANKRD10, and POLG2 were markedly upregulated and that CHMP4A was also markedly downregulated in A375 cells (Figure 10B), which was partially consistent with the results of biological analysis.
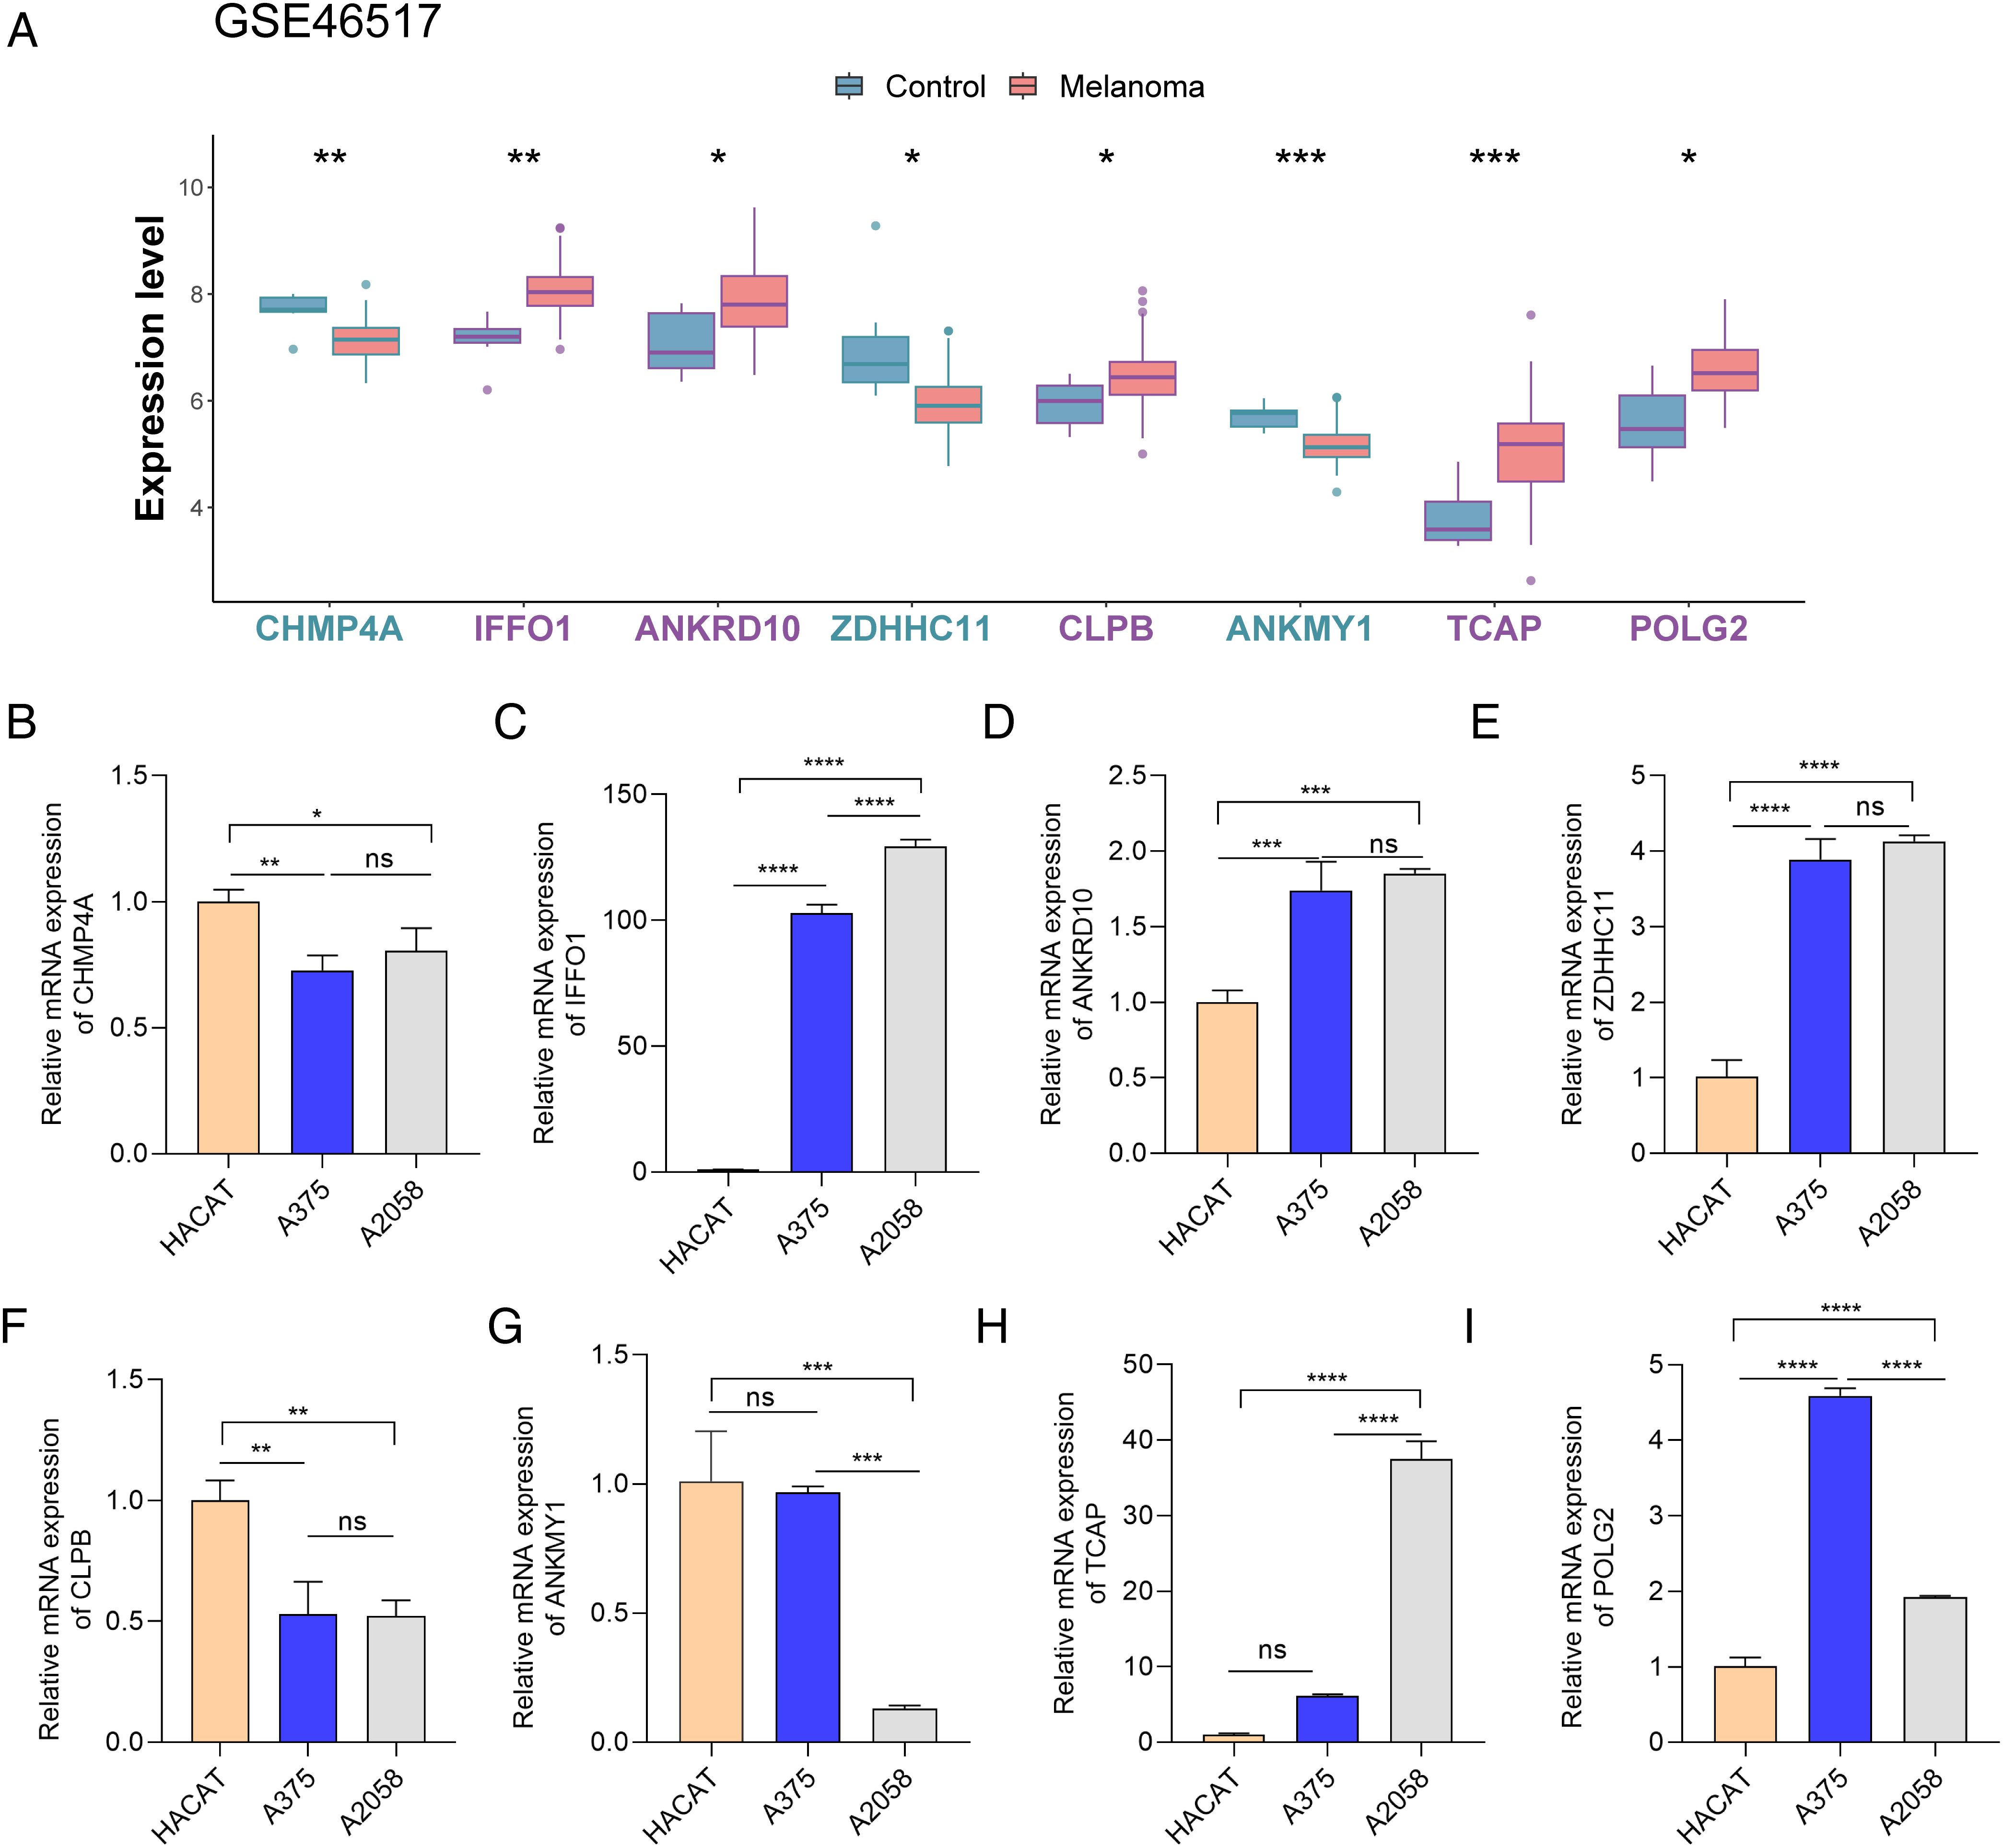
Figure 10. The expression of eight key genes in controls and melanoma patients. (A) The expression of eight key genes in GSE46517. (B–L) The expression of eight key genes between normal and melanoma cells (in HACAT, A375, and A2058cells). *p < 0.05, **p < 0.01, ***p < 0.001, and ****p < 0.0001. ns, p > 0.05.
4 Discussion
CM remains the most lethal form of skin cancer, with an annual increase of more than 3% (24). Gln metabolism plays a crucial role in tumor survival and progression (25). To elucidate key players in this pathway in melanoma, we integrated bulk RNA-seq and single-cell RNA-seq (scRNA-seq) data, identifying eight glutamine metabolism-related genes. Based on these genes, we developed a prognostic risk model that demonstrates robust performance in predicting glutamine metabolism activity and patient outcomes.
In this study, the eight-gene (CHMP4A, IFFO1, ANKRD10, ZDHHC11, CLPB, ANKMY1, TCAP, and POLG2) prognostic model had promising prognostic value, which was demonstrated by the ROC curve results. In addition, a nomogram combining prognostic models and clinicopathological factors accurately predicted the survival rate of melanoma patients at 3, 5, and 7 years. Based on the analysis of the relationship between the model and clinicopathological characteristics, the risk score was significantly associated with the Clark stage of melanoma patients and CD274 expression. It indicated that the model had predictive value for OS. The risk model demonstrated significantly reduced survival rates in high-risk patients, indicating a need for intensified therapeutic approaches. From an immunotherapy perspective, this model could contribute to identifying high-risk patients with poor immunotherapy response, prioritizing this subgroup for combined treatment in clinical practice. Crucially, prospective validation of the utility of the model in guiding treatment selection and prognosis management requires evaluation in clinical cohorts.
It was worth noting that the relationship between the eight key genes and glutamine metabolism in melanomas has not been reported. The abnormal expression of these genes in melanomas was further validated via RT-PCR. Among these genes, four genes (IFFO1, ANKRD10, POLG2, and TCAP) were significantly overexpressed, while two genes (CHMP4A and ANKMY1) had low expression via in vitro validation. ZDHHC11 and CLPB exhibited inconsistent expression trends between TCGA data and melanoma cells. This discrepancy may be attributed to the use of melanoma cancer cell lines for PCR validation, while the dataset covered melanoma tissue (26). IFFO1 is a non-homologous end-joining protein that plays a role in promoting the repair of DNA double-strand breaks (27). Previous studies have indicated that the expression levels of IFFO1 were associated with tumor progression and immune infiltration (28). Recently, IFFO1 inhibited tumor metastasis and reversed drug resistance through histone deacetylase and RNA methylation mechanisms in ovarian cancer (29). In our study, it was observed that IFFO1 could have a promoting effect on melanoma cells. ANKRD10, as a protein-coding gene, has not been extensively studied. It was reported that ANKRD10 affected antitumor activity by regulating morin treatment in tongue squamous carcinoma cells (30). ANKRD10 acted as a DNA methylation-driven gene in glioblastoma (31). In our study, ANKRD10 exhibited high expression in melanoma patients. POLG2 was essential for mammalian embryogenesis and mtDNA maintenance (32). However, the underlying molecular basis and functional significance of POLG2 in tumors were unknown. It may achieve unexpected results for the treatment and prognosis of tumors. Microarray analysis demonstrated that CHMP4A was used as a prognostic biomarker and druggable target for various diseases such as hepatocellular carcinoma, colorectal cancer, and ovarian carcinoma (33–35). CHMP4A revealed low expression in melanoma as a prognostic gene in our study. ZDHHC11, a member of the DHHC palmitoyl transferase family, regulated innate immune response to DNA virus by mediating the IFN-β promoter (36). In our study, ZDHHC11 was an unfavorable factor in melanoma and related to immune cells. There are little data on CLPB, TCAP, and ANKMY1 in malignancies. Defects in CLPB could cause neurological involvement and neutropenia (37). TCAP plays a role in cell adhesion and energy regulation of synaptogenesis in the vertebrate nervous system (38). ANKMY1, as a component regulating cytoskeleton organization, has not been reported in tumors (39). Combined with the above findings, it was first reported that the above GRGs could be closely related to the prognosis of melanoma.
ssGSEA displayed obvious differences in immune cell subpopulations between the high-risk and low-risk subgroups. It suggested that immune cells and immune function were related to GRGs in melanoma patients. The risk scores of eight prognostic genes varied among different immune cells in this work. Glutamine antagonism led to plasticity in the metabolism of cancer cells and effector T cells, which could become a new target for tumor immunotherapy (40). Some immune cells could promote antitumor immunity or have immunosuppressive effects in melanoma (41). Importantly, all immune checkpoint genes in our study exhibited low expression in the high-risk group. The reprogramming of glutamine metabolism regulated immune escape by modulating the expression of tumor PD-L1 in tumors (12). These results indicated that high-risk melanoma patients are intolerant to immunotherapy, resulting in poorer prognoses.
Rapamycin primarily inhibited melanoma by targeting the mTOR pathway (42). Through FKBP12-mediated suppression of mTORC1 activity, it reduced S6K and 4E-BP1 phosphorylation, thereby blocking tumor proliferation. Concurrently, rapamycin relieved mTORC1-mediated autophagy suppression and shifted cellular metabolism toward catabolic states (43). It further remodeled the tumor microenvironment via immune modulation and anti-angiogenesis while exhibiting synergy with pathways like MAPK (44, 45). Crucially, our drug sensitivity analysis revealed the remarkable effectiveness of rapamycin in high-risk melanoma subgroups. This differential response implied unique molecular dependencies, particularly mTOR network vulnerabilities in aggressive tumors. It displayed therapeutically exploitable selectivity beyond the canonical mechanisms of rapamycin. Collectively, these findings indicate that rapamycin exerts multi-targeted inhibitory effects on melanoma cell proliferation, survival, and the tumor microenvironment. This provides a theoretical foundation and identifies potential therapeutic targets for precision treatment In high-risk melanoma patients.
In summary, our study identified a significant correlation between the eight key genes and risk scores of immune cells/checkpoints in melanoma. Nevertheless, several important limitations are worth considering, such as requiring further validation in independent clinical cohorts and unresolved regulatory mechanisms of signature genes.
5 Conclusion
By integrating scRNA-seq and bulk RNA-seq data, multiple machine learning methods were applied to develop a novel prognostic model for predicting OS in melanoma patients. The model could be used to estimate the survival probability of melanoma patients. Additionally, the risk score of this model as an independent prognostic factor was strongly associated with Gln metabolism and clinicopathological characteristics. Overall, it could provide a reliable predictor of melanoma efficacy and potential avenues for the targeted treatment of melanoma in the future.
Data availability statement
The original contributions presented in the study are included in the article/Supplementary Material. Further inquiries can be directed to the corresponding authors.
Ethics statement
Ethical approval was not required for the studies on humans in accordance with the local legislation and institutional requirements because only commercially available established cell lines were used. Ethical approval was not required for the studies on animals in accordance with the local legislation and institutional requirements because only commercially available established cell lines were used.
Author contributions
HH: Conceptualization, Writing – review & editing. JY: Conceptualization, Methodology, Writing – original draft. JM: Data curation, Writing – original draft. CL: Resources, Writing – original draft. CW: Validation, Writing – original draft. FR: Methodology, Validation, Writing – original draft. JZ: Formal Analysis, Software, Writing – original draft. YZ: Investigation, Writing – original draft. LZ: Software, Writing – original draft. WZ: Validation, Writing – original draft. CA: Supervision, Writing – review & editing.
Funding
The author(s) declare financial support was received for the research and/or publication of this article. This study was supported by the National Natural Science Foundation of China (No. 82060504), the Applied Basic Research Foundation of Yunnan Province Science and Technology Department (No. 202301AT070246 and No. 202201AT070044), and Yunnan Provincial Health Commission’s Training Program for Medical Discipline Leaders (D-2024012). Yunnan Fundamental Research Kunming Medical University Projects (grant NO. 202501AY070001-110).
Conflict of interest
The authors declare that the research was conducted in the absence of any commercial or financial relationships that could be construed as a potential conflict of interest.
Publisher’s note
All claims expressed in this article are solely those of the authors and do not necessarily represent those of their affiliated organizations, or those of the publisher, the editors and the reviewers. Any product that may be evaluated in this article, or claim that may be made by its manufacturer, is not guaranteed or endorsed by the publisher.
Supplementary material
The Supplementary Material for this article can be found online at: https://www.frontiersin.org/articles/10.3389/fonc.2025.1485006/full#supplementary-material
References
1. Siegel RL, Giaquinto AN, and Jemal A. Cancer statistics, 2024, CA. Cancer J Clin. (2024) 74:12–49. doi: 10.3322/caac.21820
2. Long GV, Swetter SM, Menzies AM, Gershenwald JE, and Scolyer RA. Scolyer. Cutaneous melanoma. Lancet. (2023) 402:485–502. doi: 10.1016/s0140-6736(23)00821-8
3. Curti BD and Faries MB. Recent advances in the treatment of melanoma. N Engl J Med. (2021) 384:2229–40. doi: 10.1056/NEJMra2034861
4. Stachyra-Strawa P, Ciesielka M, Janiszewski M, and Grzybowska-Szatkowska L. The role of immunotherapy and molecular−targeted therapy in the treatCutaneous melanoma, ment of melanoma. Oncol Rep. (2021) 46:158. doi: 10.3892/or.2021.8109
5. Shannan B, Perego M, Somasundaram R, and Herlyn M. Heterogeneity in melanoma. Cancers. (2022) 14:3030. doi: 10.3390/cancers14123030
6. Bernfeld E and Foster DA. Glutamine as an essential amino acid for KRas-driven cancer cells. Trends Endocrinol Metab. (2019) 30:357–68. doi: 10.1016/j.tem.2019.03.003
7. Li J, Ye Y, Liu Z, Zhang G, Dai H, Li J, et al. Macrophage mitochondrial fission improves cancer cell phagocytosis induced by therapeutic antibodies and is impaired by glutamine competition. Nat Cancer. (2022) 3:453–70. doi: 10.1038/s43018-022-00354-5
8. Cai WF, Zhang C, Wu YQ, Zhuang G, Ye Z, Zhang CS, et al. Glutaminase GLS1 senses glutamine availability in a non-enzymatic manner triggering mitochondrial fusion. Cell Res. (2018) 28:865–7. doi: 10.1038/s41422-018-0057-z
9. Wise DR and Thompson CB. Glutamine addiction: a new therapeutic target in cancer. Trends Biochem Sci. (2010) 35:427–33. doi: 10.1016/j.tibs.2010.05.003
10. Lukey MJ, Katt WP, and Cerione RA. Cerione, targeting therapy resistance: when glutamine catabolism becomes essential. Cancer Cell. (2018) 33:795–7. doi: 10.1016/j.ccell.2018.04.009
11. Matés JM, Campos-Sandoval JA, Santos-Jiménez JL, and Márquez J. Dysregulation of glutaminase and glutamine synthetase in cancer. Cancer Lett. (2019) 467:29–39. doi: 10.1016/j.canlet.2019.09.011
12. Ma G, Zhang Z, Li P, Zhang Z, Zeng M, Liang Z, et al. Reprogramming of glutamine metabolism and its impact on immune response in the tumor microenvironment. Cell Commun Signal. (2022) 20:114. doi: 10.1186/s12964-022-00909-0
13. Kim J. Regulation of immune cell functions by metabolic reprogramming. J Immunol Res. (2018) 2018:8605471. doi: 10.1155/2018/8605471
14. Grillo E, Corsini M, Rayell C, Zammataro L, Bacci M, Morandi A, et al. Expression of activated VEGFR2 by R1051Q mutation alters the energy metabolism of Sk-Mel-31 melanoma cells by increasing glutamine dependence. Cancer Lett. (2021) 507:80–8. doi: 10.1016/j.canlet.2021.03.007
15. Ritchie ME, Phipson B, Wu D, Hu Y, Law CW, Shi W, et al. limma powers differential expression analyses for RNA-sequencing and microarray studies. Nucleic Acids Res. (2015) 43:e47. doi: 10.1093/nar/gkv007
16. Wu T, Hu E, Xu S, Chen M, Guo P, Dai Z, et al. clusterProfiler 4.0: A universal enrichment tool for interpreting omics data. Innovation. (2021) 2:100141. doi: 10.1016/j.xinn.2021.100141
17. Hnzelmann S, Castelo R, and Guinney J. GSVA: gene set variation analysis for microarray and RNA-Seq data. BMC Bioinf. (2013) 14:7. doi: 10.1186/1471-2105-14-7
18. Langfelder P and Horvath S. WGCNA: an R package for weighted correlation network analysis. BMC Bioinf. (2008) 9:559. doi: 10.1186/1471-2105-9-559
19. Li Y, Lu F, and Yin Y. Applying logistic LASSO regression for the diagnosis of atypical Crohn’s disease. Sci Rep. (2022) 12:11340. doi: 10.1038/s41598-022-15609-5
20. Ramsay IS, Ma S, Fisher M, Loewy RL, Ragland JD, Niendam T, et al. Model selection and prediction of outcomes in recent onset schizophrenia patients who undergo cognitive training. Schizophr Res Cognit. (2017) 11:1–5. doi: 10.1016/j.scog.2017.10.001
21. Heagerty PJ, Lumley T, and Pepe MS. Time-dependent ROC curves for censored survival data and a diagnostic marker. Biometrics. (2004) 56:337–44. doi: 10.1111/j.0006-341X.2000.00337.x
22. Sachs MC. plotROC: A tool for plotting ROC curves. J Stat Software. (2017) 79:1–24. doi: 10.18637/jss.v079.c02
23. Charoentong P, Finotello F, Angelova M, Mayer C, Efremova M, Rieder D, et al. Pan-cancer immunogenomic analyses reveal genotype-immunophenotype relationships and predictors of response to checkpoint blockade. Cell Rep. (2017) 18:248–62. doi: 10.1016/j.celrep.2016.12.019
24. Stachyra-Strawa P, Ciesielka M, Janiszewski M, and Grzybowska-Szatkowska L. The role of immunotherapy and molecular−targeted therapy in the treatment of melanoma (Review). Oncol Rep. (2021) 46:158. doi: 10.3892/or.2021.8109
25. Zhu L, Zhu X, and Wu Y. Effects of glucose metabolism, lipid metabolism, and glutamine metabolism on tumor microenvironment and clinical implications. Biomolecules. (2022) 12:580. doi: 10.3390/biom1204058
26. Gupta RK and Kuznicki J. Biological and medical importance of cellular heterogeneity deciphered by single-cell RNA sequencing. Cells. (2020) 9:1751. doi: 10.3390/cells9081751
27. Li W, Bai X, Li J, Zhao Y, Liu J, Zhao H, et al. The nucleoskeleton protein IFFO1 immobilizes broken DNA and suppresses chromosome translocation during tumorigenesis. Nat Cell Biol. (2019) 21:1273–85. doi: 10.1038/s41556-019-0388-0
28. Ghosh D and Raghavan SC. Nonhomologous end joining: new accessory factors fine tune the machinery. Trends Genet. (2021) 37:582–99. doi: 10.1016/j.tig.2021.03.001
29. Zhang Ye, Qiu J-G, Jia X-Y, Ke Y, Zhang M-K, Stieg D, et al. METTL3-mediated N6-methyladenosine modification and HDAC5/YY1 promote IFFO1 downregulation in tumor development and chemo-resistance. Cancer Lett. (2023) 553:215971. doi: 10.1016/j.canlet.2022.215971
30. Ji Y, Jia L, Zhang Y, Xing Y, Wu X, Zhao B, et al. Antitumor activity of the plant extract morin in tongue squamous cell carcinoma cells. Oncol Rep. (2018) 40:3024–32. doi: 10.3892/or.2018.6650
31. Wang Z, Gao L, Guo X, Lian W, Deng K, and Xing B. Development and validation of a novel DNA methylation-driven gene based molecular classification and predictive model for overall survival and immunotherapy response in patients with glioblastoma: A multiomic analysis. Front Cell Dev Biol. (2020) 8:576996. doi: 10.3389/fcell.2020.576996
32. Wojtaszek JL, Hoff KE, Longley MJ, Kaur P, Andres SN, Wang H, et al. Structure-specific roles for PolG2-DNA complexes in maintenance and replication of mitochondrial DNA. Nucleic Acids Res. (2023) 51:9716–32. doi: 10.1093/nar/gkad679
33. Ma L, Yu H, Zhu Y, Xu K, Zhao A, Ding L, et al. Isolation and proteomic profiling of urinary exosomes from patients with colorectal cancer. Proteome Sci. (2023) 21:3. doi: 10.1186/s12953-023-00203-y
34. Shahrisa A, Tahmasebi-Birgani M, Ansari H, Mohammadi Z, Carloni V, and Mohammadi Asl J. The pattern of gene copy number alteration (CNAs) in hepatocellular carcinoma: an in silico analysis. Mol Cytogenet. (2021) 14:33. doi: 10.1186/s13039-021-00553-2
35. Laskowski TJ, Biederstädt A, and Rezvani K. Natural killer cells in antitumour adoptive cell immunotherapy. Nat Rev Cancer. (2022) 22:557–75. doi: 10.1038/s41568-022-00491-0
36. Liu Y, Zhou Q, Zhong L, Lin H, Hu MM, Zhou Y, et al. ZDHHC11 modulates innate immune response to DNA virus by mediating MITA-IRF3 association. Cell Mol Immunol. (2018) 15:907–16. doi: 10.1038/cmi.2017.146
37. Baker1 MJ, Blau KU, Anderson AJ, Palmer CS, Fielden LF, Crameri JJ, et al. CLPB disaggregase dysfunction impacts the functional integrity of the proteolytic SPY complex. J Cell Biol. (2024) 223:e202305087. doi: 10.1083/jcb.202305087
38. Dodsworth TL and Lovejoy DA. Role of teneurin C-terminal associated peptides (TCAP) on intercellular adhesion and communication. Front Neurosci. (2022) 16:868541. doi: 10.3389/fnins.2022.868541
39. Svirid AV, Ershov PV, Yablokov EO, Kaluzhskiy LA, Mezentsev YV, Florinskaya AV, et al. Direct molecular fishing of new protein partners for human thromboxane synthase. Acta Naturae. (2017) 9:92–100. doi: 10.32607/2075851-2017-9-4-92-100
40. Wu Y, Yi M, Niu M, Mei Q, and Wu K. Myeloid-derived suppressor cells: an emerging target for anticancer immunotherapy. Mol Cancer. (2022) 21:184. doi: 10.1186/s12943-022-01657-y
41. Li C, Jiang P, Wei S, Xu X, and Wang J. Regulatory T cells in tumor microenvironment: new mechanisms, potential therapeutic strategies and future prospects. Mol Cancer. (2020) 19:116. doi: 10.1186/s12943-020-01234-1
42. Laplante M and Sabatini DM. mTOR signaling in growth control and disease. Cell. (2012) 149:274–93. doi: 10.1016/j.cell.2012.03.017
43. Yang H, Rudge DG, Koos JD, Vaidialingam B, Yang HJ, and Pavletich NP. mTOR kinase structure, mechanism and regulation. Nature. (2013) 497:217–23. doi: 10.1038/nature12122
44. Pangilinan C, Klionsky DJ, and Liang C. Emerging dimensions of autophagy in melanoma. Autophagy. (2024) 20:1700–11. doi: 10.1080/15548627.2024.2330261
Keywords: glutamine metabolism, melanoma, prognosis, immune microenvironment, bioinformatics
Citation: Hu H, Yang J, Miao J, Li C, Wang C, Ran F, Zou J, Zhang Y, Zhao L, Zhao W and Ai C (2025) Developing a prognostic model of glutamine metabolism-related genes associated with clinical features and immune status in melanoma. Front. Oncol. 15:1485006. doi: 10.3389/fonc.2025.1485006
Received: 23 August 2024; Accepted: 31 July 2025;
Published: 20 August 2025.
Edited by:
Chiara Moltrasio, Fondazione IRRCS Ca’ Granda Ospedale Maggiore Policlinico, ItalyReviewed by:
Sandhya Annamaneni, Osmania University, IndiaSandro Goruppi, Harvard Medical School, United States
Copyright © 2025 Hu, Yang, Miao, Li, Wang, Ran, Zou, Zhang, Zhao, Zhao and Ai. This is an open-access article distributed under the terms of the Creative Commons Attribution License (CC BY). The use, distribution or reproduction in other forums is permitted, provided the original author(s) and the copyright owner(s) are credited and that the original publication in this journal is cited, in accordance with accepted academic practice. No use, distribution or reproduction is permitted which does not comply with these terms.
*Correspondence: Hongyan Hu, aHVob25neWFuNjI1QDEyNi5jb20=; Conghui Ai, YWlqaWEyMzExOWFpQDE2My5jb20=
†These authors have contributed equally to this work and share first authorship