- 1Department of Radiology, The Fourth Hospital of Harbin Medical University, Harbin, China
- 2GE Healthcare, MR Research China, Beijing, China
Background and objective: Lung-RADS ≥4A nodules require urgent intervention. Low-dose CT (LDCT), the primary screening tool, involves cumulative radiation exposure—critical for patients with serial scans. Oxygen-enhanced zero-echo time MRI (OE-ZTE-MRI) shows potential for lung nodule evaluation. However, its additive value when combined with CT radiomics and clinical factors for Lung-RADS ≥4A nodules remains unproven. This study aimed to develop a preoperative prediction model integrating OE-ZTE-MRI/CT radiomics and clinical factors for benign-malignant discrimination of Lung-RADS ≥4A nodules and compare its performance against single-modality models.
Methods: 99 nodules from 84 prospectively enrolled patients undergoing both LDCT and OE-ZTE-MRI were included. Nodule boundaries were manually contoured as regions of interest (ROIs) on both modalities. Six machine learning classifiers were applied to radiomic features (extracted from LDCT and OE-ZTE-MRI) and clinical parameters (age, smoking history, nodule diameter, calcification, etc.). Model performance was evaluated using receiver operating characteristic (ROC) curves with area under the curve (AUC), complemented by decision curve analysis (DCA). Univariate and multivariate logistic regression identified independent predictors, which were incorporated into a final nomogram to visualize clinical-radiomic prediction.
Results: MRI model had a similar diagnostic performance to CT model (MRI vs. CT: training cohort AUC: 0.854 vs 0.907; testing cohort AUC: 0.769 vs 0.798). Multi-radiomics model achieved the highest diagnostic efficiency (train cohort AUC:0.923; testing cohort AUC: 0.813). Multivariate Logistic regression showed that nodule diameter (p=0.005) and calcification (p=0.029) were important factors affecting the benign and malignant nodules. The nomogram constructed by 3 models(CT/OE-ZTE-MRI/Clinical factors) achieved the best preoperative prediction performance for benign and malignant nodules (training cohort: AUC 0.941; testing cohort AUC:0.838).
Conclusion: The nomogram combining OE-ZTE-MRI/CT radiomics and clinical factors (nodule diameter, calcification) improves preoperative discrimination of Lung-RADS ≥4A nodules (AUC=0.838), outperforming single-modality models. This tool enables evidence-based triage, potentially reducing unnecessary invasive procedures.
Introduction
Lung cancer has become the leading cause of cancer-related deaths worldwide (1). Making clinical decisions for lung nodules of different risk levels as early as possible is an important means of preventing and treating cancer (2, 3). According to the Lung Imaging Reporting and Data System (Lung-RADS), solid nodules larger than 8mm or some part-solid nodules are defined as high-risk nodules (4)of 4A and above, requiring LDCT scans every three months or timely clinical intervention. However, continuous LDCT scans may increase radiation accumulation, leading to the malignancy of certain nodules. Pulmonary MRI scans have many advantages, including no ionizing radiation (5, 6), suitability for follow-up (7), and low noise (8).
Compared to traditional MRI imaging, UTE and ZTE (9, 10) aim to eliminate artifacts as much as possible with TE less than 1ms or even shorter, quickly converting quantitative signal parameters into easily distinguishable images (8, 9). A recent study demonstrated that ZTE sequences provide superior signal-to-noise ratio (SNR) and contrast-to-noise ratio (CNR) compared to UTE for pulmonary nodule detection (8). In addition, some reports (10, 11)have demonstrated that the use of ZTE-MRI has similar diagnostic performance to CT in Lung-RADS grading or lung density. Radiomics—systematically extracting quantitative imaging features from lesion and perilesional regions using automated, high-throughput computational algorithms—enables non-invasive characterization by correlating these features with clinical/pathological outcomes to identify optimal biomarkers for lesion evaluation (12). The combination of UTE or ZTE in Oxygen Enhancement (OE) technology successfully extracted and compared radiomics features from lung OE-UTE-MRI images and CT images (13). Some scholars have combined OE-UTE-MRI with quantitative MRI sequences and successfully identified the invasiveness of certain lung cancers (14).
In recent years, researchers have combined relevant radiomic parameters from CT and MRI to successfully predict postoperative adjuvant treatment patterns in gastric cancer (15). However, at the present stage, there are few studies combining OE-ZTE-MRI with CT. Meanwhile, there is an urgent need to find a method to combine multimodal radiomics with clinical parameters to accurately predict the benignancy or malignancy of high-risk nodules before surgery.
Therefore, this study is to construct a multimodel using CT and OE-ZTE-MRI radiomics features with clinical factors to predict the benign and malignant nodules before surgery and improve the preoperative prediction accuracy of lung nodules. Additionally, this study compares the performance of the multimodal radiomics model with the single radiomics model in preoperative prediction.
Materials and methods
This is a prospective study, and the hospital’s Ethics Review Committee approved all procedures. The study adheres to the principle of complete confidentiality of subject information, and all researchers have full control over the provided radiological data.
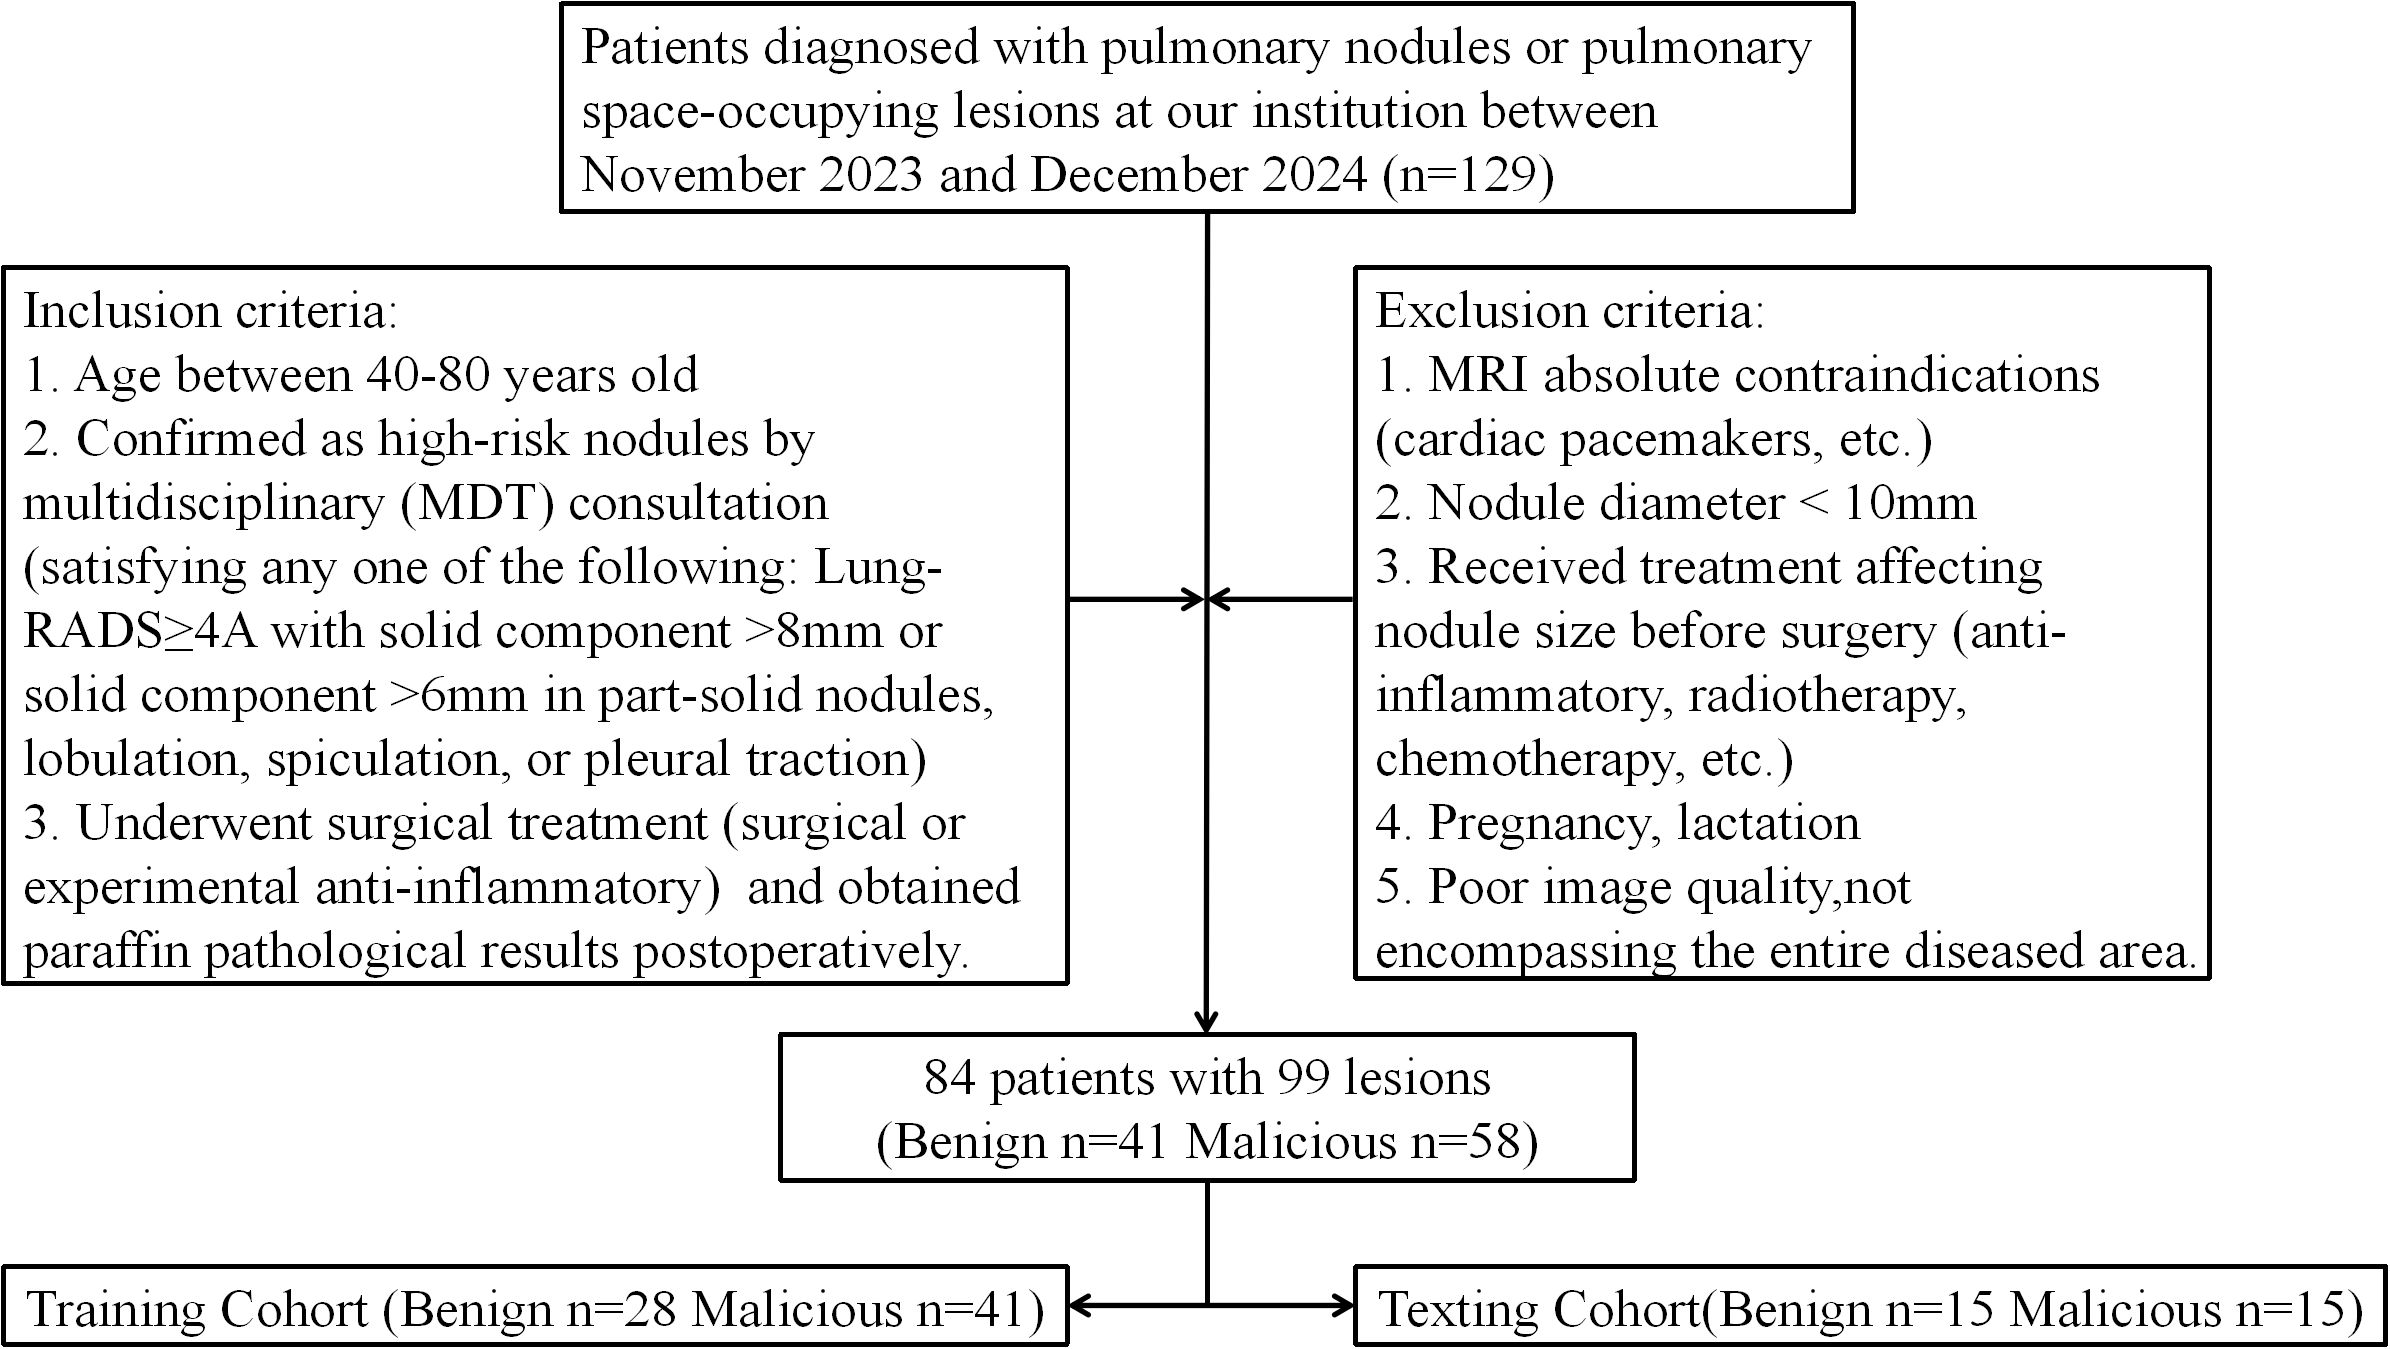
The principles of ≪Declaration of Helsinki≫ conducting the study, and patients had full informed consent rights. From November 2023 to December 2024, patients diagnosed with “lung nodules” in the thoracic surgery department of our hospital were consecutively collected. These patients underwent chest CT and chest OE-ZTE-MRI examinations in our hospital and were preparing for surgical treatment. The inclusion criteria were: 1. Age between 40–80 years old; 2. Confirmed as high-risk nodules by multidisciplinary (MDT) consultation (satisfying any one of the following: Lung-RADS≥4A with solid component >8mm or solid component >6mm in part-solid nodules, lobulation, spiculation, or pleural traction); 3. Underwent treatment (surgical or experimental anti-inflammatory) and obtained paraffin pathological results postoperatively. The exclusion criteria were: 1. MRI absolute contraindications (cardiac pacemakers, etc.); 2. Nodule diameter < 10mm; 3. Received treatment affecting nodule size before surgery (anti-inflammatory, radiotherapy, chemotherapy, etc.); 4. Pregnancy, lactation;5. Poor image quality, not encompassing the entire diseased area. Huang et al.’s (16) result showed that UTE sequences achieve 100% detection sensitivity for pulmonary nodules ≥10 mm. This study excluded nodules <10 mm in diameter to ensure complete OE-ZTE-MRI visualization and accurate same-session CT co-registration for all enrolled lesions. According to the expert consensus in some Asian countries, it is recommended to conduct lung cancer screening for people over 40 years old with high-risk factors (17). And to comprehensively consider factors such as the physical functions of the elderly population, we have set the upper age limit at 80 years old. For some patients, there were multiple nodules in their lungs. These patients could obtain pathological results separately through surgical resection or CT-guided puncture. Each nodule’s pathological result was considered an independent diagnostic result. Based on the complete pathological results of this study, the outcome events were divided into benign and malignant groups. Figure 1 illustrates the patient selection process and exclusion criteria. The dataset of this study was randomly divided into training and test sets in a 7:3 ratio.
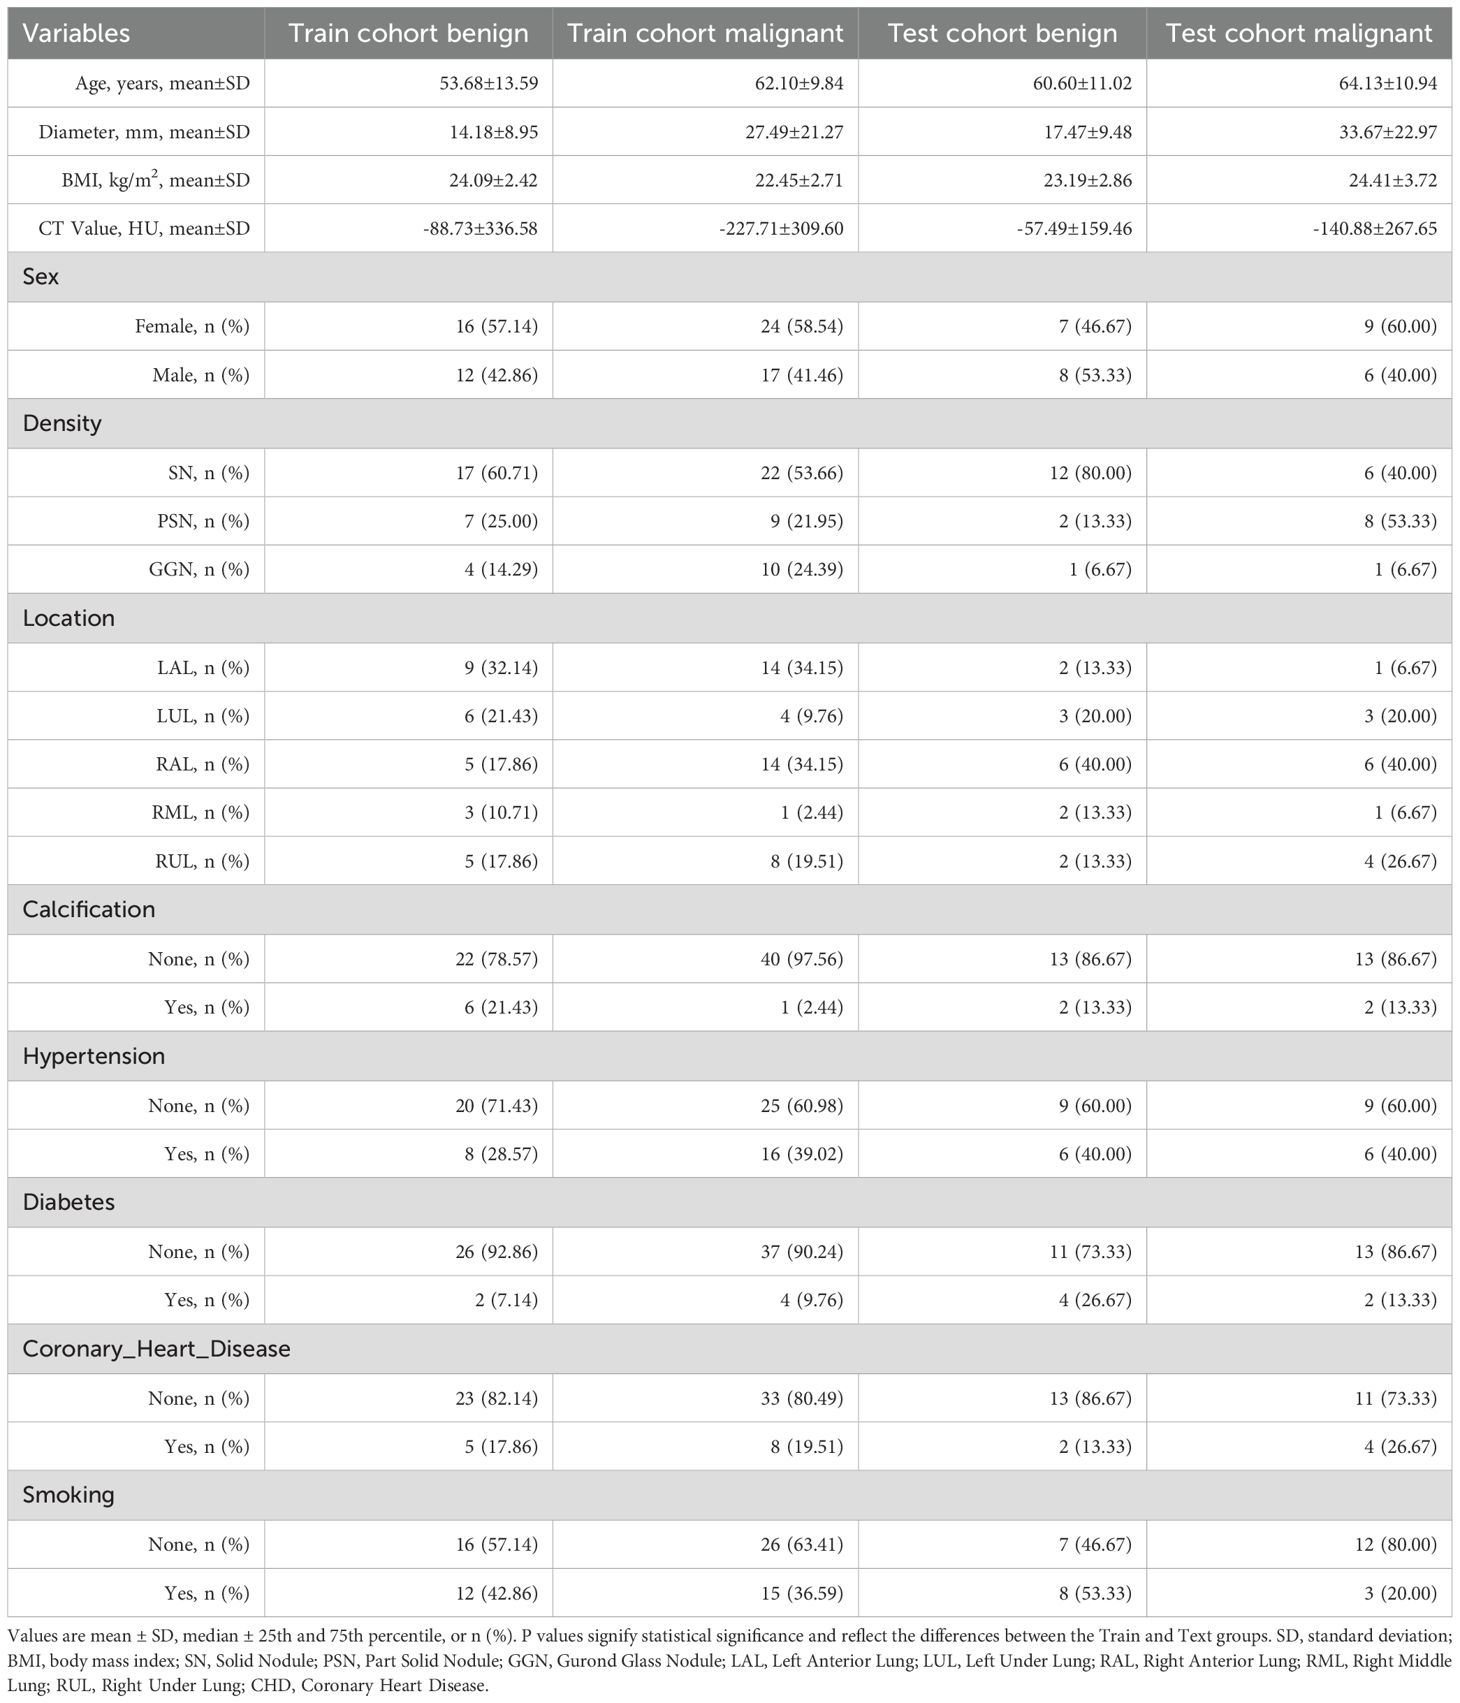
All patient information and scan data from the Picture Archiving and Communication System (PACS) were anonymized to obtain the final imaging results and saved accordingly. Clinical information of patients was collected through the electronic medical record system, including: 1) Age; 2) Gender; 3) Maximum nodule diameter; 4) Body Mass Index (BMI); 5) Hypertension; 6) Diabetes; 7) Coronary Heart Disease (CHD); 8) Smoking history (18–21). All relevant demographic data and related information are summarized in Table 1. The nodules were independently evaluated by two radiologists to ensure accuracy. All nodules were jointly evaluated by two radiologists with extensive experience to have at least one of lobulation, spiculation, pleural traction, or nodule composition (i.e., Lung-RADS≥4A), and were included in this study after screening.
MRI scanning protocol
All patient MRI scans were performed using a 3-T MRI device (Signa Premier, GE Healthcare) with a 32-channel spine coil and a 16-channel abdominal coil. The scanning parameters were as follows: repetition time/echo time: 770.4 ms/0.02 ms; field of view: 420 × 420 mm²; slice thickness: 2 mm; flip angle: 2°; voxel size:1.4×1.4×2.0; bandwidth: 45.46 kHz; flip angle: 2°; number of slices: 80-120 (depending on patient height).
The average acquisition time using OE-ZTE-MRI technology was 290 seconds (range: 285–407 s). Before starting the MRI scan, patients were manually instructed to inhale oxygen for two minutes. Subsequently, patients breathed nominally 100% oxygen (i.e., OE-ZTE-MRI sequence). The total MRI scan time did not exceed 7 minutes.
CT scanning protocol
All patients underwent CT scans using 256-slice or higher CT scanners to obtain images and were diagnosed with “lung nodules” by two radiologists. During the scan, patients were scanned from the thoracic inlet, starting at the suprasternal notch, to the costophrenic angle. The scanning parameters were as follows: field of view: 256×256 mm² or 332×332 mm²; tube current: automatic; tube voltage: automatic (using automatic exposure control, depending on the patient’s weight). Images were reconstructed using standard mode and a slice thickness of 1-1.25 mm, and only preoperative images were used for image analysis. All CT results are plain scans, and contrast agents were not used.
Feature extraction, selection, model construction, and statistical analysis
This study selected axial chest CT and OE-ZTE-MRI for feature extraction. We only chose T↓2-weighted images from the OE-ZTE-MRI sequence to compare with CT images. This choice was based on the findings of Ohno et al (22).
The DICOM medical digital images from CT and OE-ZTE-MRI were imported into the open-source software ITK-snap, and ROIs were delineated layer by layer using manual or semi-automatic methods. The tumor margins were delineated on CT images with a window width of 1600 HU and a window level of -600 HU and manually delineated layer by layer on OE-ZTE-MRI images with appropriate contrast. A radiologist with 20 years of experience in chest imaging diagnosis will carefully consider the relationship between the nodule and blood vessels or bronchi. According to the standardized CT imaging protocol, the radiologist will distinguish the nodule from the surrounding normal tissues. Meanwhile, under different imaging modalities, the radiologist will segment the pulmonary nodules based on factors such as the density of the tumor or the signal intensity on MRI images to ensure the rigor of nodule segmentation. Image segmentation was independently performed by two experienced radiologists who were blinded to the patients’ histopathology.
Since CT and OE-ZTE-MRI are different scanners with different data acquisition protocols, the data from these sequences usually have heterogeneous voxel spacing. It is necessary to preprocess these images. In this heterogeneous voxel spacing, we referred to the suggestions given in previous literature (23, 24). Spatial normalization was used to reduce the impact of voxel spacing variations, and fixed-resolution resampling was used to address the above issues. All images were resampled to a voxel size of 1×1×1 mm3 to standardize voxel spacing and standardized using z-score normalization (zero-mean normalization).
Feature selection
The open-source installer named ‘PyRadiomics’ was used on Python to extract signal intensity features and texture features from the raw images. This software allows the resampling of both sets of sequence images to a voxel size of 1×1×1 mm. All the calculation formulas and the pipeline can be found at https://pyradiomics.readthedocs.io/en/latest/.iomic features. Z-score normalization was employed to address the issue of varying scales in manual radiomic features.
We performed a Mann-Whitney U test and feature screening for all radiomic features. Only the radiomic features with p < 0.05 were kept (230 CT features, 51 OE-ZTE-MRI features, and 281 CT-MRI features). For features with high repeatability, Pearson’s rank correlation coefficient was also used to calculate the correlation between features, and one of the features with a correlation coefficient greater than 0.9 between any two features is retained. After this, 67 CT features, 28 OE-ZTE-MRI features, and 50 CT-MRI features were kept. A Least Absolute Shrinkage and Selection Operator (LASSO) regression model was used for model construction on the discovery dataset. Depending on the tuning weight λ, LASSO shrinks all regression coefficients toward zero and sets the coefficients of many irrelevant features to zero. To find an optimal λ, a 10-fold cross-validation with the minimum standard was used, where the final value of λ produced the minimum cross-validation error. The regression model was fitted using the retained non-zero coefficient features and combined into a model. The Python scikit-learn package was used for LASSO regression modeling.
Radiomics model construction
After LASSO feature selection, the final features were input into a Support Vector Machine (SVM) to construct the risk model. The following classifiers were used for machine learning, and a 5-fold cross-validation was employed to obtain the final radiomics model. Six machine learning classifiers with AUC > 0.69 were selected in descending order for this study. The ROC curve was plotted to evaluate the diagnostic performance of the prediction model, and the corresponding AUC value, sensitivity (SEN), specificity (SPE), positive predictive value (PPV), and negative predictive value (NPV) were analyzed. Decision curve analysis (DCA) was plotted to evaluate clinical effectiveness.
Clinical model construction
Features for establishing the clinical model were selected through baseline demographic statistics. The same machine-learning models were used in the construction of the clinical model. A 5-fold cross-validation and test cohort were set up for fair comparison. Only the statistics screened by univariate and multivariate logistic regression models were finally included in the construction of the final model. Ultimately, the nomogram was constructed and compared with other models.
Statistical analysis
Statistical analysis of radiomics was performed using Python and SPSS software packages. Shapiro-Wilk test was used to evaluate the normality of continuous data. Normally distributed continuous variables were expressed as mean ± standard deviation, while non-normally distributed variables were expressed as median and interquartile range. Categorical variables were analyzed using the chi-square test or Fisher’s test and expressed as absolute values (percentages). Paired AUC comparisons between classifiers were performed using DeLong’s test. Multivariate logistic regression analysis was used to determine statistically significant imaging parameters (two-tailed p < 0.05 was considered statistically significant) for inclusion in the multimodel. Area Under Curve (AUC) and accuracy (ACC) were calculated, along with their 95% confidence intervals. SEN, SPE, negative NPV, and PPV were also calculated. Hosmer-Lemeshow test was used to assess the goodness of fit. p < 0.05 was considered statistically significant.
Results
Baseline demographic characteristics
A total of 84 patients with 99 nodules clinically diagnosed with “pulmonary lesions” were included in this study. The average age of the patients was 59.80 ± 11.86 years, and Table 1 shows other demographic data. Our statistical results showed no significant differences in high-risk factors such as age and gender between the two groups (p > 0.05). Among them, 41 nodules were benign, and 58 nodules were malignant. The majority of malignant nodules were adenocarcinomas (n=39,n=39.3%), squamous carcinomas (n=3,3.0%), and small-cell carcinomas (n=5,5.0%), and some of the malignant nodules were inoperable and were referred to conservative treatment (n=11,11.1%). Among benign nodules, there were some nodules with a clinical decision of benign and loss of pathological findings (n=17,17.1%), inflammatory nodules that shrank or disappeared after treatment (n=6,6%), alveolar epithelial hyperplasia (n=7,7%), misshapen tumors (n=4;4%), larger tuberculous foci (n=2,2%), benign mediastinal tumors (neurosphincteric tumors n=1;1% and benign cystic thymic adenoma n=1; 1%), adenomatoid hyperplasia (n=1,1%), mesenchymal tumors (n=1,1%) and sclerosing anaplastic tumors (n=1,1%).
Figure 2 shows the workflow of this study. A total of 2394 radiomics features (1197 per sequence, with the multi-radiomics model screening features from both sequences together) were extracted from CT and OE-ZTE-MRI images. The best features were input into the SVM model. The optimal model consisted of the following six models: 1. NativeBayes; 2. KNN; 3. Decision Tree; 4. LightGBM; 5. AdaBoost; 6. MLP. After three rounds of screening, 16 CT features, 5 OE-ZTE-MRI features, and 12 CT-MRI features were finally included in the analysis (Figure 3).

Figure 2. Workflow of radiomic analysis in the study. Radiologists segmented nodules, and LASSO selected features based on which the prediction model, MSE, and weight were built. Finally, the Combined Model, Calibration, and nomogram were built. Example figures (A, C) are CT images of the benign and malignant groups, respectively, while figures (B, D) are OE-ZTE-MRI images of the benign and malignant groups, respectively.
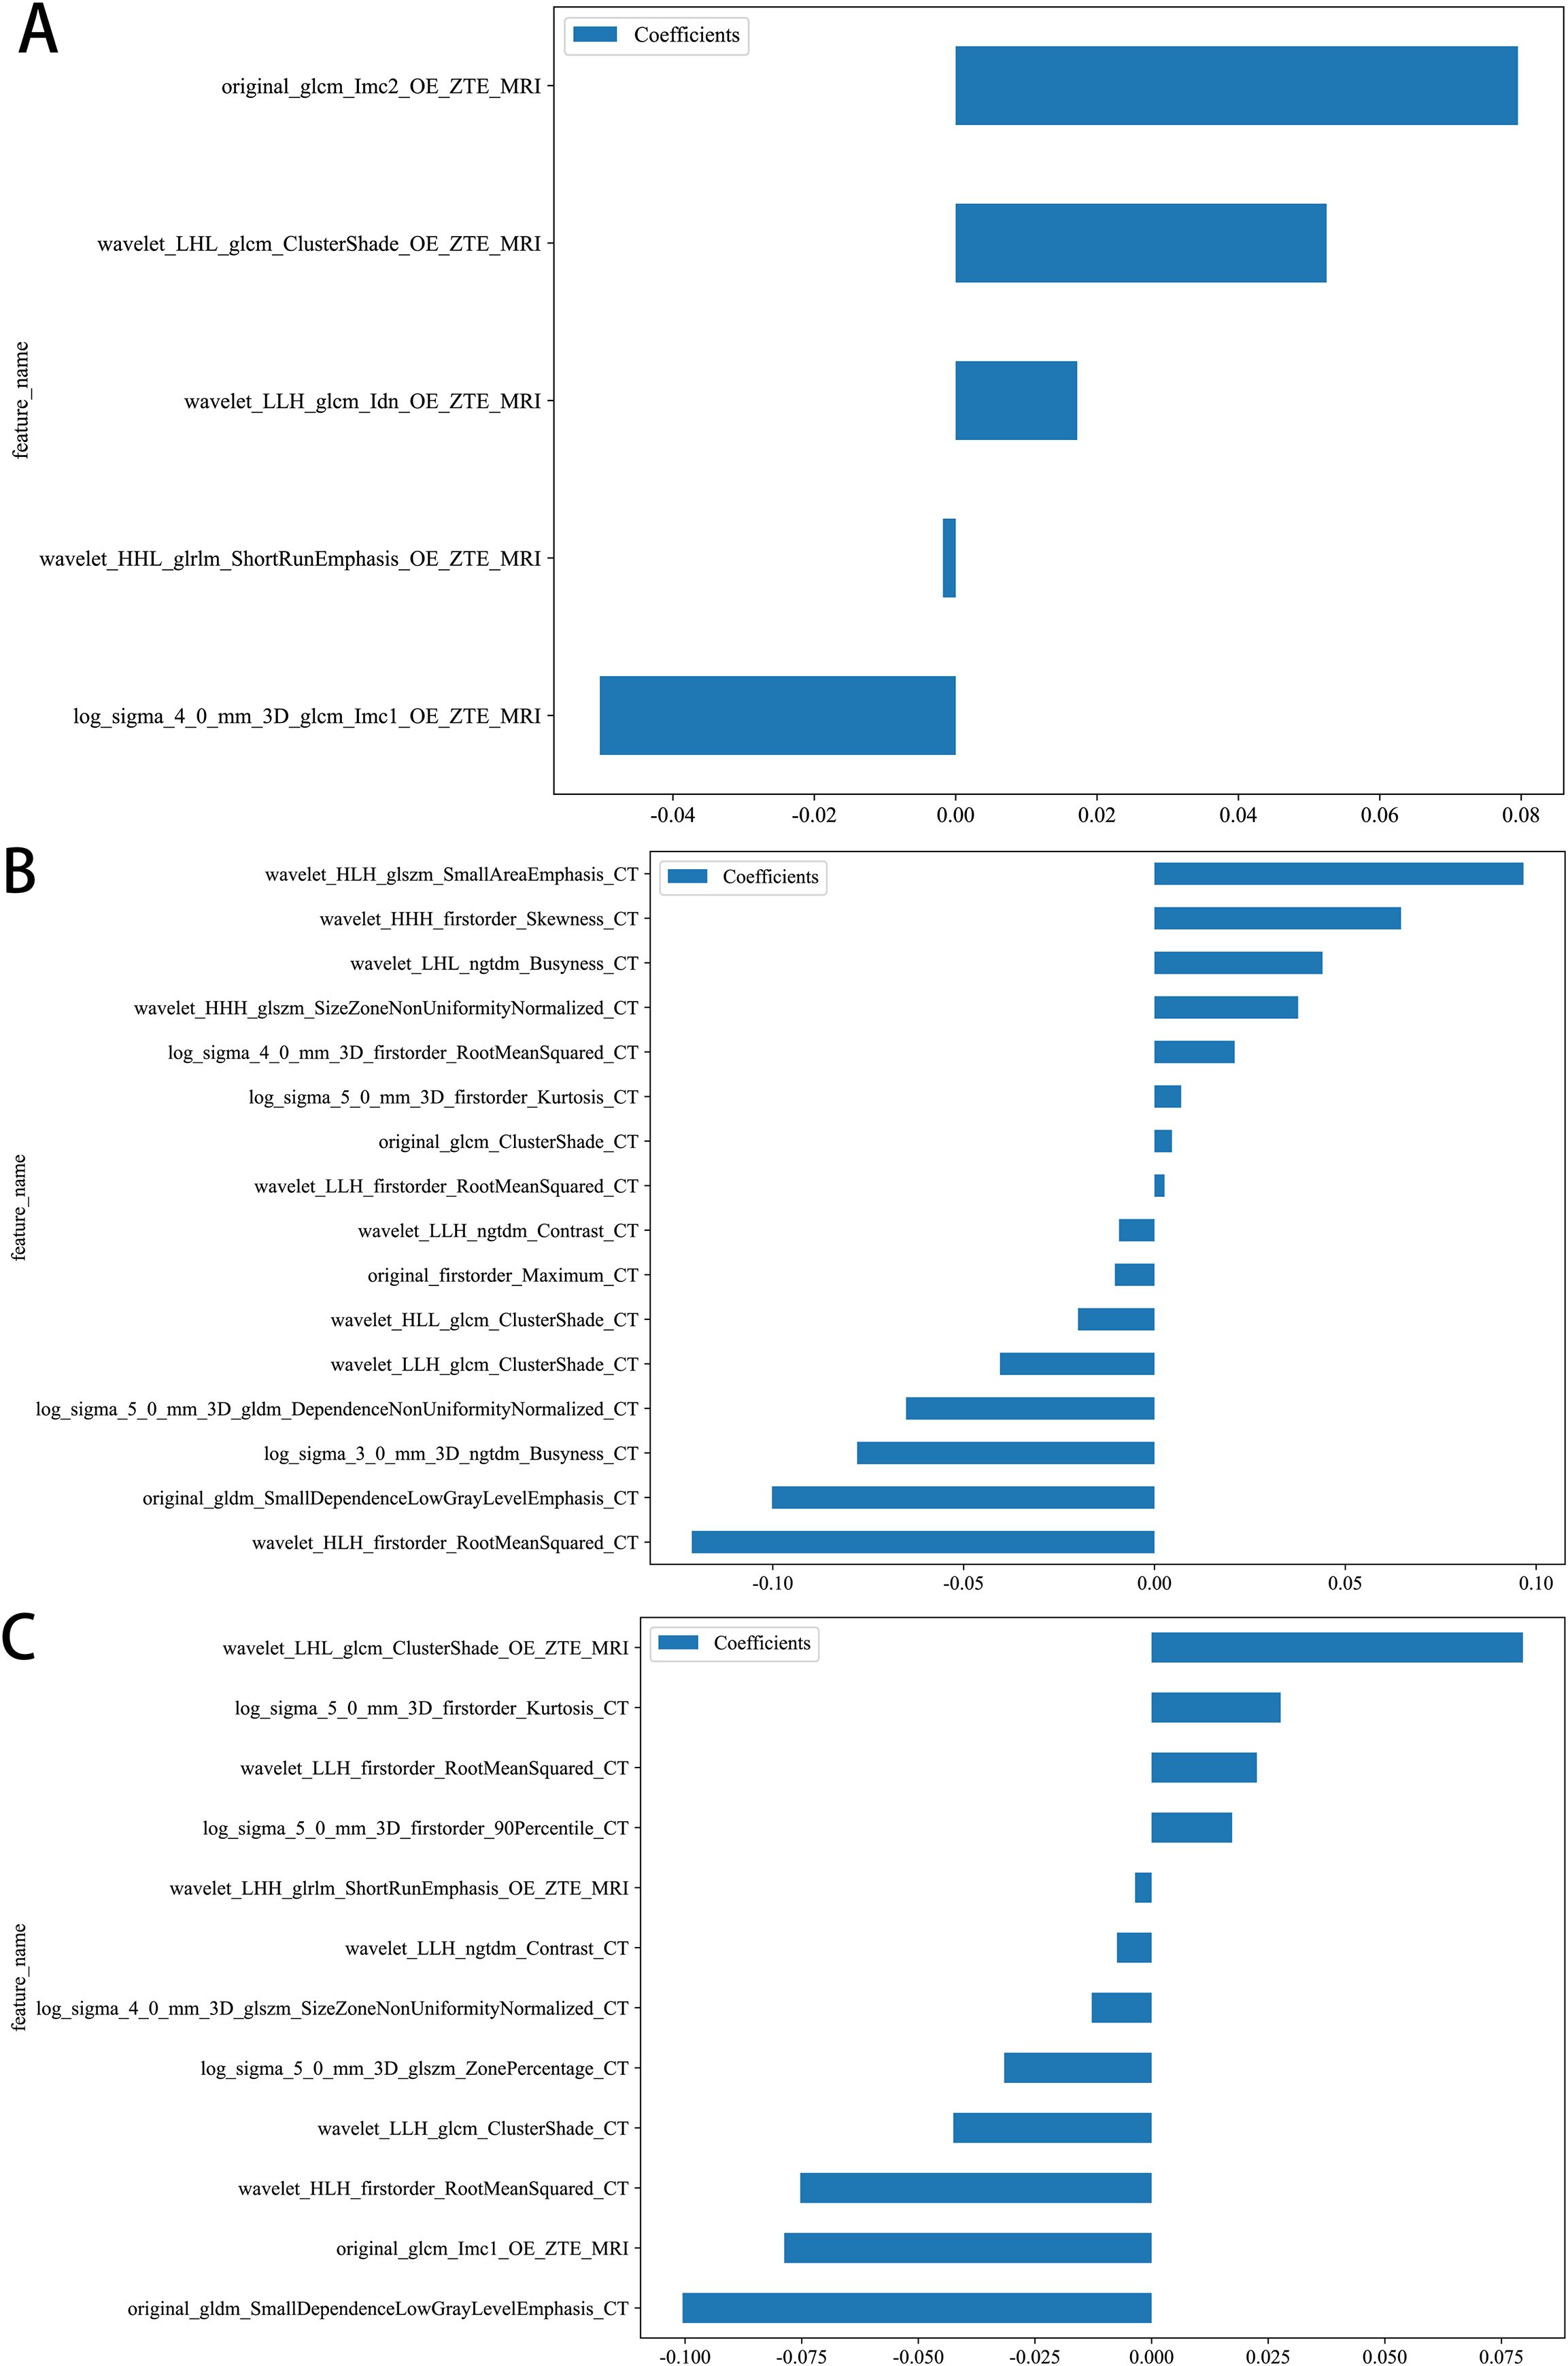
Figure 3. Retained radiomics features and their corresponding coefficients in different models after regression analysis by LASSO. (A) OE-ZTE-MRI model,(B) CT model, (C) CT-MRI model.
Analysis of single and multi-radiomics model
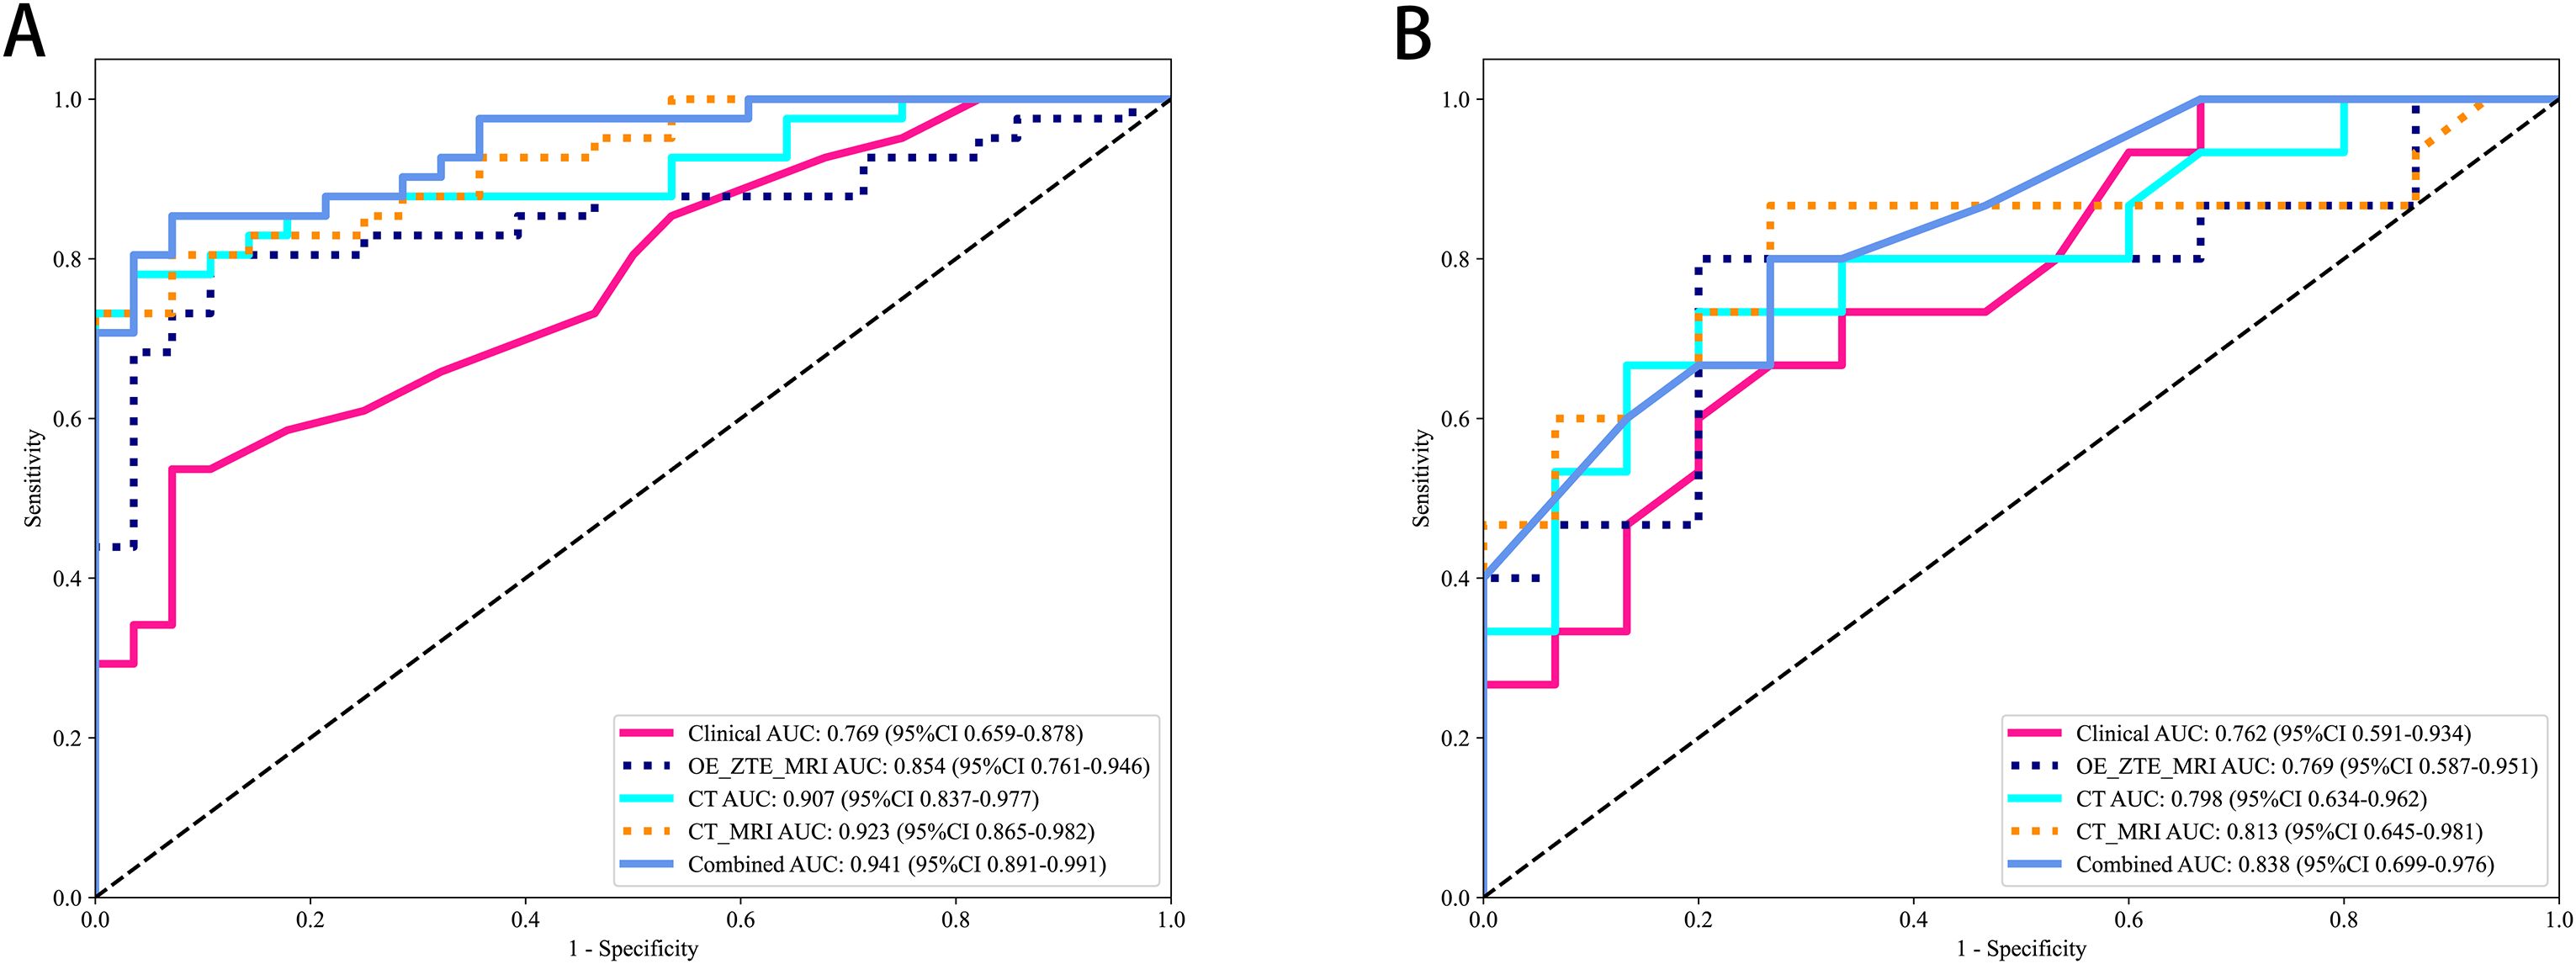
The selected radiomics features were used to construct six machine-learning models with the most suitable algorithms. In the three study cohorts, the AUC values of the training sets for the CT, OE-ZTE-MRI, and multi-radiomics(CT-MRI) model were 0.907 (95% CI: 0.837-0.977), 0.854 (95% CI: 0.761-0.946), and 0.923 (95% CI: 0.865-0.982), respectively. The AUC values of the test sets were 0.798 (95% CI: 0.634-0.962), 0.769 (95% CI: 0.587-0.951), and 0.813 (95% CI: 0.645-0.982), respectively, as shown in Table 2. DeLong test showed that the performance of the multi-radiomics model was significantly better than that of the single radiomics models (multi-radiomics vs CT: training cohort p=0.045; testing cohort p=0.032)(multi-radiomics vs MRI: training cohort p<0.001; testing cohort p<0.001) in terms of ACC, SEN, SPE, PPV, and NPV values. Although multi-radiomics model(training set AUC:0.923; testing set AUC: 0.813)had better predictive performance, MRI model also demonstrated diagnostic capabilities similar to the CT model (MRI vs.CT: training cohort AUC: 0.854 vs 0.907; testing cohort AUC: 0.769 vs 0.798). In this study, each radiomics model was also evaluated using DCA. DCA analysis for the test and training cohorts of each radiomics model is shown in Figure 4.
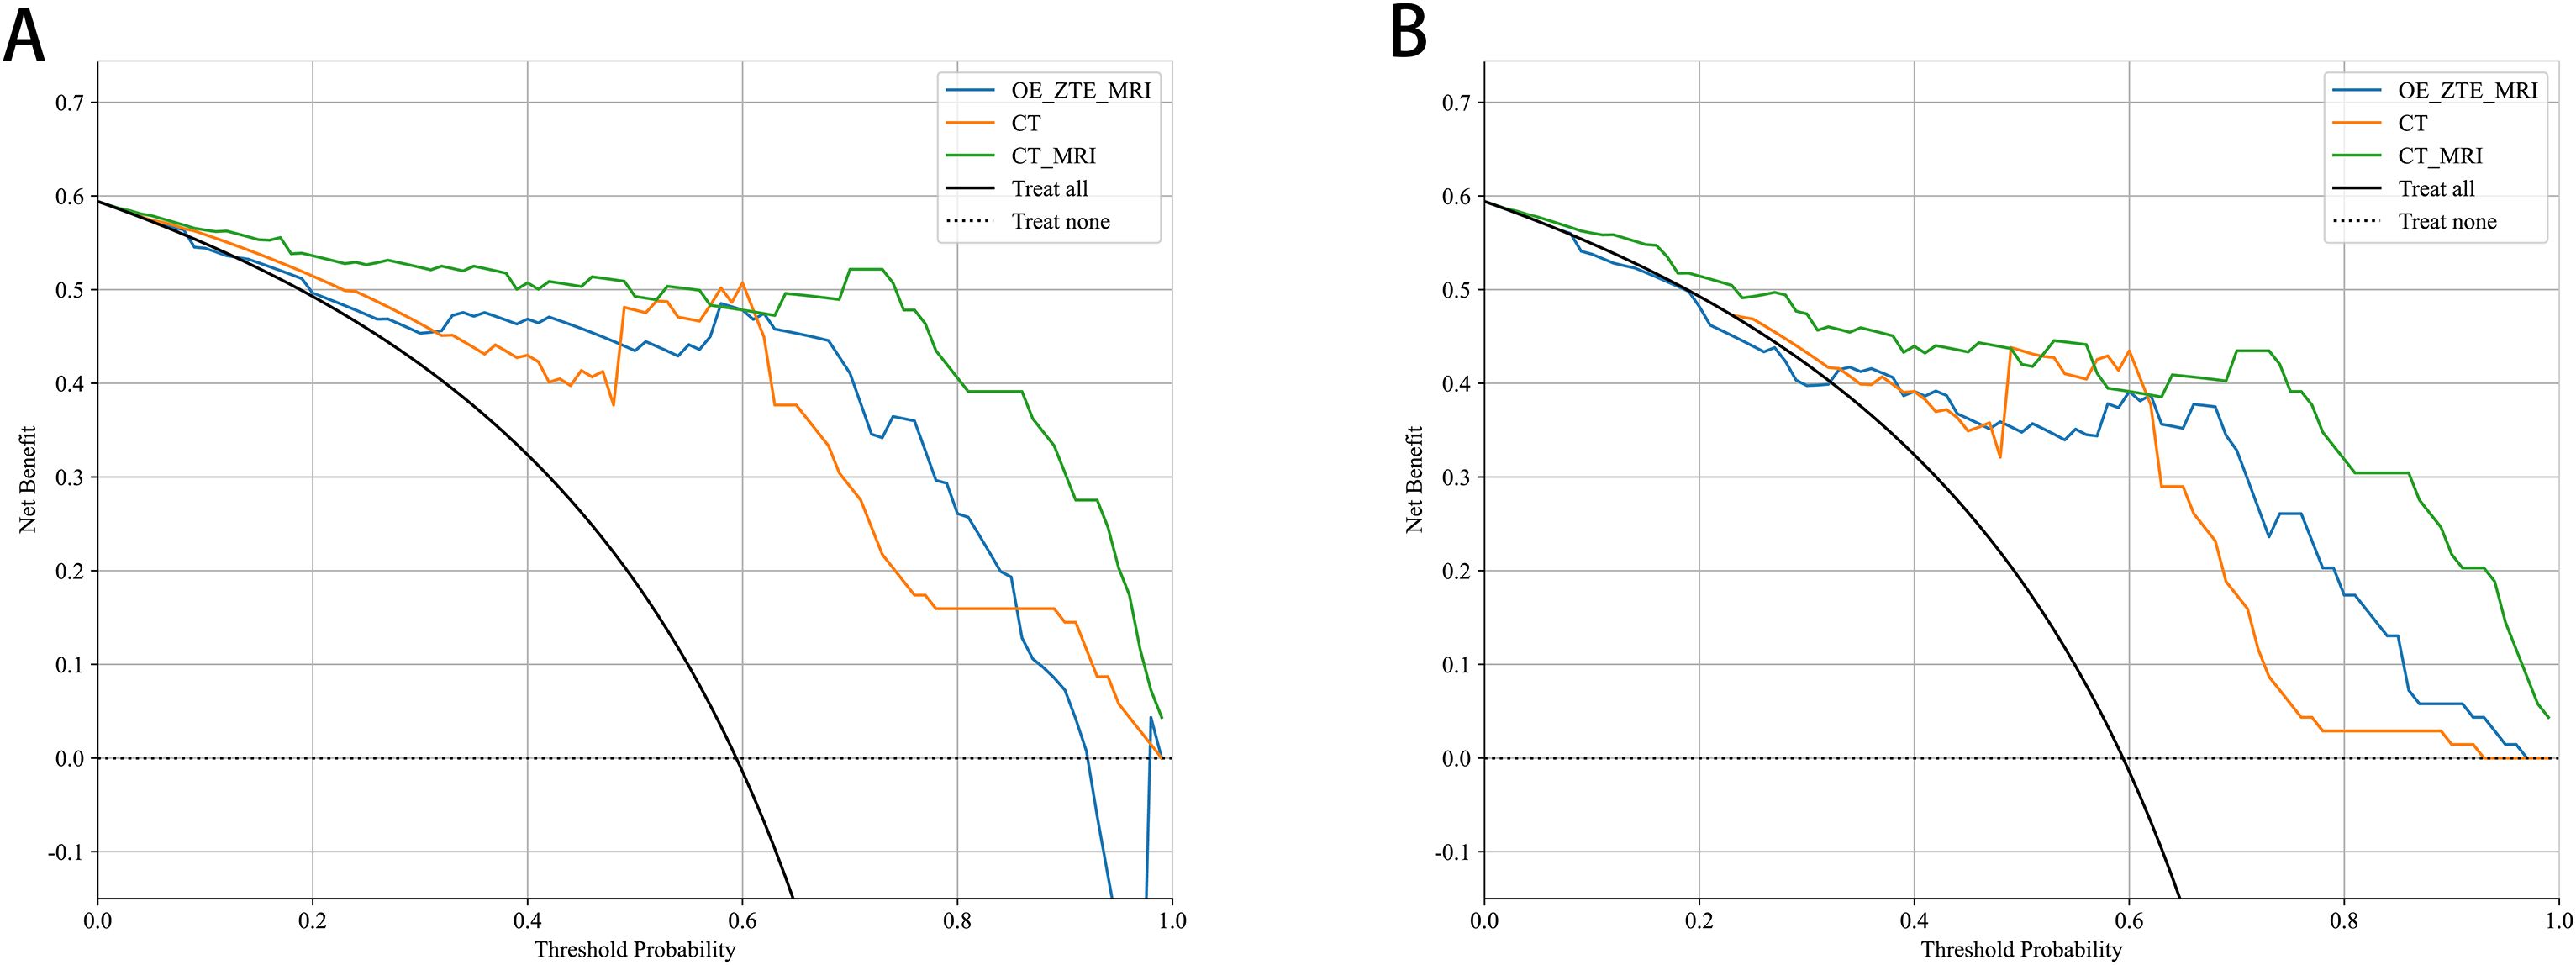
Figure 4. Decision Curve Analysis of MRI radiomic models. CT radiomic models and CT_MRI model for predicting Benign and Malicious in (A) training and (B) testing.
Analysis of multi-radiomics model and clinical model
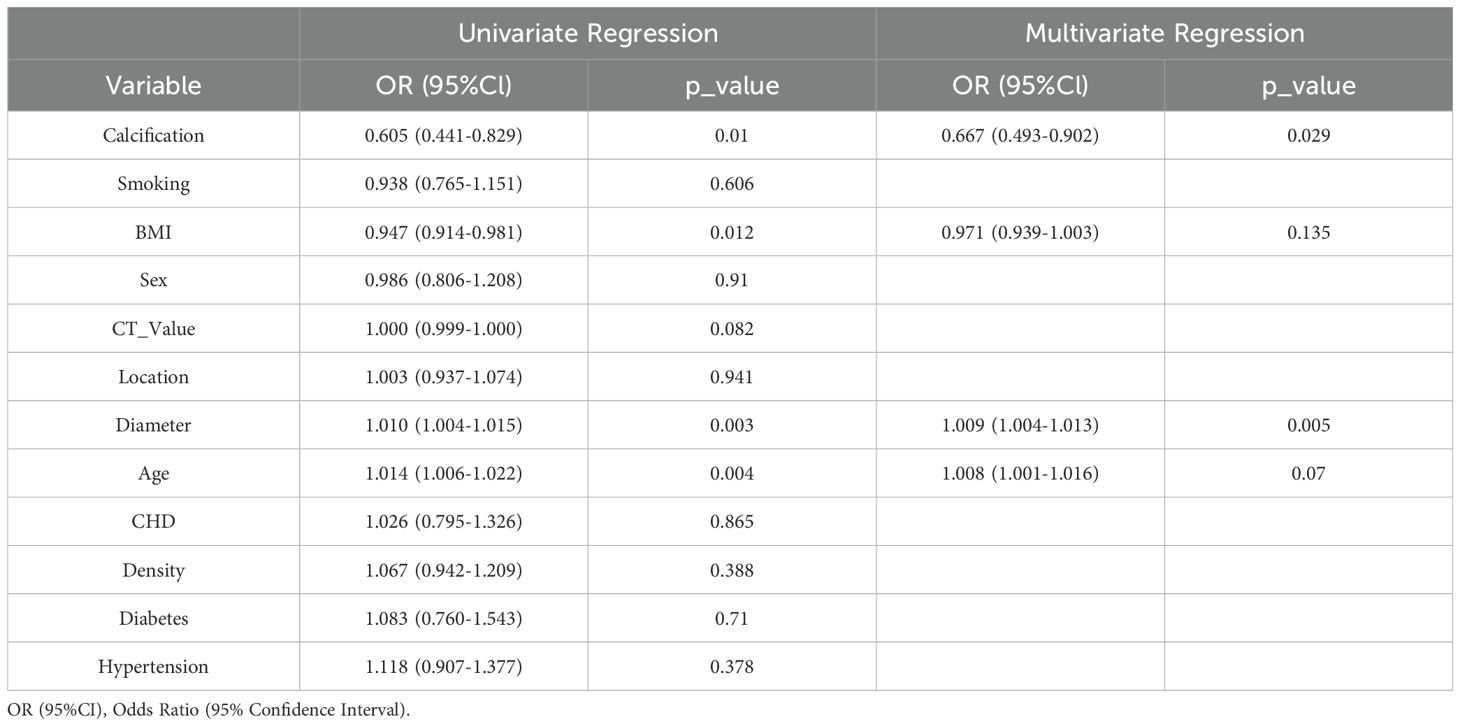
To intuitively and effectively evaluate the incremental prognostic value of the radiomics model for clinical factors, we constructed a combined model on the test dataset. This multi-model method integrates the multi-radiomics model and clinical factors based on univariate and multivariate logistic regression analyses. The construction process of the clinical model is essentially the same as that of the radiomics model. According to the results shown in Table 3, the univariate logistic regression consists of 12 parameters. Multivariate logistic regression ultimately showed significant differences (p < 0.05) in calcification shown by CT (OR: 0.667, 95% CI: 0.493-0.902, p=0.029) and larger nodule diameter (OR: 1.009, 95% CI: 1.004-1.013, p=0.005) between the two cohorts. This indicates that the risk of nodule malignancy is influenced by the nodule diameter and the presence of calcification within the nodule. Therefore, the selected clinical feature model consists of these two factors.
Analysis of multi-model
A combined model was constructed by integrating all radiomics models with clinical models (training cohort: AUC=0.941; testing cohort: AUC=0.838) (Figure 5). DeLong test showed that the multi-model outperforms the multi-radiomics model and the single clinical feature model(multi-model vs clinical: training cohort p<0.001; testing cohort p=0.001) (multi-model vs multi-radiomics model: training cohort p=0.035; testing cohort p=0.046). Hosmer-Lemeshow test indicated that the model had a good fit for predicting malignancy in both the training and testing cohorts (training cohort p=0.261; testing cohort p=0.163), with no significant difference between the predicted and actual values. The DCA results are shown in Figure 6. Compared to clinical models, the nomogram (Figure 7) and the example of the nomogram (Figure 8) provided higher net benefits, demonstrating greater potential valuation in clinical decision-making.
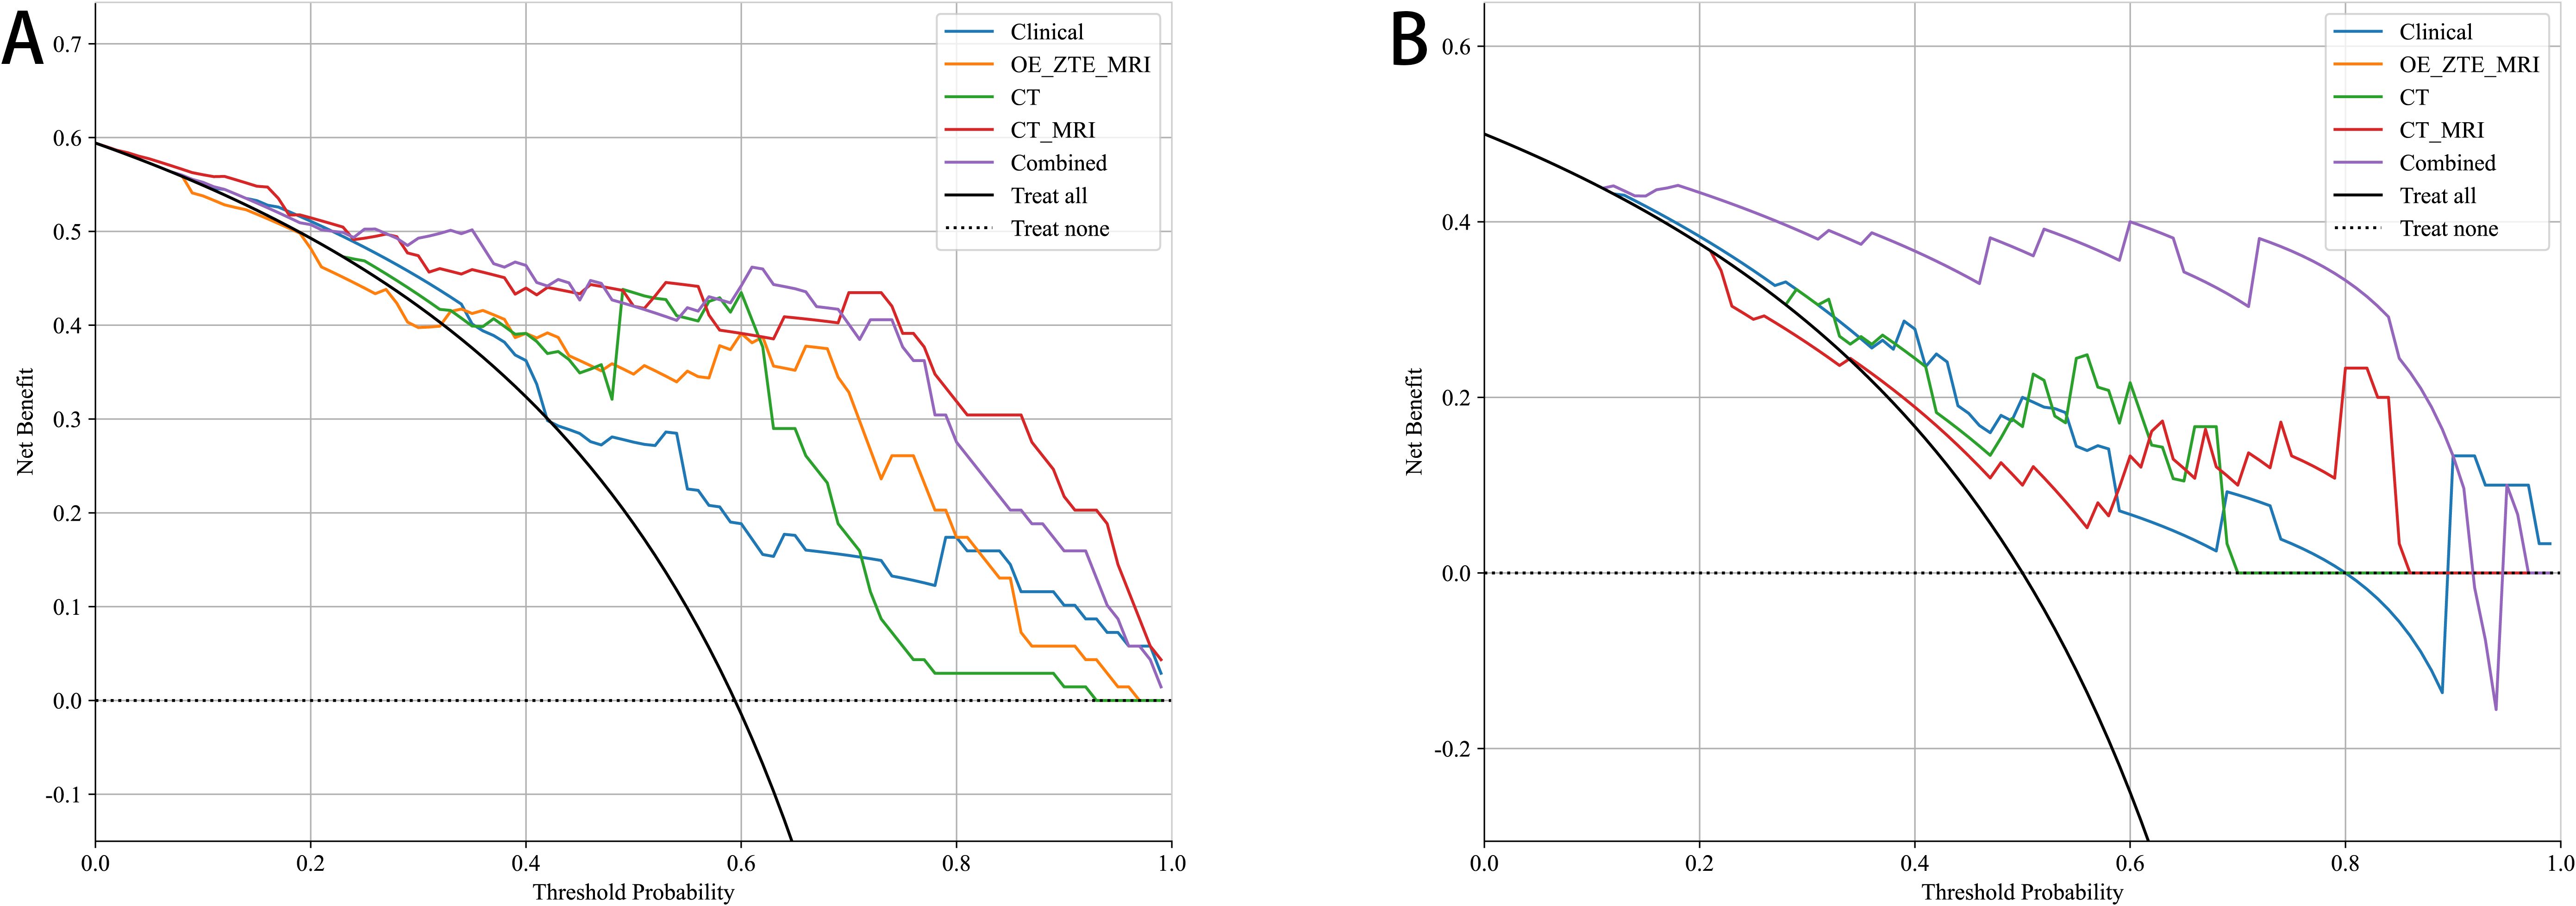
Figure 6. Decision Curve Analysis of 5 models for predicting Benign and Malicious in (A) training and (B) testing.

Figure 7. Nomogram of Combined Model. The sum of all factors equals the total points.CT_MRI: CT &OE-ZTE-MRI. Combined Model: CT sequences, OE-ZTE-MRI sequences, calcification and age. Among them, the nodule diameter is based on a zero baseline of 10mm.

Figure 8. An example of a Nomogram of Combined Model. The CT-MR model predicted a 40% probability of malignancy in a patient with a pulmonary lesion. The nodule has no calcification and a diameter of approximately 40mm. After analysis using the nomogram, the malignancy rate for this patient increased to about 70%.
Discussion
In this study, to preoperatively diagnose the malignancy of pulmonary nodules higher than Lung-RADS 4A, we developed and validated a new model. Based on this model, we generated a nomogram that can assist in clinical decision-making. This predictive model includes statistically significant clinical features, CT, and OE-ZTE-MRI radiomics features. Through comparison, we found that the multi-model constructed from clinical features and the CT-MRI model has greater advantages in preoperative diagnosis of the malignancy of such pulmonary nodules.
Gas MRI technology has been widely used in preclinical research. Currently, the commonly used gas contrast (25–27) agents, Helium-3 (3He) and Xenon-129 (129Xe), are difficult to prepare (28). Oxygen, due to its safety, may become the superior method for routine clinical operations using oxygen-enhanced MRI imaging schemes (29). Ohno et al. explored the feasibility of OE-MRI imaging in diagnosing lung diseases in clinical settings and compared the images of lung cancer patients with different tests, showing changes in regional oxygen concentration and lung function (22).
In recent decades, radiomics has rapidly developed, enabling the quantitative analysis of thousands of radiomics features. This helps assess lung tumors’ invasiveness and treatment response and assists in the preoperative differentiation of benign and malignant pulmonary nodules (30). Liu’s study (31) indicated that a combined model using radiomics and CT imaging features can differentiate between benign and malignant subcentimeter (≤10 mm) solid nodules (training cohort AUC: 0.942; testing cohort AUC: 0.930), which is almost consistent with the results obtained in this study using CT radiomics parameters alone (training cohort AUC: 0.907; testing cohort AUC: 0.798). However, their study did not target patients with non-solid nodules, which may have led to deviations in the AUC values in the test cohort. Additionally, it only differentiated between benign and malignant nodules without incorporating any clinical or imaging parameters. Huang’s results (32) showed that using a deep learning-enhanced radiomics model can successfully predict benign and malignant ground-glass nodules (GGNs), achieving the highest model performance in external validation. However, this study only targeted GGNs detected by CT, without including solid components, and was conducted in a single institution without external validation.
With the advent of UTE and ZTE technologies, it has become possible to use semi-automatic or manual delineation of tumor entities and extract their radiomics features. Wang (33) delineated multiparametric MRI sequences to extract radiomics features, successfully assessing the heterogeneity of lung tumors about nodule size. This study did not use UTE or ZTE sequences and did not further discuss benign nodules. UTE-MRI or ZTE-MRI, as described by the Fleischner Society (7), can be used as a supplementary sequence to help evaluate lung nodule imaging or perform feature extraction. Using ZTE is better than UTE, as validated by Bae’s (8) study. Compared to UTE, ZTE is superior in depicting normal lung structures. The shorter TE in ZTE may result in less signal loss at the nodule site, which is crucial for enhancing image clarity.
It is well known that CT and MRI are two technologies with completely different acquisition principles. Although GGNs and PGNs are less clear on MRI images (34), the cross-modal model of CT and OE-ZTE-MRI still achieved results similar to those of Lee (13), and higher than those reported by Wielputz (35). We speculate that during the patient selection process, the sizes of PGNs and GGNs were both over 10 mm, with nodule characteristics dominated by ground-glass components, and pathological results confirmed that almost all were malignant. Additionally, we found that radiomics features stable across modalities are not rare, and previous studies have demonstrated that some multimodal models can be applied in clinical practice (36). However, based on previous conclusions, we selected the most suitable texture features (13, 23)and constructed the optimal multimodal radiomics model. This has been validated in preclinical efficacy evaluations, such as a study on the correlation between multimodal radiomics and pathology of thermal ablation lesions in rabbit lung VX2 tumor models (37); it has also been supported in clinical practice by a machine learning-based study using multimodal radiomic texture features to predict lung cancer (38).
There are some limitations to this study. First, each subject had to undergo complete CT scans, and OE-ZTE-MRI examinations. Some elderly patients with underlying diseases (unable to lie down for long periods) could not tolerate all the examinations well, leading to a smaller sample size that may be accompanied by unpredictable selection bias. Second, the single-center, small-sample design of this study may compromise model generalizability, necessitating further multicenter external validation—preferably across heterogeneous cohorts and cross-modality verification (e.g., PET-CT)—to confirm robustness against equipment parameters, reader expertise, and regional population differences. Finally, this model may not be suitable for patients with larger nodules, as large masses (such as massive hilar tumors with obstructive pneumonia) are often accompanied by emaciation or severe underlying diseases. These patients are often inoperable, and the probability of malignancy is almost 100%. Therefore, early detection and multidisciplinary team collaboration are crucial for developing appropriate treatment plans.
Conclusion
This study constructed a multi-model by integrating clinical factors, CT, and OE-ZTE-MRI radiomics features. This model can be used to predict the malignancy of high-risk nodules preoperatively, thereby improving the accuracy of pulmonary nodule prediction. DeLong test showed that in preoperative prediction of the malignancy of high-risk pulmonary nodules, multi-model>multi-radiomics model>single model.
Data availability statement
The raw data supporting the conclusions of this article will be made available by the authors, without undue reservation.
Ethics statement
The studies involving humans were approved by the Ethics Review Committee of the Fourth Affiliated Hospital of Harbin Medical University. The studies were conducted in accordance with the local legislation and institutional requirements. The participants provided their written informed consent to participate in this study. Written informed consent was obtained from the individual(s) for the publication of any potentially identifiable images or data included in this article.
Author contributions
TY: Writing – original draft, Writing – review & editing. LL: Methodology, Resources, Writing – review & editing. YL: Formal analysis, Writing – review & editing. CQ: Data curation, Writing – review & editing. HG: Writing – review & editing. TZ: Funding acquisition, Writing – review & editing.
Funding
The author(s) declare that financial support was received for the research and/or publication of this article. This study was supported by the National Natural Science Foundation of China (Grant No. 62376078).
Acknowledgments
The authors would like to express their gratitude to Hao-Nan Guan from GE Healthcare, MR Research China for his valuable assistance in this article.
Conflict of interest
The authors declare that the research was conducted in the absence of any commercial or financial relationships that could be construed as a potential conflict of interest.
Generative AI statement
The author(s) declare that no Generative AI was used in the creation of this manuscript.
Publisher’s note
All claims expressed in this article are solely those of the authors and do not necessarily represent those of their affiliated organizations, or those of the publisher, the editors and the reviewers. Any product that may be evaluated in this article, or claim that may be made by its manufacturer, is not guaranteed or endorsed by the publisher.
Supplementary material
The Supplementary Material for this article can be found online at: https://www.frontiersin.org/articles/10.3389/fonc.2025.1563073/full#supplementary-material
References
1. Bray F, Laversanne M, Sung H, Ferlay J, Siegel RL, Soerjomataram I, et al. Global cancer statistics 2022: GLOBOCAN estimates of incidence and mortality worldwide for 36 cancers in 185 countries. CA: Cancer J Clin. (2024) 74:229–63. doi: 10.3322/caac.21834
2. Kim JS and Gupta R. Clinical manifestations and management of fibrotic pulmonary sarcoidosis. J Clin Med. (2023) 13. doi: 10.3390/jcm13010241
3. Iaccarino JM, Simmons J, Gould MK, Slatore CG, Woloshin S, Schwartz LM, et al. Clinical equipoise and shared decision-making in pulmonary nodule management. A survey of american thoracic society clinicians. Ann Am Thorac Soc. (2017) 14:968–75. doi: 10.1513/AnnalsATS.201609-727OC
4. Mankidy BJ, Mohammad G, Trinh K, Ayyappan AP, Huang Q, Bujarski S, et al. High risk lung nodule: A multidisciplinary approach to diagnosis and management. Respir Med. (2023) 214:107277. doi: 10.1016/j.rmed.2023.107277
5. Hirsch FW, Sorge I, Vogel-Claussen J, Roth C, Gräfe D, Päts A, et al. The current status and further prospects for lung magnetic resonance imaging in pediatric radiology. Pediatr Radiol. (2020) 50:734–49. doi: 10.1007/s00247-019-04594-z
6. Hirsch W, Sorge I, Krohmer S, Weber D, Meier K, and Till H. MRI of the lungs in children. Eur J Radiol. (2008) 68:278–88. doi: 10.1016/j.ejrad.2008.05.017
7. Hatabu H, Ohno Y, Gefter WB, Parraga G, Madore B, Lee KS, et al. Expanding applications of pulmonary MRI in the clinical evaluation of lung disorders: fleischner society position paper. Radiology. (2020) 297:286–301. doi: 10.1148/radiol.2020201138
8. Bae K, Jeon KN, Hwang MJ, Lee JS, Ha JY, Ryu KH, et al. Comparison of lung imaging using three-dimensional ultrashort echo time and zero echo time sequences: preliminary study. Eur Radiol. (2019) 29:2253–62. doi: 10.1007/s00330-018-5889-x
9. Bae K, Jeon KN, Hwang MJ, Lee JS, Park SE, Kim HC, et al. Respiratory motion-resolved four-dimensional zero echo time (4D ZTE) lung MRI using retrospective soft gating: feasibility and image quality compared with 3D ZTE. Eur Radiol. (2020) 30:5130–8. doi: 10.1007/s00330-020-06890-x
10. Wang X, Cui Y, Wang Y, Liu S, Meng N, Wei W, et al. Assessment of lung nodule detection and lung CT screening reporting and data system classification using zero echo time pulmonary MRI. J Magnetic Resonance Imaging: JMRI. (2025) 61:822–9. doi: 10.1002/jmri.29388
11. Zeimpekis KG, Kellenberger CJ, and Geiger J. Assessment of lung density in pediatric patients using three-dimensional ultrashort echo-time and four-dimensional zero echo-time sequences. Jpn J Radiol. (2022) 40:722–9. doi: 10.1007/s11604-022-01258-1
12. Chen M, Copley SJ, Viola P, Lu H, and Aboagye EO. Radiomics and artificial intelligence for precision medicine in lung cancer treatment. Semin Cancer Biol. (2023) 93:97–113. doi: 10.1016/j.semcancer.2023.05.004
13. Lee S, Lee CY, Kim NY, Suh YJ, Lee HJ, Yong HS, et al. Feasibility of UTE-MRI-based radiomics model for prediction of histopathologic subtype of lung adenocarcinoma: in comparison with CT-based radiomics model. Eur Radiol. (2024) 34:3422–30. doi: 10.1007/s00330-023-10302-1
14. Liu H, Zheng L, Shi G, Xu Q, Wang Q, Zhu H, et al. Pulmonary functional imaging for lung adenocarcinoma: combined MRI assessment based on IVIM-DWI and OE-UTE-MRI. Front Oncol. (2021) 11:677942. doi: 10.3389/fonc.2021.677942
15. Li J, Zhang HL, Yin HK, Zhang HK, Wang Y, Xu SN, et al. Comparison of MRI and CT-based radiomics and their combination for early identification of pathological response to neoadjuvant chemotherapy in locally advanced gastric cancer. J Magnetic Resonance Imaging: JMRI. (2023) 58:907–23. doi: 10.1002/jmri.28570
16. Huang YS, Niisato E, Su MM, Benkert T, Chien N, Chiang PY, et al. Applying compressed sensing volumetric interpolated breath-hold examination and spiral ultrashort echo time sequences for lung nodule detection in MRI. Diagn (Basel Switzerland). (2021) 12. doi: 10.3390/diagnostics12010093
17. Chen LA, Bai L, Yang DW, Li WM, Zhang XJ, and Jin FG. Chinese expert consensus on diagnosis and treatment of pulmonary nodules(2024). Zhonghua Jie He He Hu Xi Za Zhi. (2024) 47:716–29. doi: 10.3760/cma.j.cn112147-20231109-00300
18. Zhou W, Liu G, Hung RJ, Haycock PC, Aldrich MC, Andrew AS, et al. Causal relationships between body mass index, smoking and lung cancer: Univariable and multivariable Mendelian randomization. Int J Cancer. (2021) 148:1077–86. doi: 10.1002/ijc.33292
19. Dauriat G, LePavec J, Pradere P, Savale L, Fabre D, and Fadel E. Our current understanding of and approach to the management of lung cancer with pulmonary hypertension. Expert Rev Respir Med. (2021) 15:373–84. doi: 10.1080/17476348.2021.1842202
20. Chen Y, Guan M, Wang R, and Wang X. Relationship between advanced lung cancer inflammation index and long-term all-cause, cardiovascular, and cancer mortality among type 2 diabetes mellitus patients: NHANES, 1999-2018. Front Endocrinol. (2023) 14:1298345. doi: 10.3389/fendo.2023.1298345
21. Hong Y, Wei S, Tang M, and Liu W. A review of advances in the surgical treatment of coronary heart disease and lung cancer. Heart Surg Forum. (2023) 26:E656–e65. doi: 10.59958/hsf.5877
22. Ohno Y, Hatabu H, Takenaka D, Adachi S, Van Cauteren M, and Sugimura K. Oxygen-enhanced MR ventilation imaging of the lung: preliminary clinical experience in 25 subjects. AJR Am J Roentgenol. (2001) 177:185–94. doi: 10.2214/ajr.177.1.1770185
23. Bortolotto C, Pinto A, Brero F, Messana G, Cabini RF, Postuma I, et al. CT and MRI radiomic features of lung cancer (NSCLC): comparison and software consistency. Eur Radiol Experimen. (2024) 8:71. doi: 10.1186/s41747-024-00468-8
24. Zwanenburg A, Vallières M, Abdalah MA, Aerts H, Andrearczyk V, Apte A, et al. The image biomarker standardization initiative: standardized quantitative radiomics for high-throughput image-based phenotyping. Radiology. (2020) 295:328–38. doi: 10.1148/radiol.2020191145
25. Qing K, Tustison NJ, Mugler JP 3rd, Mata JF, Lin Z, Zhao L, et al. Probing changes in lung physiology in COPD using CT, perfusion MRI, and hyperpolarized xenon-129 MRI. Acad Radiol. (2019) 26:326–34. doi: 10.1016/j.acra.2018.05.025
26. Walvick RP, Roche JP, Reno AL, Gounis MJ, and Albert MS. Evaluation of oxygen sensitivity of hyperpolarized helium imaging for the detection of pulmonary ischemia. Magnet Resonance Med. (2016) 75:2050–4. doi: 10.1002/mrm.25714
27. Willmering MM, Niedbalski PJ, Wang H, Walkup LL, Robison RK, Pipe JG, et al. Improved pulmonary (129) Xe ventilation imaging via 3D-spiral UTE MRI. Magnet Resonance Med. (2020) 84:312–20. doi: 10.1002/mrm.28114
28. Niedbalski PJ, Hall CS, Castro M, Eddy RL, Rayment JH, Svenningsen S, et al. Protocols for multi-site trials using hyperpolarized (129) Xe MRI for imaging of ventilation, alveolar-airspace size, and gas exchange: A position paper from the (129) Xe MRI clinical trials consortium. Magnet Resonance Med. (2021) 86:2966–86. doi: 10.1002/mrm.28985
29. Ohno Y and Hatabu H. Basics concepts and clinical applications of oxygen-enhanced MR imaging. Eur J Radiol. (2007) 64:320–8. doi: 10.1016/j.ejrad.2007.08.006
30. Hirano K, Tada M, Isayama H, Yamamoto K, Mizuno S, Yagioka H, et al. Endoscopic evaluation of factors contributing to intrapancreatic biliary stricture in autoimmune pancreatitis. Gastrointest Endosc. (2010) 71:85–90. doi: 10.1016/j.gie.2009.08.008
31. Liu J, Qi L, Wang Y, Li F, Chen J, Cui S, et al. Development of a combined radiomics and CT feature-based model for differentiating Malignant from benign subcentimeter solid pulmonary nodules. Eur Radiol Experimen. (2024) 8:8. doi: 10.1186/s41747-023-00400-6
32. Huang W, Deng H, Li Z, Xiong Z, Zhou T, Ge Y, et al. Baseline whole-lung CT features deriving from deep learning and radiomics: prediction of benign and Malignant pulmonary ground-glass nodules. Front Oncol. (2023) 13:1255007. doi: 10.3389/fonc.2023.1255007
33. Wang X, Li X, Chen H, Peng Y, and Li Y. Pulmonary MRI radiomics and machine learning: effect of intralesional heterogeneity on classification of lesion. Acad Radiol. (2022) 29 Suppl 2:S73–s81. doi: 10.1016/j.acra.2020.12.020
34. Ohno Y, Takenaka D, Yoshikawa T, Yui M, Koyama H, Yamamoto K, et al. Efficacy of ultrashort echo time pulmonary MRI for lung nodule detection and lung-RADS classification. Radiology. (2022) 302:697–706. doi: 10.1148/radiol.211254
35. Wielpütz MO, Lee HY, Koyama H, Yoshikawa T, Seki S, Kishida Y, et al. Morphologic characterization of pulmonary nodules with ultrashort TE MRI at 3T. AJR Am J Roentgenol. (2018) 210:1216–25. doi: 10.2214/AJR.17.18961
36. Ponsiglione A, Stanzione A, Cuocolo R, Ascione R, Gambardella M, De Giorgi M, et al. Cardiac CT and MRI radiomics: systematic review of the literature and radiomics quality score assessment. Eur Radiol. (2022) 32:2629–38. doi: 10.1007/s00330-021-08375-x
37. Chen J, Yan Y, Lin Q, Chen J, Chen J, and Lin Z. The correlation between multimodal radiomics and pathology about thermal ablation lesion of rabbit lung VX2 tumor. Front Oncol. (2022) 12:941752. doi: 10.3389/fonc.2022.941752
Keywords: oxygen enhanced, CT, MRI, radiomics, multimodel analysis
Citation: Yan T, Liu L, Li Y, Qin C, Guan H and Zhang T (2025) A multimodal nomogram for benign-malignant discrimination of lung-RADS ≥4A nodules: integration of oxygen enhanced zero echo time MRI, CT radiomics, and clinical factors. Front. Oncol. 15:1563073. doi: 10.3389/fonc.2025.1563073
Received: 19 January 2025; Accepted: 09 June 2025;
Published: 21 July 2025.
Edited by:
Oraianthi Fiste, National and Kapodistrian University of Athens, GreeceReviewed by:
Emina Talakic, Medical University of Graz, AustriaXiaoyu Han, Wuhan Union Hospital, China
Copyright © 2025 Yan, Liu, Li, Qin, Guan and Zhang. This is an open-access article distributed under the terms of the Creative Commons Attribution License (CC BY). The use, distribution or reproduction in other forums is permitted, provided the original author(s) and the copyright owner(s) are credited and that the original publication in this journal is cited, in accordance with accepted academic practice. No use, distribution or reproduction is permitted which does not comply with these terms.
*Correspondence: Tong Zhang, eWluZ3hpYW5nOTM5QDE2My5jb20=
 Tiancai Yan1
 Ling Liu