 Na Li
Na Li Nan Zhang1
 Guanghui Wang
- 1Department of Clinical Laboratory, The First Affiliated Hospital of Xi’an Jiao Tong University, Xi’an, Shaanxi, China
- 2Department of General Surgery, The First Affiliated Hospital of Xi’an Jiao Tong University, Xi’an, Shaanxi, China
Introduction: Colorectal cancer (CRC) poses a significant risk of recurrence and distant metastases. This study investigated the regulatory role of Matrix metalloproteinase-14 (MMP14) in immune function and its impact on CRC prognosis.
Methods: we performed transcriptome sequencing on tumor and adjacent non-cancerous samples from four pairs of patients diagnosed with colorectal cancer. Single-cell transcriptome data were analyzed to explore MMP14 expression and immune microenvironment changes. mRNA expression profiles and clinical data were retrieved from public databases (TCGA and GEO). The association between MMP14 and pathways as well as immune regulators was analyzed. Co-expression genes of MMP14 relevant to prognosis were identified. A prognostic model was then constructed. MMP14 expression was examined using real-time fluorescence quantification PCR (qRT-PCR) and Western blotting (WB). Immunofluorescence was utilized to demonstrate MMP14 expression in colon cancer tissues, while Hematoxylin and eosin (HE) staining was employed to observe the histology of normal tissue and colon cancer tissue.
Results: Machine learning identified MMP14 as a candidate gene. MMP14 was overexpressed in CRC tissues and COLO205 cells. Single-cell transcriptome analysis revealed that MMP14 was highly expressed in fibrocyte cells within the liver metastasis group. Increased MMP14 levels correlated with poor overall survival (OS), progression-free survival (PFS), and advanced TNM stages. Functional assays indicated that silencing MMP14 in COLO205 cells enhanced apoptosis and upregulated the expression of the immune-related cytokine IL-1β. Furthermore, MMP14 exhibited significant correlations with immunomodulators, particularly immunostimulants and immunosuppressants, and was associated with immune cell infiltration within tumor tissues. Additionally, by utilizing co-expressed genes of MMP14 and conducting Cox regression analysis, we developed a risk prediction model comprising three genes (LIMK1, SPOCK3, SLC2A3). The risk scores derived from this model were found to correlate with OS and PFS.
Discussion: MMP14 plays a crucial role in CRC progression. Its overexpression is related to poor prognosis and immune cell infiltration. The prognostic model based on MMP14 co-expression genes may help predict CRC prognosis. However, further studies are needed to validate these findings, such as more in-vitro and in-vivo experiments. In conclusion, MMP14 can serve as a biomarker for evaluating CRC prognosis and immune cell infiltration.
1 Introduction
Colorectal cancer (CRC) is a prevalent gastrointestinal tumor, ranking the third in cancer incidence (1–3). Notably, CRC incidence in China is rising, with an annual rise of 3.9% (4). Liver metastases manifest in approximately 43% of CRC-diagnosed patients, while 25% concurrently exhibit lung metastases. The primary predictor of survival remains the disease stage at diagnosis, with 5-year relative survival rates ranging from 91% to 14% for localized diseases (5). Therefore, it is imperative to undertake effective measures to investigate the underlying biological mechanisms governing CRC development, progression, and metastasis. Prognostic markers hold promise as they can complement clinicopathological diagnosis and potentially improve patient survival rates (6). Consequently, exploring the molecular mechanism of CRC is crucial for identifying effective treatment options.
Solid tumors comprise tumor cells, diverse non-tumor cells, and the extracellular matrix (ECM). For metastasis to occur, tumor cells acquire the capability to move and detach from the primary tumor, effectively overcoming the extracellular matrix barrier (7). Matrix metalloproteinases (MMPs), the key enzymes, are essential for ECM degradation and play critical roles in normal physiological processes and cancer-related activities, including migration and proliferation (8).
MMP14, a transmembrane protein, is a pivotal member of the MMP family and significantly enhances the metastatic potential of tumor cells by activating pro-MMP2 (9). A growing body of evidence indicates a substantial upregulation of MMP14 expression across various tumor types, with an established impact on cellular migration, inflammation, and angiogenesis (10, 11). In this study, we examined the augmented levels of MMP14 expression in colon tumor tissues compared to normal tissues. Furthermore, a positive correlation was observed between increasing MMP14 expression and unfavorable prognosis outcomes. These findings underscore the critical need to investigate the mechanism underlying the oncogenic role of MMP14 in CRC.
2 Methods
2.1 Data collection
We obtained distinct cohorts of Colorectal cancer patients from The Cancer Genome Atlas(TCGA) dataset, comprising RNA-seq data for 487 patients (446 tumor samples and 41 normal samples), and the GSE39582 dataset comprising microarray data for 566 tumor and 19 normal tissues using Illumina BeadArrays. The single-cell RNA sequencing (scRNA-seq) dataset GSE225857 was acquired from the Gene Expression Omnibus (GEO, http://www.ncbi.nlm.nih.gov/geo/), and it includes data from different tissues of six colorectal cancer (CRC) patients. Additionally, to further examine MMP14 protein expression levels in CRC, we examined the Human Protein Atlas (HPA) database, focusing on MMP14 protein expression in various malignancies. (www.proteinatlas.org/).
2.2 Survival analysis
Based on MMP14 co-expression genes, we developed a prognostic model through Cox regression analysis. Briefly, this model utilizes a risk score index: the risk score can be calculated as the sum of A1 multiplied by X1, A2 multiplied by X2, and so on until Ai multiplied by Xi. A comprehensive analysis was conducted to evaluate the correlation between specific genes and clinical outcomes in CRC patients. Various statistical techniques were employed, including Kaplan-Meier assays, log-rank tests, and univariate and multivariate Cox regression analysis. Moreover, the prognostic assessment of risk scores was determined using receiver operating characteristic (ROC) curves and the survival ROC package (12).
2.3 Immune cell infiltration assay
Using 547 TAG-expressing data, the CIBERSORT algorithm, a deconvolution technique, was employed to assess the composition of immune cells in the samples (13). To determine the relative abundances of the 22 immune cell types in CRC, corrected transcriptome data were analyzed using the CIBERSORT R software tool. The threshold for statistical significance was set at p < 0.05.
2.4 Gene enrichment analysis
To identify MMP14 co-expression genes, we utilized the STRING and GEPIA2 databases, setting specific parameters in the STRING database. Additionally, we used the gene detection tool Module in GEPIA 2 to identify MMP14 co-expression genes in CRC, selecting a Pearson correlation coefficient (PCC) threshold of ≥ 0.74. Subsequently, the MMP14 co-expression genes were merged with the STRING database and GEPIA2 database. Gene enrichment analysis was then conducted using the R 4.0.5 program, employing cluster Profiler, Enrichment plot, and ggplot2 packages.
2.5 Analysis of variations in the MMP14 gene set using GSVA in CRC
To examine the role of MMP14 in CRC, we employed Clinical Bioinformatics (14), facilitating a comprehensive analysis of tumor-infiltrating immune cells (TIICs). Furthermore, we utilized TIMER2.0, introduced by Li et al., enabling users to analyze immune cell presence in various cancer types through an interactive platform accessible at https://timer.cistrome.org/ (15).
2.6 The relationship between MMP14 and tumor immune cell infiltration
To assess the correlation between MMP14 and immune cell infiltration, we utilized TIMER and TIMER2.0. As suggested by Li et al., TIMER2.0 is an interactive digital platform that allows users to comprehensively examine tumor-infiltrating immune cells (TIICs) across various malignancies (https://timer.cistrome.org/) (16).
2.7 Tumor-immune system interactions and drug bank
The online platform TISIDB (http://cis.hku.hk/TISIDB/index.php) integrates multiple heterogeneous data sources to explore the interplay between the immune system and tumors. This database holds promise in predicting immunotherapy responses, identifying novel immunotherapy targets, and elucidating the relationship between immune cells and malignancies. It is poised to become a valuable tool for studying and treating cancer (17).
2.8 Cell culture
The COLO205 cell line was procured from Saibai Kang Biotechnology Co, Ltd (Cat No. iCell-h045; Shanghai, China). Cells were cultured in Roswell Park Memorial Institute-1640 (RPMI-1640) medium supplemented with 10% fetal bovine serum (Gibco, Carlsbad, CA, USA) and 1% penicillin-streptomycin (Cat No. C0222, Beyotime, Shanghai, China) at 37°C with 5.0% CO2. Routine checks for mycoplasma contamination were performed during cultivation. To silence the MMP14 genes, a specific vector was constructed by Gene Pharma. Transfection of COLO205 cells with either the MMP14 gene silencing vector or a negative control was performed at a concentration of 50 nM using Lipofectamine 2000 (Cat No. 11668019, Invitrogen, USA).
2.9 Human specimens
This study comprises three pairs of samples, including 3 normal tissues and 3 colon cancer tissues. All samples were from patients who underwent surgery at The First Affiliated Hospital of Xi’an Jiaotong University between July 1, 2023, and July 30, 2023. Ethical approval for this project was granted under the reference number XJTU1AF2023LSK-349. All procedures were conducted in compliance with the applicable rules and regulations. The Ethics Committee of The First Affiliated Hospital of Xi’an Jiaotong University approved the study and experimental procedures and provided from patient informed consent.
2.10 Western blot
To evaluate MMP14 expression, Western blot analysis was performed. Initially, total proteins were extracted using the ProteoPrep Total Extraction Sample Kit (PROTTOTS, Sigma-Aldrich, Shanghai, China), following the manufacturer’s instructions. Subsequently, the proteins were transferred onto polyvinylidene fluoride membranes manufactured by Bio-Rad in Hercules, California, USA. To reduce non-specific binding, the membranes were blocked with a blocking solution. Primary antibodies specific to MMP14 (1/1000 dilution; Cat No. 29111-1-AP; Proteintech, Wuhan, China) were then applied for detection. Glyceraldehyde-phosphate dehydrogenase (GAPDH; dilution: 1/10000; Cat No. 60004-1-Lg; Proteintech, Wuhan, China) was used as an internal reference for normalization. Subsequently, the membranes were incubated with goat anti-mouse secondary antibodies (dilution 1/1000; Cat No. A0216, Beyotime, Shanghai, China) and goat anti-rabbit secondary antibodies (dilution 1/1000; Cat No. A0208, Beyotime, Shanghai, China). Protein bands on the membranes were visualized using an enhanced chemiluminescent reagent (Cat No. P0018S, Beyotime, Shanghai, China). For quantification of WB results, densitometric analysis of WB bands was performed using the ImageJ analysis software.
2.11 Real-time fluorescence quantification PCR
qRT-PCR was conducted to assess MMP14 expression levels. Total RNA was extracted from 50 mg of tumor tissue using Trizol reagent (Sigma-Aldrich, Cat No. T9424, MERCK, Shanghai, China). Subsequently, reverse transcription and qRT-PCR amplification were performed using the Transcriptor High Fidelity cDNA Synthesis Kit (Cat No. G3330-100, Service bio, Wuhan, China). To ensure accuracy, the experiments were conducted in triplicates. GAPDH served as an internal reference. Relative expression levels were normalized using the 2−ΔΔct method. The primer sequences used are listed in Table 1.
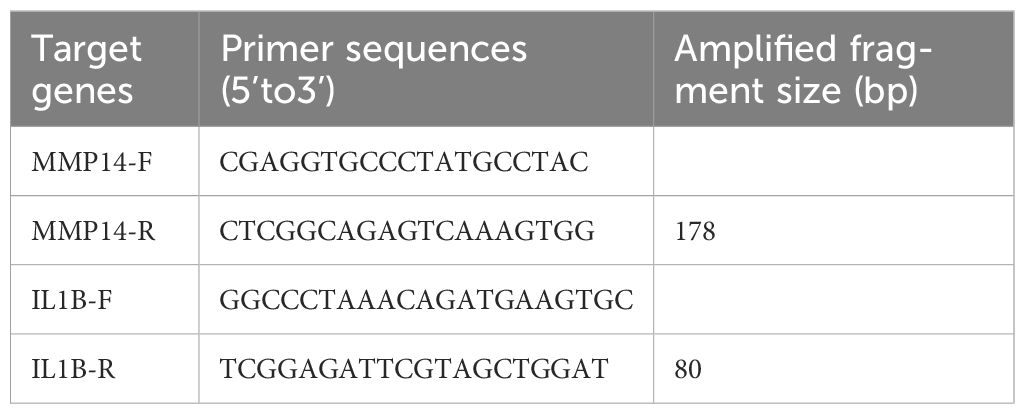
Table 1. Primer sequences table for quantitative detection of target genes.
2.12 Cell apoptosis detection
Cell apoptosis was assessed using the Annexin V-FITC/PI apoptosis detection kit (Catalog #E-CK-A211) from Ela Science Biotechnology Co., Ltd. in Wuhan, China, following the manufacturer’s instructions. Briefly, COLO205 cells (3×10^5 cells/well) were seeded onto a 6-well plate, harvested after 48 hours, and washed with phosphate-buffered saline. The cells were then resuspended in 100 μl of Annexin V binding buffer and stained following the manufacturer’s protocol. Stained cells were analyzed using a flow cytometer from BD Biosciences in the USA. Each experiment examined 10,000 cells to determine the proportion of PI-positive/negative and Annexin V-FITC-positive cells.
2.13 Immunofluorescence assay
Fresh CRC tissues were obtained for immunofluorescence analysis and fixed in an ice-cold 4% paraformaldehyde solution overnight. Following fixation, the tissues were infiltrated with a combination of 30% sucrose phosphate buffer for one day. Subsequently, all samples were snap-frozen in an optimal cutting temperature medium using dry ice and then sliced into 5 μm thick using a cryostat. Immunofluorescence staining was performed, primary and secondary antibodies were hybridized overnight at a 1/200 dilution (Cat. No. 29111-1-AP; Proteintech, Wuhan, China). Nuclei were counterstained with DAPI (Cat. No. C1002, Beyotime, Shanghai, China).
2.14 Hematoxylin and eosin staining
A human colorectal tissue specimen was embedded in paraffin, mounted, and scanned using a pathological section scanner after fixation with 4% paraformaldehyde (pH 7.4), gradual dehydration, and sectioning into 4 μm sections. Subsequently, the tissue sections were stained with H&E.
2.15 Statistical analysis
R software (v4.3.1) was employed for all statistical analyses. Continuous data with a normal distribution were analyzed using Student’s t-test, while categorical variables were compared using the Pearson chi-square test. Patient overall survival (OS) and progression-free survival (PFS) across different subgroups were evaluated using the Kaplan-Meier technique with a two-sided log-rank test. Statistical significance was defined as a p-value less than 0.05, with significance levels indicated as *p < 0.05, **p < 0.01, ***p < 0.001, and ****p < 0.0001.
2.16 RNA-seq sample collection
This study involved the selection of biological samples from four patients. Each patient provided two samples: one of normal tissue, serving as the control group, and one of cancer tissue, constituting the experimental group. The samples were rapidly frozen and preserved immediately after collection to prevent biodegradation, thereby ensuring the reliability and accuracy of subsequent analyses. The selection of samples was based on clinical diagnoses and received approval from the ethics committee.
2.17 RNA-sequencing
The concentration of RNA samples was measured by using a Nanodrop2000 and the integrity of the RNA was confirmed using the Agilent 2100 BioAnalyzer. The Ribo-ZeroTM kit (Epicentre, Beijing, China) was used to remove ribosomal RNA. cDNA was synthesized from the RNA using random hexamer primers and the QIAGEN Reverse Transcription Kit following the manufacturer’s instructions and submitted to a commercial company (Novogene Co., Beijing, China) for transcriptome sequencing analysis. The Illumina Hiseq sequencing platform was used for transcriptome sequencing. An Illumina PE library was constructed for 2 × 150 bp sequencing, and the obtained sequencing data were subjected to quality control.
2.18 RNA-seq data analysis
The sequencing data obtained were subjected to quality control using fastp (version 0.23.2). Adapters and low-quality bases were removed, and low-quality data were filtered based on Q value to ensure the integrity of the analysis results. Following quality control, the cleaned sequences were saved in FASTQ format. The processed sequences were then aligned to the reference genome (human genome GRCh38) using HISAT2 (version 2.2.1). Upon completion of the alignment, the output file was saved in SAM format, providing a foundation for subsequent data processing. Samtools (version 1.13) was utilized to convert SAM files to BAM format and to sort them. This step not only enhances the efficiency of the subsequent analyses but also accelerates data access by indexing BAM files, facilitating the rapid retrieval of the required sequence information. Gene read counting from the sequenced BAM files was conducted using featureCounts (version 2.0.3). By integrating gene annotation files, the accuracy and reliability of the counting process were ensured. After obtaining the gene expression levels, gene annotation was performed, low-expression genes were filtered out, and differential expression analysis was executed using the DESeq2 R package. Initially, a DESeqDataSet object containing both normal and cancer samples was constructed. Subsequently, a normalization method was applied, and the negative binomial distribution model was employed for differential analysis. To identify significantly differentially expressed genes, the thresholds were set to log2 Fold Change (logFC) > 1 and P < 0.05. Ultimately, a total of 896 down-regulated genes and 685 up-regulated genes were identified. Following the identification of significantly differentially expressed genes, Gene Ontology (GO) and Kyoto Encyclopedia of Genes and Genomes (KEGG) enrichment analyses were performed to assess whether the differential gene sets were significantly enriched in specific biological pathways or functional categories.
2.19 Machine learning to screen differential genes
The differences genes were further analyzed using Support Vector Machines Recursive Feature Elimination (SVM-RFE), Least Absolute Shrinkage and Selection Operator (LASSO), and Random Forest (RF) algorithms. SVM-RFE iteratively screens genes to identify those that exert the greatest influence on the model. LASSO facilitates sparse selection of genes through the application of penalty coefficients, while the RF algorithm is adept at processing high-dimensional data and effectively identifying key gene characteristics. However, due to limitations in sample size, only four genes (ENTREP1, KIAA0513, PCSK2, PITPNM3, MMP14) were successfully identified through LASSO regression.
2.20 Single cell transcriptome data analysis
Immune and non-immune cell data were extracted from the single-cell RNA sequencing dataset GSE217517. The expression levels of MMP14 in these two groups were analyzed preliminarily. To ensure data quality, quality control was performed. Specifically, low-quality cells (cells with fewer than 200 expressed features) were removed. The data were then normalized and scaled using the NormalizeData and ScaleData functions from the ‘Seurat’ package. We selected the top 2000 most variable genes using the FindVariableFeatures function. Next, principal component analysis (PCA) was performed on the data using the RunPCA function in Seurat, followed by batch effect correction with the Harmony package. Subsequently, cell clustering was performed using the FindClusters function with a resolution of 0.2 and the Louvain clustering algorithm to identify cell subpopulations. To further explore the distribution and structure of the cells, t-distributed Stochastic Neighbor Embedding (t-SNE) was used for nonlinear dimensionality reduction, facilitating the visualization of relationships between different cell populations. Based on the t-SNE visualization, we observed the distribution of different cell subpopulations. We then annotated the cell subpopulations using common cell marker genes for classification. By comparing gene expression features across the different populations, we further analyzed the differences between immune and non-immune cells, with a particular focus on the expression of MMP14 in the various subpopulations.
3 Results
3.1 Machine learning screening of transcriptome candidate genes
Initially, we conducted a transcriptomic differential analysis on cancerous and paracancerous samples, revealing that the number of up-regulated and down-regulated significant differential genes was comparable between the two groups (Figure 1A). Furthermore, the Gene Ontology (GO) and Kyoto Encyclopedia of Genes and Genomes (KEGG) enrichment analyses did not identify tumor-related pathways (Figures 1B, C). Consequently, we employed machine learning techniques to analyze the significantly different genes between the two groups. Specifically, we utilized Support Vector Machines with Recursive Feature Elimination (SVM-RFE), Least Absolute Shrinkage and Selection Operator (LASSO), and Random Forest (RF) algorithms to further screen for key genes among the differential genes. Our results identified four related differentially expressed genes through LASSO: ENTREP1, KIAA0513, PCSK2, and PITPNM3 (Figure 1D). Additionally, the RF algorithm highlighted MMP14 (Figures 1E, F). Based on existing literature on colorectal cancer, we selected MMP14 as the final candidate gene for subsequent studies. To investigate variations in MMP14 expression between normal and tumor tissues, mRNA levels of MMP14 were examined across different cancer types and their respective normal tissues utilizing the TIMER database (www.timer.cistrome.org/) (18, 19). Our analysis revealed a notable increase in MMP14 mRNA levels across various cancer types, including BLCA and COAD, among others (Supplementary Figure S1A). Conversely, MMP14 expression levels decreased in KICH, PRAD, and UCEC cancers. Immunohistochemistry (IHC) analysis was performed on normal and tumor tissues from CRC patients to assess MMP14 protein expression. The findings illustrated in Supplementary Figure S1B demonstrate a significant elevation in MMP14 protein expression in CRC compared to normal tissues.
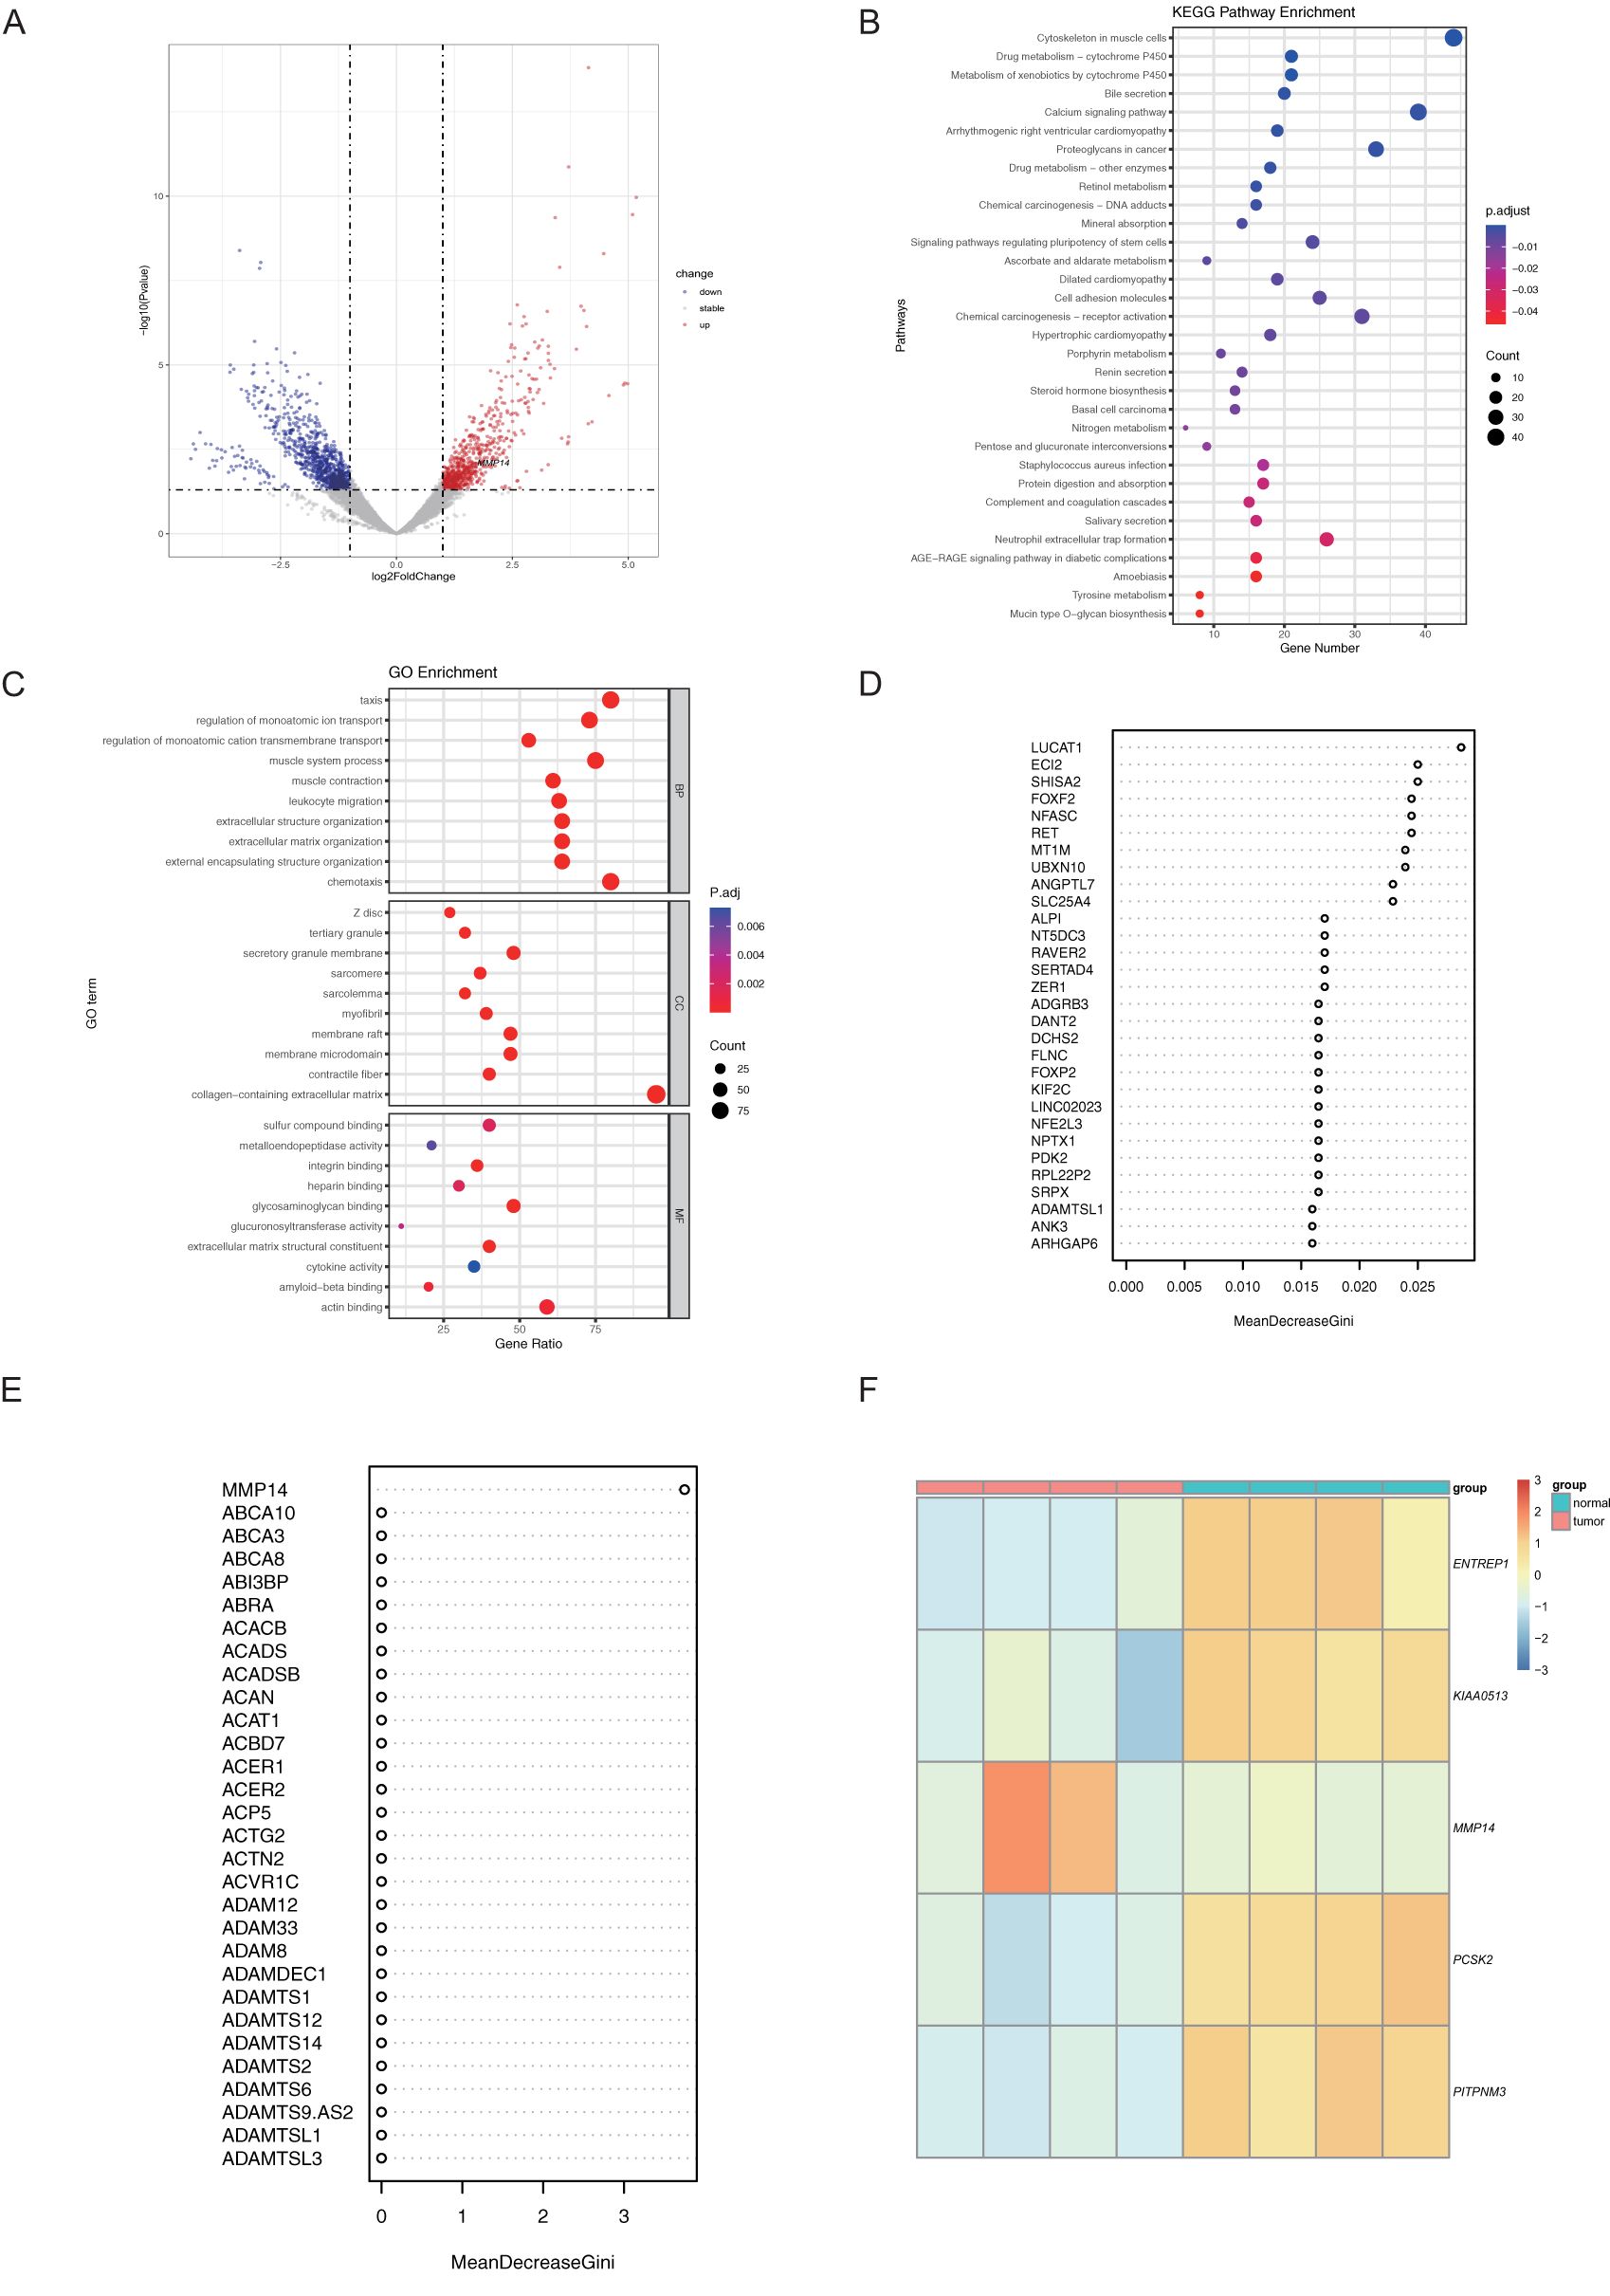
Figure 1. Transcriptome data were analyzed using machine learning to identify candidate genes. (A) Presents a volcano plot illustrating differential transcriptome expression; (B) The results of Gene Ontology (GO) enrichment analysis for significantly differentially expressed genes; (C) The results of Kyoto Encyclopedia of Genes and Genomes (KEGG) enrichment analysis for these genes; (D, E) Candidate genes were identified using the Random Forest (RF) method in (D) and the Least Absolute Shrinkage and Selection Operator (LASSO) method in (E); (F) Heatmap depicting the differential expression of the candidate genes.
3.2 Relationship between MMP14 and immune microenvironment in colorectal cancer
To further elucidate the relationship between high MMP14 gene expression and colorectal cancer, we utilized single-cell transcriptome data from public databases for analysis (Figure 2A). Our findings indicated that MMP14 is predominantly expressed in non-immune cells. A more detailed examination of these non-immune cells revealed that MMP14 expression was particularly high in fibrocyte cells (Figures 2B, C). Consequently, we subdivided the fibrocyte population, resulting in the identification of six distinct cell subpopulations (Figure 2D). Among these, the Fib6 subpopulation exhibited the highest expression of MMP14 (Figure 2E). Upon analyzing samples derived from the Fib6 subpopulation, we discovered that this population primarily originates from liver metastasis samples (LM) (Figure 2F). We subsequently conducted differential analysis on the Fib6 subpopulation to investigate the functional role of fibrocyte cells with elevated MMP14 expression (Figure 2G). The results of Gene Ontology (GO) enrichment analysis and Kyoto Encyclopedia of Genes and Genomes (KEGG) enrichment analysis of the differentially expressed genes indicated that these differences are associated with pathways closely related to tumorigenesis, including the PI3K-Akt, MAPK, and proteoglycans in cancer pathways (Figures 2H, I). Subsequently, we conducted an analysis of immune cells using single-cell sequencing (Figure 3A). The results indicated that immune cells could be primarily categorized into four major groups. Notably, significant differences were observed in immune cell populations, particularly T cells and B cells, between the MMP14 high expression group (LM) and the low expression group (CC) (Figures 3B, C). These findings suggest that elevated MMP14 expression is associated with the progression of colorectal cancer and may influence the tumor-related immune microenvironment.
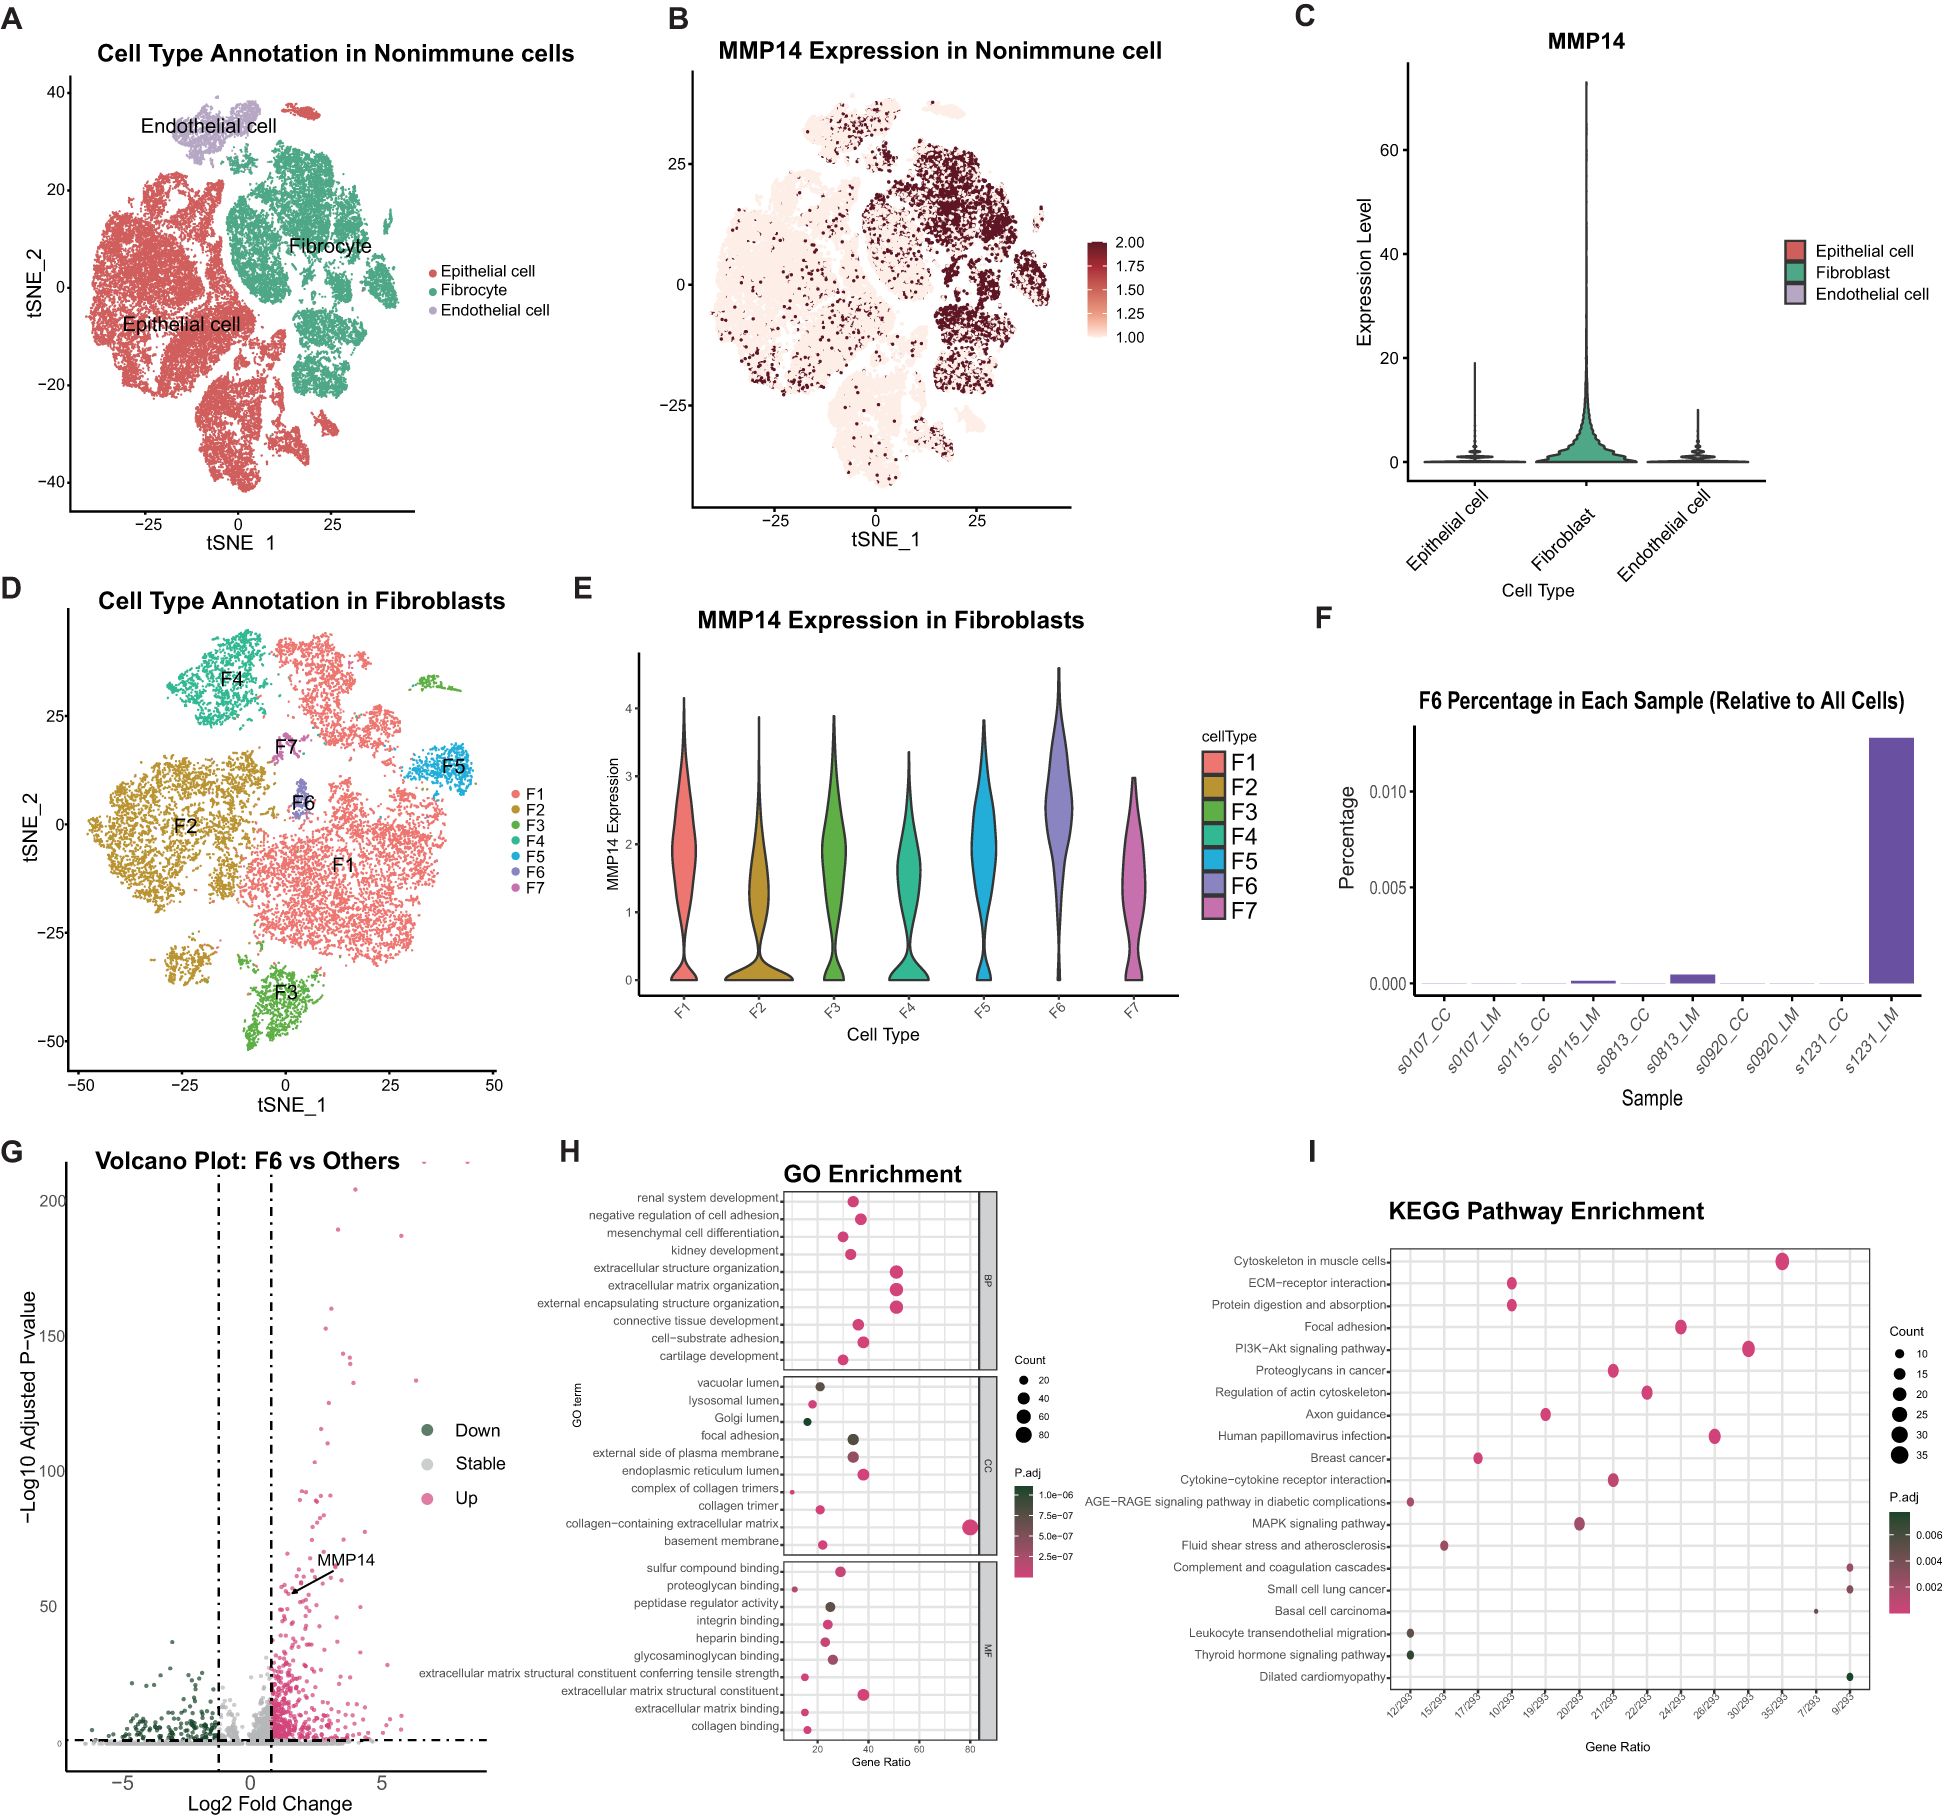
Figure 2. Single-cell transcriptome analysis of the relationship between MMP14 and colorectal cancer. (A) CD45 negative non-immune cell annotated tSNE; (B) Expression of MMP14 in different cell subsets of tSNE; (C) The expression of MMP14 among different cell subsets; (D) Fibroblasts subgroup subdivision; (E) The expression of MMP14 in different subpopulations after Fibroblasts subgroups; (F) Fib6 ratio among different samples; (G) Fib6 and other Fib difference analysis volcano map; (H) GO enrichment analysis of differential genes; (I) KEGG enrichment analysis of differential genes.
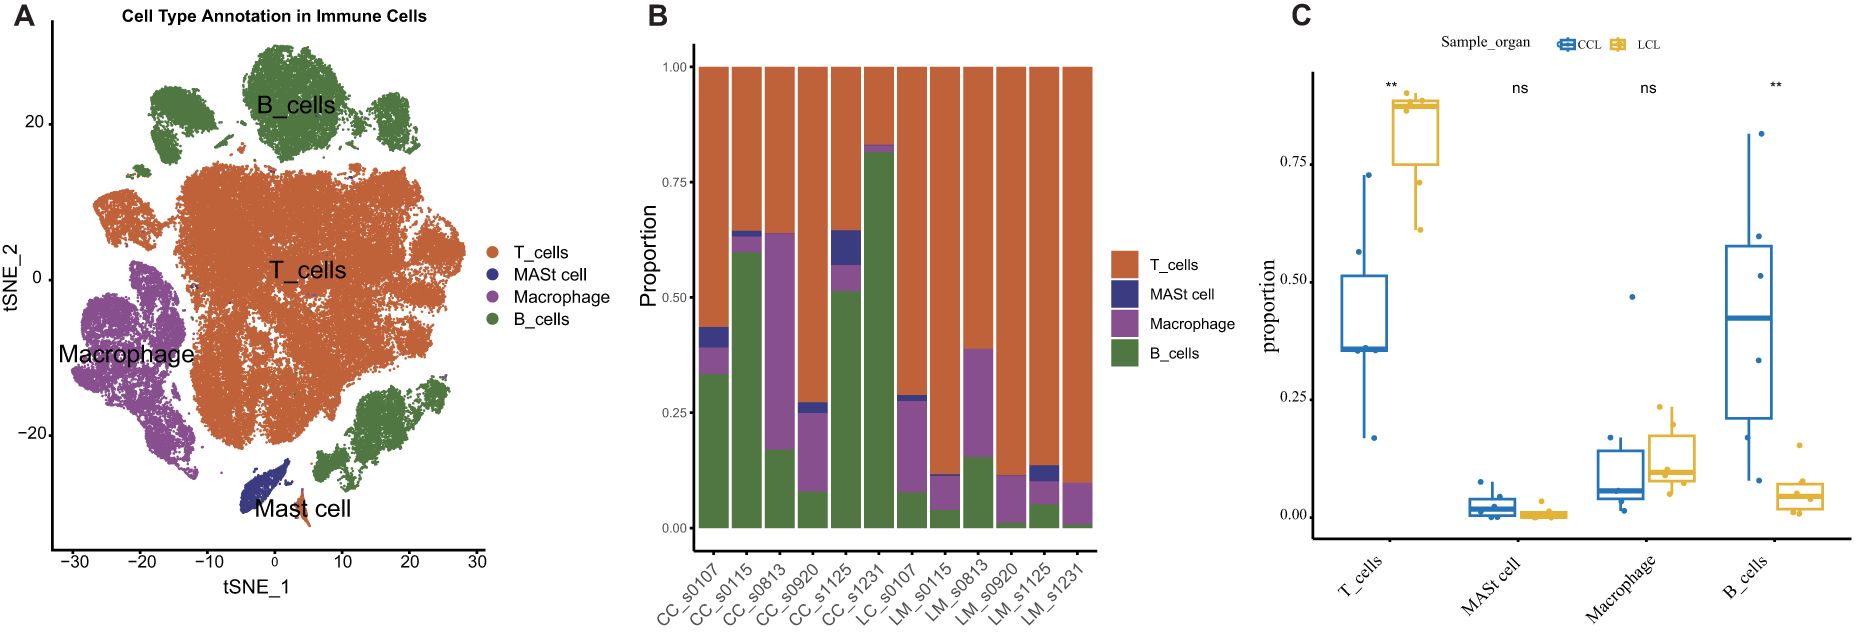
Figure 3. Single-cell transcriptome analysis of the relationship between MMP14 and colorectal cancer. (A) CD45-positive immune cell annotated tSNE; (B) Histogram of the proportional accumulation of immune cells between different samples; (C) A 50-point bitmap of the significant difference of immune cells between the two groups. Statistical significance is denoted as **P < 0.01. ns means no significant difference, p greater than 0.05.
3.3 Association of MMP14 overexpression with prognosis
The impact of MMP14 on colorectal adenocarcinoma (COAD) was investigated by analyzing OS and PFS in TCGA-COAD cohorts with varying expression levels. Our analysis revealed significant associations between MMP14 expression and both OS and PFS (Supplementary Figure S2). Specifically, elevated MMP14 levels were correlated with unfavorable outcomes, including OS (p = 0.035) and PFS (p = 0.017). These findings were further validated using the GSE39582 dataset, confirming a significant impact of the MMP14 gene on prognosis (p < 0.001). Results of correlation analysis between mmp14 expression and poor prognosis underscores the potential of MMP14 as a prognostic biomarker for COAD. The results from external validation further highlight the importance of MMP14 in determining patient outcomes, suggesting its prospective utility in clinical practice for predicting COAD prognosis.
3.4 Association between MMP14 expression and clinical characteristics
Subsequently, we investigated the correlation between MMP14 expression and pathological findings. The characteristics of the patients were classified into two groups, revealing notable correlations between MMP14 mRNA levels and patient age (p = 0.046), progression to advanced TNM stage (p = 0.025), and N stage (p = 0.0011). Notably, no significant association was observed between MMP14 concentrations and various clinicopathological variables, including sex (p = 0.99), tumor stage (p = 0.083), and metastasis stage (p = 0.51), as demonstrated in Supplementary Figures S3A–F.
3.5 Analysis of immune cell infiltration
Initially, a histogram (Supplementary Figure S4A) showed the distribution of 22 different immune cell types in each sample. The hues in the histogram represent the proportion of various immune cells in each sample. Subsequently, an evaluation was conducted to assess the correlation across 22 distinct types of immune cells in CRC tissues. Supplementary Figure S4B shows negative correlation in blue and positive correlation in red. An example is the strong connection between active mast cells and neutrophil cells. Macrophages M0 and resting NK cells positively correlated with activated mast cells. Conversely, resting mast cells and plasma cells negatively correlated with macrophage M0 cells. Additionally, the Wilcoxon test was employed to elucidate notably distinct immunological cell infiltrates in CRC.
The results of the Wilcoxon test are shown in Supplementary Figure S4C using a violin plot, which highlights 14 different immune cells (p < 0.05). Blue samples represent normal tissues, while red ones denote CRC samples. Plasma cells, dendritic cells in a resting state, gamma delta T cells, activated NK cells, macrophages M2, eosinophils, and resting mast cells exhibited a significant decrease in CRC compared to normal tissues. Conversely, resting CD4 memory T cells, follicular helper T cells, resting NK cells, macrophages M0, macrophages M1, activated mast cells, and neutrophils increased in CRC samples.
3.6 MMP14 expression levels and immune cell infiltration levels
We examined the potential relationship between MMP14 and tumor-infiltrating immune cells (TIICs) to elucidate the CRC microenvironment and its potential impact on CRC heterogeneity and prognosis. MMP14 expression was positively correlated with the presence of CD8+ T cells (r = 0.226, p = 4.43e-06), CD4+ T cell infiltration (r = 0.501, p = 5.75e-27), macrophage infiltration (r = 0.512, p = 2.04e-28), neutrophil infiltration (r = 0.509, p-value = 7.36e-28), dendritic cell infiltration (r = 0.546, p = 1.50e-32), and tumor purity (r = -0.343, p = 1.11e-12). Supplementary Figure S5A illustrates no significant association with B cell infiltration (r = 0.035, p = 4.86e-01).
Furthermore, we analyzed several differential immune cells, including neutrophils, dendritic cells, macrophages (M0, M1, M2), and other immune cells using different calculation algorithms such as CIBERSORT-ABS, MCPCOUNTER, XCELL, EPIC, and QUANTISEQ. Our results indicate that MMP14 expression is significantly positively associated with the previously highlighted immune cells (Supplementary Figures S5B-G).
3.7 Association of immunomodulators with MMP14 expression
Immunomodulators are compounds that influence the operation of the immune system. We analyzed the relationship between MMP14 expression and immunomodulators using immunoinhibitors and immunostimulators. Through the TISIDB database, we identified MMP14-related immunomodulators, and the heatmaps of immunopotentiators and immunosuppressants are shown in Supplementary Figures S6A, B. Our results indicated a significant connection between MMP14 and immunoinhibitors, such as TGFB1 (rho = 0.575), CSF1R (rho = 0.51), PDCD1LG2 (rho = 0.424), HAVCR2 (rho = 0.446) (Supplementary Figures S6C-F). The expression of ITGAL was also closely associated with immunostimulators, including TNFSF4 (rho = 0.629), CD86 (rho = 0.443), ENTPD1 (rho = 0.459), CD276 (rho = 0.436), TNFRSF8 (rho = 0.438), CXCL12 (rho = 0.412), and CXCR4 (rho = 0.405) (Supplementary Figures S6J-M). These findings suggest that ITGAL regulates tumor immune escape and is directly involved in immune interaction modulation.
3.8 Enrichment analysis of MMP14 co-expression genes
We utilized the TCGA datasets to analyze MMP14 co-expression, revealing a significant number of MMP14 co-expression genes. The genes and their correlations with MMP14 are presented in Table 2. Subsequently, we conducted gene ontology (GO) and Kyoto Encyclopedia of Genes and Genomes (KEGG) analyses on the co-expression genes (Supplementary Figure S7A). Supplementary Figure S7B displays the top 30 KEGG pathways, with proteoglycans in cancer ranking first. Additionally, the co-expressed genes were found to be associated with well-known signaling pathways such as PI3K-Akt, Rap1, relaxin, TGF-β, and Hedgehog. These pathways are strongly associated with the development of various malignancies as they play essential roles in controlling numerous biological functions, including metabolism and cell proliferation.

Table 2. Table of the genes significantly associated with MMP14 analyzed by TCGA database.
3.9 GSVA analysis
Moreover, the analysis of MMP14-related gene set variation analysis (GSVA) results revealed a positive correlation between MMP14 expression and various biological processes, including tumor inflammation, epithelial-to-mesenchymal transition (EMT) markers, and extracellular matrix (ECM) degradation. Conversely, MMP14 expression exhibited an inverse relationship with tumor proliferation, G2M checkpoint activity, and related processes. The associations were evaluated using distinct standards ranging from 0.00 to 1.0, indicating very weak to very strong correlations (p-values < 0.05) (Supplementary Figure S8).
3.10 Construction of MMP14 co-expression prognostic model
We employed univariate Cox regression analysis to identify 18 prognostic genes and evaluate their clinical significance in relation to MMP14 co-expression in colorectal cancer. These genes include CILP2, LIMK1, SPOCK3, TIMP1, CERCAM, CLEC11A, BGN, SERPINH1, NOTCH3, UBTD1, CHSY3, NUAK1, ZNF532, LOXL3, SLC39A13, LZTS1, KCNE4, ARHGEF17, and SLC2A3 (Figure 4A). Subsequently, we used LASSO regressions (Figures 4B, C) and multi-Cox regressions (Figure 4D) to refine the model genes. Risk assessment was completed using three genes - LIMK1, SPOCK3, and SLC2A3 - each assigned coefficient of 0.5776808, 1.3139298, and 0.2217219, respectively. Using the TCGA-COAD cohort as a median, we divided the patients into two groups (high and low). A notable difference in OS and PFS was observed between the two groups (p = 0.00013, Supplementary Figure S9E), with the ROC curve indicating areas under 0.627, 0.624, and 0.664 for 1, 3, and 5 years, respectively (Figure 4G). CRC patients in the high-risk group exhibited higher levels of LIMK1, SPOCK3, and SLC2A3 (Supplementary Figure S9H). The mortality increased in correlation with the risk assessment score (Figures 4I, J).
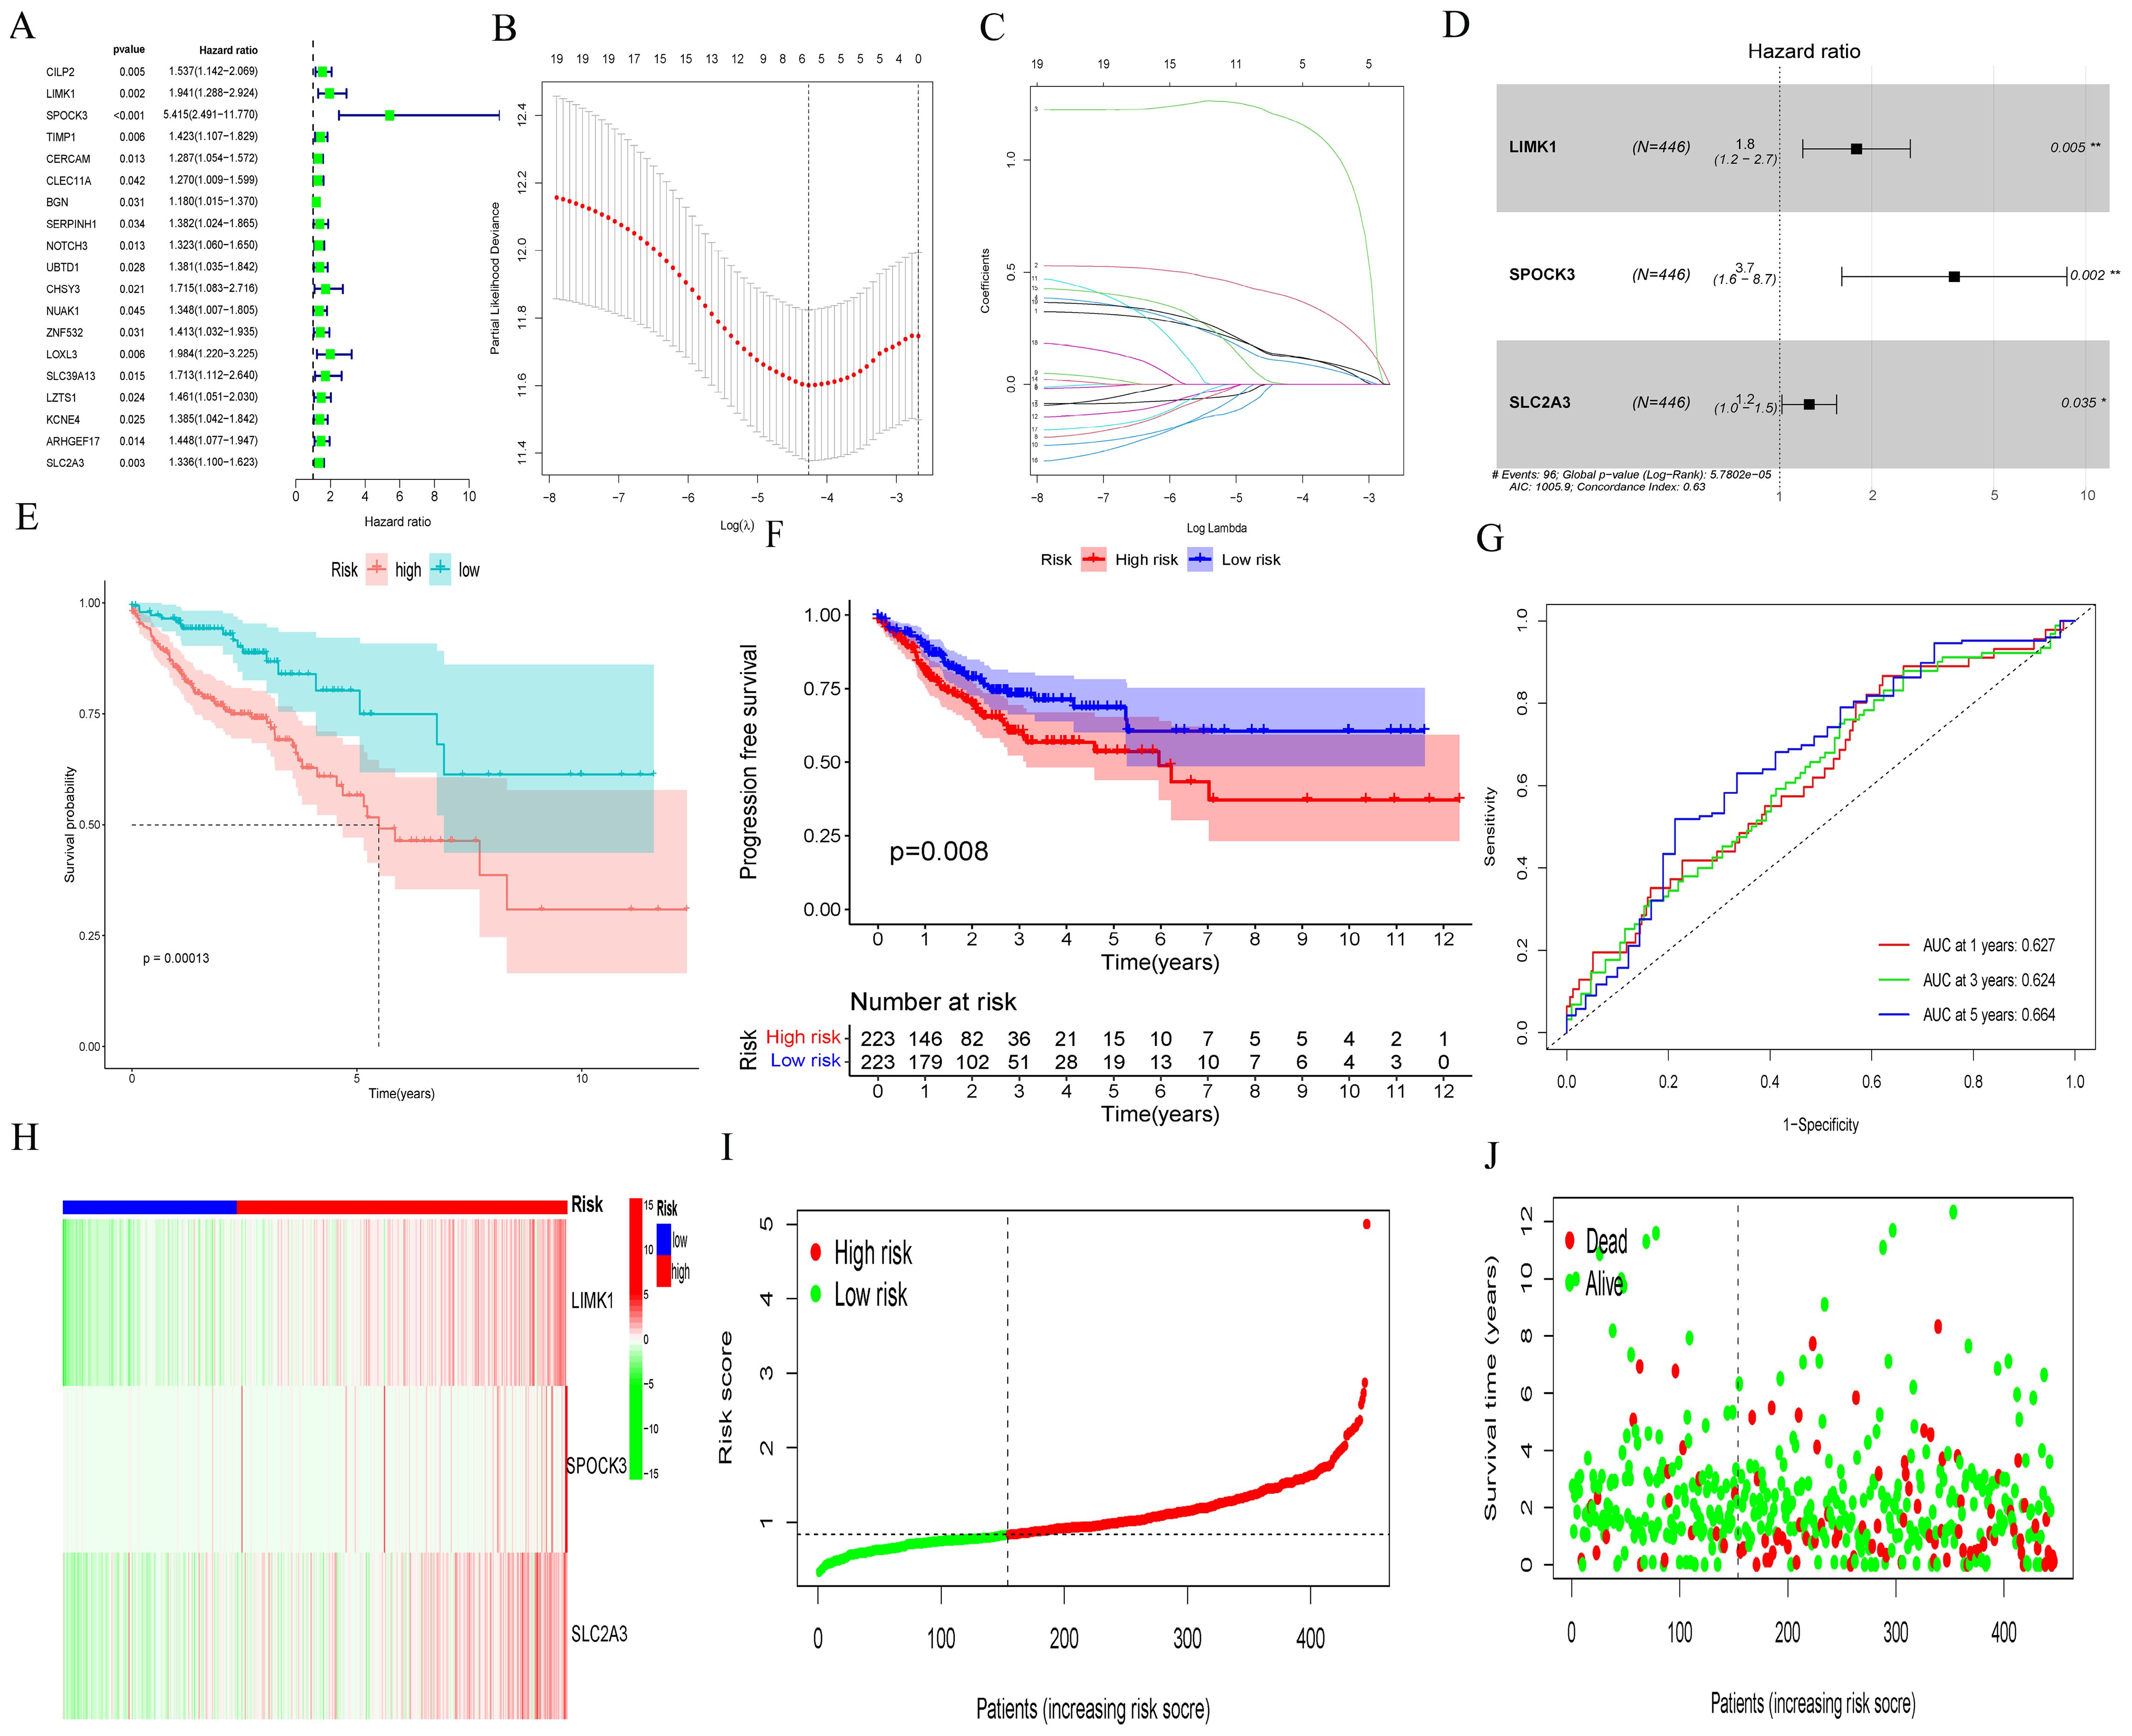
Figure 4. Development of prognostic gene markers based on MMP14-associated co-expression genes and MMP14. (A) Univariate Cox regression analysis to assess prognostic significance; (B, C) LASSO assays for feature selection; (D) Multivariate Cox regression analysis to construct prognostic model; (E, F) Evaluation of the impact of the prognostic model on OS and PFS; (G) ROC curves for model validation. (H-J) Heat map illustrating expression patterns of six genes, the distribution of risk score, and the survival status of CRC patients.
3.11 Independent validation of the prognostic signature
To examine the potential of the risk score as a standalone predictor of CRC prognosis, clinicopathological characteristics, the risk score were collected and analyzed through univariate and multivariate Cox regression analyses. The risk score was identified as an independent predictor of prognosis in univariate and multivariate Cox regression analyses (Supplementary Figures S9A, B). ROC analysis was conducted to evaluate the AUC values for the risk score. The AUC value for the risk score was determined as 0.665 (Supplementary Figure S9C). These findings indicate that the risk score holds promise as an independent predictive marker.
3.12 External validation of the prognostic model in the GSE39582 cohort
For external validation, the robustness of the prognostic model was verified using the GSE39582 dataset. Patients were stratified into two groups following the algorithm and median derived from the TCGA and COAD cohorts. Individuals in the high-risk group exhibited significantly worse overall survival than those in the low-risk group, which was consistent with the findings from TCGA (Supplementary Figure S10A). The distribution of risk scores, patient survival status, and heatmap for the three genes closely resembled those observed in the TCGA-COAD dataset (Supplementary Figures S10B–D).
3.13 Detection of MMP14 expression
To validate the results obtained from our initial analysis, we conducted qRT-PCR and Western blot assays. The findings demonstrated a significant increase in MMP14 expression in tumor tissues compared to normal tissues (Figures 5A, C). Additionally, to enhance the reliability of these results, we employed immunofluorescence methods on a patient sample to observe MMP14 expression in cancer cells (Figures 5B, D). The findings suggested that tumor tissue samples exhibited a higher MMP14 fluorescent signal intensity than normal tissue samples.
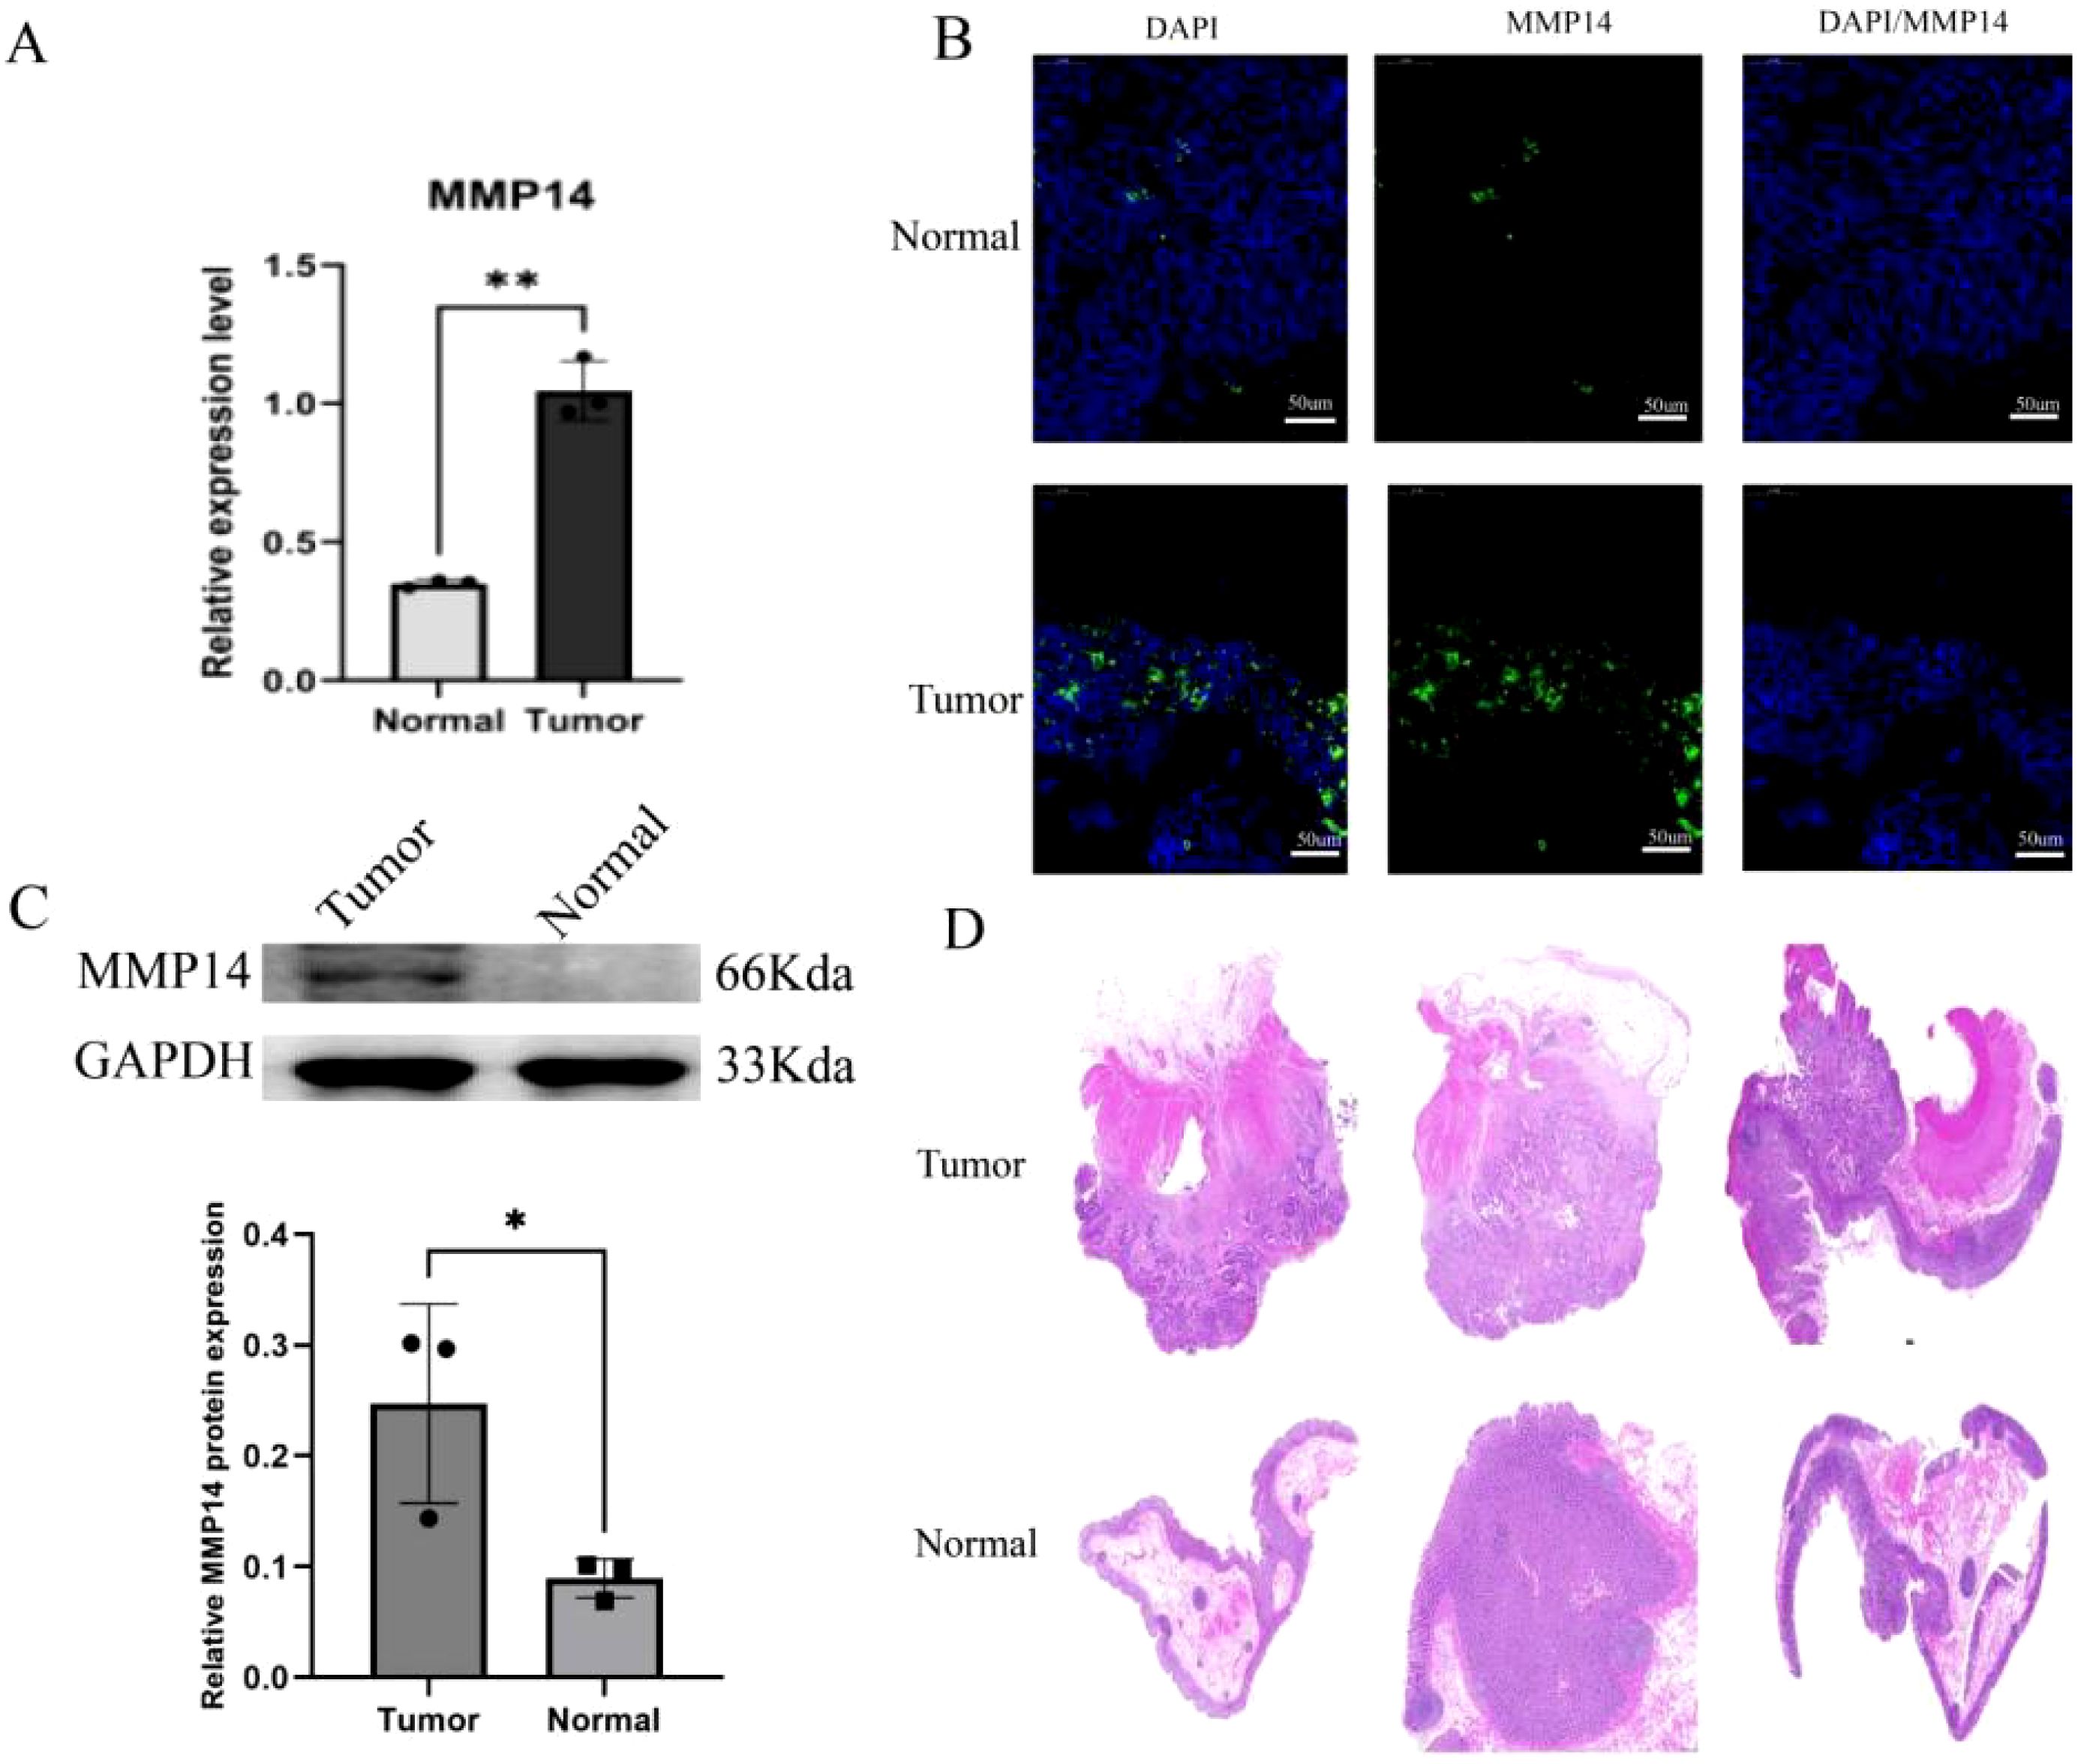
Figure 5. Experimental detection of MMP14 expression in clinical samples. (A) qRT-PCR for MMP14 expression detection; (B) Western blot for detection of MMP14 expression; (C) Immunofluorescence for the detection of MMP14 expression, with DAPI staining for cellular localization; (D) H&E staining of three pairs of cancerous and adjacent tissues. Statistical significance is denoted as *P < 0.05, **P < 0.01.
3.14 Exploration of cell phenotypes after MMP14 silencing
To explore the function of MMP14 in CRC, we developed an MMP14-silenced cell line. The success of our MMP14 silencing approach was confirmed through qRT-PCR analysis (Figure 6B). Subsequently, we assessed cell apoptosis and observed a significant increase in the proportion of apoptotic cells when MMP14 was silenced (Figure 6C). Additionally, the function of MMP14 co-expressed genes was related to inflammatory response. The expression level of inflammatory factor IL-1β was measured using qRT-PCR, revealing a significant increase in its expression upon MMP14 silencing (Figure 6A).
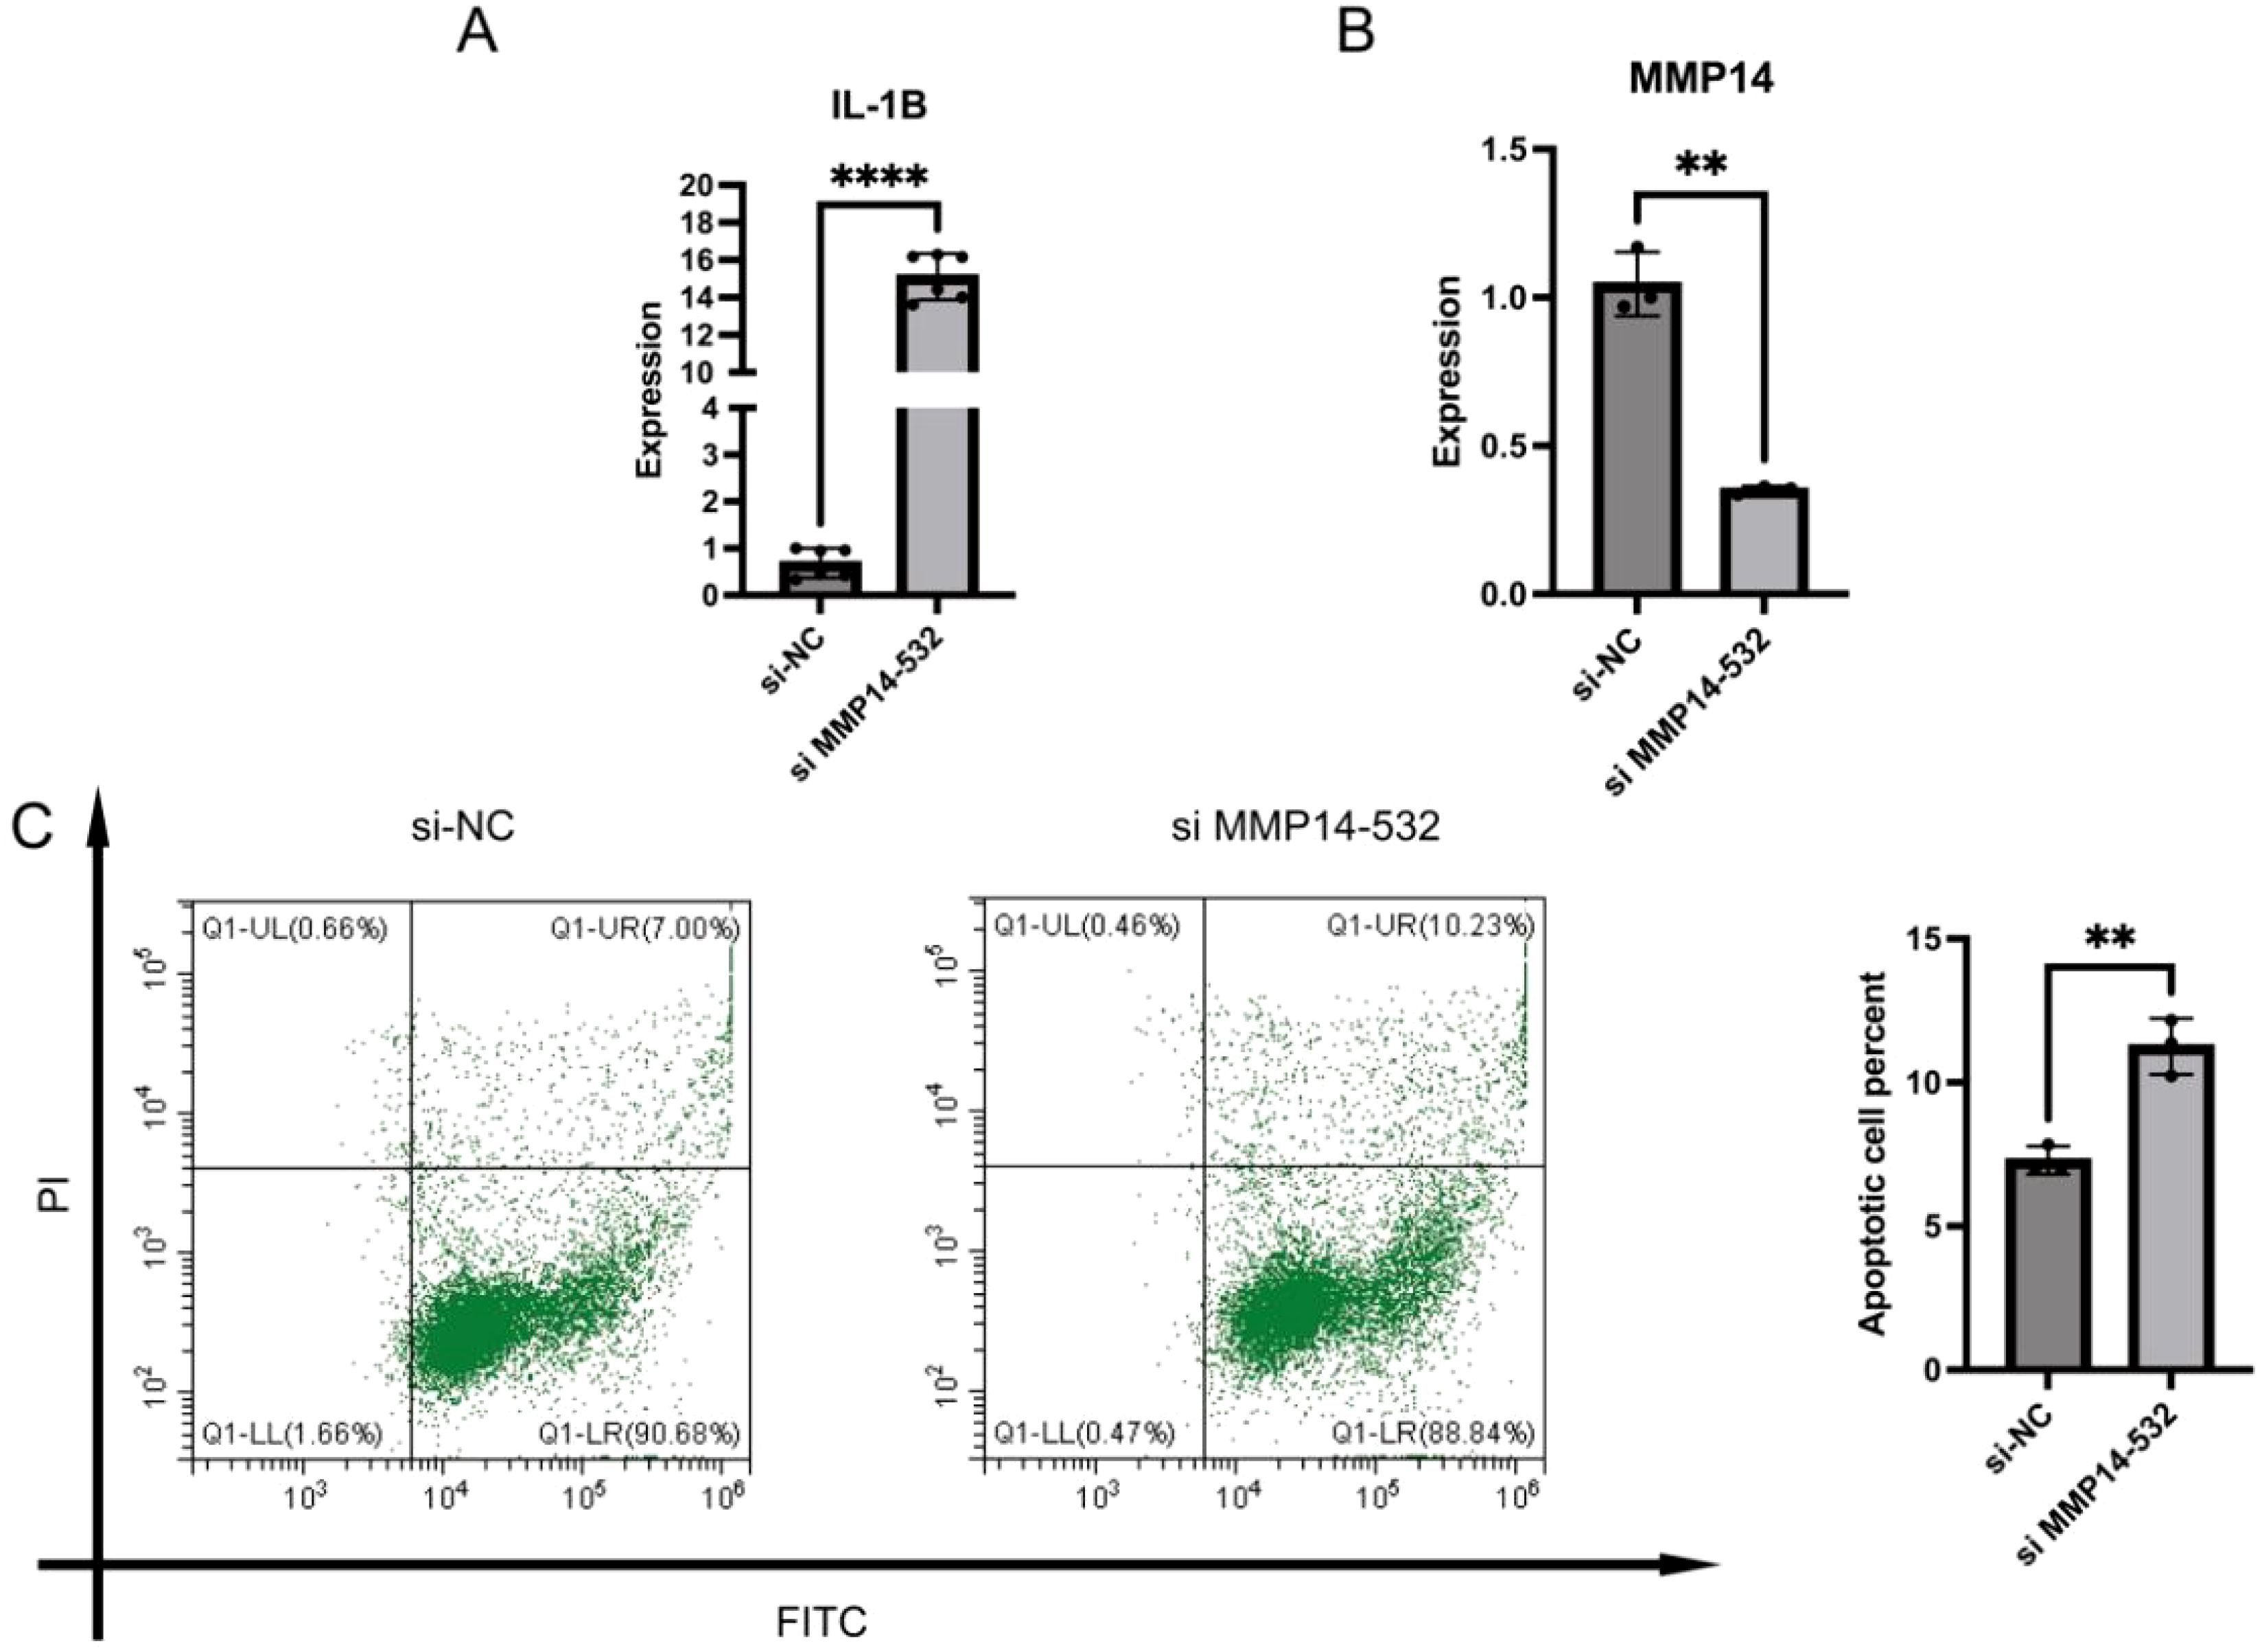
Figure 6. Construction of MMP14-silenced CRC cell system. (A) qRT-PCR detection of IL-1β mRNA expression; (B) Knockdown of MMP14 detected by qRT-PCR; (C) Flow cytometry was used to detect cell apoptosis following MMP14 silencing. Statistical significance is denoted as **P < 0.01, and ****P < 0.0001.
4 Discussion
Matrix metalloproteinases (MMPs), a group of fascinating genes, have been implicated in various processes such as invasion, cancer metastasis, immune surveillance evasion, and angiogenesis promotion (20). Among the MMPs, MMP14 is essential in numerous biological processes observed in healthy and malignant cells (21). Despite its association with several cancer types, including lung cancer (22), gastric cancer (23, 24), breast cancer (BRCA) (25), pancreatic carcinoma (26), and bladder cancer (BLCA) (27), comprehensive analyses of MMP14 in CRC remain limited (28).
The primary objective of this study was to elucidate the clinical significance and predictive value of MMP14 in CRC, including its comprehensive involvement in tumor-infiltrating immune cells. Using the TCGA database, we initially investigated MMP14 expression levels, revealing a significant elevation in MMP14 levels in CRC tissues compared to healthy tissues. This was further corroborated by Human Protein Atlas (HPA) data, which confirmed notably higher MMP14 protein abundance in CRC compared to normal tissues. Moreover, we observed a meaningful correlation between MMP14 mRNA levels and various clinical characteristics, including the TNM stage, suggesting that increased MMP14 expression is a pivotal factor in CRC progression.
Furthermore, our analysis using the TCGA database revealed that MMP14 was a significant indicator for OS and PFS. The results demonstrated that higher MMP14 expression was associated with lower OS and PFS, aligning with previous findings by Yang et al. (29), who also reported a negative outcome associated with MMP14 expression. Notably, further analysis confirmed MMP14 as a standalone prognostic indicator for overall survival.
We hypothesized that MMP14 may be associated with immune cell infiltration in colorectal cancer due to its significant role in the tumor microenvironment (30). Our results corroborated this hypothesis, demonstrating a relationship between MMP14 levels and dendritic cells, macrophages (including macrophage M0, M1, and M2 subtypes), and neutrophils in COAD using TIMER and TIMER 2.0. Our study revealed a correlation between MMP14 expression and various molecules regulating tumor immune cells, including CSF1R, HAVCR2, KDR, PDCD1LG2, TGFB1, CD70, CD86, and CXCL1. Additionally, CRC exhibited significantly elevated levels of resting CD4 memory T cells, macrophages M0 and M1, neutrophils, and other immune cells compared to normal tissue samples. Conversely, there were significantly fewer plasma cells and activated NK cells in CRC, suggesting a contributory role of immune cells in colorectal cancer progression, which aligns with previous research findings.
Moreover, the neutrophil-to-lymphocyte ratio is a valuable indicator for predicting adverse clinical outcomes and overall survival in CRC patients. This ratio reflects the presence of systemic inflammation and underscores the impact of neutrophils on disease progression (31). In addition, the mast cell-T cell axis has been implicated in influencing CRC growth in colitis-dependent and colitis-independent patients. Co-culture study has demonstrated that mast cell-primed tumors induce apoptosis in CRC cells (32).
GO and KEGG analyses were then conducted on co-expressed genes to explore potential pathways linked to MMP14, including proteoglycans in tumor development, Rap1 signaling pathway, phagosome, resistance to EGFR tyrosine kinase inhibitors, among others, shedding light on the complex mechanisms involving MMP14. Additionally, MMP14 GSVA analysis in CRC uncovered a strong association between MMP14 and pathways such as angiogenesis, TGFB signaling, ECM-related genes, and collagen formation, emphasizing the oncogenic role of MMP14 in CRC progression.
Utilizing co-expression analysis, we constructed prognostic models and gained insights into the molecular mechanisms underlying MMP14, enhancing our understanding of its impact on disease prognosis. This facilitates more precise predictions and personalized treatment strategies for CRC patients. A prognostic model incorporating MMP14 co-expression genes was developed, with risk scores calculated based on gene coefficients and expressions. These risk scores strongly correlate with colorectal cancer survival rates, encompassing overall survival and progression-free survival. These findings indicate the potential of MMP14 to accurately identify individuals at high risk among CRC patients. However, the lack of validation datasets and in vitro and in vivo trials to explore the roles of MMP14 limited our research. Further sophisticated studies are warranted to support our conclusions.
In conclusion, as a pro-oncogene, MMP14 significantly contributes to the development of CRC and is associated with immune cell infiltration and poor prognosis. Therefore, MMP14 can serve as a biomarker for predicting the prognosis of colorectal cancer patients.
Data availability statement
The original contributions presented in the study are included in the article/Supplementary Material. Further inquiries can be directed to the corresponding author.
Ethics statement
The studies involving humans were approved by Ethics Committee of The First Affiliated Hospital of Xi’an Jiaotong University. The studies were conducted in accordance with the local legislation and institutional requirements. The participants provided their written informed consent to participate in this study.
Author contributions
NL: Writing – original draft. NZ: Writing – original draft. GW: Conceptualization, Supervision, Writing – review & editing.
Funding
The author(s) declare that financial support was received for the research and/or publication of this article. This work was supported by the Shannxi Provincial Key R&D Program (2021SF-312).
Conflict of interest
The authors declare that the research was conducted in the absence of any commercial or financial relationships that could be construed as a potential conflict of interest.
Generative AI statement
The author(s) declare that no Generative AI was used in the creation of this manuscript.
Publisher’s note
All claims expressed in this article are solely those of the authors and do not necessarily represent those of their affiliated organizations, or those of the publisher, the editors and the reviewers. Any product that may be evaluated in this article, or claim that may be made by its manufacturer, is not guaranteed or endorsed by the publisher.
Supplementary material
The Supplementary Material for this article can be found online at: https://www.frontiersin.org/articles/10.3389/fonc.2025.1564375/full#supplementary-material
References
1. Gong Y, Dong R, Gao X, Li J, Jiang L, Zheng J, et al. Neohesperidin prevents colorectal tumorigenesis by altering the gut microbiota. Pharmacol Res. (2019) 148:104460. doi: 10.1016/j.phrs.2019.104460
2. Lai M, Liu G, Li R, Bai H, Zhao J, Xiao P, et al. Hsa_Circ_0079662 induces the resistance mechanism of the chemotherapy drug oxaliplatin through the Tnf-A Pathway in human colon cancer. J Cell Mol Med. (2020) 24:5021–7. doi: 10.1111/jcmm.15122
3. Zheng Y, Nie P, Xu S. Long noncoding Rna Casc21 exerts an oncogenic role in colorectal cancer through regulating Mir-7-5p/Yap1 axis. Biomed Pharmacother. (2020) 121:109628. doi: 10.1016/j.biopha.2019.109628
4. Tian L, Zhao Z-F, Xie L, Zhu J-P. Taurine up-regulated 1 accelerates tumorigenesis of colon cancer by regulating Mir-26a-5p/Mmp14/P38 Mapk/Hsp27 axis in vitro and in vivo. Life Sci. (2019) 239:117035. doi: 10.1016/j.lfs.2019.117035
5. Siegel RL, Wagle NS, Cercek A, Smith RA, Jemal A. Colorectal cancer statistics, 2023. CA: Cancer J Clin. (2023) 73:233–54. doi: 10.3322/caac.21772
6. Li Q, Wu J, Wei P, Xu Y, Zhuo C, Wang Y, et al. Overexpression of forkhead box C2 promotes tumor metastasis and indicates poor prognosis in colon cancer via regulating epithelial-mesenchymal transition. Am J Cancer Res. (2015) 5:2022.
7. Hornebeck W, Emonard H, Monboisse J-C, Bellon G. Matrix-directed regulation of pericellular proteolysis and tumor progression. Semin Cancer Biol. (2002) 12(3):231–41. doi: 10.1016/S1044-579X(02)00026-3
8. Rempe RG, Hartz AM, Bauer B. Matrix metalloproteinases in the brain and blood–brain barrier: versatile breakers and makers. J Cereb Blood Flow Metab. (2016) 36:1481–507. doi: 10.1177/0271678X16655551
9. Sato A, Kakinuma S, Miyoshi M, Kamiya A, Tsunoda T, Kaneko S, et al. Vasoactive intestinal peptide derived from liver mesenchymal cells mediates tight junction assembly in mouse intrahepatic bile ducts. Hepatol Commun. (2020) 4:235–54. doi: 10.1002/hep4.1459
10. Gonzalez-Molina J, Gramolelli S, Liao Z, Carlson JW, Ojala PM, Lehti K. Mmp14 in sarcoma: A regulator of tumor microenvironment communication in connective tissues. Cells. (2019) 8:991. doi: 10.3390/cells8090991
11. Pahwa S, Stawikowski MJ, Fields GB. Monitoring and inhibiting Mt1-Mmp during cancer initiation and progression. Cancers. (2014) 6:416–35. doi: 10.3390/cancers6010416
12. Heagerty PJ, Zheng Y. Survival model predictive accuracy and Roc curves. Biometrics. (2005) 61:92–105. doi: 10.1111/j.0006-341X.2005.030814.x
13. Newman AM, Steen CB, Liu CL, Gentles AJ, Chaudhuri AA, Scherer F, et al. Determining cell type abundance and expression from bulk tissues with digital cytometry. Nat Biotechnol. (2019) 37:773–82. doi: 10.1038/s41587-019-0114-2
14. Wei J, Huang K, Chen Z, Hu M, Bai Y, Lin S, et al. Characterization of glycolysis-associated molecules in the tumor microenvironment revealed by pan-cancer tissues and lung cancer single cell data. Cancers. (2020) 12:1788. doi: 10.3390/cancers12071788
15. Hänzelmann S, Castelo R, Guinney J. Gsva: gene set variation analysis for microarray and Rna-Seq data. BMC Bioinf. (2013) 14:1–15. doi: 10.1186/1471-2105-14-7
16. Li T, Fu J, Zeng Z, Cohen D, Li J, Chen Q, et al. Timer2.0 for analysis of tumor-infiltrating immune cells. Nucleic Acids Res. (2020) 48:W509–W14. doi: 10.1093/nar/gkaa407
17. Ru B, Wong CN, Tong Y, Zhong JY, Zhong SSW, Wu WC, et al. Tisidb: an integrated repository portal for tumor-immune system interactions. Bioinformatics. (2019) 35:4200–2. doi: 10.1093/bioinformatics/btz210
18. Li T, Fan J, Wang B, Traugh N, Chen Q, Liu JS, et al. Timer: A web server for comprehensive analysis of tumor-infiltrating immune cells. Cancer Res. (2017) 77:e108–e10. doi: 10.1158/0008-5472.CAN-17-0307
19. Li B, Severson E, Pignon J-C, Zhao H, Li T, Novak J, et al. Comprehensive analyses of tumor immunity: implications for cancer immunotherapy. Genome Biol. (2016) 17:1–16. doi: 10.1186/s13059-016-1028-7
20. Gobin E, Bagwell K, Wagner J, Mysona D, Sandirasegarane S, Smith N, et al. A pan-cancer perspective of matrix metalloproteases (Mmp) gene expression profile and their diagnostic/prognostic potential. BMC Cancer. (2019) 19:1–10. doi: 10.1186/s12885-019-5768-0
21. Lehti K, Allen E, Birkedal-Hansen H, Holmbeck K, Miyake Y, Chun T-H, et al. An Mt1-Mmp-Pdgf receptor-B Axis regulates mural cell investment of the microvasculature. Genes Dev. (2005) 19:979–91. doi: 10.1101/gad.1294605
22. Zheng C-L, Lu Q, Zhang N, Jing P-Y, Zhang J-P, Wang W-P, et al. Comprehensive analysis of the immune and prognostic implication of Mmp14 in lung cancer. Dis Markers. (2021) 2021:5917506. doi: 10.1155/2021/5917506
23. Wang X, Meng Q, Wang Y, Gao Y. Overexpression of Mmp14 predicts the poor prognosis in gastric cancer: meta-analysis and database validation. Medicine. (2021) 100(32):e26545. doi: 10.1097/MD.0000000000026545
24. Kasurinen A, Gramolelli S, Hagström J, Laitinen A, Kokkola A, Miki Y, et al. High tissue Mmp14 expression predicts worse survival in gastric cancer, particularly with a low Prox1. Cancer Med. (2019) 8:6995–7005. doi: 10.1002/cam4.v8.16
25. Zhou X, Yang S, Liu Q, Wei R, Liu J, Luo N, et al. Leptin promotes the proliferation and migration of mda-Mb-231 breast cancer cells by up regulating Mmp14. Xi bao yu fen zi Mian yi xue za zhi= Chin J Cell Mol Immunol. (2022) 38:39–47.
26. Li Y, Su Z, Wei B, Qin M, Liang Z. Bioinformatics analysis identified Mmp14 and Col12a1 as immune-related biomarkers associated with pancreatic adenocarcinoma prognosis. Math Biosci Eng. (2021) 18:5921–42. doi: 10.3934/mbe.2021296
27. Wang J, Gong Y, He Y, Ying W, Li X, Zhou X, et al. High expression of Mmp14 is associated with progression and poor short-term prognosis in muscle-invasive bladder cancer. Eur Rev Med Pharmacol Sci. (2020) 24:6605–15. doi: 10.26355/eurrev
28. Cui G, Cai F, Ding Z, Gao L. Mmp14 predicts a poor prognosis in patients with colorectal cancer. Hum Pathol. (2019) 83:36–42. doi: 10.1016/j.humpath.2018.03.030
29. Yang B, Gao J, Rao Z, Shen Q. Clinicopathological and prognostic significance of A5β1-integrin and Mmp-14 expressions in colorectal cancer. Neoplasma. (2013) 60:254–61. doi: 10.4149/neo_2013_034
30. Steven A, Seliger B. The role of immune escape and immune cell infiltration in breast cancer. Breast Care. (2018) 13:16–21. doi: 10.1159/000486585
31. Mazaki J, Katsumata K, Kasahara K, Tago T, Wada T, Kuwabara H, et al. Neutrophil-to-lymphocyte ratio is a prognostic factor for colon cancer: A propensity score analysis. BMC Cancer. (2020) 20:922. doi: 10.1186/s12885-020-07429-5
32. Sakita JY, Elias-Oliveira J, Carlos D, de Souza Santos E, Almeida LY, Malta TM, et al. Mast cell-T cell axis alters development of colitis-dependent and colitis-independent colorectal tumours: potential for therapeutically targeting via mast cell inhibition. J Immunother Cancer. (2022) 10(10):e004653. doi: 10.1136/jitc-2022-004653
Keywords: MMP14, prognosis, immune cell infiltration, CRC, machine learning, RNA-seq
Citation: Li N, Zhang N and Wang G (2025) Overexpression of MMP14 is associated with poor prognosis and immune cell infiltration in colon cancer. Front. Oncol. 15:1564375. doi: 10.3389/fonc.2025.1564375
Received: 21 January 2025; Accepted: 25 March 2025;
Published: 25 April 2025.
Edited by:
Zhe-Sheng Chen, St. John’s University, United StatesCopyright © 2025 Li, Zhang and Wang. This is an open-access article distributed under the terms of the Creative Commons Attribution License (CC BY). The use, distribution or reproduction in other forums is permitted, provided the original author(s) and the copyright owner(s) are credited and that the original publication in this journal is cited, in accordance with accepted academic practice. No use, distribution or reproduction is permitted which does not comply with these terms.
*Correspondence: Guanghui Wang, YW1vbkBtYWlsLnhqdHUuZWR1LmNu; c2h1YmFpamkwMzc1OWl5YUAxNjMuY29t