 Xinyan Zeng
 Wentian Wu
 Xiaoqin Li1,2
 Yingying Du
- 1Department of Chinese Integrative Medicine Oncology, The First Affiliated Hospital of Anhui Medical University, Hefei, China
- 2Department of Integrated Traditional Chinese and Western Medicine, Anhui Medical University, Hefei, China
- 3Department of Medical Oncology, The First Affiliated Hospital of Anhui Medical University, Hefei, China
- 4Graduate School of Anhui University of Traditional Chinese Medicine, Hefei, China
Background: Ovarian cancer (OC) is the most common malignant gynecological tumor. Cancer cells with high stemness often exhibit resistance to anti-tumor therapies, contributing to recurrence and poor prognosis. However, stemness-related subtypes in OC and their therapeutic implications remain underexplored.
Methods: We identified stemness-associated genes by comparing transcriptome profiles between adherent and sphere-forming SKOV3 cells. Unsupervised clustering was applied to define stemness-related molecular subgroups in OC patients. A prognostic model was constructed using WGCNA and LASSO regression, and a nomogram was developed by integrating clinicopathological variables. Differences in the tumor microenvironment (TME), tumor mutation burden (TMB), immune checkpoint expression, and drug sensitivities were evaluated between risk groups. Single-cell RNA sequencing was used to investigate stemness-related cell types. Functional assays were conducted to validate the role of AKAP12 in OC progression.
Results: Three distinct stemness-related subgroups were identified with significant differences in prognosis and immunological features. Fibroblasts were identified as major contributors to the maintenance of stemness traits in the TME. AKAP12 was found to be positively associated with stemness phenotypes. Knockdown of AKAP12 reduced tumor sphere formation, impaired cell migration, and enhanced cisplatin sensitivity. Immunohistochemistry in clinical samples and OC organoids confirmed the correlation between AKAP12 and the immune checkpoint molecule OX40L.
Conclusion: This study establishes a novel stemness-related gene signature for prognosis prediction and therapeutic stratification in OC. AKAP12 was identified as a potential biomarker and therapeutic target, offering new avenues for precision treatment in stemness-driven OC.
1 Introduction
As per epidemiological statistics, ovarian cancer (OC) is the eighth common cancer in terms of female prevalence and remained to be the most fatal gynecologic cancer in 2020 (1, 2). The in-depth dissections of single-cell methodology illustrate substantial heterogeneity of OC, underscoring the phenomena of chemoresistance, immune-suppression, angiogenesis, and distant migration that can be result in (3, 4). Additionally, distinct subtypes within sophisticated and varied TME are observed in independent OC tissues changing the notion of treating OC as a single homogeneous entity (5). Furthermore, the number of viable approaches will come to a failure, leading to a decline of overall survival (OS), when drug resistance emerges, since the majority patients encounter resistance and therapeutic failure (6–8). A meta-analysis indicates immunotherapeutic agents are regarded as possessing high levels of safety and efficacy (9). Drawing upon that specific cell type expressing molecular characteristics and potential therapeutic targets, exerts profound impact on the therapeutic responses and OS (10, 11), it’s advisable for us to explore and investigate novel biomarkers to guide personalized treatment strategies.
On reviewing previous studies, we noticed that the mechanisms leading to OC drug resistance include DNA damage repair, alterations in transmembrane transport, and abnormal signaling pathways. Cancer stem cells are important components that have not yet been fully explored (12–14). Based on the postulated cancer stem cell theory, OC stem cells maintain tumorigenesis at the metastatic site of the tumor, and a subpopulation of cancer stem cells possesses metastasis and drug resistance phenotypes (15). As a rare subgroup of cancer cells with the capacity for chemotherapy resistance, OC stem cells have evolved from tumor cells that have the capacity to invade and resist chemotherapy (16). On the other hand, the widespread application of conventional chemotherapy has been linked to the upregulation of stem characteristics and facilitation of epithelial to mesenchymal transition and exacerbation metastasis, thereby intensifying the metastatic potential of clinical treatment (17, 18). The intricate interference between OC stem cells and the immune and non-immune components lead to the dysfunction of immune surveillance and suppression, creating a favorable environment for the transplant and proliferation of stem cells (19, 20). Therefore, the investigation of TME can present a promising avenue for seeking novel therapeutic targets.
Previous studies have evaluated the potential role of immune checkpoints in the stem cell subgroups of OC cells and found strong bonds, which elucidated the feasibility of immune checkpoint inhibitor therapy (21, 22). Crosstalk exists between cancer stem cells and immune cells. Cancer stem cells can inhibit the transport, maturation, and differentiation of antigen-presenting cells (APCs), such as dendritic cells (DCs) and macrophages. Suppressor immune cells can be recruited using cytokines or chemokines secreted by stem cells (23). Therefore, they contribute to the formation of an immunosuppressive microenvironment and facilitate the escape of cancer stem cells from immune surveillance. Notably, inflammation arising from cytokines secreted by tumor-associated immune cells can lead to the migration of cancer stem cells to maintain tumor growth (24, 25). In addition, given that cancer stem cells interact with immune checkpoint molecules to produce immunosuppressive factors, exploring and targeting novel immune checkpoints may be a potentially valuable approach for individual treatment (26, 27).
In recent years, traditional transcriptome analysis has been used to detect the differential expression of genes in multiple samples, ignoring the crosstalk between cellular compositions. Currently, single-cell RNA-sequencing (scRNA-seq) analysis has made a breakthrough in identifying unique cells with a high revolution and revealing interactions among different subtypes (28–30). Therefore, we first identified stem cell genes by analyzing transcriptome sequencing data before and after OC cell differentiation. To evaluate the performance, unsupervised clustering was employed to identify specific clusters with high levels of stemness. By applying a weighted gene correlation network analysis (WGCNA), we filtered out genes that were strongly correlated with stemness. Subsequently, risk genes were identified to construct a prognostic model, and their coefficients were calculated using machine learning algorithms. We explored its correlation with immune infiltration, molecular function, and drug resistance to identify possible therapeutic targets. Finally, by integrating multiple single-cell datasets, signaling pathways regulating the formation of stem cells and correlations among all cell types in different malignant groups were discovered. Though large amounts of studies reckoned the key role of stem cells in relapse and resistance, the approach to eradicate the cancer stem cells hadn’t developed yet (31).
This study contributes to the identification of therapeutic targets for individual treatments by investigating the prognostic value of stem cell genes. The established risk model may robustly predict the survival rate and response to immunotherapy.
2 Materials and methods
2.1 Datasets acquisition and preprocessing
Firstly, the clinical follow-up information, expression data and somatic mutation data of 379 OC patients in TCGA database could be obtained from the GDC hub of UCSC Xena browser (https://xenabrowser.net/). Due to the inconsistence of gene length, we transformed the original expression data to the transcripts per million (TPM) values and conducted the exponential transformation of data for superior comparability. Meanwhile, patients’ microarray data and survival information (GSE26712) (32), (GSE32062) (33) and gene expression data of SKOV3 cells in different status (GSE232783) (34) could be obtained from GEO database (https://www.ncbi.nlm.nih.gov/geo/). Under stringent quality control, scRNA-seq data of primary OC samples covering high- and low-grade was acquired as well (35). Furthermore, in order to eliminate the potential cross-dataset batch effects, we employed “sva” package during the analyses based on the empirical Bayes framework (36).
2.2 Function enrichment analyses of differentially expressed genes
Building upon the result detected in prior research (34), it’s evident that the emerge of aggresomes not only preserves the stem-like properties, but also remarkably strengthens the aggressiveness of OC cells. Therefore, by meticulously comparing the hub genes altered during the transition to aggresomes, we aim to seek and discern novel stem genes, which are anticipate in exerting fatal impact on OC patients’ survival outcomes. In order to identify differentially expressed genes (DEGs), we utilized “limma” R package (37) to filter genes with significant changes before and after OC cells differentiation. Our selection was under the threshold of adjusted p value < 0.05 and |log2foldchange| ≥ 1. To investigate the molecular mechanisms, biological functions and cellular components of stem genes, we performed gene ontology (GO) and Kyoto Encyclopedia of Gene and Genome (KEGG) enrichment analysis via gene datasets acquired from “clusterProfiler” package (38). Taking interaction among genes into consideration, we mapped a line diagram to manifest the alteration of various signaling pathways by conducting Gene Set Enrichment Analysis (GSEA) (39). The criteria of selection were set as p < 0.05 and false discovery rate (FDR) < 0.25.
2.3 Consensus clustering of stem genes in OC
After conducting univariable Cox regression analysis to select stem genes with prognostic value, we further utilized “ConsensusClusterPlus” R program (40) to apply unsupervised clustering of stemness characteristics for patients in TCGA cohort. By separating all the patients into k (k=2-9) subgroups, we determined the favorable cluster numbers and the expression profile of stem genes was calculated to ensure the robust differences among subgroups. Meanwhile, Kaplan-Meier (KM) curves were represented to investigate whether OS exhibited difference in all subgroups.
2.4 Comparing the immune infiltration between stem subgroups
For detecting the correlation between stem genes and immune infiltration, “estimate” R package (41) was applied to calculate the immune score, estimate score, stromal score and tumor purity with estimate algorithm. Subsequently, we employed single-sample gene set enrichment (ssGSEA) algorithm (42) to explore the abundance and distribution of 28 immune cells in stem subgroups. Through analyzing the expression of immune checkpoints and evaluating the immune infiltration extent, we would successfully seek for the association between immune functions and stem genes.
2.5 Phenotype score and WGCNA
To estimate the stem level of each sample, we conducted ssGSEA algorithm, which could unfold the coordinated upward or downward adjustments of imported gene sets utilizing “GSVA” R package (43). Through calculating stem score of OC samples in TCGA cohort, we acknowledged the enrichment degree of stem genes. What’s more, WGCNA could divide high-throughput data into multiple co-expression modules and illustrated the potential linkage between modular genes and clinical phenotypes (44–46). For seeking genes with significant biological and clinical traits, it’s advisable for us to select related modules, whose genes could be natural candidates for further analysis. Genes with the same pattern were separated into the same module and associations between modules and clinical traits were assessed using Pearson’s correlation analysis.
2.6 Construction and validation of stem prognostic model
In the first place, univariable Cox regression analysis was performed to choose stem genes with prognostic value brought from the previous step. The least absolute shrinkage and selection operator (LASSO) Cox regression had a capacity of regularization and reducing data to dimensionality when “glmnet” R package (47) was invoked. When applied to the construction of the model, LASSO Cox regression would narrow down the number of stem genes and determine the optimal composition of risk signature with the penalty parameter (λ) identified by minimum criteria. With this approach, we could avoid the overfitting of the model and enhance the accuracy of prediction. Subsequently, the risk score for each OC patient was calculated according to the following formula:
(coefi: the coefficient value, Expi: the expression value of the prognostic genes) Serving the best cut-off value of risk score as the threshold value, patients with OC were separated into high- and low-risk groups. “survminer” package (48) was used to display survival curves in two risk subgroups. Taking visibility of distinctiveness into consideration, we applied principal component analysis (PCA) (49) to demonstrate the compositions of the data. Finally, the area under the curve (AUC) was calculated with “survivalROC” program (50) to validate the model’s capability of predicting the 3- and 5-year OS. Two independent datasets, GEO cohorts (GSE26712, GSE32062) were utilized as validation sets to verify the generalizability of the model.
2.7 Establishment of a nomogram
To assess prognostic features of all patients, a nomogram was constructed involving risk score value and clinicopathological parameters using “rms” (51). By integrating prognostic factors, the nomogram could evaluate the outcomes between high- and low-risk patients with favorable efficacy. Subsequently, calibration curve and Decision Curve Analysis (DCA) curve were depicted to measure the difference between predictive and actual values and evaluate the net clinical benefit of each independent index.
2.8 Immune infiltration and tumor mutation burden analysis
With the application of ssGSEA as mentioned above, the proportions of 28 immune cells and the expression of immune checkpoints could be calculated and the different between high- and low- risk subgroups could be distinguished by Wilcoxon rank-sum test. Equally, the differential immune signaling pathways were investigated by “GSVA” R package. Tumor burden (TMB), which represents the number of mutations per megabase (Mut/Mb) of DNA that is sequenced in malignant tumor could be a candidate prognostic factor and was applied to clinic widely (52, 53). Considering TMB as a candidate biomarker, we discussed its difference in adjective risk subgroups and revealed its prognostic value by KM analysis.
2.9 Drug sensitivity
Based on “oncopredict” R package (54), we could download GDSC and CTRP data matrixes, which were used as training cohorts to predict the drug response. Serving the area under the dose-response curve values as basis, we calculated the IC50 value (half-maximal inhibitory concentration) to detect the response of patients with OC to common drugs. Chemotherapy or immunotherapy drugs exhibiting with p < 0.05 in different risk clusters were selected as candidate drugs for further analysis.
2.10 Analysis of single-cell sequencing data
To process the raw single cell data, we utilized “Seurat” R package (55) to build a new Seurat object. An initial quality control process was implemented to filter a series of high-quality cells, which encompass 400–7000 RNA features and possess a mitochondrial gene proportion of less than 5%. Simultaneously, genes that express within less than three cells are also exclude to ensure the concentration on biologically relevant factors. Moreover, “LogNormalize” function is employed to normalize and adjust features across distinct cells, thereby facilitating their comparability. Following the identification of hypervariable genes, Principal Component Analysis (PCA) is conducted to reduce the dimensionality of high-throughput data and select 15 principal components (PCs) to capture major variants, as determined by the ElbowPlot function. Finally, the cell clusters were generated by FindClusters algorithm with the revolution of 0.5 and were presented with Uniform Manifold Approximation and Projection (UMAP), which had excellent performance and good scalability. The cell type annotation was completed by manual operation to ensure the accuracy of results. The “decoupleR” (56) function was also applied to evaluate the strength of multiple signals in all cell clusters.
2.11 Cell-cell communication analysis
We conducted the CellChat R package (57) to manifest the number and intensity of intercellular interactions. Furthermore, to investigate the abnormal signaling pathways and their stability, we performed the pattern recognition function of CellChat to evaluate the strength of incoming and outcoming signaling pathways. Meanwhile, the heatmap was displayed to clarify the contribution of each cell cluster in diverse pathways.
2.12 Cell culture and tumor sphere-formation assay
SKOV3 cells were cultured in McCoy’s 5A medium supplemented with 10% fetal bovine serum (FBS) at 37°C in a humidified atmosphere with 5% CO2. Tumor sphere-formation assay was performed to evaluate the stemness characteristics of SKOV3 cells. Single-cell suspensions were prepared and seeded into ultra-low attachment 96-well plates (Corning) at a density of 1000 cells per well. After seeding, the plates were centrifuged at 1500 rpm for 10 minutes to facilitate cell aggregation at the bottom of each well. Cells were cultured in serum-free DMEM/F12 medium (Gibco) supplemented with 1× B27 supplement (Gibco), epidermal growth factor (EGF, 20 ng/mL, MCE), and basic fibroblast growth factor (bFGF, 20 ng/mL, MCE). Cultures were maintained at 37°C in a humidified incubator with 5% CO2. After 3 days of culture, tumor sphere-formation was assessed.
Tumor spheres were defined as single, compact, and round spheroids with a diameter ≥ 50 μm. Loose aggregates or irregularly shaped cell clusters were excluded from the sphere count. Sphere formation efficiency was calculated as the percentage of wells forming qualified tumor spheres relative to the total number of seeded wells.
2.13 Quantitative reverse transcription PCR analysis
Total RNA was extracted using TRIzol reagent (Invitrogen), and reverse transcription was performed with the PrimeScript RT reagent kit (Takara) according to the manufacturer’s instructions. qRT-PCR was conducted using SYBR Green Master Mix (Applied Biosystems) on a QuantStudio 6 Flex system (Thermo Fisher). Relative gene expression was calculated by the 2^-ΔΔCt method, with GAPDH as the internal control. Primers for OCT4, SOX2, CD133, AKAP12, and GAPDH were synthesized by Sangon Biotech.
2.14 Small interfering RNAs transfection
SiRNAs targeting AKAP12 and corresponding negative control (scramble siRNA) were purchased from GeneAdv. SKOV3 cells were transfected using CALNP RNAi in vitro reagent (D-nano Therapeutics) according to the manufacturer’s protocol. Knockdown efficiency was confirmed by qRT-PCR 24 hours post-transfection.
2.15 Cell viability assay and IC50 determination
After transfection, SKOV3 cells were seeded into 96-well plates and treated with various concentrations of cisplatin (Sigma-Aldrich) for 48 hours. Cell viability was assessed using the CCK-8 assay (Beyotime). Absorbance at 450 nm was measured using a microplate reader (Bio-Rad). Dose–response curves were generated, and IC50 values were calculated using nonlinear regression analysis in GraphPad Prism 9.0.
2.16 Transwell migration assay
Cell migration was evaluated using 24-well Transwell chambers with 8-μm pore size membranes (Corning). After transfection, 5 × 10⁴ SKOV3 cells were suspended in serum-free medium and seeded into the upper chamber, while the lower chamber contained medium supplemented with 10% FBS. After 24 hours of incubation, cells on the upper surface were removed, and migrated cells on the lower surface were fixed with 4% paraformaldehyde, stained with 0.1% crystal violet, and counted in five randomly selected fields under the microscope.
2.17 OC organoids
OC organoids were derived from OC tumors via a previously described method (58). Briefly, tumor pieces were minced and enzymatically digested using 1mg/mL collagenase (Solarbio, Beijing, China) and 10 μM Y-27632 (MedChemExpress, NJ, USA) for 45 minutes at 37°C. Established organoid cell lines were expanded by plating organoids with Matrigel Matrix (ECM; Corning, NY 14831, USA) cultured in OC Organoid Kit (Biogenous, Jiangsu, China) at 5% CO2, 37°C. Media was replaced every 2–3 days.
2.18 Immunohistochemical staining
For immunohistochemical analysis, surgical specimens were processed following standard protocols. Briefly, tissue samples were fixed in 10% formalin, embedded in paraffin, and sectioned at a thickness of 4 micrometers using a microtome. The sections were then mounted on glass slides and dewaxed in xylene followed by graded ethanol washes. Antigen retrieval was performed using a citrate buffer (pH 6.0) in a microwave oven. After blocking endogenous peroxidase activity with 3% hydrogen peroxide and non-specific binding sites with 10% normal serum, the slides were incubated overnight at 4°C with primary antibodies specific to the AKAP12 or OX40L (1:200 dilution). Subsequently, the slides were washed and incubated with appropriate secondary antibodies conjugated to horseradish peroxidase for 1 hour at room temperature. The immune reaction was visualized using 3,3’-diaminobenzidine tetrahydrochloride (DAB) as the chromogen, and the sections were counterstained with hematoxylin. Finally, the slides were dehydrated through graded ethanols, cleared in xylene, and mounted with a permanent mounting medium.
2.19 Statistical analysis
Statistical analyses in our study were performed by R studio (version 4.3.1). Analyses of variance for two-sample continuous variables were calculated using t-tests. Nevertheless, for multiple samples and non-normally distributed variables, Wilcox test and Anova analysis could determine whether the difference between groups had statistical significance. All statistical analyses of trials were performed using GraphPad Prism 9.0. Quantitative data are presented as the mean ± standard error of the mean (SEM) from at least three independent experiments. Comparisons between two groups were performed using an unpaired two-tailed Student’s t-test. For drug sensitivity assays (IC50 calculation), nonlinear regression analysis with a log(inhibitor) vs. normalized response curve was applied. Alternatively, p < 0.05 was considered to be statistically significant (ns, not significant, *p < 0.05, **p < 0.01, ***p < 0.001, ****p < 0.0001).
3 Results
3.1 Identification of stemness genes and tumor classification
Figure 1 depicts the workflow of this study. To select a novel stemness gene set, we extracted the transcriptome sequencing data of SKOV3 cells from the GEO database (GSE232783) and explored related biomarkers that could maintain the dedifferentiation of OC cells by comparing the gene expression profiles of adherent and stem SKOV3 cells. By setting the threshold of logFC > 1 and adjusting p < 0.05, we obtained 3066 differentially expressed genes (DEGs) that were highly upgraded in SKOV3 cell stemness. To explore the potential functions of the stemness genes, we conducted Gene Ontology (GO) and Kyoto Encyclopedia of Genes and Genomes (KEGG) enrichment analyses and Gene Set Enrichment Analysis (GSEA). GO enrichment analysis indicated that stemness genes play a key role in the regulation of autophagy, positive regulation of cellular catabolic processes, responses to oxidative stress, protein targeting, and macroautophagy (Supplementary Figure S1A). They also serve as regulators of the cell-substrate junction, focal adhesion, and nuclear speck in terms of cellular components. The result of molecular function depicted they were correlated with molecular adaptor activity, cadherin binding, protein-macromolecule adaptor activity and ubiquitin−like protein ligase binding. The results of KEGG enrichment analysis illustrated that stemness genes mainly enriched in amyotrophic lateral sclerosis, human papillomavirus infection, non−alcoholic fatty liver disease, mRNA surveillance pathway, and biosynthesis of amino acids (Supplementary Figure S1B). GSEA showed that the expression of stemness genes could lead to the downregulation of the BDP1_TARGET_GENES and ZNF8_TARGET_GENES pathways (Supplementary Figure S1C).
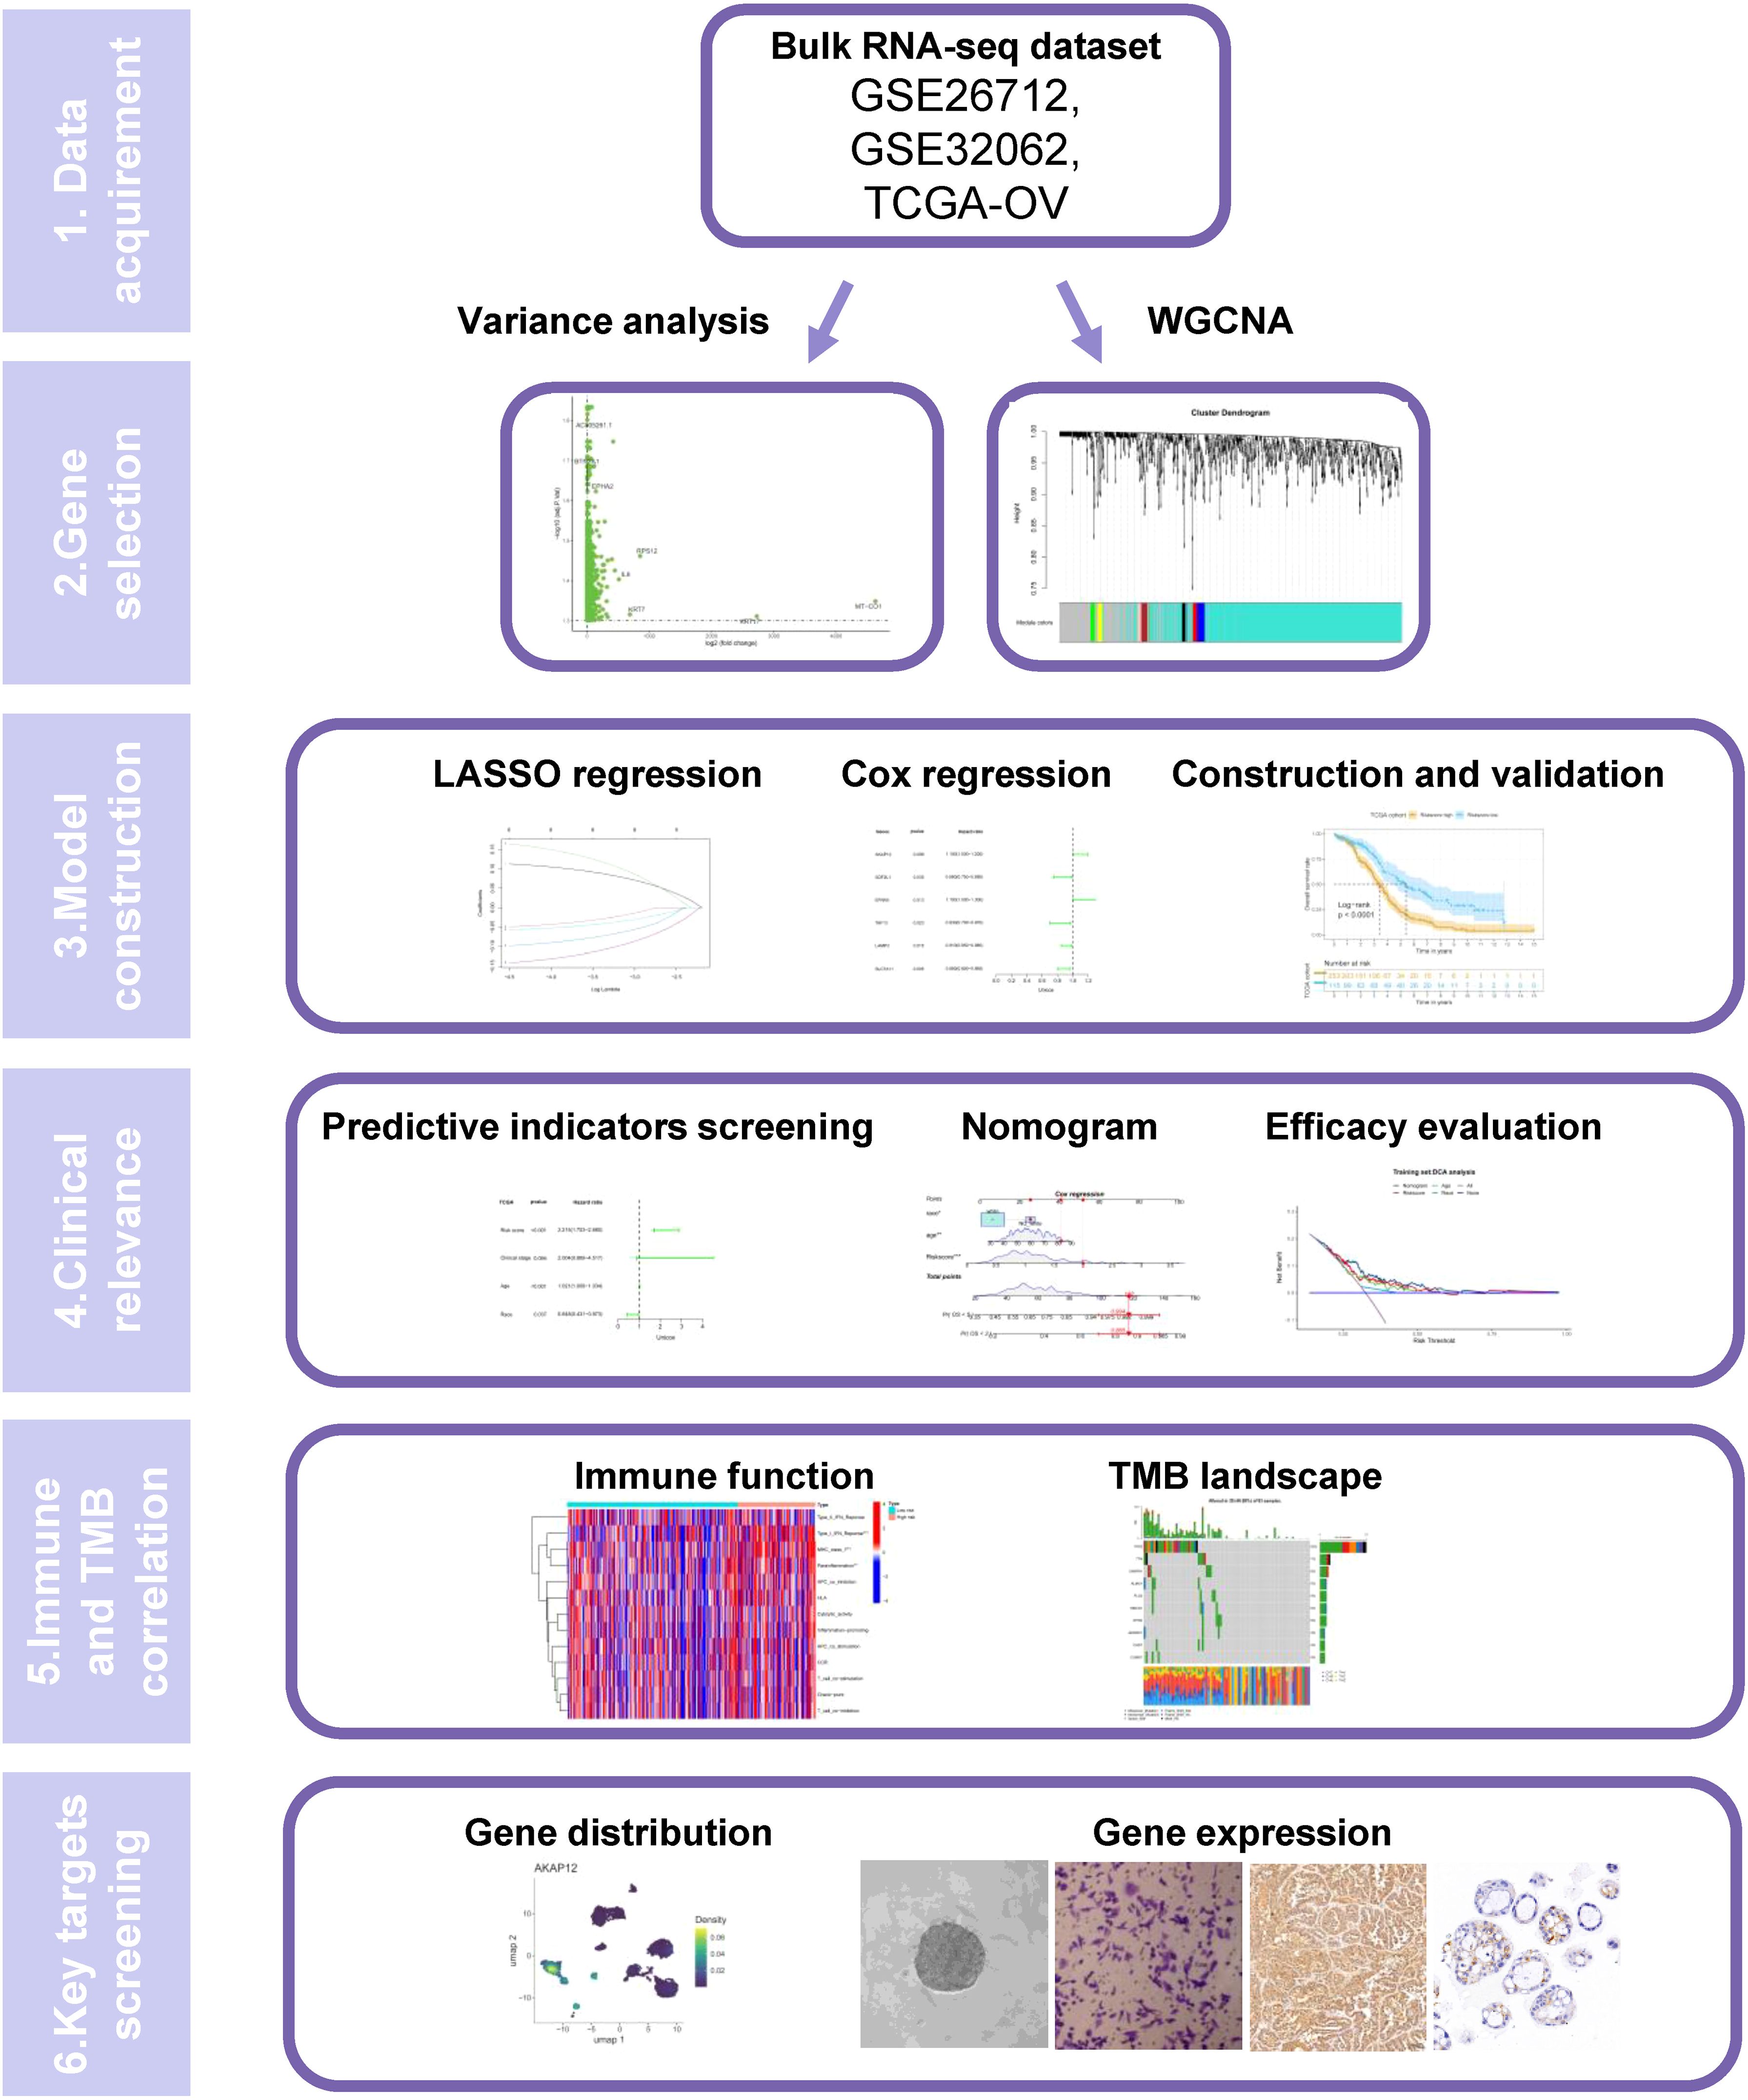
Figure 1. A schematic flow of the whole study.
To select favorable stemness genes and assign prognostic significance, we collected 88 normal and 379 OC samples from GTEx and TCGA databases, respectively. After identifying the DEGs between the normal and OC samples, we intersected the results of the two-variance analysis. Subsequently, we conducted a univariate Cox regression analysis and determined 15 prognostic stemness genes (AKAP12, ANKRD33B, CCDC167, EFNA5, EPB41L2, FOXO1, IRS1, LAMP3, NCS1, RARG, SDF2L1, SLC7A11, TAF13, TIMM23, and TPMT) that were differentially expressed in OC tissues. Consensus clustering analysis was performed to determine whether the stemness phenotype was crucial in tumorigenesis based on 15 prognostic stemness genes. We stratified all patients into k (k = 2-9) different subtypes to determine the overall prognostic value of the genes and the stability of the models under different circumstances. Based on the cumulative distribution function (CDF) curves and the relative change in area under the CDF curves (Supplementary Figures S2A, B), we divided all samples into three subtypes, which achieved the best distinctiveness among the subtypes and the heatmap depicts the expression profile of the stemness genes (Figure 2A, B). We found that the C2 cluster had the highest stemness phenotype. Moreover, the result of KM analysis also illustrated that cluster 2 had the worst prognosis (p < 0.01) (Figure 2C).
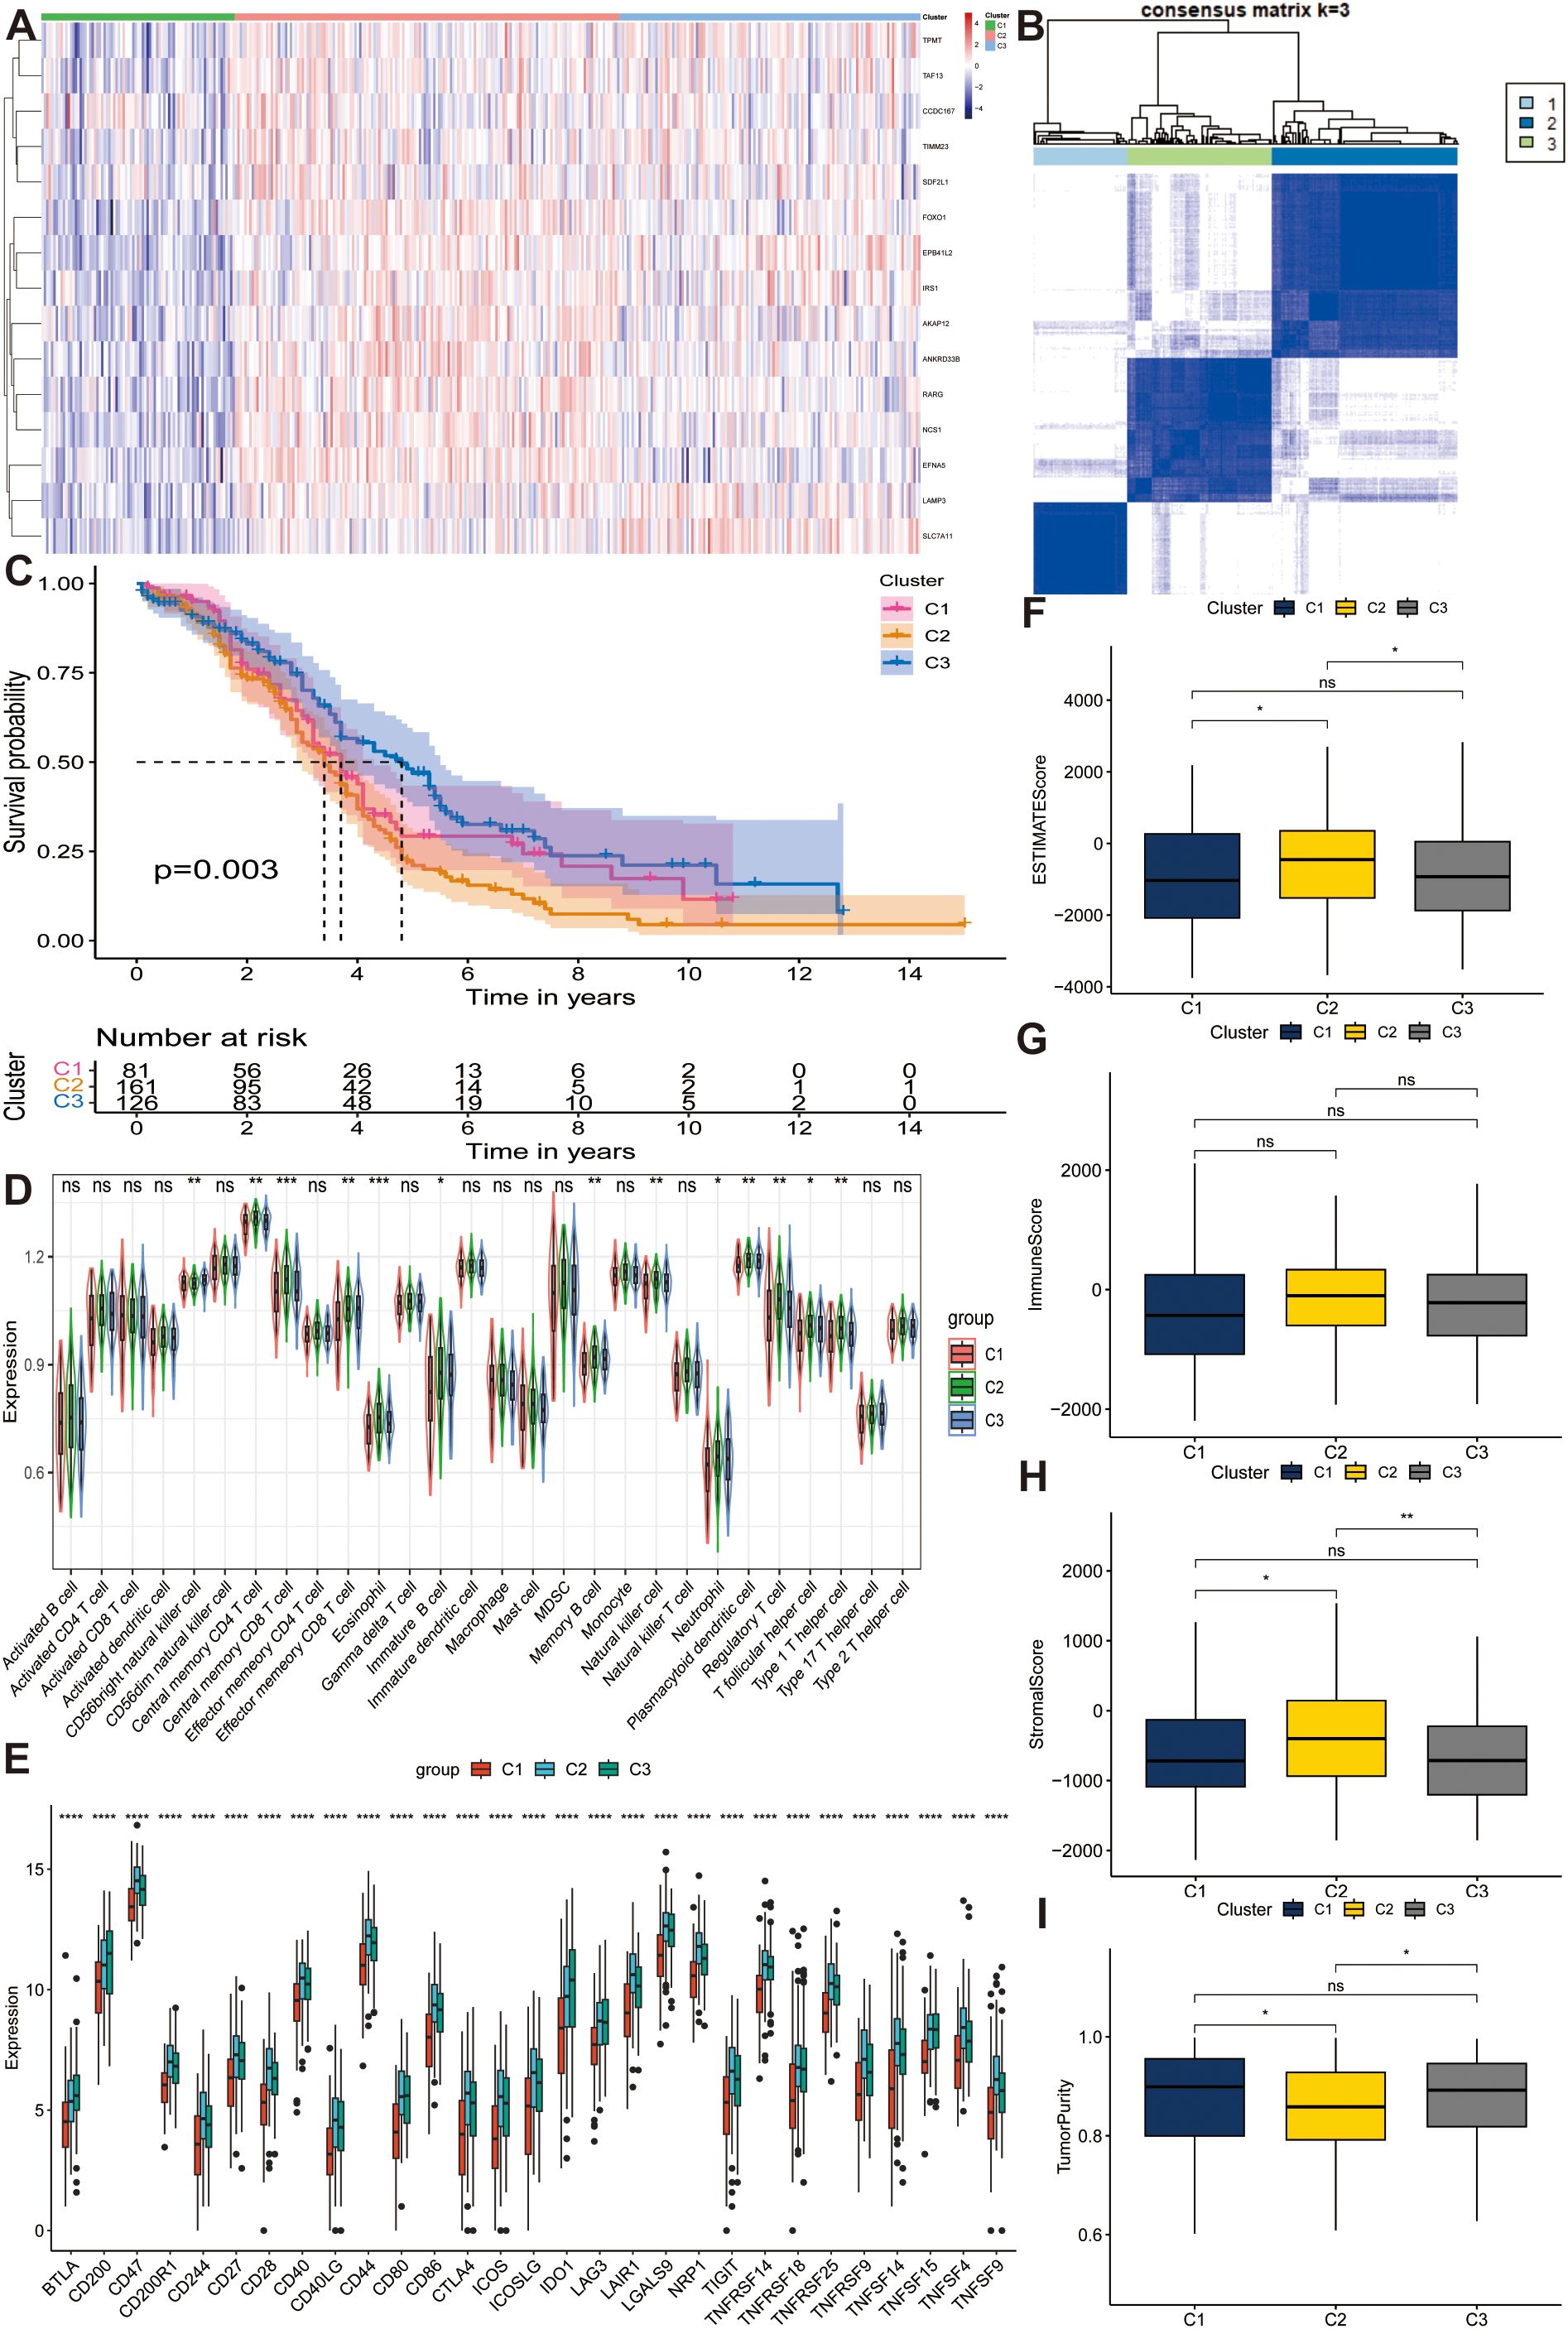
Figure 2. Distinguishing distinct stem subgroups and delineating correlated characteristics in The Cancer Genome Atlas Program (TCGA) cohort. (A) The expression profiles of different stem genes in three stem sub clusters. (B) The consensus matrix for ovarian cancer (OC) samples when k = 3. (C) Kaplan-Meier (KM) curves manifest the survival discrepancy among three groups. (D, E) The distribution of diverse immune cells and the expression of immune checkpoints among different groups. (F–I) Box plots display the distribution of estimate scores, immune scores, stromal scores and tumor purity among three clusters. ns, not significant, *p < 0.05, **p < 0.01, ***p < 0.001, ****p < 0.0001.
3.2 Exploration of TME and prognostic characteristics in different tumor subtypes
To investigate the influence of stemness genes on tumor samples, we calculated and quantified the abundance of 28 immune cells and the expression of multiple immune checkpoints among the three subtypes. Subsequently, we conducted a Wilcoxon test to further compare the immunological landscapes between the two risk categories. The results indicated that, compared to others, C2 cluster had the highest abundance of central memory CD4+ T cells, central memory CD8+ T cells, effector memory CD8 + T cells, eosinophils, immature B cells, memory B cells, natural killer cells, neutrophils, plasmacytoid dendritic cells, regulatory T cells, T follicular helper cells, and type 1 T helper cells, whereas CD56 bright natural killer cells were downregulated in this cluster (all p < 0.05) (Figure 2D). Most immune checkpoints such as CD40, CD44, and CD86 were overexpressed in Cluster 2 (all p < 0.05), illustrating the promising effectiveness of immune-targeted therapies for this subtype (Figure 2E). Furthermore, we evaluated the TME-related indicators encompassing ESTIMATEScore (Figure 2F), ImmuneScore (Figure 2G), StromalScore (Figure 2H), and TumorPurity (Figure 2I) in different subtypes and found that cluster 2 had a high degree of immune infiltration compared to other groups (all p < 0.05), which corresponded with the analysis of immune cells, judging from the results of Wilcoxon test. In conclusion, we filtered out a stemness cluster with the worst prognosis. The highest immune infiltration and stemness genes played a key role in the tumorigenesis and advancement of OC.
3.3 Screening of hub genes via ssGSEA and WGCNA
To determine the degree of stemness in each sample, we calculated the stemness phenotype score for each individual using the ssGSEA algorithm. Subsequently, we conducted WGCNA to identify gene modules related to stemness. When the optimal soft threshold was set to 12, the co-expression network was close to a scale-free network (no scale R^2 = 0.9), and the mean connectivity was stable (Supplementary Figure S3A). Finally, genes sharing similar patterns were clustered into the same modules, and genes in TCGA-OV cohort were clustered into nine modules, as indicated by the clustering dendrogram (Supplementary Figure S3B) and we extracted 230 genes in the black and gray modules that were strongly correlated with stemness (p < 0.001) for further analysis (Figure 3A). The network heatmap plot shows the correlations between each module.
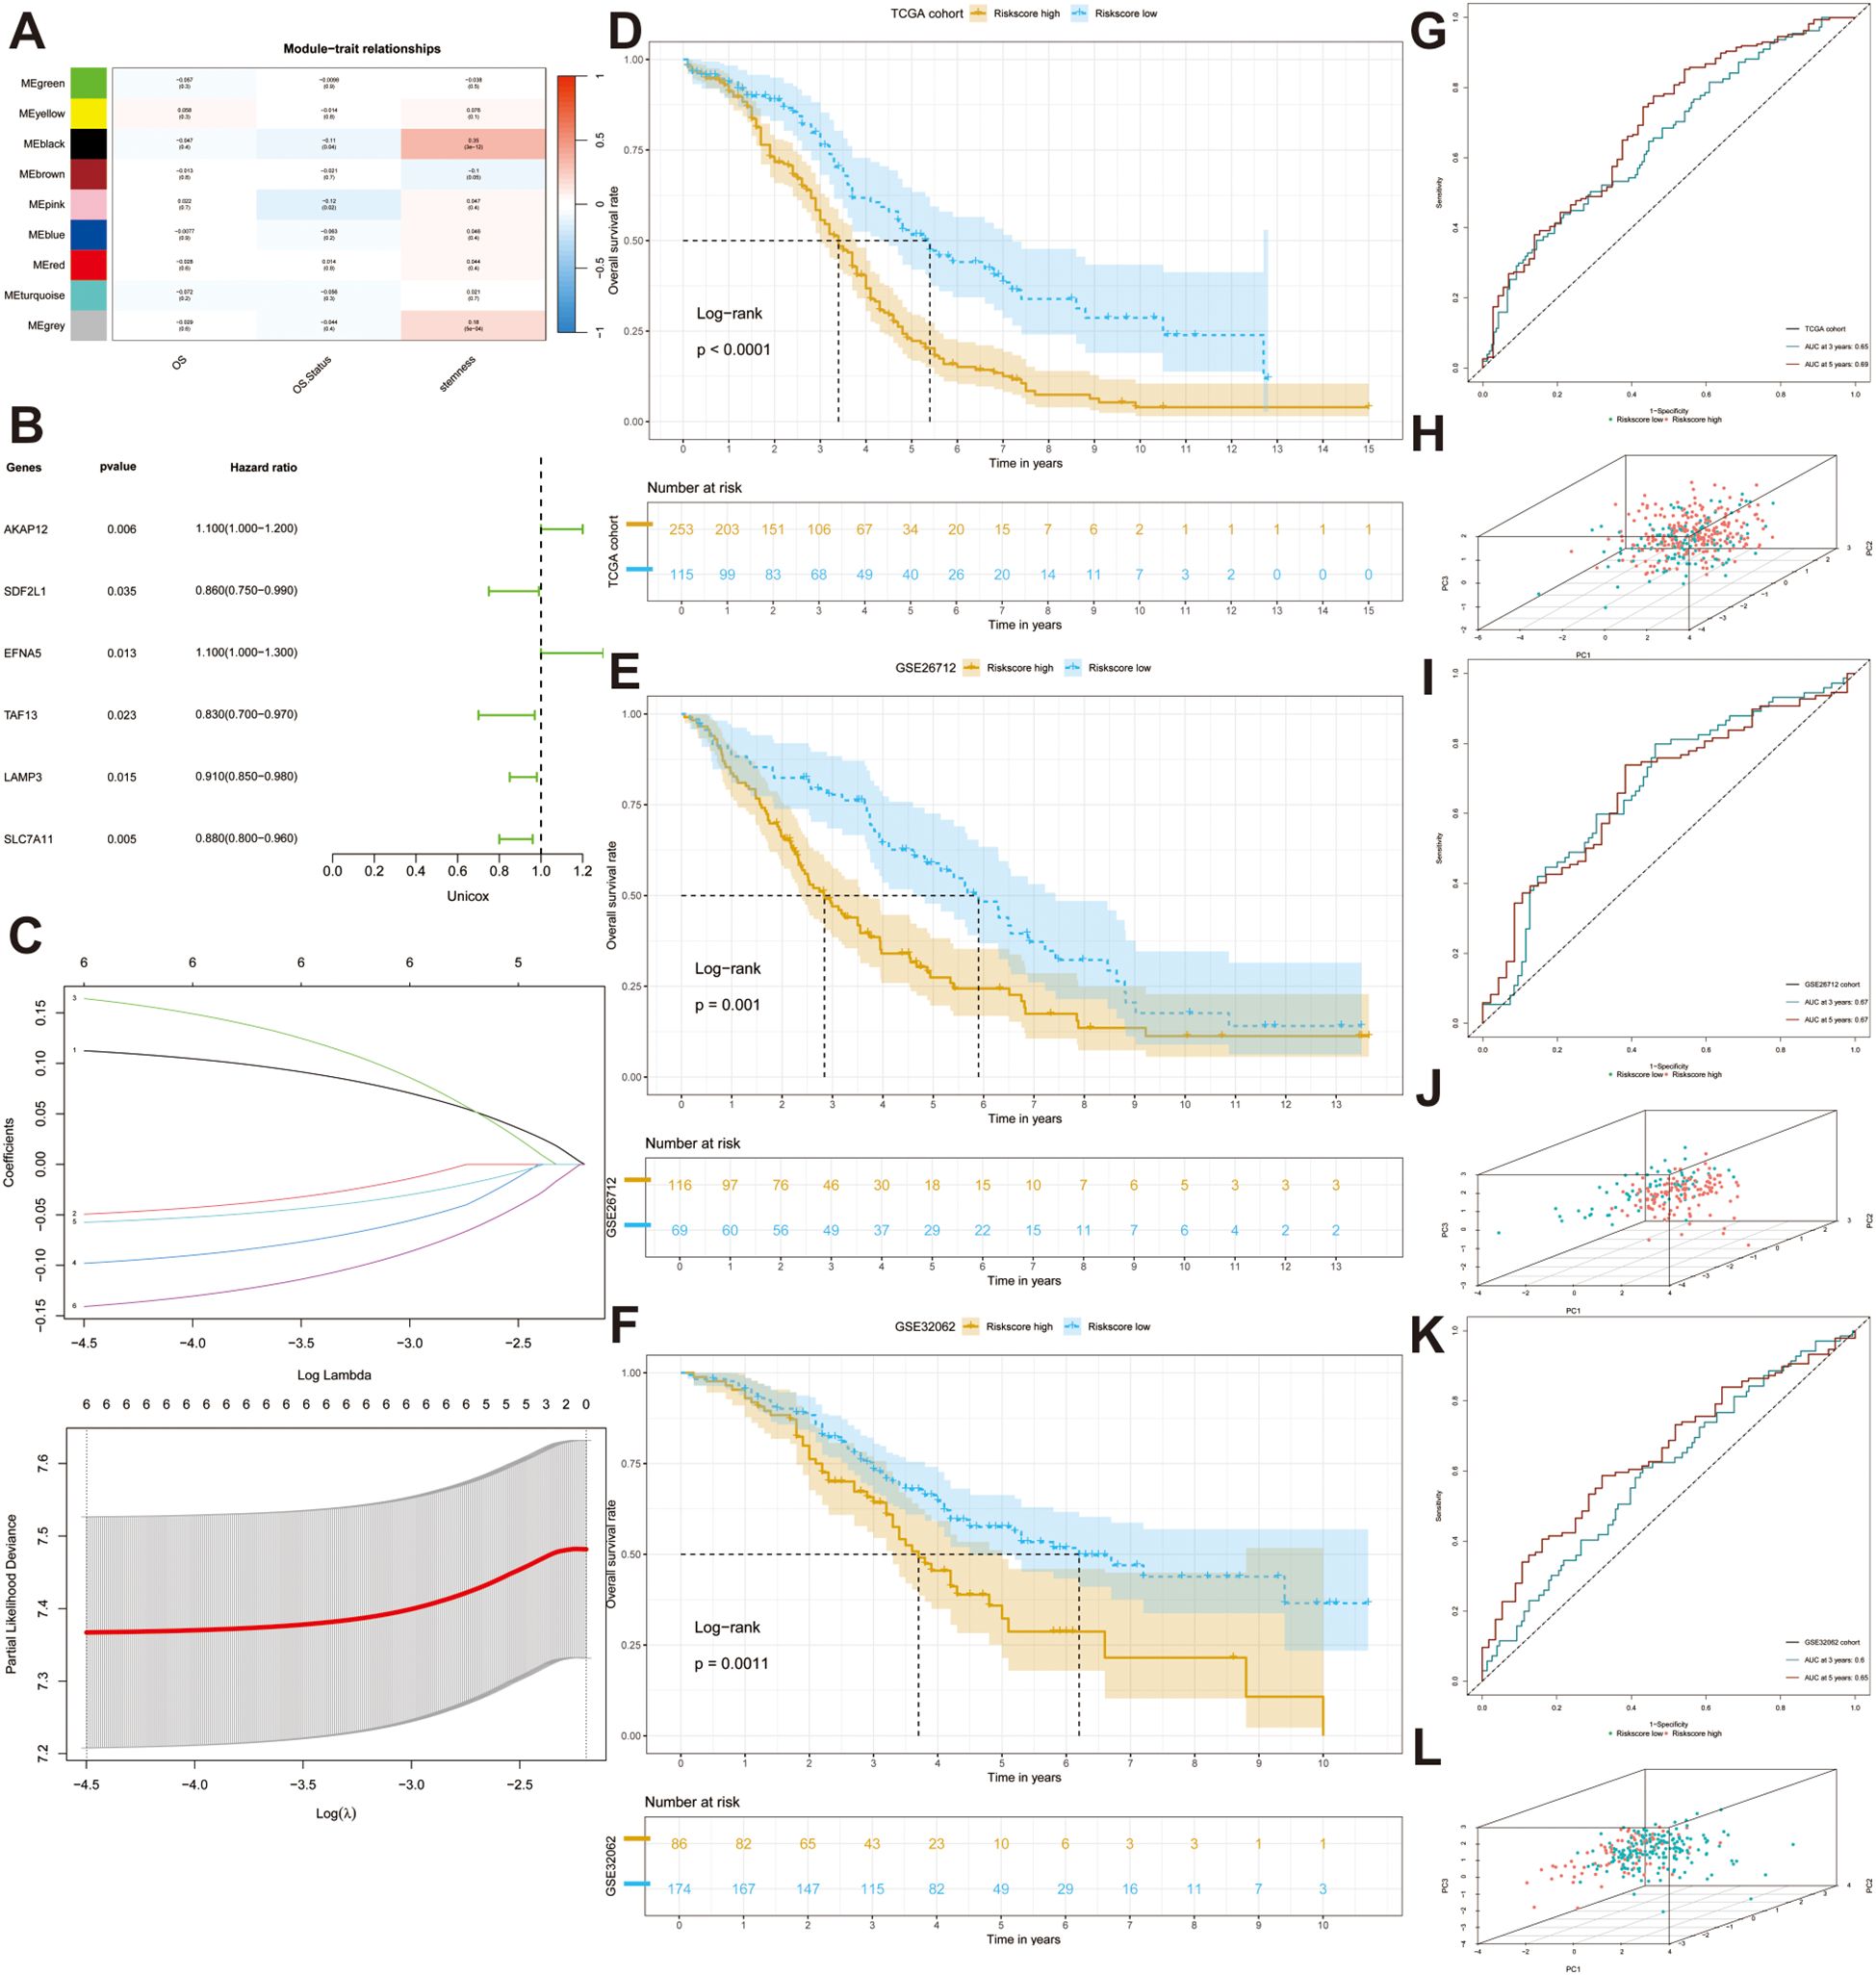
Figure 3. Construction and validation of a stem gene signature. (A) A heatmap depicts the correlation and the confidence coefficients between each indicator and nine generated modules utilizing weighted correlation network analysis (WGCNA). (B) A forest plot depicts the prognostic value of all stem genes calculated by univariate Cox analysis. (C) Selection for six desirable prognostic genes to construct prognostic model based on the optimal parameter λ utilizing Least absolute shrinkage and selection operator (Lasso) Cox regression. (D–F) KM analyses are performed in three datasets (TCGA-OV, GSE26712, GSE32062). (G, I, K) ROC curves illustrated the sensitivity and specificity of the models. (H, J, L) Three-dimensional Principal Component Analysis (PCA) diagrams displaying the distribution of samples.
3.4 Construction and validation of prognostic model based on the hub genes
To explore the adverse effects of stemness genes on patient prognosis, we performed univariate Cox regression analysis to filter out prognostic genes (p < 0.05). The forest plot depicted the distribution of the six significant prognostic genes (Figure 3B). To prevent overfitting of the model, we conducted LASSO regression analysis to found the optimal λ and encompassed six genes to construct the prognostic model: AKAP12, EFNA5, LAMP3, SDF2L1, SLC7A11, and TAF13 (Figure 3C). We then computed the risk score for each sample using the coefficients and expression data of prognostic genes using the following formula: risk score = (AKAP12 × 0.12620) + (EFNA5 × 0.19042) - (LAMP3 × 0.06674) - (SDF2L1 × 0.05986) - (SLC7A11 × 0.15868) - (TAF13 × 0.11205). With the optimal cutoff value serving as the dividing line, we successfully separated all patients into high- and low-risk groups. The KM curve indicated that patients in the high-risk group had a poorer prognosis than those in the other groups (p < 0.0001) (Figure 3D). ROC curve analysis was performed to evaluate the specificity and accuracy of our model and the 3-year and 5-year AUCs were 0.65 and 0.69, respectively (Figure 3G). The three-dimensional PCA plot revealed the distribution of tumor samples and indicated good discrimination between the different risk subgroups (Figure 3H).
Subsequently, we acquired the clinical information and transcriptomic sequencing data from 185 patients with OC from the GEO database (GSE26712) to validate the accuracy of the prognostic model. After calculating the risk score, the patients were divided into high- and low-risk groups based on the optimal cut-off value. KM analysis indicated significant survival differences between the two risk subgroups (Figure 3E), and AUCs at 3 and 5 years were 0.67 and 0.67, respectively, which confirmed the accuracy of the model (Figure 3I). Principal component analysis (PCA) demonstrated that the two groups showed favorable differentiation (Figure 3J). Moreover, a satisfying discrepancy in the OS between two risk-groups was also observed in an additional dataset (GSE32062) comprising 260 patients (Figures 3F, L), reinforcing the robustness of our findings. 3-year and 5-year AUCs were 0.60 and 0.65, respectively (Figure 3K).
3.5 Establishment and evaluation of a nomogram
To identify independent prognostic factors, we employed univariate and multivariate Cox regression analyses and found that age (HR = 1.021, p < 0.001), race (HR = 0.648, p < 0.05), and risk score (HR = 2.215, p < 0.001) all had prognostic significance (Figures 4A, B). Based on three independent indicators, a nomogram was generated to predict the 3-year and 5-year survival probabilities of patients in the TCGA cohort (Figure 4C). Furthermore, we utilized a calibration curve to evaluate the accuracy of prediction. The predictive and actual curves almost coincided, indicating the high efficacy of the nomogram (Figures 4D, E). In addition, the highest C-index demonstrated the robust predictive power of the nomogram compared with other clinicopathological parameters (Figure 4F). DCA revealed that the nomogram and risk score had the best net benefit compared with other clinicopathological parameters, and the nomogram encompassing prognostic indicators achieved the best effectiveness according to the curve (Figure 4G).
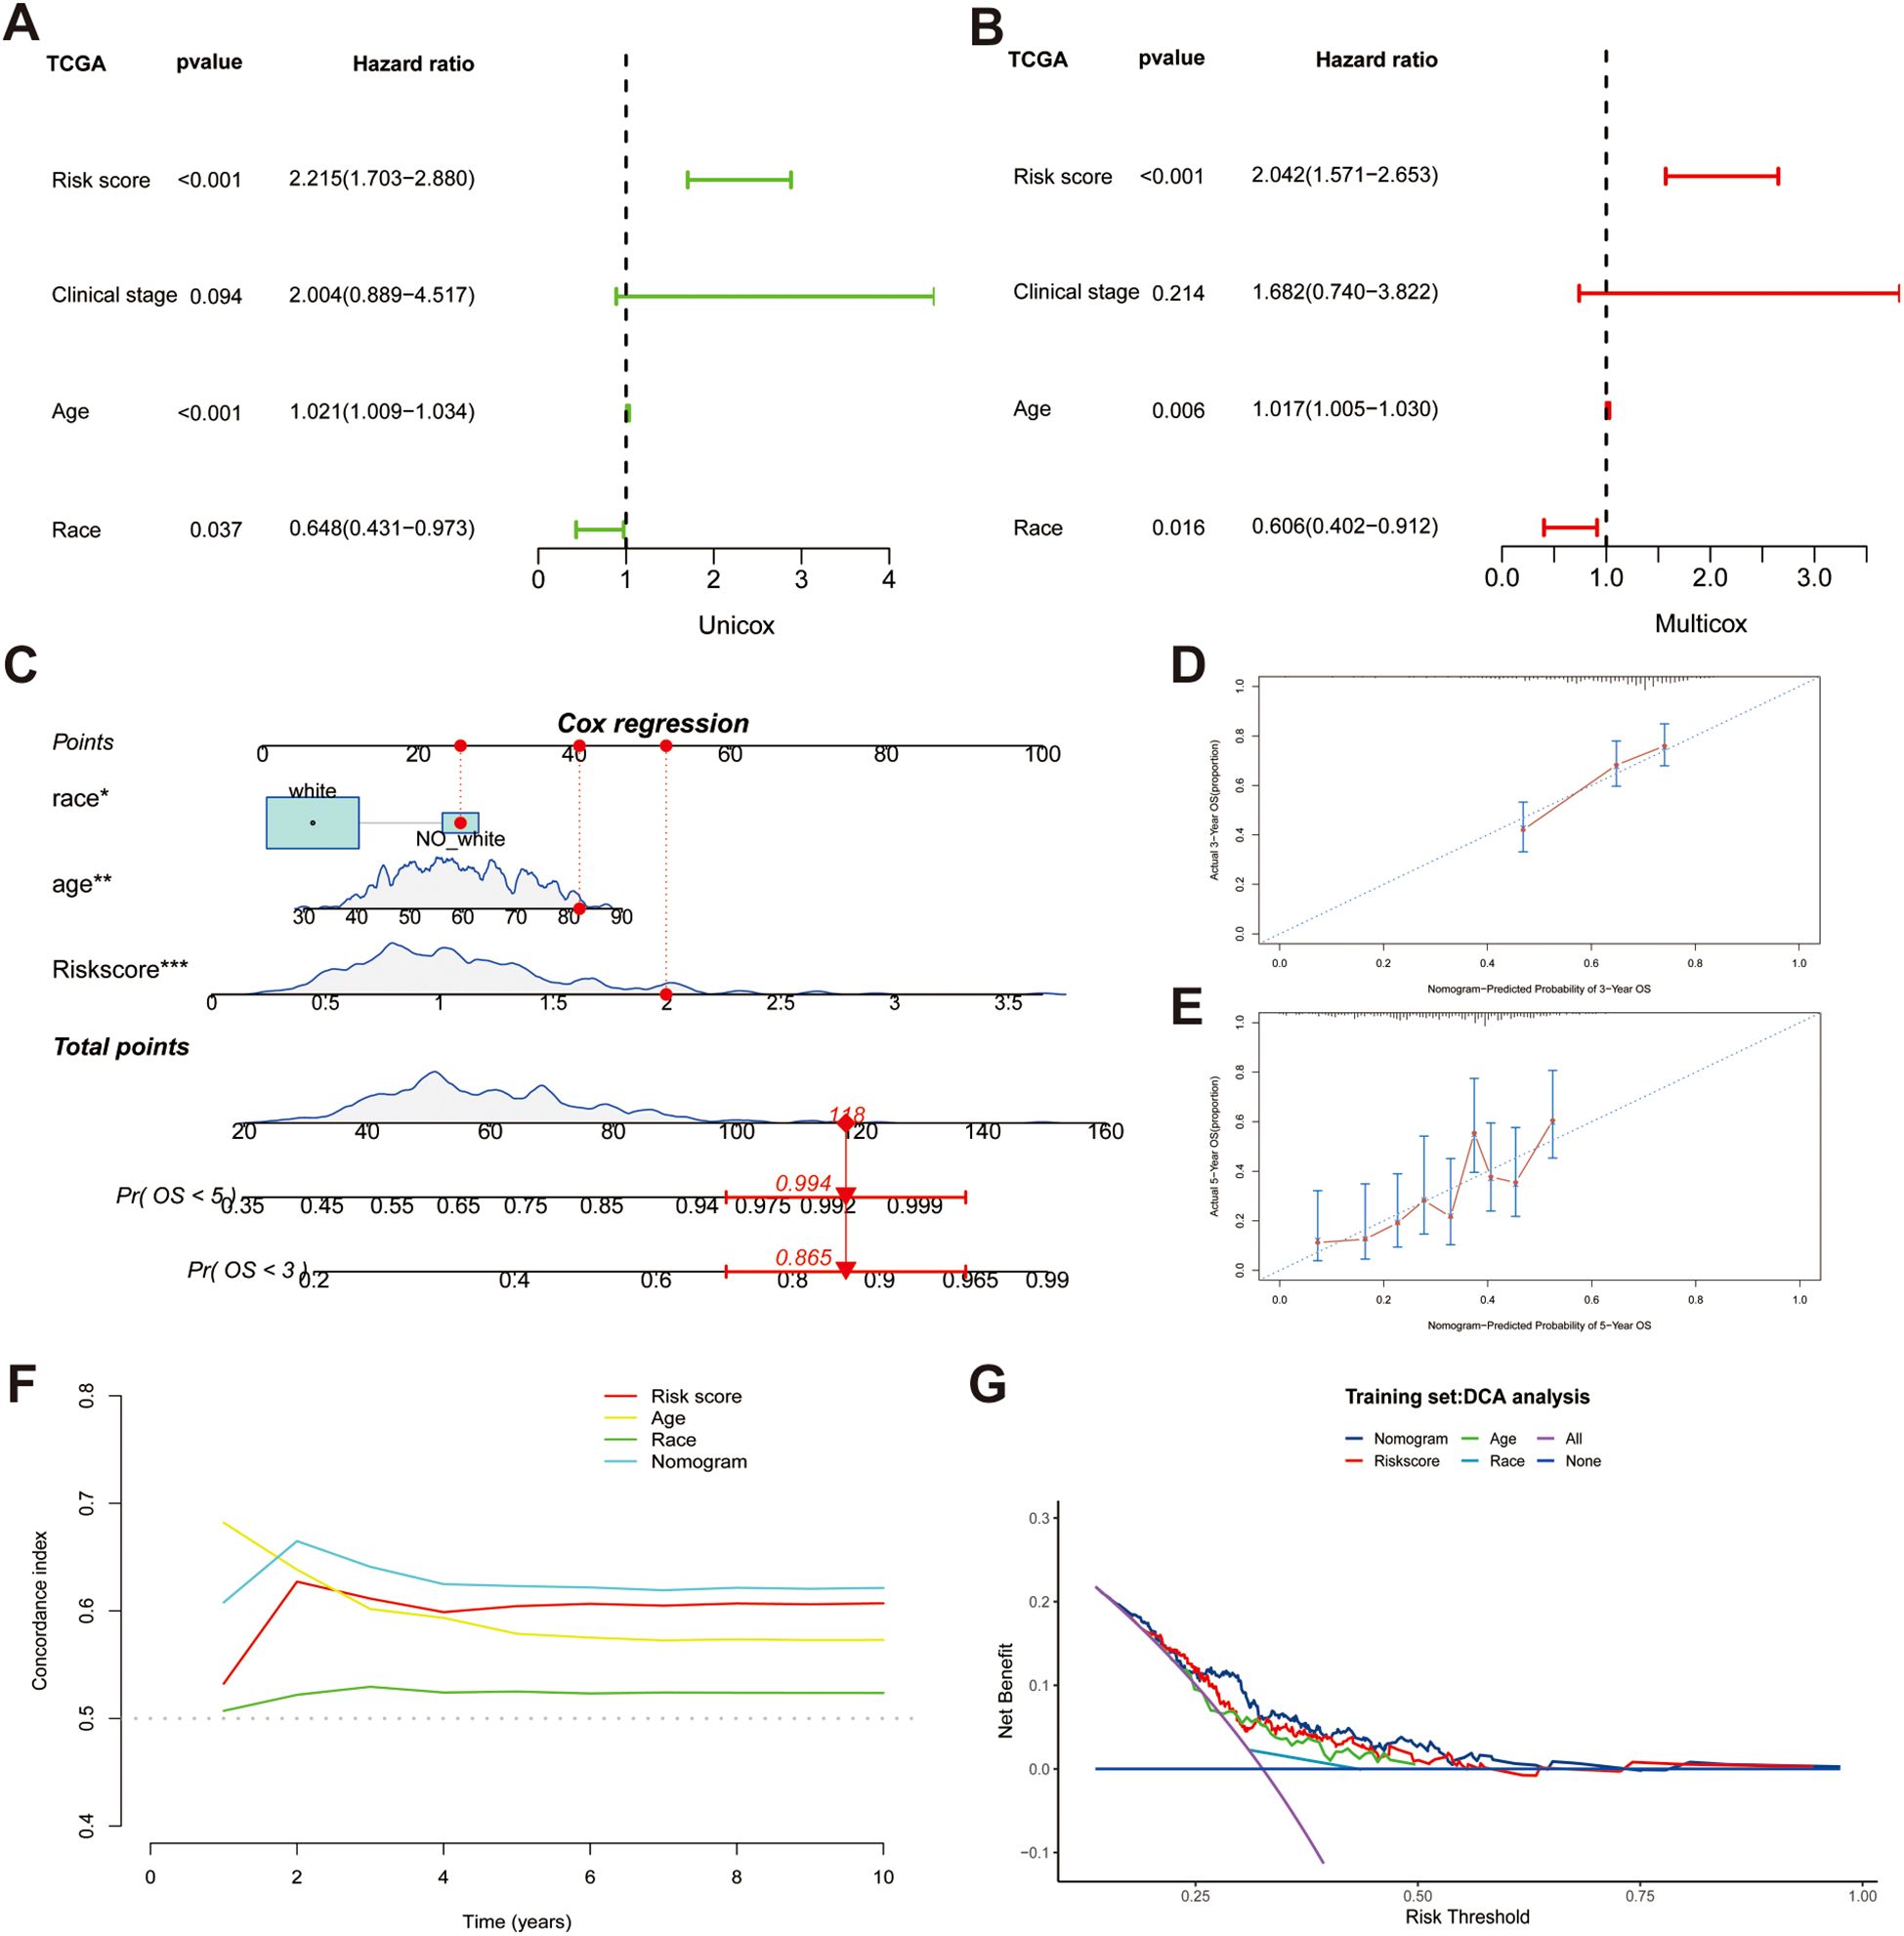
Figure 4. Establishing a nomogram based on risk score and clinical variables for predicting the 3-year and 5-year survival probability in TCGA cohort. (A, B) Univariable and multiple Cox regression for identifying independent predictive factors. (C) A nomogram for predicting overall survival (OS). (D, E) Calibration plots for predicting 3-year and 5-year OS. (F) Comparing the concordance indexes (C-indexes) of nomogram, risk score, race and age. (G) Distribution Curve Analysis (DCA) analysis of diverse indicators.
3.6 Investigation of TME, TMB and drug sensitivity
To ascertain the statistical significance of discrepancies between the two risk sub-groups regarding the aspects of TME, TMB and drug susceptibility, a t-test analysis was conducted. We firstly calculated the abundance of 28 immune cells using the ssGSEA algorithm, as mentioned above, and discovered that there was no difference between the high- and low-risk groups in terms of immune infiltration (all p > 0.05) (Supplementary Figure S4A). Additionally, we compared the expression of immune checkpoints between the two risk subgroups and found that CD80, IDO1, LAG3, and LGALS9 were significantly downregulated in the high-risk group (all p < 0.05) (Figure 5A). Notably, while the expression of TNFSF4, also known as OX40L, was upregulated in the high-risk population, whereas the expression of its receptor, TNFRSF4 (OX40), did not concurrently show an increase. To reveal the potential immune function, we conducted an analysis of immune pathways, and the results demonstrated the activation of Type I IFN Response, MHC class I, and para-inflammatory pathways (all p < 0.01) (Figure 5B). Waterfall plots show the landscape of the mutation rates of the top ten genes’ mutation rate between the high- and low-risk groups (Figures 5C, D). These results reveal that risk genes can increase the mortality rate by activating these potential pathways. The box plot results indicated that the low-risk group had higher TMB, which corresponded to the waterfall plot (Figure 5E). After evaluating the TMB in patients with OC, we separated all patients into high or low TMB groups with the threshold of the median TMB, and KM analysis showed that lower TMB was linked to worse prognosis (p < 0.001) (Figure 5F). Therefore, we hypothesized that poor outcomes may be related to drug tolerance. Finally, we meticulously performed a sensitivity evaluation of some immune checkpoint inhibitors and chemotherapeutic drugs and found higher IC50 values for Acetalax, Erlotinib, Rapamycin, and Savolitinib in the high-risk group, revealing an increase in drug resistance (all p < 0.05) (Supplementary Figure S4B).
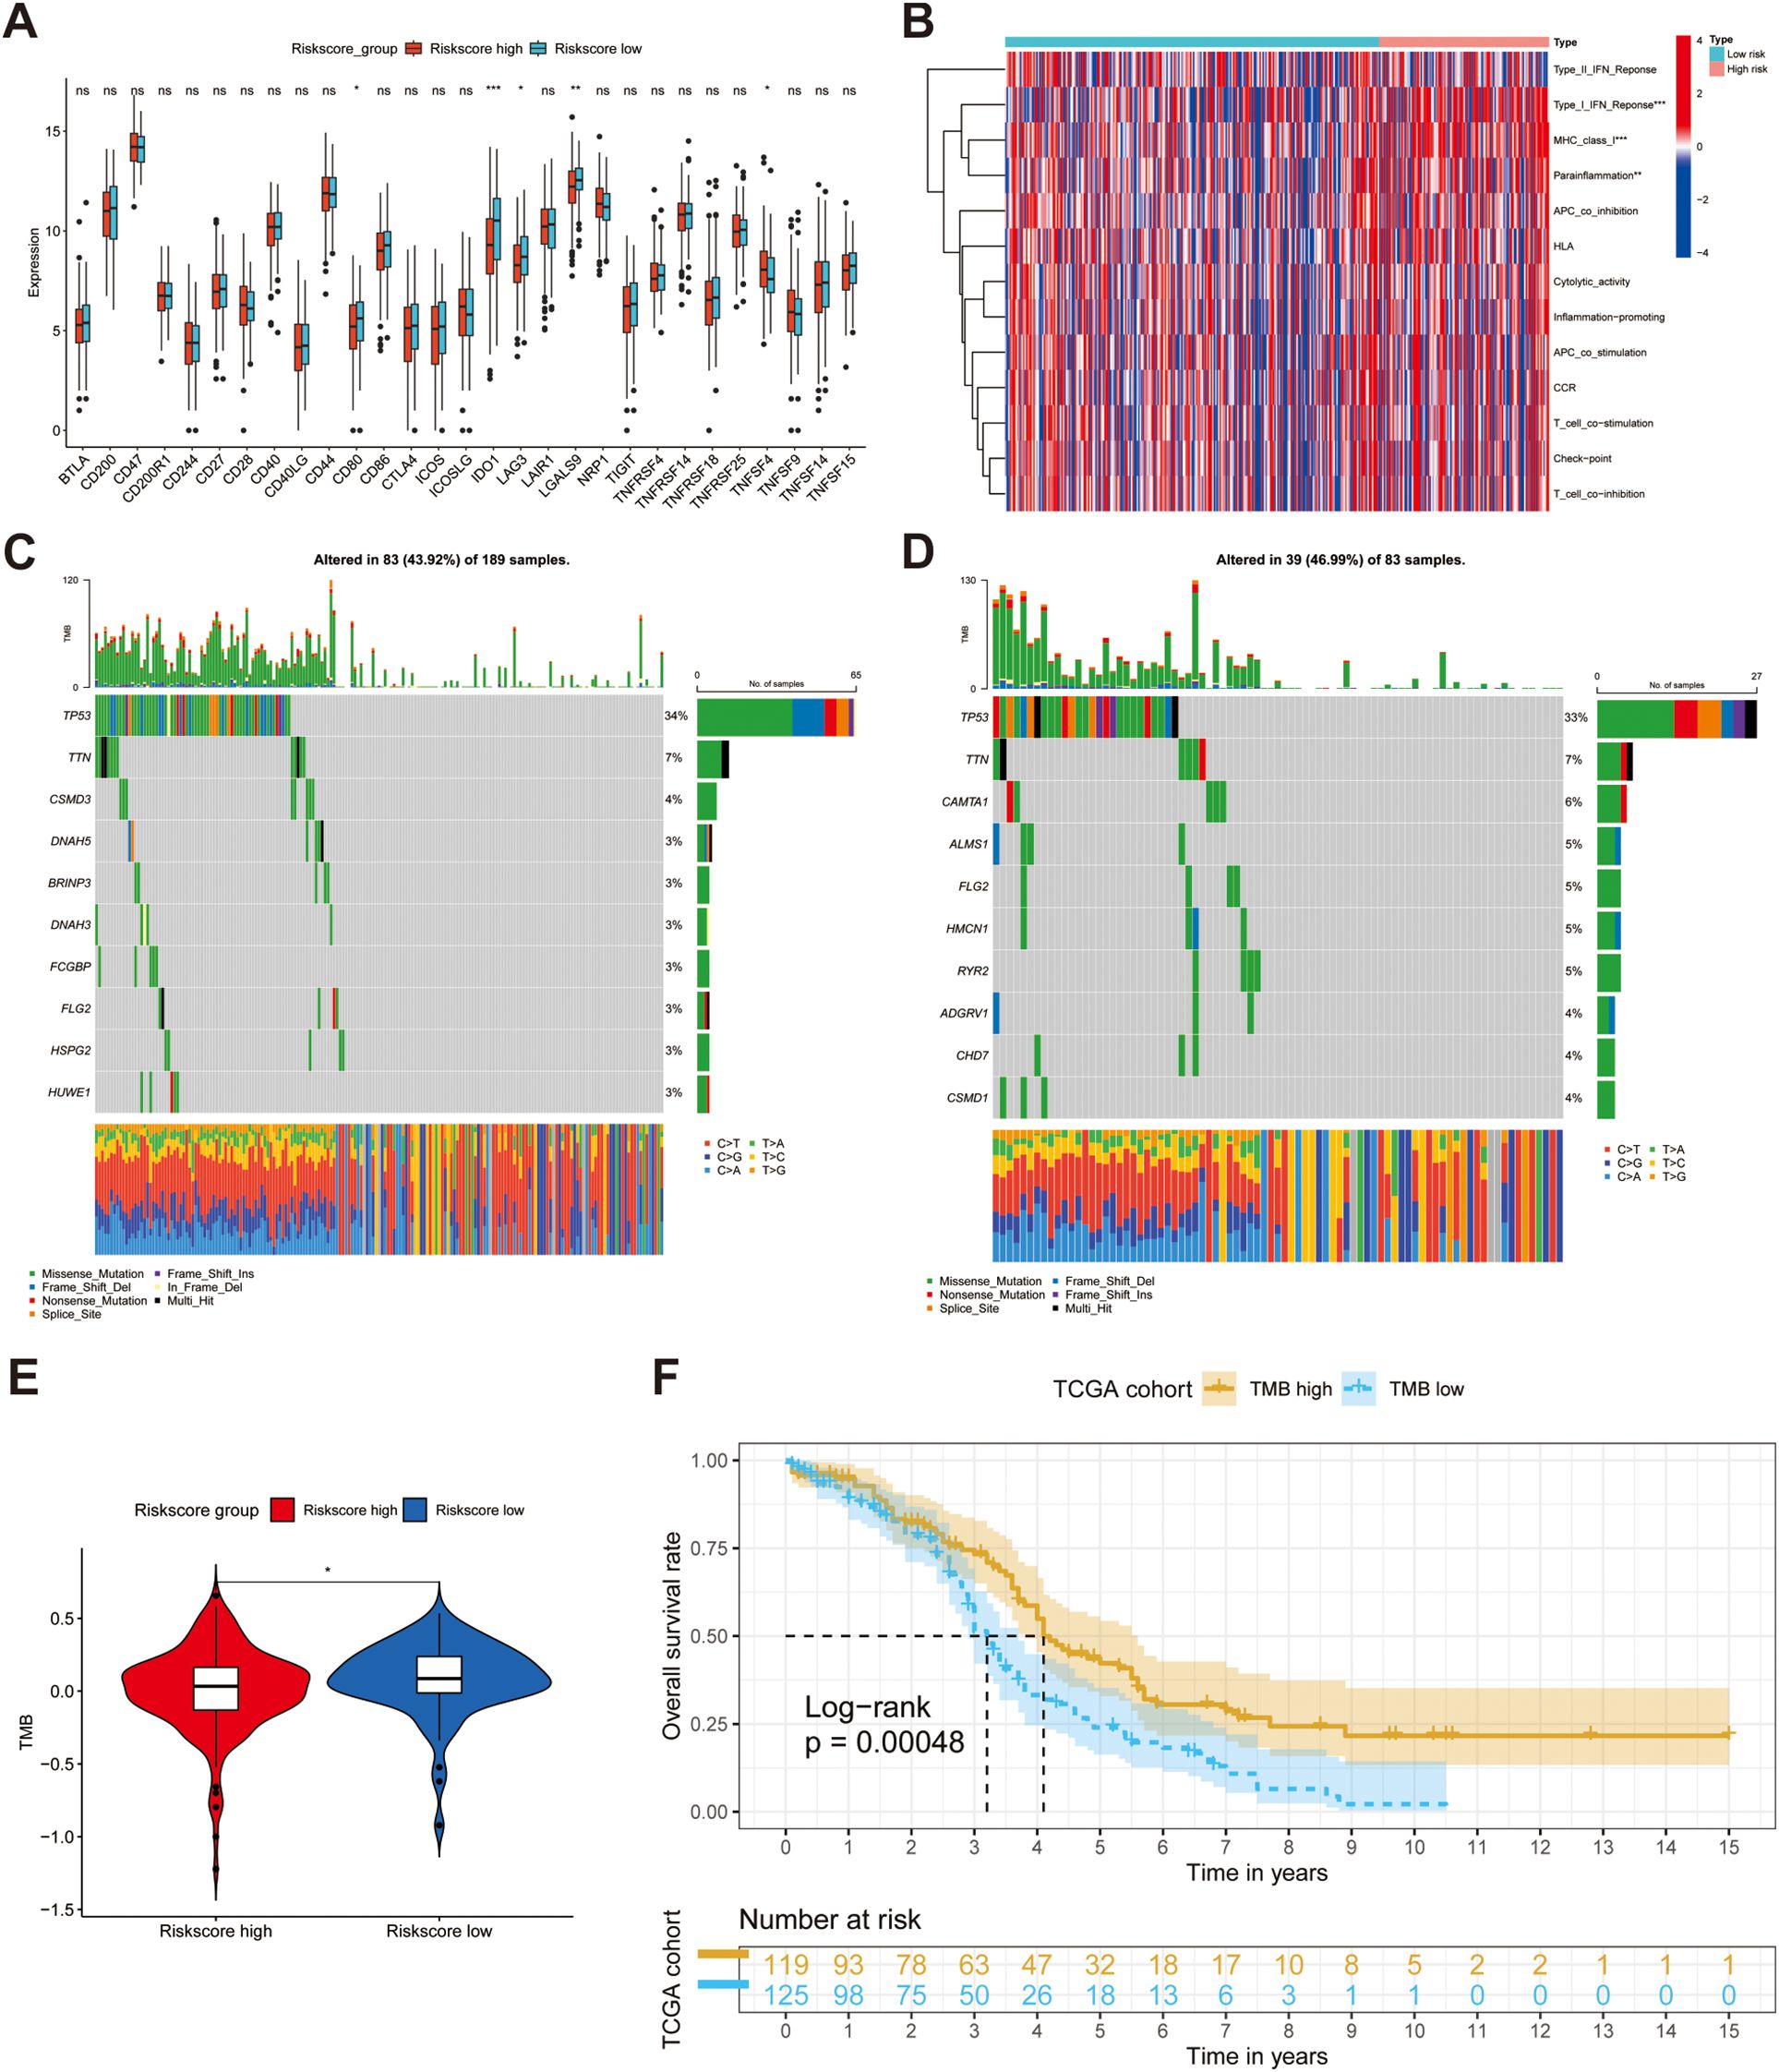
Figure 5. Investigating the difference in terms of tumor microenvironment (TME) between high- and low-groups. (A, B) The difference of the expression of immune checkpoints and immune functions between two groups. (C, D) Waterfall diagrams reveal the landscape of TMB in high-risk (N = 189) and low-risk (N = 83) groups. (E) A box plot suggests high-risk group had lower mutations. (F) KM analysis demonstrates the different OS between two risk groups. ns, not significant, *p < 0.05, **p < 0.01, ***p < 0.001.
3.7 Establishment of a single-cell landscape for OC
To characterize the distribution of prognostic genes at the single-cell level, we extracted scRNA-seq data from five primary OC tissues encompassing two high-grade OC samples and three low-grade OC samples from the GEO database (GSE235931). Under stringent quality control, the employment of UMAP culminated in the categorization of 4773 cells and 27753 features into 11 discrete clusters. According to the cell markers described in previous articles, we separated all cells into eight clusters: epithelial cells, T cells, fibroblasts, macrophages, mesenchymal stem cells (MSCs), B cells, Embryonic Stem Cells (ESCs), and endothelial cells (Figure 6A). The UMAP map revealed the abundance of distinct cells derived from multiple samples (Supplementary Figure S5A). The heatmap shows the expression of marker genes and top ten expressed genes that represent each cell population (Supplementary Figures S5B, C). Meanwhile, to determine the stem content of the TME for OC, we uncovered the significant upregulation of gene signature in fibroblasts by conducting Anova analysis (p < 0.001) (Figure 6B) and investigated the distribution of three model genes with the largest coefficients (AKAP12, EFNA5, and SLC7A11) in diverse cell clusters depicted by UMAP maps (Figures 6C–E). Furthermore, the signal enrichment analyses illustrated the remarkable expression of stem signals, consisting of TGF-β, p53, Wnt signals (Figure 6F), demonstrating that fibroblasts should account for the origin of stemness.
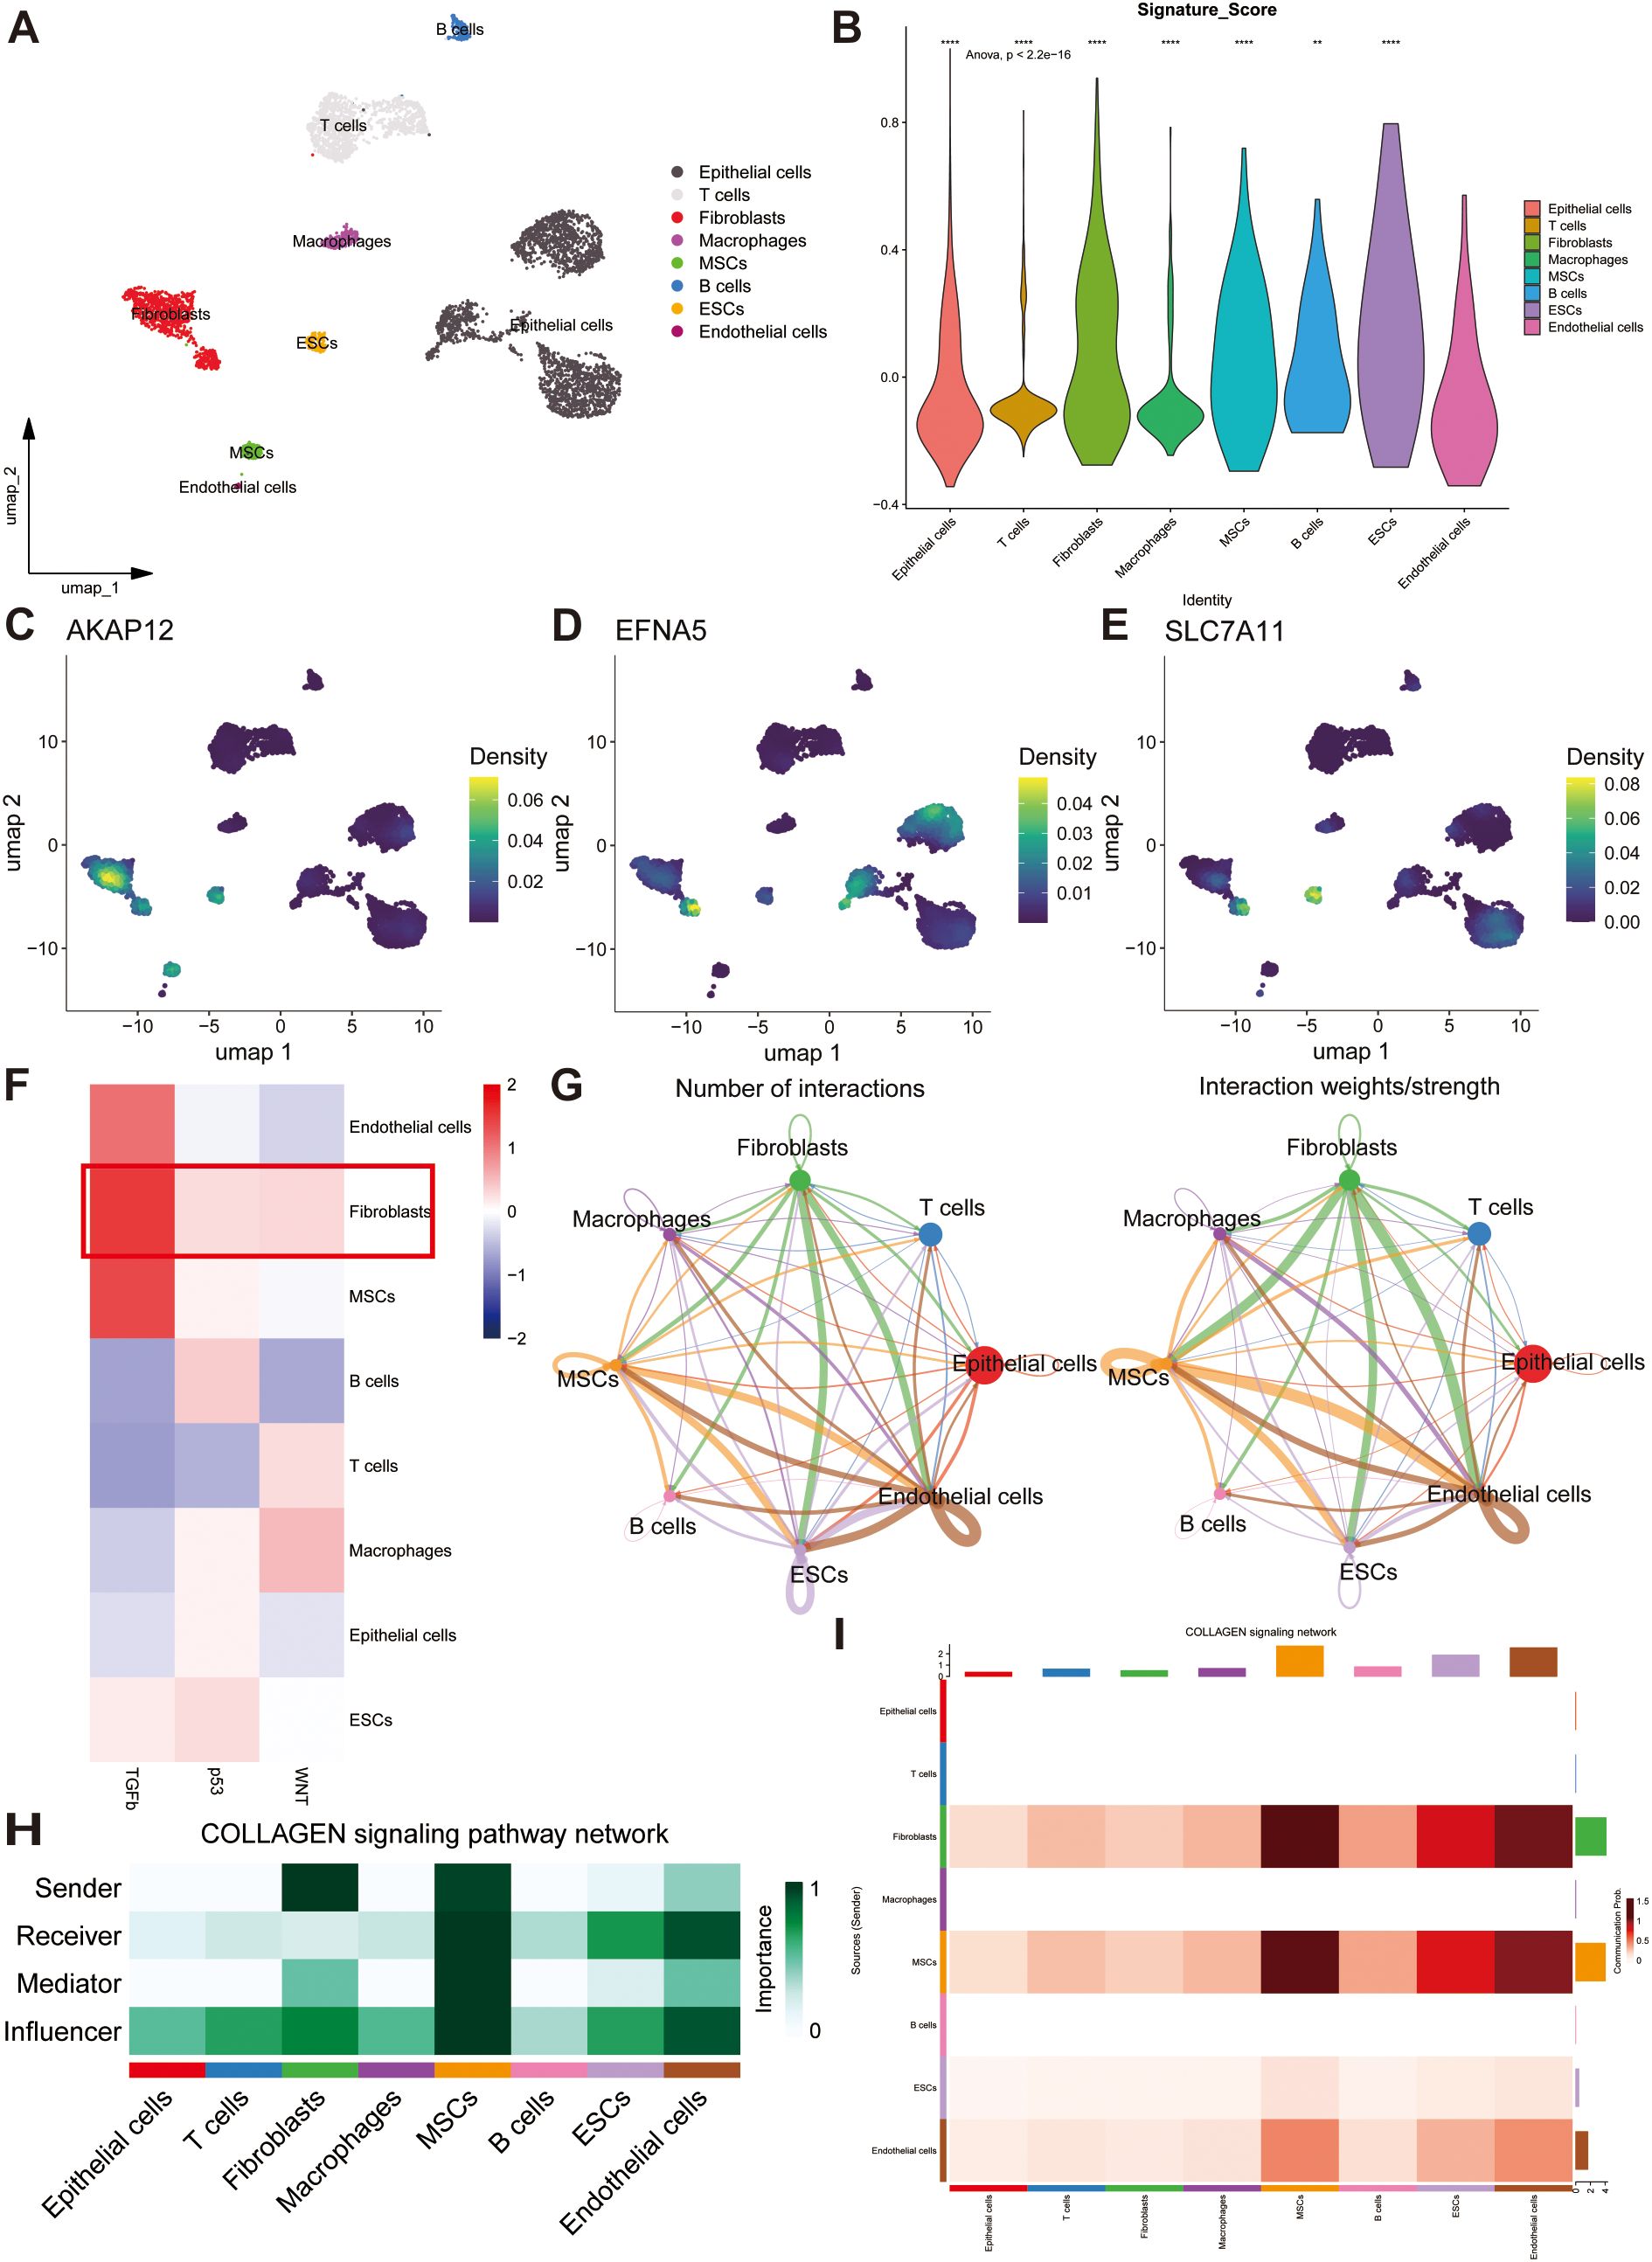
Figure 6. Single-cell analysis reveals the potential mechanisms of stem genes in remodeling TME. (A) The overall single-cell landscape of ovarian samples depicted by the uniform manifold approximation and projection (UMAP). (B) Distributions of stemness signature score in all cell types depicting by violin plot. (C–E) The enrichment extent of AKAP12, EFNA5 and SLC7A11 in all cell types. (F) The strength and activation of stem signals among different cell clusters. (G) Cell-cell communication analysis illustrating the interactions and weights of inter-cellular signals. (H) A heatmap showing the potential roles of all cell types in COLLAGEN signaling pathway. (I) The strength of outgoing and incoming signaling patterns among all cell types manifested by a heatmap. ns, not significant, **p < 0.01, ****p < 0.0001.
3.8 Identification of potential signaling pathways via cell-cell communication analysis
CellChat networks can vividly delineate the weights and numbers of interactions to reveal potential correlations among all cell types. Based on these results, we discovered a strong correlation between fibroblasts and other cell populations (Figure 6G). A heatmap was utilized to reflect the strength of the top 46 intricate cell-cell signaling pathways, and the COLLAGEN, LAMININ, APP, FN1, and VISFATIN signaling pathways were found to be crucial for tumorigenesis (Supplementary Figure S5D). By calculating the centrality scores of the COLLAGEN signaling pathway, we identified that fibroblasts mainly function as senders, whereas endothelial cells serve as receivers and influencers. Alternatively, MSCs may play a significant role in the regulation of all intercellular signaling pathways (Figures 6H, I). Overall, these prognostic genes may induce OC development by regulating the proliferation of endothelial cells, MSCs, and fibroblasts.
3.9 AKAP12 promotes stemness phenotypes and is associated with immune checkpoint OX40L expression in OC
Considering both the model coefficients and the affinity of the antibodies, we meticulously appraised the actual expression of AKAP12, which obtained the highest coefficient and robustly represented the extent of stemness in multiple OC samples. To further elucidate the role of AKAP12 in OC, a series of functional and expression analyses were performed. Firstly, qRT-PCR analysis demonstrated that the expression levels of classical stemness markers [OCT4 (59), SOX2 (60), and CD133 (61)] were significantly elevated in SKOV3 cells cultured under tumor sphere-forming conditions compared with adherent cultures. Importantly, AKAP12 expression was simultaneously upregulated alongside these stemness-associated genes, suggesting a close association between AKAP12 expression and the stemness phenotype in OC cells (Figure 7A). Furthermore, siRNA-mediated knockdown of AKAP12 in SKOV3 cells effectively reduced its mRNA expression, confirming the knockdown efficiency (Figure 7B). CCK-8 assays revealed that AKAP12 knockdown enhanced the sensitivity of SKOV3 cells to cisplatin, as evidenced by a decreased IC50 value compared with scramble controls (Figure 7C). Functionally, AKAP12 knockdown markedly impaired tumor sphere-formation. Representative images showed that siAKAP12-transfected SKOV3 cells failed to form compact, round spheroids compared with the scramble group (Figure 7D), and quantitative analysis demonstrated a significant reduction in sphere formation efficiency (Figure 7E). Moreover, Transwell migration assays indicated that the migratory ability of SKOV3 cells was significantly suppressed following AKAP12 knockdown, with fewer migrated cells observed both qualitatively (Figure 7F) and quantitatively (Figure 7G).
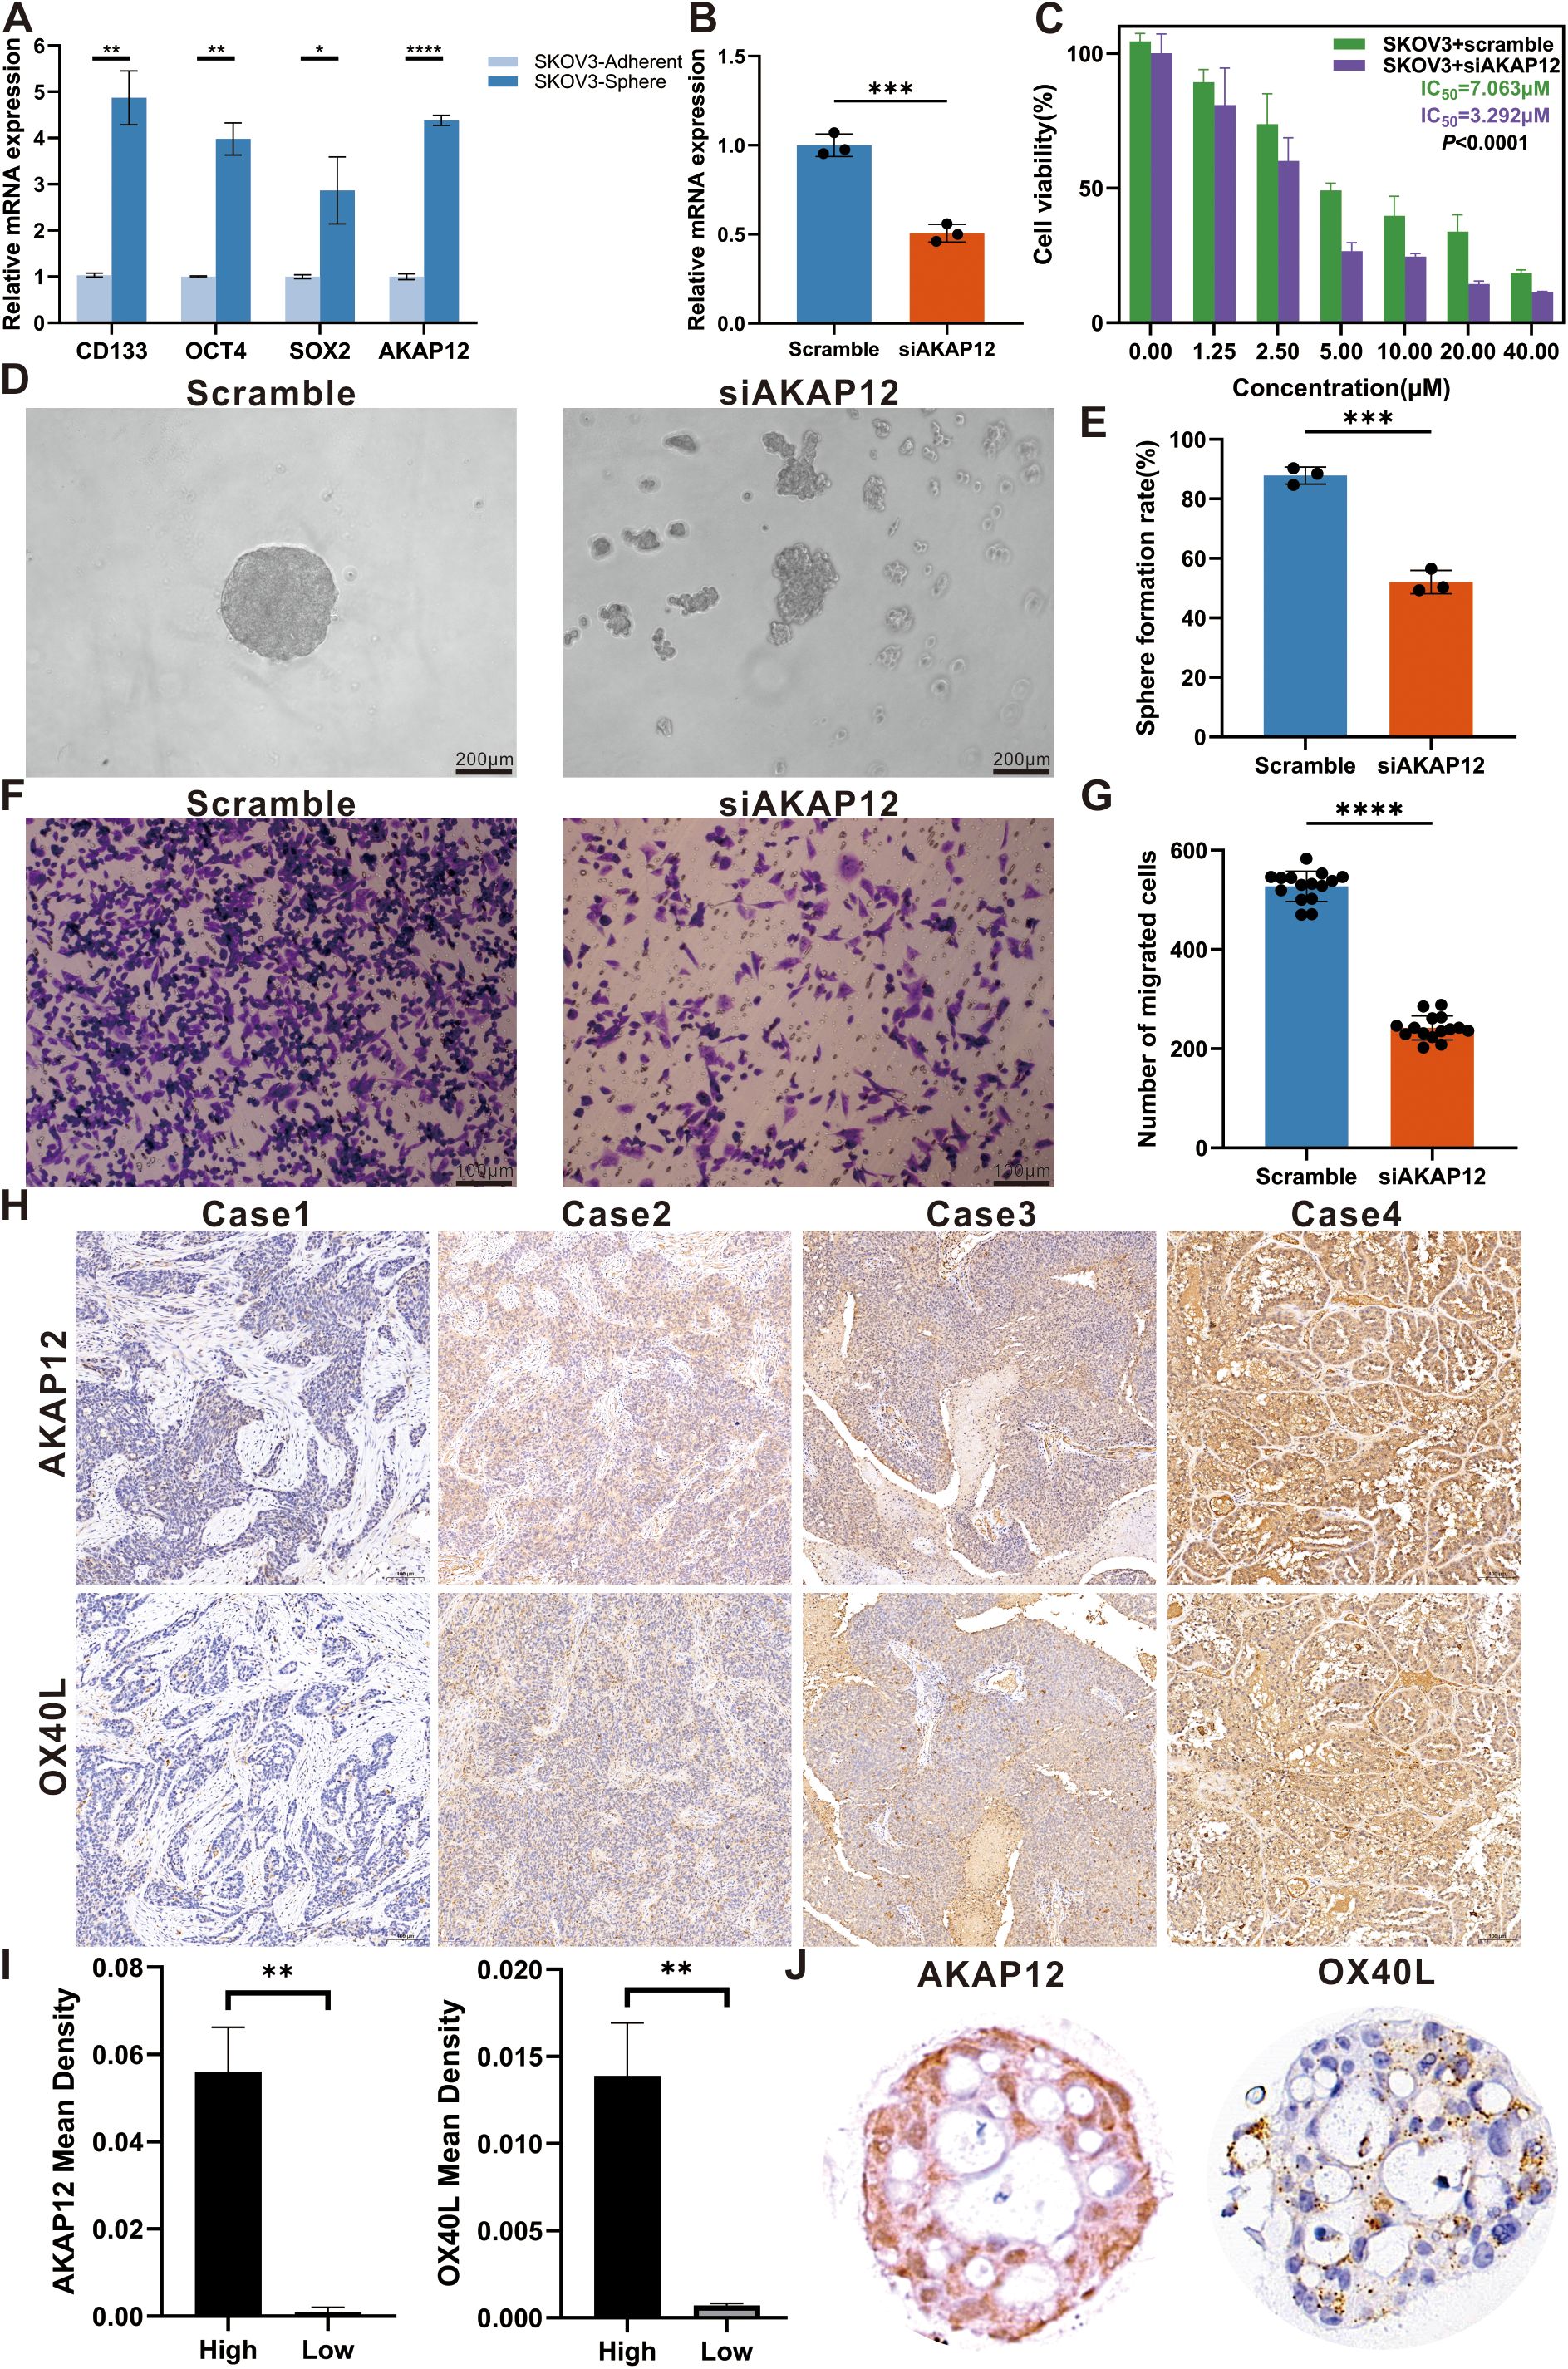
Figure 7. Effects of AKAP12 knockdown on stemness, migration, and chemosensitivity in ovarian cancer cells, and expression analysis in clinical samples and organoids. (A) Relative expression levels of classical stemness markers (OCT4, SOX2, CD133) and AKAP12 in SKOV3 cells cultured under adherent versus tumor sphere-forming conditions, assessed by qRT-PCR. (n = 3). (B) Verification of AKAP12 knockdown efficiency in SKOV3 cells by qRT-PCR. (n = 3). (C) Cell viability curves and IC50 values for cisplatin in scramble- and siAKAP12-transfected SKOV3 cells, assessed by CCK-8 assay. (n = 3). (D) Representative tumor sphere images showing the morphological differences between scramble and siAKAP12-transfected SKOV3 cells after 3 days of culture. (E) Quantitative analysis of sphere formation efficiency in scramble and siAKAP12 groups. (n = 3). (F) Representative Transwell images showing the migrated SKOV3 cells after AKAP12 knockdown compared to scramble controls. (n = 3). (G) Quantification of migrated cell numbers per field in scramble and siAKAP12-transfected SKOV3 cells. (n = 3). (H) Representative immunohistochemical images showing differential expression of AKAP12 and OX40L in four ovarian cancer tissue samples. (I) Quantitative comparison of staining intensity between high- and low-expression subgroups. (J) Expression levels of AKAP12 and OX40L in ovarian cancer organoids. Data are presented as mean ± SEM. *p < 0.05, **p < 0.01, ***p < 0.001, ****p < 0.0001.
Although previous studies have seldom explored the relationship between AKAP12 expression and clinicopathological parameters, our study addressed this gap through immunohistochemical analysis of OC tissues and organoid models. Representative images of AKAP12 and OX40L expression in clinical samples and cultured organoids are shown in Figure 7H. Based on the calculated mean staining density, samples were stratified into high- and low-density groups. A positive correlation between AKAP12 and OX40L expression was observed using t-test analysis (Figure 7I), and this association was further confirmed in OC organoids (Figure 7J).
These findings suggest that AKAP12 serves as a key regulator of stemness and malignant phenotypes in OC and may represent a promising prognostic indicator. Targeting AKAP12 could potentially reduce stemness and drug resistance, while enhancing the therapeutic efficacy of OX40 agonists in patients with high AKAP12 expression.
4 Discussion
OC is a type of cancer with high heterogeneity and is traditionally stratified according to its degree of differentiation. Clinicians tend to neglect the histological differentiation of OC and fail to select appropriate treatment targets (62). Previous studies have suggested that OC stemness characteristics are strongly related to metastasis and chemotherapy resistance (15). Under these circumstances, establishing novel stemness gene sets to evaluate the degree of stemness of tissues from patients with OC and exploring individualized immunotherapy treatments is advised.
A previous study confirmed the significant role of aggresomes in the contribution and maintenance of OC stemness and identified DEGs by comparing the gene expression of OC cells before and after differentiation (34). Further functional enrichment analysis of DEGs revealed that stemness genes mainly activate autophagy, adhesion, and protein adaptor activity signaling pathways to maintain OC dedifferentiation. Studies have reported that Enhanced autophagic flux is observed in OC stem cells, and autophagy can induce the progression of OC through FOXA2 (63). Furthermore, researchers have identified a significant function for cell adhesion molecules, which mediate intracellular adhesion and induce the dispersion of OC cell spheroids to contribute to metastasis (64). The discovery of this study corresponded with the functional enrichment analysis. GSEA demonstrated that the BDP1 and ZNF8 signaling pathways were downregulated throughout progression. Accumulating evidence indicates that both BDP1 and ZNF8 can serve as biomarkers for the diagnosis of OC (65, 66).
Among the three stemness clusters subgrouped by the consensus clustering approach based on 15 prognostic stemness genes, C2 cluster had a highly enriched degree with the worst prognosis. Having calculated the immune infiltration of the three subtypes, we discovered that C2 subtype had a favorable degree of immune infiltration, whereas it had the lowest tumor purity compared to the others. Additionally, high stromal scores are correlated with high-risk and unfavorable prognosis (46, 67, 68). After identifying C2 as the distinguishing subtype, we explored the distribution of immune cells. The results indicated that the abundance of most memory cells, regulatory cells, and helper cells significantly increased in the C2 subtype, and the proportion of CD56dim nature killer cells was lower than that in the other subtypes. Evidence has demonstrated that the activation of regulatory and memory cells could suppress the immune response in anti-tumor processes, and they accumulate in the malignant ascites fluid together with epithelial cells, which could contribute to poor prognosis (69). Nevertheless, CD56dim nature killer cells are enriched in OC-related ascites and elicit anti-tumor cytotoxicity (70). Moreover, immune checkpoint expression demonstrated that C2 subtype is suitable for immunotherapy.
To further elucidate the effect of stemness characteristics on prognosis, we employed WGCNA and selected genes in the black and grey modules, which were highly related to stemness, for survival analysis. Using univariate Cox regression analysis and LASSO Cox regression, we successfully constructed a prognostic model comprising six stemness-related genes (AKAP12, EFNA5, LAMP3, SDF2L1, SLC7A11, and TAF13), two of which (AKAP12 and EFNA5) showed great relevance to stemness and poor prognosis with the largest coefficients. The expression profile of AKAP12 elevated in paclitaxel- and platinum-resistant serous OC cells and correlates with poor OS and progression-free survival (PFS) (71). High-grade serous carcinoma tends to overexpress EFNA5, especially at aggressive stages. EFNA5 inhibits tumor-suppressive signaling pathways, leading to tumorigenesis and drug resistance (72). Through delineating distinct stem cell characteristics, a previous study (73) also defined a prognostic signature comprising nine stem genes (SFRP2, MFAP4, CCDC80, COL16A1, DUSP1, VSTM2L, TGFBI, PXDN, and GAS1) that are upregulated in high-risk group and elucidated potential mechanisms, through which these risk factors may promote the proliferation and metastasis of OC cells.
To further highlight the differences between the models constructed in our and those in other studies, we conducted an additional assessment of their predictive performance using bioinformatics analysis. Specifically, we calculated the risk score of all patients based on the expression and coefficients of prognostic genes, and the risk score also reacted to stem abundance. KM analysis substantiated the distinguishing function of the model in the training and validation cohorts. Meanwhile, the ROC curves confirmed the robustness of predicting 3- and 5-year OS. In comparison with the aforementioned model, our model exhibited superior predictive capacity, as evidenced by 3-year and 5-year ROC values of 0.65 and 0.69 in the TCGA cohort, and exhibiting 0.67 and 0.67 in the GSE26712 cohort, 0.60 and 0.65 in the GSE32062 cohort, respectively. Conversely, the ROC values reported in the other study were 0.626 and 0.671 in one cohort, and 0.622 and 0.583 in the other cohort for the same time frames.
After confirming that the risk score was an independent factor by performing univariate and multivariate Cox regression analyses, we established a nomogram encompassing all risk factors to predict 3-year and 5-year survival rates. In alignment with the methodologies employed in the previous study, we also utilized calibration curves to demonstrate the predictive efficacy of our nomogram. Moreover, the calculation of C-index, collaborating with the development of DCA curves underscored the model’s effectiveness and its substantial net clinical benefit.
To clarify the comprehensive landscape of TME, the abundance of distinct immune cell populations and the activity of multiple immune pathways between two risk subgroups were investigated. Intriguingly, through no substantial differences regarding the distribution of immune cells was observed, the notable upregulation of regulatory T cells (Tregs) captured our attention. Tregs, comprising a minor subset of CD4+ T cells, play a pivotal role in sustaining self-tolerance of the immune system via modulating the proliferation and differentiation of effector cells, not only in the context of cancer (74), but also in inflammatory diseases (75, 76). Additionally, prior research (77) has established that the expression of Foxp3, a marker specifically associated with Tregs, is regulated by p53. Drawing upon the conclusion from other literatures (78–80), which suggested that p53 enhances the chemotherapy toleration and promotes the generation of cancer stem cells by modulating cancer cell quiescence or activating multiple signaling pathways, it’s reasonable for us to hypothesize that cancer cells exhibiting a high level of stemness may demonstrate pronounced expression of p53 and in turn can facilitate the proliferation of Tregs. Conversely, the highly immunosuppressive TME, influenced by Tregs, may also contribute to the emergence and growth of cancer stem cells.
On the other aspect, the collaborative upregulation of the content of type 1 helper cells (Th1 cells) and IFN-γ was observed across groups ranging from low to high stemness. IFN-γ, predominately secreted by Th1 cells, induces inflammatory response and stimulates antitumor immune processes by triggering diverse downstream signaling pathways (81). cGAS/STING, as the major downstream pathway, upregulate a variety of immune checkpoints, implying the potential efficacy of applying immune checkpoint inhibitors in populations with high stem extent (82, 83).
Based on the results of immune checkpoint expression, we hypothesized that an imbalance between OX40 and OX40L expression could hinder the activation of NK and cytotoxic T cells (84, 85). Utilizing anti-OX40 immunostimulants may further enhance therapeutic efficacy for patients with high levels of stemness and reduce the incidence of resistance to platinum (86, 87). TMB analysis demonstrated that low TMB may be related to poor clinical outcomes. This phenomenon is caused by decreased sensitivity to immunotherapy in a population with a high TMB (88). Finally, a drug sensitivity analysis indicated that the application of an OX40 immunity activator could provide new insights into the treatment of OC. The results of IHC staining also revealed the viability of the application of OX40 agonists in OC sections with high levels of stemness, which has not yet been recognized by clinicians, and could provide novel insights for the therapy of patients with recurrent refractory OC. Tumor organoids, a novel in vitro model, are derived from tumor tissues and can simulate tumor proliferation in the host and respond to external chemotherapy or immune drugs (89–91). By employing this simulation methodology, we reinforced the healing efficacy of OX40 agonists in drug-resistant and highly stemmed populations. Referring to a previous study (92), the combined application of OX40 and IFN-γ with STING agonists may achieve satisfactory anti-tumor efficacy.
Single-cell transcriptomics can improve the ability to describe cellular states (93). By integrating multiple single-cell datasets, we successfully revealed the distribution of various cells in the TME encompassing OC samples at the high and low stages. Moreover, the main stemness genes (AKAP12, EFNA5, and SLC7A11) were enriched in fibroblasts, ESCs, and MSCs, implying that these cell types drive stem cell production. Previous studies have shown that cancer-associated fibroblasts and MSCs promote the invasiveness, stemness, and metastasis of OC (94, 95). Cell-cell interactions and signaling pathway analyses have attached great importance to the role of fibroblasts, MSCs, and endothelial cells in the COLLAGEN signaling pathway. PLOD enzymes, which have implications for cancer aggressiveness, can promote collagen cross-linking and increase the firmness of the tumor matrix (96). In addition, cancer-related fibroblasts maintain OC stem cell growth by activating the Wnt5a signaling pathway (97). Under these circumstances, fibroblasts, serving as senders, could induce the proliferation of MSCs and endothelial cells and contribute to the formation of OC stem cells. Ultimately, the inducing role of AKAP12 in stem phenotype of OC was verified in vitro experiments and clinical samples.
Our study had some limitations. First, single-cell and transcriptome data were acquired from public databases, and increase in the sample size is required to improve the scientific validity of the findings. Although we confirmed a positive relationship between the expression of OX40 and immune checkpoints in clinical samples, cytological experiments should be considered to validate the relevant biological functions. Overall, the model that we established could evaluate the actual stem extent for patients with OC and guide efficient therapeutic strategies to improve their prognosis.
5 Conclusion
In summary, we identified a novel stemness gene set by investigating differential change in pre- and post- dedifferentiation OC cells. Utilizing an unsupervised clustering algorithm, we successfully validated the favorable performance of the gene set in distinguishing stemness clusters, and discerned a malignant cluster with a high degree of stemness and poor prognosis. Owning to the potential prognostic value of stemness genes, we established a risk model to enhance prognostic prediction and guide personalized treatment. Having discussed the correlation between the risk score, TME and drug resistance, we performed a creatively discovery, that advised clinicians to activate OX40/OX40L checkpoints to reduce the occurrence of drug resistance and improve patients’ prognosis. Single-cell analysis revealed the potential mechanism driving stem cell production.
Data availability statement
The original contributions presented in the study are included in the article/Supplementary Material. Further inquiries can be directed to the corresponding authors.
Ethics statement
The studies involving humans were approved by The First Affiliated Hospital of Anhui Medical University Ethics Committee of Clinical Research. The studies were conducted in accordance with the local legislation and institutional requirements. The surgical specimens were anonymized prior to their use in this study, and written informed consent was not required as per the ethical approval from the institutional review board.
Author contributions
XZ: Conceptualization, Data curation, Formal Analysis, Methodology, Software, Validation, Writing – original draft. WW: Conceptualization, Methodology, Project administration, Resources, Validation, Visualization, Writing – original draft. XL: Formal Analysis, Investigation, Methodology, Software, Supervision, Visualization, Writing – review & editing. XW: Conceptualization, Methodology, Supervision, Validation, Visualization, Writing – review & editing. YD: Funding acquisition, Methodology, Project administration, Resources, Validation, Writing – review & editing. PL: Formal Analysis, Funding acquisition, Investigation, Project administration, Resources, Visualization, Writing – review & editing.
Funding
The author(s) declare that no financial support was received for the research and/or publication of this article.
Acknowledgments
I wish to thank Ting Wang for advice on IHC experiment and the complete design of our study. Furthermore, I am also extremely grateful to the OC patients from the First Affiliated Hospital of Anhui Medical University, who contributed to the samples utilized in our research and devoted much time to undertake investigations.
Conflict of interest
The authors declare that the research was conducted in the absence of any commercial or financial relationships that could be construed as a potential conflict of interest.
Generative AI statement
The author(s) declare that no Generative AI was used in the creation of this manuscript.
Publisher’s note
All claims expressed in this article are solely those of the authors and do not necessarily represent those of their affiliated organizations, or those of the publisher, the editors and the reviewers. Any product that may be evaluated in this article, or claim that may be made by its manufacturer, is not guaranteed or endorsed by the publisher.
Supplementary material
The Supplementary Material for this article can be found online at: https://www.frontiersin.org/articles/10.3389/fonc.2025.1577283/full#supplementary-material
Supplementary Figure 1 | The functional enrichment analysis of differentially expressed genes (DEGs). The plots depict the enrichment results of Gene Ontology (GO) (A), Kyoto Encyclopedia of Gene and Genome (KEGG) (B) enrichment analysis and Gene Set Enrichment Analysis (GSEA) (C) of DEGs. BP, Biological process; MF, Molecular function; CC, Cellular components.
Supplementary Figure 2 | The correlated performance of different clustering results. (A) Cumulative distribution function (CDF) curves revealing the probability distribution of different subtype numbers (k =2-9). (B) The relative change of area under Delta CDF curve.
Supplementary Figure 3 | The generation process of correlated modules via WGCNA. (A) The diagrams manifest the scale independence and the mean connectivity of multiple soft-thresholding power values. (B) A cluster dendrogram constructed by the weighted correlation coefficients. Genes with similar expression pattern were clustering into the same module. Each color represents a module and each branch represents a gene.
Supplementary Figure 4 | The landscape of TME and drug susceptibility in two risk subgroups. (A) The distribution content of 28 immune cells. (B) The IC50 values of common chemotherapy agents are calculated in the high- and low-risk groups. ns, not significant, *p < 0.05, **p < 0.01.
Supplementary Figure 5 | The single-cell atlas of TME consisting of high- and low-grade OC samples. (A) The comparation of cells distribution in primary OC samples depicted by UMAP plots. Heatmaps manifesting the expression of annotation genes (B) and the top ten genes (C). (D) A heatmap revealing the strength of outgoing and incoming signaling patterns among all cell types.
References
1. Webb PM and Jordan SJ. Global epidemiology of epithelial ovarian cancer. Nat Rev Clin Oncol. (2024) 21:389–400. doi: 10.1038/s41571-024-00881-3
2. Stewart C, Ralyea C, and Lockwood S. Ovarian cancer: an integrated review. Semin Oncol nursing. (2019) 35:151–6. doi: 10.1016/j.soncn.2019.02.001
3. Hao Q, Li J, Zhang Q, Xu F, Xie B, Lu H, et al. Single-cell transcriptomes reveal heterogeneity of high-grade serous ovarian carcinoma. Clin Trans Med. (2021) 11:e500. doi: 10.1002/ctm2.v11.8
4. Xu J, Fang Y, Chen K, Li S, Tang S, Ren Y, et al. Single-cell RNA sequencing reveals the tissue architecture in human high-grade serous ovarian cancer. Clin Cancer research: an Off J Am Assoc Cancer Res. (2022) 28:3590–602. doi: 10.1158/1078-0432.CCR-22-0296
5. Veneziani AC, Gonzalez-Ochoa E, Alqaisi H, Madariaga A, Bhat G, Rouzbahman M, et al. Heterogeneity and treatment landscape of ovarian carcinoma. Nat Rev Clin Oncol. (2023) 20:820–42. doi: 10.1038/s41571-023-00819-1
6. Konstantinopoulos PA and Matulonis UA. Clinical and translational advances in ovarian cancer therapy. Nat cancer. (2023) 4:1239–57. doi: 10.1038/s43018-023-00617-9
7. Eisenhauer EA. Real-world evidence in the treatment of ovarian cancer. Ann oncology: Off J Eur Soc Med Oncol. (2017) 28:viii61–viii5. doi: 10.1093/annonc/mdx443
8. O'Malley DM. New therapies for ovarian cancer. J Natl Compr Cancer Network: JNCCN. (2019) 17:619–21. doi: 10.6004/jnccn.2019.5018
9. Li J, Zou G, Wang W, Yin C, Yan H, and Liu S. Treatment options for recurrent platinum-resistant ovarian cancer: A systematic review and Bayesian network meta-analysis based on RCTs. Front Oncol. (2023) 13:1114484. doi: 10.3389/fonc.2023.1114484
10. Gong TT, Guo S, Liu FH, Huo YL, Zhang M, Yan S, et al. Proteomic characterization of epithelial ovarian cancer delineates molecular signatures and therapeutic targets in distinct histological subtypes. Nat Commun. (2023) 14:7802. doi: 10.1038/s41467-023-43282-3
11. Olbrecht S, Busschaert P, Qian J, Vanderstichele A, Loverix L, Van Gorp T, et al. High-grade serous tubo-ovarian cancer refined with single-cell RNA sequencing: specific cell subtypes influence survival and determine molecular subtype classification. Genome Med. (2021) 13:111. doi: 10.1186/s13073-021-00922-x
12. Yang L, Xie HJ, Li YY, Wang X, Liu XX, and Mai J. Molecular mechanisms of platinum−based chemotherapy resistance in ovarian cancer (Review). Oncol Rep. (2022) 47(4):82. doi: 10.3892/or.2022.8293
13. Wang L, Wang X, Zhu X, Zhong L, Jiang Q, Wang Y, et al. Drug resistance in ovarian cancer: from mechanism to clinical trial. Mol cancer. (2024) 23:66. doi: 10.1186/s12943-024-01967-3
14. Hugendieck G, Lettau M, Andreas S, Neumann S, Reinhardt N, Arnold P, et al. Chemotherapy-induced release of ADAM17 bearing EV as a potential resistance mechanism in ovarian cancer. J extracellular vesicles. (2023) 12:e12338. doi: 10.1002/jev2.12338
15. Motohara T and Katabuchi H. Ovarian cancer stemness: biological and clinical implications for metastasis and chemotherapy resistance. Cancers. (2019) 11(7):907. doi: 10.3390/cancers11070907
16. Lin K, Chowdhury S, Zeineddine MA, Zeineddine FA, Hornstein NJ, Villarreal OE, et al. Identification of colorectal cancer cell stemness from single-cell RNA sequencing. Mol Cancer research: MCR. (2024) 22:337–46. doi: 10.1158/1541-7786.MCR-23-0468
17. Zhao Y, He M, Cui L, Gao M, Zhang M, Yue F, et al. Chemotherapy exacerbates ovarian cancer cell migration and cancer stem cell-like characteristics through GLI1. Br J cancer. (2020) 122:1638–48. doi: 10.1038/s41416-020-0825-7
18. Zhao Y, Yang X, Zhao J, Gao M, Zhang M, Shi T, et al. Berberine inhibits chemotherapy-exacerbated ovarian cancer stem cell-like characteristics and metastasis through GLI1. Eur J Pharmacol. (2021) 895:173887. doi: 10.1016/j.ejphar.2021.173887
19. Jain S, Annett SL, Morgan MP, and Robson T. The cancer stem cell niche in ovarian cancer and its impact on immune surveillance. Int J Mol Sci. (2021) 22(8):4091. doi: 10.3390/ijms22084091
20. Wilczyński JR, Wilczyński M, and Paradowska E. Cancer stem cells in ovarian cancer-A source of tumor success and a challenging target for novel therapies. Int J Mol Sci. (2022) 23(5):2496. doi: 10.3390/ijms23052496
21. Alwosaibai K, Aalmri S, Mashhour M, Ghandorah S, Alshangiti A, Azam F, et al. PD-L1 is highly expressed in ovarian cancer and associated with cancer stem cells populations expressing CD44 and other stem cell markers. BMC cancer. (2023) 23:13. doi: 10.1186/s12885-022-10404-x
22. Zhang J, Lu M, Xu H, Ren F, and Zhu L. Molecular subtypes based on cuproptosis-related genes and tumor microenvironment infiltration characterization in ovarian cancer. Cancer Cell Int. (2022) 22:328. doi: 10.1186/s12935-022-02756-y
23. Bayik D and Lathia JD. Cancer stem cell-immune cell crosstalk in tumour progression. Nat Rev Cancer. (2021) 21:526–36. doi: 10.1038/s41568-021-00366-w
24. Erin N, Grahovac J, Brozovic A, and Efferth T. Tumor microenvironment and epithelial mesenchymal transition as targets to overcome tumor multidrug resistance. Drug resistance updates: Rev commentaries antimicrobial Anticancer chemotherapy. (2020) 53:100715. doi: 10.1016/j.drup.2020.100715
25. Yasuda T, Koiwa M, Yonemura A, Miyake K, Kariya R, Kubota S, et al. Inflammation-driven senescence-associated secretory phenotype in cancer-associated fibroblasts enhances peritoneal dissemination. Cell Rep. (2021) 34:108779. doi: 10.1016/j.celrep.2021.108779
26. Zheng H, Liu H, Li H, Dou W, Wang J, Zhang J, et al. Characterization of stem cell landscape and identification of stemness-relevant prognostic gene signature to aid immunotherapy in colorectal cancer. Stem Cell Res Ther. (2022) 13:244. doi: 10.1186/s13287-022-02913-0
27. Wang C, Li Y, Jia L, Kim JK, Li J, Deng P, et al. CD276 expression enables squamous cell carcinoma stem cells to evade immune surveillance. Cell Stem Cell. (2021) 28:1597–613.e7. doi: 10.1016/j.stem.2021.04.011
28. Xie Z, Huang J, Li Y, Zhu Q, Huang X, Chen J, et al. Single-cell RNA sequencing revealed potential targets for immunotherapy studies in hepatocellular carcinoma. Sci Rep. (2023) 13:18799. doi: 10.1038/s41598-023-46132-w
29. Butler A, Hoffman P, Smibert P, Papalexi E, and Satija R. Integrating single-cell transcriptomic data across different conditions, technologies, and species. Nat Biotechnol. (2018) 36:411–20. doi: 10.1038/nbt.4096
30. Zhou Y, Yang D, Yang Q, Lv X, Huang W, Zhou Z, et al. Single-cell RNA landscape of intratumoral heterogeneity and immunosuppressive microenvironment in advanced osteosarcoma. Nat Commun. (2020) 11:6322. doi: 10.1038/s41467-020-20059-6
31. Mihanfar A, Aghazadeh Attari J, Mohebbi I, Majidinia M, Kaviani M, Yousefi M, et al. Ovarian cancer stem cell: A potential therapeutic target for overcoming multidrug resistance. J Cell Physiol. (2019) 234:3238–53. doi: 10.1002/jcp.v234.4
32. Bonome T, Levine DA, Shih J, Randonovich M, Pise-Masison CA, Bogomolniy F, et al. A gene signature predicting for survival in suboptimally debulked patients with ovarian cancer. Cancer Res. (2008) 68:5478–86. doi: 10.1158/0008-5472.CAN-07-6595
33. Yoshihara K, Tsunoda T, Shigemizu D, Fujiwara H, Hatae M, Fujiwara H, et al. High-risk ovarian cancer based on 126-gene expression signature is uniquely characterized by downregulation of antigen presentation pathway. Clin Cancer research: an Off J Am Assoc Cancer Res. (2012) 18:1374–85. doi: 10.1158/1078-0432.CCR-11-2725
34. Chen Y, Qiang Y, Fan J, Zheng Q, Yan L, Fan G, et al. Aggresome formation promotes ASK1/JNK signaling activation and stemness maintenance in ovarian cancer. Nat Commun. (2024) 15:1321. doi: 10.1038/s41467-024-45698-x
35. Xie B, Olalekan S, Back R, Ashitey NA, Eckart H, and Basu A. Exploring the tumor micro-environment in primary and metastatic tumors of different ovarian cancer histotypes. Front Cell Dev Biol. (2023) 11:1297219. doi: 10.3389/fcell.2023.1297219
36. Leek JT, Johnson WE, Parker HS, Jaffe AE, and Storey JD. The sva package for removing batch effects and other unwanted variation in high-throughput experiments. Bioinf (Oxford England). (2012) 28:882–3. doi: 10.1093/bioinformatics/bts034
37. Ritchie ME, Phipson B, Wu D, Hu Y, Law CW, Shi W, et al. limma powers differential expression analyses for RNA-sequencing and microarray studies. Nucleic Acids Res. (2015) 43:e47. doi: 10.1093/nar/gkv007
38. Xu S, Hu E, Cai Y, Xie Z, Luo X, Zhan L, et al. Using clusterProfiler to characterize multiomics data. Nat Protoc. (2024) 19(11):3292–320. doi: 10.1038/s41596-024-01020-z
39. Subramanian A, Tamayo P, Mootha VK, Mukherjee S, Ebert BL, Gillette MA, et al. Gene set enrichment analysis: a knowledge-based approach for interpreting genome-wide expression profiles. Proc Natl Acad Sci United States America. (2005) 102:15545–50. doi: 10.1073/pnas.0506580102
40. Hu X, Ni S, Zhao K, Qian J, and Duan Y. Bioinformatics-led discovery of osteoarthritis biomarkers and inflammatory infiltrates. Front Immunol. (2022) 13:871008. doi: 10.3389/fimmu.2022.871008
41. Wang J, Wu N, Feng X, Liang Y, Huang M, Li W, et al. PROS1 shapes the immune-suppressive tumor microenvironment and predicts poor prognosis in glioma. Front Immunol. (2022) 13:1052692. doi: 10.3389/fimmu.2022.1052692
42. Chen Y, Feng Y, Yan F, Zhao Y, Zhao H, and Guo Y. A novel immune-related gene signature to identify the tumor microenvironment and prognose disease among patients with oral squamous cell carcinoma patients using ssGSEA: A bioinformatics and biological validation study. Front Immunol. (2022) 13:922195. doi: 10.3389/fimmu.2022.922195
43. Hänzelmann S, Castelo R, and Guinney J. GSVA: gene set variation analysis for microarray and RNA-seq data. BMC Bioinf. (2013) 14:7. doi: 10.1186/1471-2105-14-7
44. Langfelder P and Horvath S. WGCNA: an R package for weighted correlation network analysis. BMC Bioinf. (2008) 9:559. doi: 10.1186/1471-2105-9-559
45. Xu M, Zhou H, Hu P, Pan Y, Wang S, Liu L, et al. Identification and validation of immune and oxidative stress-related diagnostic markers for diabetic nephropathy by WGCNA and machine learning. Front Immunol. (2023) 14:1084531. doi: 10.3389/fimmu.2023.1084531
46. Feng S, Xu Y, Dai Z, Yin H, Zhang K, and Shen Y. Integrative analysis from multicenter studies identifies a WGCNA-derived cancer-associated fibroblast signature for ovarian cancer. Front Immunol. (2022) 13:951582. doi: 10.3389/fimmu.2022.951582
47. Engebretsen S and Bohlin J. Statistical predictions with glmnet. Clin epigenetics. (2019) 11:123. doi: 10.1186/s13148-019-0730-1
48. Shi Y, Wang Y, Dong H, Niu K, Zhang W, Feng K, et al. Crosstalk of ferroptosis regulators and tumor immunity in pancreatic adenocarcinoma: novel perspective to mRNA vaccines and personalized immunotherapy. Apoptosis: an Int J programmed Cell Death. (2023) 28:1423–35. doi: 10.1007/s10495-023-01868-8
49. Abdelhafez OH, Othman EM, Fahim JR, Desoukey SY, Pimentel-Elardo SM, Nodwell JR, et al. Metabolomics analysis and biological investigation of three Malvaceae plants. Phytochemical analysis: PCA. (2020) 31:204–14. doi: 10.1002/pca.v31.2
50. Zhang S, Sun L, Cai D, Liu G, Jiang D, Yin J, et al. Development and validation of PET/CT-based nomogram for preoperative prediction of lymph node status in esophageal squamous cell carcinoma. Ann Surg Oncol. (2023) 30:7452–60. doi: 10.1245/s10434-023-13694-y
51. Liu TT, Li R, Huo C, Li JP, Yao J, Ji XL, et al. Identification of CDK2-related immune forecast model and ceRNA in lung adenocarcinoma, a pan-cancer analysis. Front Cell Dev Biol. (2021) 9:682002. doi: 10.3389/fcell.2021.682002
52. Addeo A, Friedlaender A, Banna GL, and Weiss GJ. TMB or not TMB as a biomarker: That is the question. Crit Rev oncology/hematology. (2021) 163:103374. doi: 10.1016/j.critrevonc.2021.103374
53. Chan TA, Yarchoan M, Jaffee E, Swanton C, Quezada SA, Stenzinger A, et al. Development of tumor mutation burden as an immunotherapy biomarker: utility for the oncology clinic. Ann oncology: Off J Eur Soc Med Oncol. (2019) 30:44–56. doi: 10.1093/annonc/mdy495
54. Maeser D, Gruener RF, and Huang RS. oncoPredict: an R package for predicting in vivo or cancer patient drug response and biomarkers from cell line screening data. Briefings Bioinf. (2021) 22(6):bbab260. doi: 10.1093/bib/bbab260
55. Mangiola S, Doyle MA, and Papenfuss AT. Interfacing Seurat with the R tidy universe. Bioinf (Oxford England). (2021) 37:4100–7. doi: 10.1093/bioinformatics/btab404
56. Badia IMP, Vélez Santiago J, Braunger J, Geiss C, Dimitrov D, Müller-Dott S, et al. decoupleR: ensemble of computational methods to infer biological activities from omics data. Bioinf Adv. (2022) 2:vbac016. doi: 10.1093/bioadv/vbac016
57. Jin S, Guerrero-Juarez CF, Zhang L, Chang I, Ramos R, Kuan CH, et al. Inference and analysis of cell-cell communication using CellChat. Nat Commun. (2021) 12:1088. doi: 10.1038/s41467-021-21246-9
58. Kopper O, de Witte CJ, Lõhmussaar K, Valle-Inclan JE, Hami N, Kester L, et al. An organoid platform for ovarian cancer captures intra- and interpatient heterogeneity. Nat Med. (2019) 25:838–49. doi: 10.1038/s41591-019-0422-6
59. Chen X, Niu W, Fan X, Yang H, Zhao C, Fan J, et al. Oct4A palmitoylation modulates tumorigenicity and stemness in human glioblastoma cells. Neuro-oncology. (2023) 25:82–96. doi: 10.1093/neuonc/noac157
60. Tang Q, Chen J, Di Z, Yuan W, Zhou Z, Liu Z, et al. TM4SF1 promotes EMT and cancer stemness via the Wnt/β-catenin/SOX2 pathway in colorectal cancer. J Exp Clin Cancer research: CR. (2020) 39:232. doi: 10.1186/s13046-020-01690-z
61. Wang J, Shao F, Yang Y, Wang W, Yang X, Li R, et al. A non-metabolic function of hexokinase 2 in small cell lung cancer: promotes cancer cell stemness by increasing USP11-mediated CD133 stability. Cancer Commun (London England). (2022) 42:1008–27. doi: 10.1002/cac2.v42.10
62. Cho KR and Shih Ie M. Ovarian cancer. Annu Rev pathology. (2009) 4:287–313. doi: 10.1146/annurev.pathol.4.110807.092246
63. Peng Q, Qin J, Zhang Y, Cheng X, Wang X, Lu W, et al. Autophagy maintains the stemness of ovarian cancer stem cells by FOXA2. J Exp Clin Cancer research: CR. (2017) 36:171. doi: 10.1186/s13046-017-0644-8
64. Sivakumar S, Lieber S, Librizzi D, Keber C, Sommerfeld L, Finkernagel F, et al. Basal cell adhesion molecule promotes metastasis-associated processes in ovarian cancer. Clin Trans Med. (2023) 13:e1176. doi: 10.1002/ctm2.v13.1
65. Cabarcas-Petroski S, Olshefsky G, and Schramm L. BDP1 as a biomarker in serous ovarian cancer. Cancer Med. (2023) 12:6401–18. doi: 10.1002/cam4.5388
66. Kim DH and Lee KE. Discovering Breast Cancer Biomarkers Candidates through mRNA Expression Analysis Based on The Cancer Genome Atlas Database. J personalized Med. (2022) 12(10):1753. doi: 10.3390/jpm12101753
67. Liu L, Wang Q, Zhou JY, and Zhang B. Developing four cuproptosis-related lncRNAs signature to predict prognosis and immune activity in ovarian cancer. J Ovarian Res. (2023) 16:88. doi: 10.1186/s13048-023-01165-7
68. Zhang D, Lu W, Cui S, Mei H, Wu X, and Zhuo Z. Establishment of an ovarian cancer omentum metastasis-related prognostic model by integrated analysis of scRNA-seq and bulk RNA-seq. J Ovarian Res. (2022) 15:123. doi: 10.1186/s13048-022-01059-0
69. Landskron J, Helland Ø, Torgersen KM, Aandahl EM, Gjertsen BT, Bjørge L, et al. Activated regulatory and memory T-cells accumulate in Malignant ascites from ovarian carcinoma patients. Cancer immunology immunotherapy: CII. (2015) 64:337–47. doi: 10.1007/s00262-014-1636-6
70. Tonetti CR, de Souza-Araújo CN, Yoshida A, da Silva RF, Alves PCM, Mazzola TN, et al. Ovarian cancer-associated ascites have high proportions of cytokine-responsive CD56bright NK cells. Cells. (2021) 10(7):1702. doi: 10.3390/cells10071702
71. Bateman NW, Jaworski E, Ao W, Wang G, Litzi T, Dubil E, et al. Elevated AKAP12 in paclitaxel-resistant serous ovarian cancer cells is prognostic and predictive of poor survival in patients. J Proteome Res. (2015) 14:1900–10. doi: 10.1021/pr5012894
72. Jukonen J, Moyano-Galceran L, Höpfner K, Pietilä EA, Lehtinen L, Huhtinen K, et al. Aggressive and recurrent ovarian cancers upregulate ephrinA5, a non-canonical effector of EphA2 signaling duality. Sci Rep. (2021) 11:8856. doi: 10.1038/s41598-021-88382-6
73. Yuan H, Yu Q, Pang J, Chen Y, Sheng M, and Tang W. The value of the stemness index in ovarian cancer prognosis. Genes. (2022) 13(6):973. doi: 10.3390/genes13060993
74. Tay C, Tanaka A, and Sakaguchi S. Tumor-infiltrating regulatory T cells as targets of cancer immunotherapy. Cancer Cell. (2023) 41:450–65. doi: 10.1016/j.ccell.2023.02.014
75. Wu D and Sun Y. The functional redundancy of neddylation E2s and E3s in modulating the fitness of regulatory T cells. Res (Washington DC). (2023) 6:0212. doi: 10.34133/research.0212
76. Knoedler S, Knoedler L, Kauke-Navarro M, Rinkevich Y, Hundeshagen G, Harhaus L, et al. Regulatory T cells in skin regeneration and wound healing. Military Med Res. (2023) 10:49. doi: 10.1186/s40779-023-00484-6
77. Zhang H, Wu T, Ren C, Dong N, Wu Y, and Yao Y. p53 promotes the expansion of regulatory T cells via DNMT3a- and TET2- mediated Foxp3 expression in sepsis. Burns Trauma. (2023) 11:tkad021. doi: 10.1093/burnst/tkad021
78. Yuan X, Chen K, Zheng F, Xu S, Li Y, Wang Y, et al. Low-dose BPA and its substitute BPS promote ovarian cancer cell stemness via a non-canonical PINK1/p53 mitophagic signaling. J hazardous materials. (2023) 452:131288. doi: 10.1016/j.jhazmat.2023.131288
79. Curylova L, Ramos H, Saraiva L, and Skoda J. Noncanonical roles of p53 in cancer stemness and their implications in sarcomas. Cancer letters. (2022) 525:131–45. doi: 10.1016/j.canlet.2021.10.037
80. Zhou Z, Shu Y, Bao H, Han S, Liu Z, Zhao N, et al. Stress-induced epinephrine promotes epithelial-to-mesenchymal transition and stemness of CRC through the CEBPB/TRIM2/P53 axis. J Trans Med. (2022) 20:262. doi: 10.1186/s12967-022-03467-8
81. Cao Q, Xue R, and Zhang N. Th1 cells inducing IFNγ response improves immunotherapy efficacy in gastric cancer. Chin J Cancer Res = Chung-kuo yen cheng yen chiu. (2023) 35:299–315. doi: 10.21147/j.issn.1000-9604.2023.03.08
82. Kim H, Kim H, Feng Y, Li Y, Tamiya H, Tocci S, et al. PRMT5 control of cGAS/STING and NLRC5 pathways defines melanoma response to antitumor immunity. Sci Trans Med. (2020) 12(551):eaaz5683. doi: 10.1126/scitranslmed.aaz5683
83. Jiang Y, Li X, Qian F, Sun B, Wang X, Zhang Y, et al. Fine-tuning bacterial cyclic di-AMP production for durable antitumor effects through the activation of the STING pathway. Res (Washington DC). (2023) 6:0102. doi: 10.34133/research.0102
84. Lu X. OX40 and OX40L interaction in cancer. Curr medicinal Chem. (2021) 28:5659–73. doi: 10.2174/0929867328666201229123151
85. Buchan SL, Rogel A, and Al-Shamkhani A. The immunobiology of CD27 and OX40 and their potential as targets for cancer immunotherapy. Blood. (2018) 131:39–48. doi: 10.1182/blood-2017-07-741025
86. Ramser M, Eichelberger S, Däster S, Weixler B, Kraljević M, Mechera R, et al. High OX40 expression in recurrent ovarian carcinoma is indicative for response to repeated chemotherapy. BMC cancer. (2018) 18:425. doi: 10.1186/s12885-018-4339-0
87. Virani NA, Thavathiru E, McKernan P, Moore K, Benbrook DM, and Harrison RG. Anti-CD73 and anti-OX40 immunotherapy coupled with a novel biocompatible enzyme prodrug system for the treatment of recurrent, metastatic ovarian cancer. Cancer letters. (2018) 425:174–82. doi: 10.1016/j.canlet.2018.03.027
88. Liu L, Bai X, Wang J, Tang XR, Wu DH, Du SS, et al. Combination of TMB and CNA stratifies prognostic and predictive responses to immunotherapy across metastatic cancer. Clin Cancer research: an Off J Am Assoc Cancer Res. (2019) 25:7413–23. doi: 10.1158/1078-0432.CCR-19-0558
89. Gu Y, Zhang W, Wu X, Zhang Y, Xu K, and Su J. Organoid assessment technologies. Clin Trans Med. (2023) 13:e1499. doi: 10.1002/ctm2.v13.12
90. Rauth S, Karmakar S, Batra SK, and Ponnusamy MP. Recent advances in organoid development and applications in disease modeling. Biochim Biophys Acta Rev cancer. (2021) 1875:188527. doi: 10.1016/j.bbcan.2021.188527
91. Bleijs M, van de Wetering M, Clevers H, and Drost J. Xenograft and organoid model systems in cancer research. EMBO J. (2019) 38:e101654. doi: 10.15252/embj.2019101654
92. Hosseinzadeh S, Imani M, Pourfarzi F, Jafari N, AbedianKenari S, and Safarzadeh E. Combination of IFN-gamma with STING agonist and PD-1 immune checkpoint blockade: a potential immunotherapy for gastric cancer. Med Oncol (Northwood London England). (2024) 41:110. doi: 10.1007/s12032-024-02326-4
93. Stuart T, Butler A, Hoffman P, Hafemeister C, Papalexi E, Mauck WM 3rd, et al. Comprehensive integration of single-cell data. Cell. (2019) 177:1888–902.e21. doi: 10.1016/j.cell.2019.05.031
94. Ho CM, Chang TH, Yen TL, Hong KJ, and Huang SH. Collagen type VI regulates the CDK4/6-p-Rb signaling pathway and promotes ovarian cancer invasiveness, stemness, and metastasis. Am J Cancer Res. (2021) 11:668–90.
95. Ji Z, Tian W, Gao W, Zang R, Wang H, and Yang G. Cancer-associated fibroblast-derived interleukin-8 promotes ovarian cancer cell stemness and Malignancy through the notch3-mediated signaling. Front Cell Dev Biol. (2021) 9:684505. doi: 10.3389/fcell.2021.684505
96. Lyu Y and Feng C. Collagen synthesis and gap junctions: the highway for metastasis of ovarian cancer. Lab investigation; J Tech Methods pathology. (2021) 101:540–2. doi: 10.1038/s41374-021-00546-0
Keywords: ovarian cancer, stemness, immune checkpoints, drug resistance, tumor organoid
Citation: Zeng X, Wu W, Li X, Wu X, Du Y and Li P (2025) Stemness-driven clusters in ovarian cancer: immune characteristics and prognostic implications. Front. Oncol. 15:1577283. doi: 10.3389/fonc.2025.1577283
Received: 15 February 2025; Accepted: 27 May 2025;
Published: 11 June 2025.
Edited by:
Sharon R. Pine, University of Colorado Anschutz Medical Campus, United StatesReviewed by:
Venkatesh Pooladanda, Massachusetts General Hospital and Harvard Medical School, United StatesDechao Feng, University College London, United Kingdom
Copyright © 2025 Zeng, Wu, Li, Wu, Du and Li. This is an open-access article distributed under the terms of the Creative Commons Attribution License (CC BY). The use, distribution or reproduction in other forums is permitted, provided the original author(s) and the copyright owner(s) are credited and that the original publication in this journal is cited, in accordance with accepted academic practice. No use, distribution or reproduction is permitted which does not comply with these terms.
*Correspondence: Ping Li, bGlwaW5nMTk2NEBhaG11LmVkdS5jbg==; Yingying Du, ZHV5aW5neWluZ0BhaG11LmVkdS5jbg==
†These authors have contributed equally to this work