 Anliang Chen1,2†Xing Meng1,3†Changjun Ma1Shifeng Tian1
 Qingwei Song1
 Ailian Liu1,2,4*Mingrui Zhuang5
 Hongkai Wang5,6
- 1Department of Radiology, The First Affiliated Hospital of Dalian Medical University, Dalian, Liaoning, China
- 2Dalian Medical Imaging Artificial Intelligence Engineering Technology Research Center, Dalian, Liaoning, China
- 3Department of Radiology, Dalian Women and Children’s Medical Group, Dalian, Liaoning, China
- 4Technology Innovation Center of Hyperpolarized MRI, Dalian, Liaoning, China
- 5School of Biomedical Engineering, Faculty of Medicine, Dalian University of Technology, Dalian, Liaoning, China
- 6Liaoning Key Laboratory of Integrated Circuit and Biomedical Electronic System, Dalian, Liaoning, China
Purpose: This study aims to evaluate the efficacy of utilizing automated intertumoral susceptibility signal (ITSS) intensity extraction combined with R2* values derived from enhanced T2*-weighted angiography (ESWAN) in magnetic resonance imaging (MRI) to distinguish between cervical adenocarcinoma (CA) and cervical squamous carcinoma (CSC).
Methods: Seventy-eight patients who underwent ESWAN from 2014 to 2019 were stratified into two groups: CA (26 patients) and CSC (52 patients). R2* values of the lesions were measured, and ITSS ratios were automatically calculated using the Anatomy Sketch (AS) software. Independent samples t-tests or Mann-Whitney U-tests were utilized to evaluate disparities in the parameters. Binary logistic regression was conducted to identify independent predictors. The receiver operating characteristic curve was employed to assess diagnostic value, and the Delong test was applied to compare differences in the area under the curve (AUC).
Results: The CA group exhibited significantly higher values for the ITSSs, ITSSv and R2* value, lower alpha fetoprotein (AFP) and prognostic nutritional index (PNI) (ITSSs: 0.203 ± 0.111; ITSSv:0.206 ± 0.098; R2* value:20.340 ± 5.572Hz; AFP: 1.73(1.33,2.99)ng/ml; PNI:49.150(45.825,51.775)) than that of the CSC group (ITSSs: 0.072 ± 0.019; ITSSv: 0.076 ± 0.030; R2* value: 13.233 ± 4.083Hz; AFP: 2.99(1.88,2.99)ng/ml; PNI: 50.775(48.563,54.050)) (P< 0.05). Among them, ITSSv and R2* value were independent risk predictors. The AUC values for ITSSv, R2* value and the combined model for differentiate between CA and CSC were 0.942, 0.851 and 0.950, respectively. The results of the Delong test indicated that the combined model exhibited superior diagnostic efficacy compared to R2* value (P< 0.05), but no significant difference from ITSSv (P>0.05).
Conclusion: ITSSv and R2* values derived from ESWAN facilitate the quantitative differentiate between CA and CSC. The automated extraction of ITSSv is convenient and reliable, making it a promising candidate for clinical implementation.
Introduction
Cervical cancer (CC) is the fourth most common cancer among women worldwide and ranks as the second leading cause of cancer-related deaths in women aged 20–39 years in the United States (1, 2). It is also the fifth most prevalent cancer in China (3). Among the various types of CC, CSC and CA are the most prevalent, with CA accounting for approximately 20% of CC cases (4). In contrast to CSC, CA primarily originates from the cervical stroma, is more likely to infiltrate the lymphatic vascular space, and is associated with lymph node and distant metastases, resulting in a relatively aggressive clinical course, decreased sensitivity to radiotherapy (5) and a poor prognosis (6–8). Research indicates that the 5-year survival rate for CA is approximately 10%-20% lower than that for CSC (9). The stagnant survival trends for CC likely reflect, in part, an increased proportion of CA, making the identification of the two types of cancer significant. However, conventional multiple punch biopsy performed under vaginoscopy can be influenced by factors such as lesion size, sampling precision and the experience of operators (10), which may lead to variations in final pathological outcomes. Research indicates that around 24.3% of patients diagnosed with invasive CA exhibit negative cytological results (11). Given the notable differences in surgical treatment approaches and postoperative adjuvant chemotherapy between CA and CSC, a reliable method to accurately distinguish between the two prior to surgery is essential for enhancing patient survival rates (12).
In October 2018, the International Federation of Gynecology and Obstetrics (FIGO) updated the CC staging system and for the first time proposed that imaging findings could be utilized for CC staging (13), aiming to establish a comprehensive clinical/pathological/radiological staging framework, thereby imposing higher requirements for imaging examinations. ESWAN sequence, derived from susceptibility-weighted imaging, integrates techniques that leverage magnetic susceptibility differences and oxygen level-dependent effects. This approach facilitates the collection of quantitative parameters, such as transverse relaxation rate (R2*) values, through post-processing, enabling the non-invasive assessment of oxygenation and local metabolic status in hypoxic tumor regions (14, 15). In addition to visualizing and delineating small vessels and microbleeds, ESWAN also contributes to the observation of both physiological and pathological conditions (16).
Studies have demonstrated that intratumoral hemorrhages are frequently in the form of microhemorrhages (17). The ITSS appears as a low-signal region on the phase map, characterized by a pattern of continuous dots or slender lines within the tumor, primarily resulting from microhemorrhages and neovascularization (18). This feature serves as an intuitive and non-invasive imaging biomarker for assessing vascular proliferation in pathological tissues, effectively illustrating the density and dimensions of micro-vessels present in the lesion (19).
In this study, CA and CSC were identified through automatic ITSS extraction combined with R2* values derived from ESWAN, providing a non-invasive approach for predicting the pathological classification of CC.
Materials and methods
Patients and data collection
This retrospective study received approval from the Ethics Committee. The clinical and imaging data of CC patients who underwent 1.5T MRI at our hospital from April 2014 to December 2019 were retrospectively analyzed.
The inclusion criteria for the study were as follows: (1) patients with histologically confirmed CSC/CA following surgical resection; (2) high-quality MRI images, including T1-weighted imaging (T1WI), T2-weighted imaging (T2WI), diffusion-weighted imaging (DWI), and ESWAN sequences, which provided clear visualization of lesions, were free from artifacts, and facilitated the identification of tumor boundaries for effective region of interest (ROI) delineation.
Patients were excluded from the study for the following reasons: (1) the presence of other coexisting uterine diseases that could affect the observation and measurement of cervical lesions; (2) patients who had undergone any prior treatments, such as biopsy, curettage, radiotherapy, chemotherapy, or immunotherapy, before the MRI examination; (3) lesions measuring less than 1.0 cm or those for which the delineation process indicated fewer than three layers.
According to the above criteria, 271 patients were enrolled, comprising 26 CA patients and 245 CSC patients. For the subsequent statistical analysis, 26 CA patients and 52 controls with CSC in a 1:2 ratio (randomly selected from 245 CSC patients) were ultimately included in our study (20). The flowchart of patient selection process was illustrated in Figure 1. The demographic and clinicopathological characteristics of the two groups were gathered from the hospital information system, including variables such as age, irregular vaginal bleeding, tumor size, FIGO stage, carcinoembryonic antigen, AFP, carbohydrate antigen 12-5, carbohydrate antigen 19-9, epididymal protein 4, neutrophil-lymphocyte ratio, monocyte-lymphocyte ratio, platelet-lymphocyte ratio, systematic immune inflammation index, pan-immune inflammation value, PNI, aspartate aminotransferase to lymphocyte ratio index, aspartate aminotransferase to platelet ratio index, degree of differentiation, lymphatic vascular space invasion, perineural invasion, and lymph node metastasis.
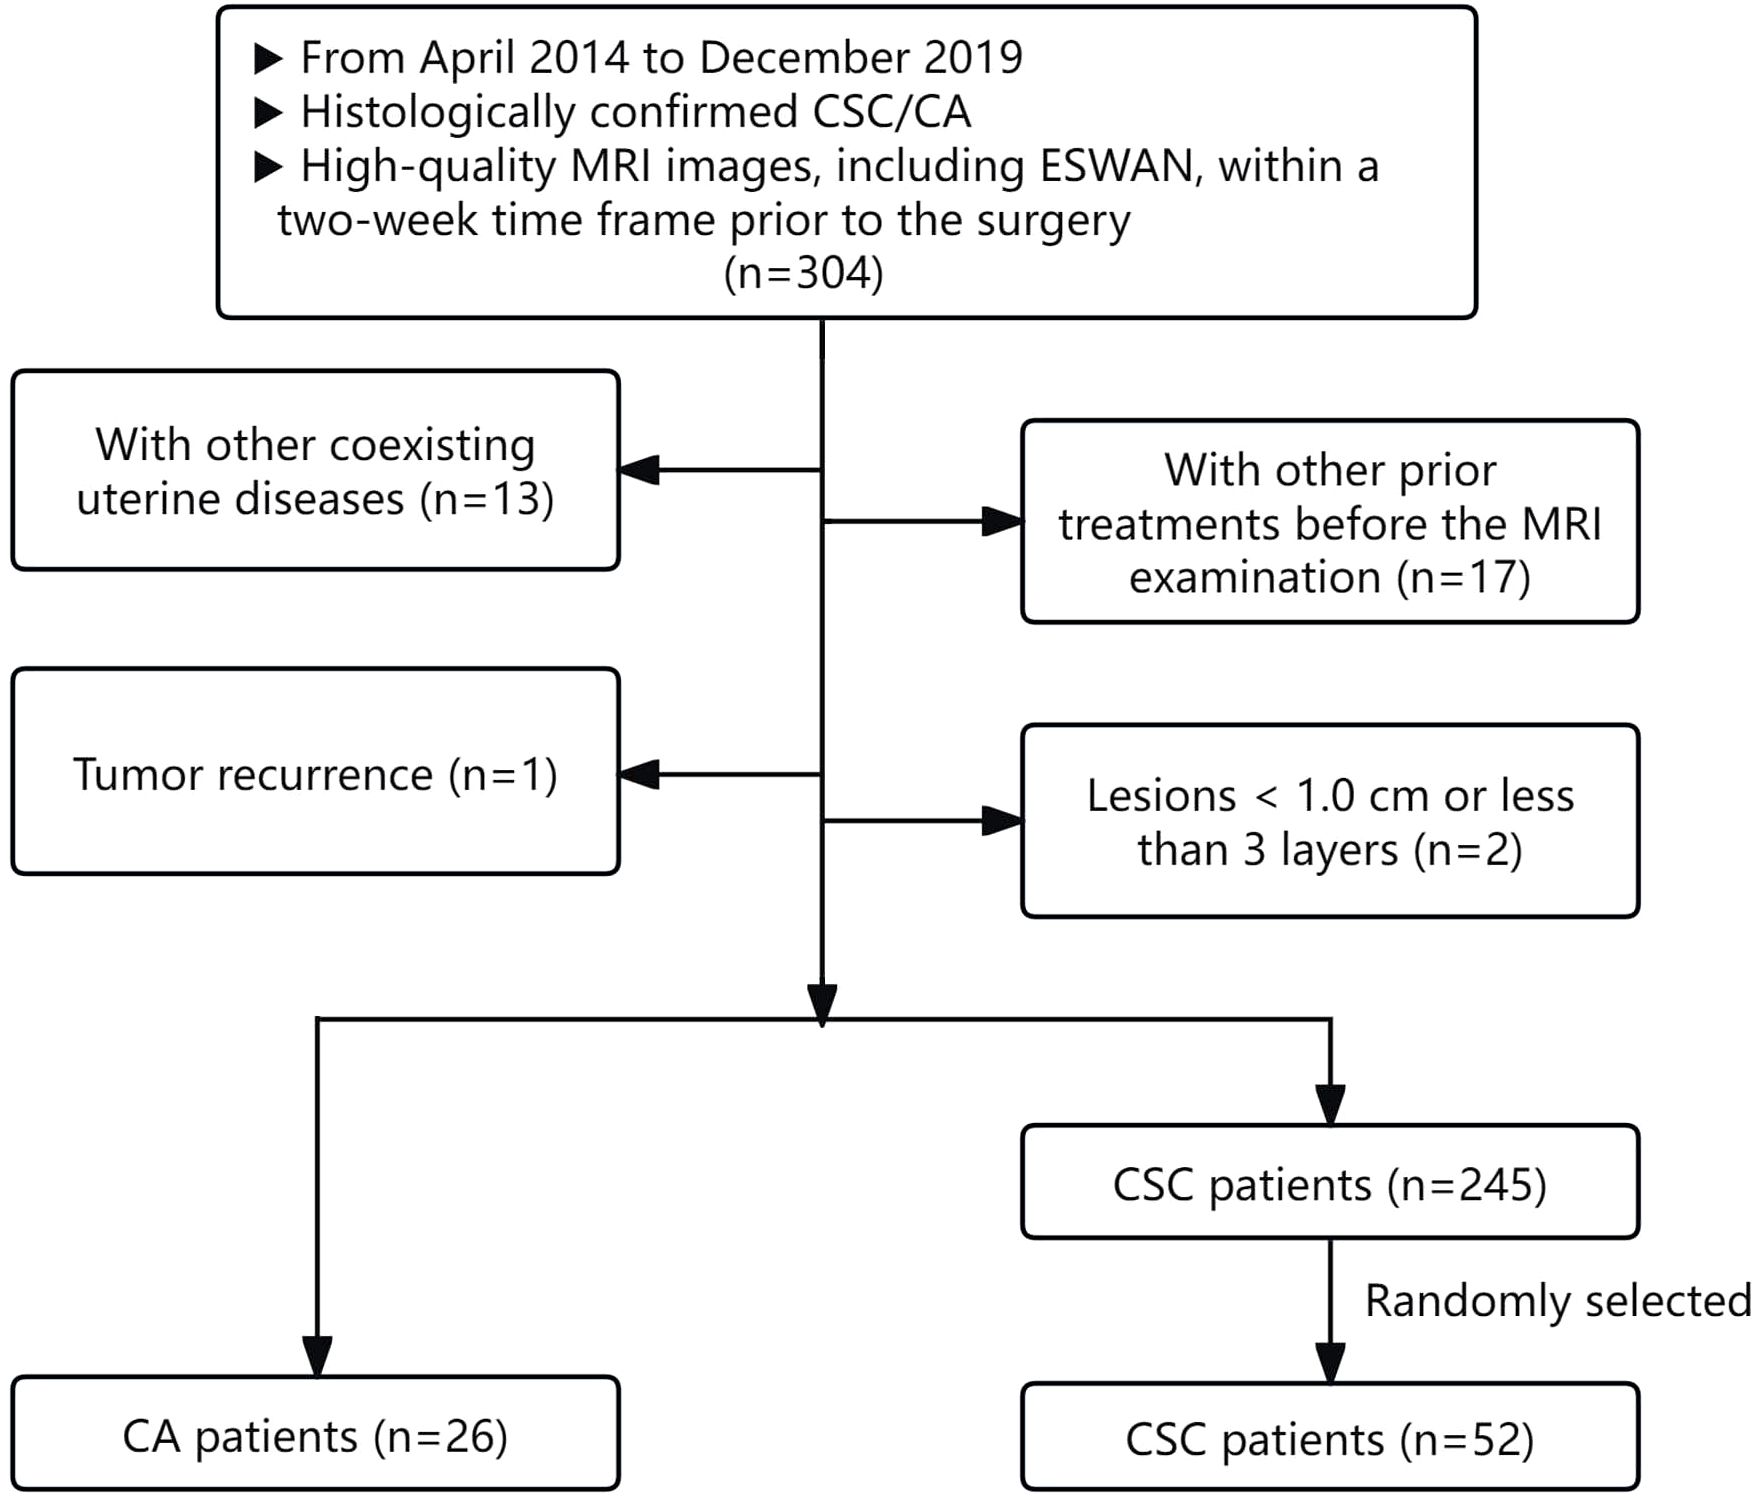
Figure 1. Flowchart of patient selection process.
MRI data acquisition
All patients enrolled in the study underwent Signa HDxt 1.5T MRI (GE Healthcare, Milwaukee, WI, USA) within a two-week time frame prior to surgery. Birth control rings were removed one day before the examination, and dietary abstinence was enforced for 4 to 6 hours to mitigate gastrointestinal peristaltic artifacts. Patients were instructed to consume approximately 500 ml of water one hour before the examination to achieve moderate bladder fullness, and they received guidance on proper breathing techniques to minimize respiratory motion artifacts that could compromise image quality. Patients were positioned supine with their feet advanced for the duration of the examination. The study employed an 8-channel phased array body coil for imaging, utilizing scanning sequences including T1WI, T2WI, DWI, dynamic contrast-enhanced MRI (DCE-MRI) and ESWAN. Detailed scanning parameters were provided in Table 1.
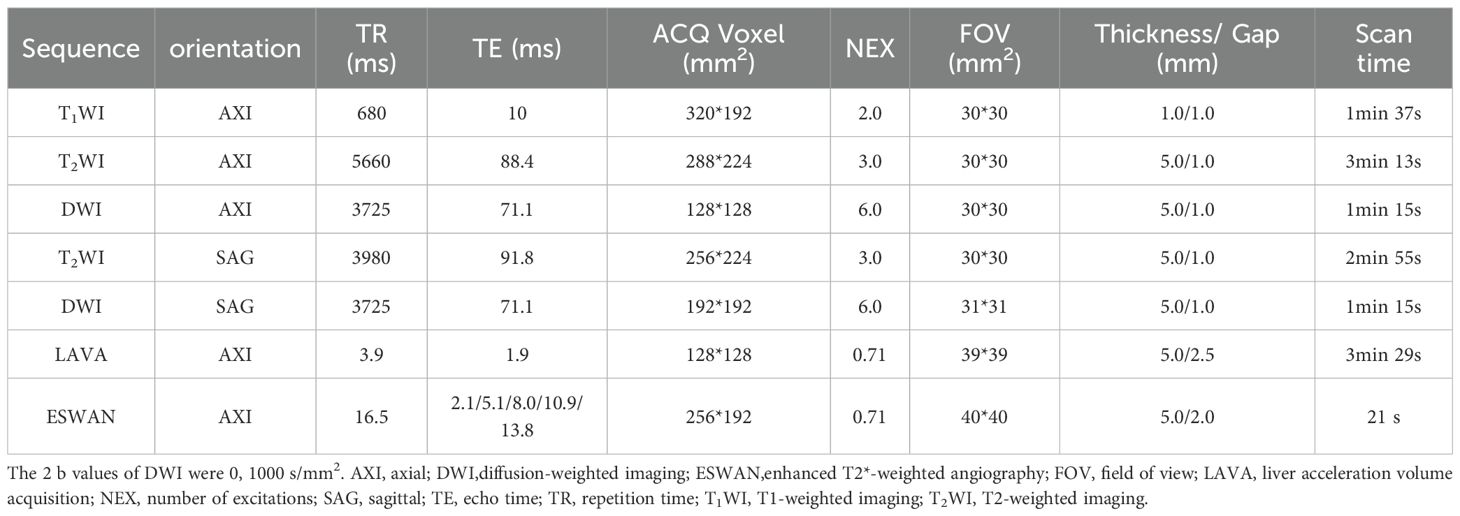
Table 1. Scanning sequence parameters.
Measurement of ITSS ratios
The initial axial digital images obtained from the ESWAN sequence were transmitted to the Advantage Workstation (AW, Version 4.6; GE Healthcare, Milwaukee, WI, USA). Post-processing was conducted using the Functool software to generate the phase maps. Prior to measurement, an image de-artifacting program developed in Python was employed to eliminate artifacts from the phase maps. (1) Input a phase map requiring artifact removal, containing a band-like artifact characterized by alternating dark and bright pixel bands; pixels exhibiting these characteristics necessitate elimination. (2) Apply median filtering to the image in step 1 to generate a smoothed image. (3) Subtract the pixel values of the image in step 1 from the image in step 2. Pixels in the resulting matrix that fall below -150 are classified as having insufficient signal, while pixels exceeding 200 are deemed to have excessive signal. Assign -1 to pixels with insufficient signal, 1 to pixels with excessive signal, and 0 to the remaining pixels to create a new 3D array. (4) Extract the regions surrounding the values of 1 and -1 from the 3D array generated in step 3, expand the resulting area by 1 pixel in the cross-section, and designate the pixels within this region as pseudo-imaging pixels. (5) Recalculate the pixel values of the artifactual region by determining the average of the 26 neighboring non-artifactual region pixels for each target pixel, thereby replacing the original artifactual region pixel values. (6) Replace the corresponding pixel values in the original phase map from step 1 with the pixel values obtained in step 5, resulting in the generation of the resultant map. The Python-based artifact removal program can be found in the Supplementary Material named “Python-Based Artifact Removal Program.zip”.
Following the artifact removal process, the phase maps were exported to NII format using a batch program and subsequently transmitted to AS software, which incorporates C++ programming along with Qt and VTK libraries, for the calculation of ITSS ratios. The analysis codes are available in a GitHub repository (https://github.com/DlutMedimgGroup/AnatomySketch-Software).
Two physicians, each with 6 and 11 years of experience in uterine MRI imaging diagnosis, utilized a double-blind method to identify tumor lesions. Referring to T2WI, DWI and apparent diffusion coefficient maps, the ROIs were delineated using an interactive semi-automatic method from the first to the last layer of the lesions on the phase maps. The edges of the lesions were defined based on DCE-MRI, with the ROIs outlined within 0.5 cm of the tumor edge to minimize volume effects. Therefore, lesions with a narrow range were excluded to ensure the accuracy of lesion delineation and the reliability of subsequent quantitative analysis. Upon completion of the delineations, three-dimensional volumes of interest were generated using the AS software. Subsequently, a plug-in within the AS software was utilized to determine the ITSS regions in the volumes of interest by establishing a threshold value of 2020. The ITSS ratios were then automatically calculated, including the ratio of the ITSS area in the maximum ITSS layer to the tumor area at that layer (intratumoral susceptibility signal sectional, ITSSs) and the ratio of tumor ITSS volume to the whole tumor volume (intratumoral susceptibility signal volume, ITSSv), as depicted in Figure 2.
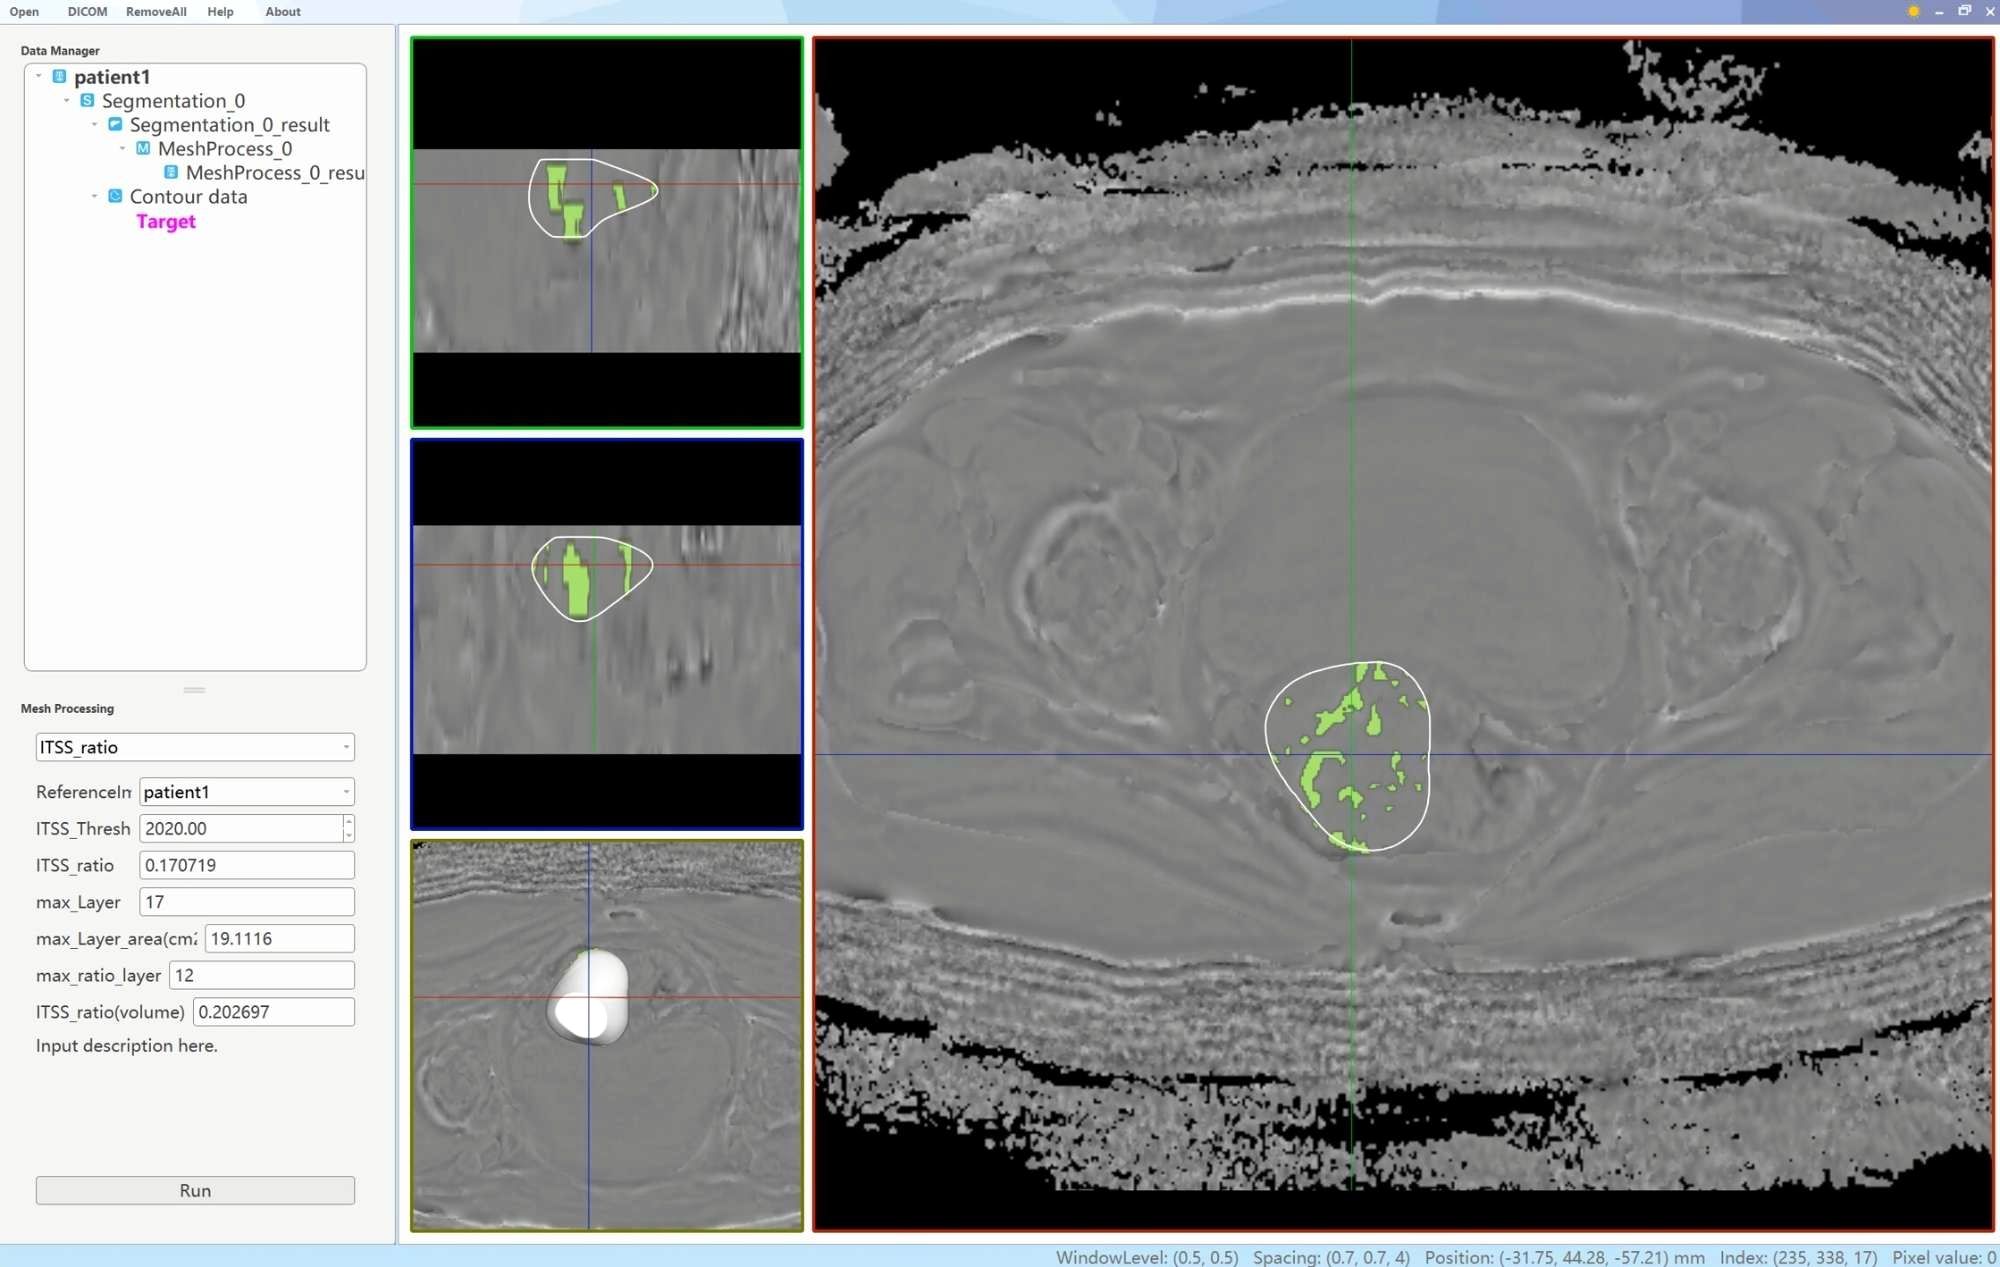
Figure 2. A schematic diagram of the AS software was utilized to calculate the tumor ITSS ratio. By employing the interpolation and labeling tools within the AS software, the ITSS ratio within the ROI was determined. The ITSS ratio is operationally defined as the ratio of pixels exhibiting low signal intensity within the ROI to the total number of pixels present within the ROI.
Measurement of R2* values of the ESWAN sequence
The ESWAN imaging post-processing was performed using the GE AW4.6 workstation equipped with Functool software to generate R2* maps. Without prior knowledge of the pathological results, two observers delineated irregularly shaped ROIs at the largest extent of the tumor parenchymal region, referencing T2WI, DWI, apparent diffusion coefficient maps and DCE-MRI. This process ensured that the ROIs encompassed the solid tumor area as comprehensively as possible while avoiding regions of necrosis, hemorrhage, and cystic degeneration. Measurements were taken three times, one month apart, to calculate an average. As illustrated in Figures 3 and 4.
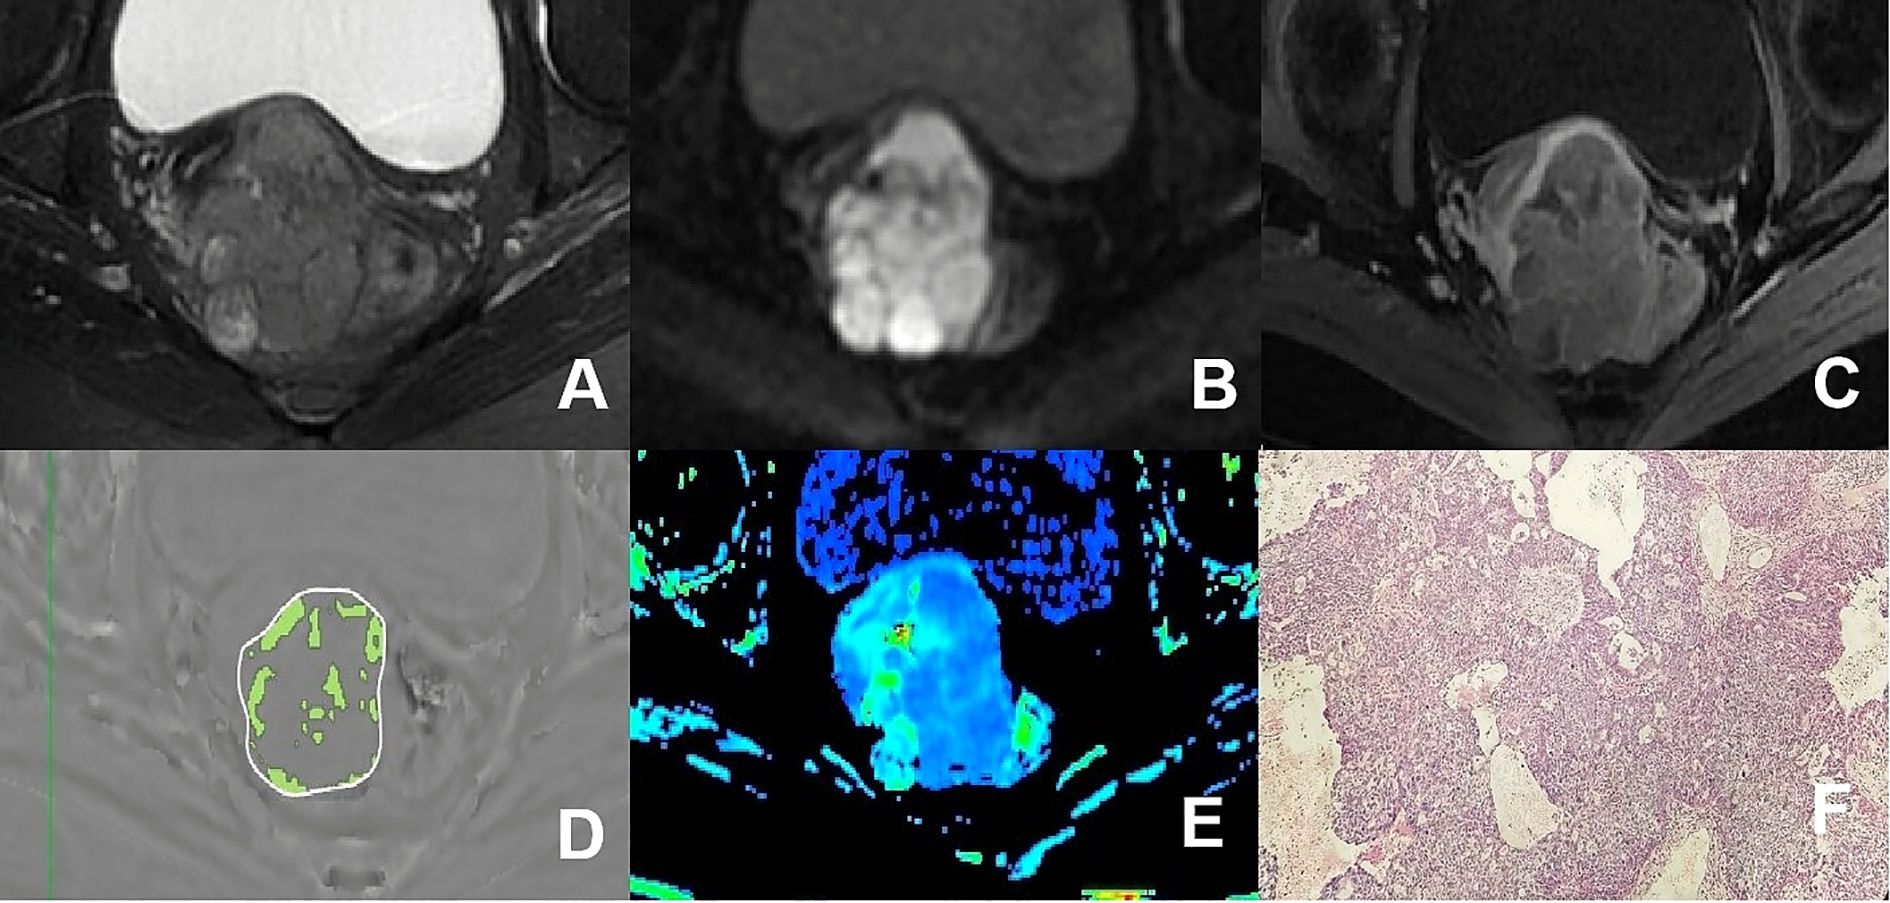
Figure 3. (A–F) presented a 75-year-old patient diagnosed with poorly differentiated CA, classified as FIGO stage IIB. (A) Axial T2WI image: the mass demonstrated mixed iso-hyperintense signal; (B) Axial DWI image: the mass with restricted diffusion showed significant hyperintense signal; (C) Axial enhanced image of the delayed period: the mass revealed uneven hypointense signal and annular enhancement; (D) The schematic diagram illustrated the ITSS intensity measured using AS software, where the green area on the diagram signified the ITSS within the tumor, with an ITSSs of 0.204 and ITSSv of 0.229; (E) R2* map of the ESWAN sequence, where the mean value of R2* for this patient was 23.184Hz. (F) Pathological image confirmed CA.
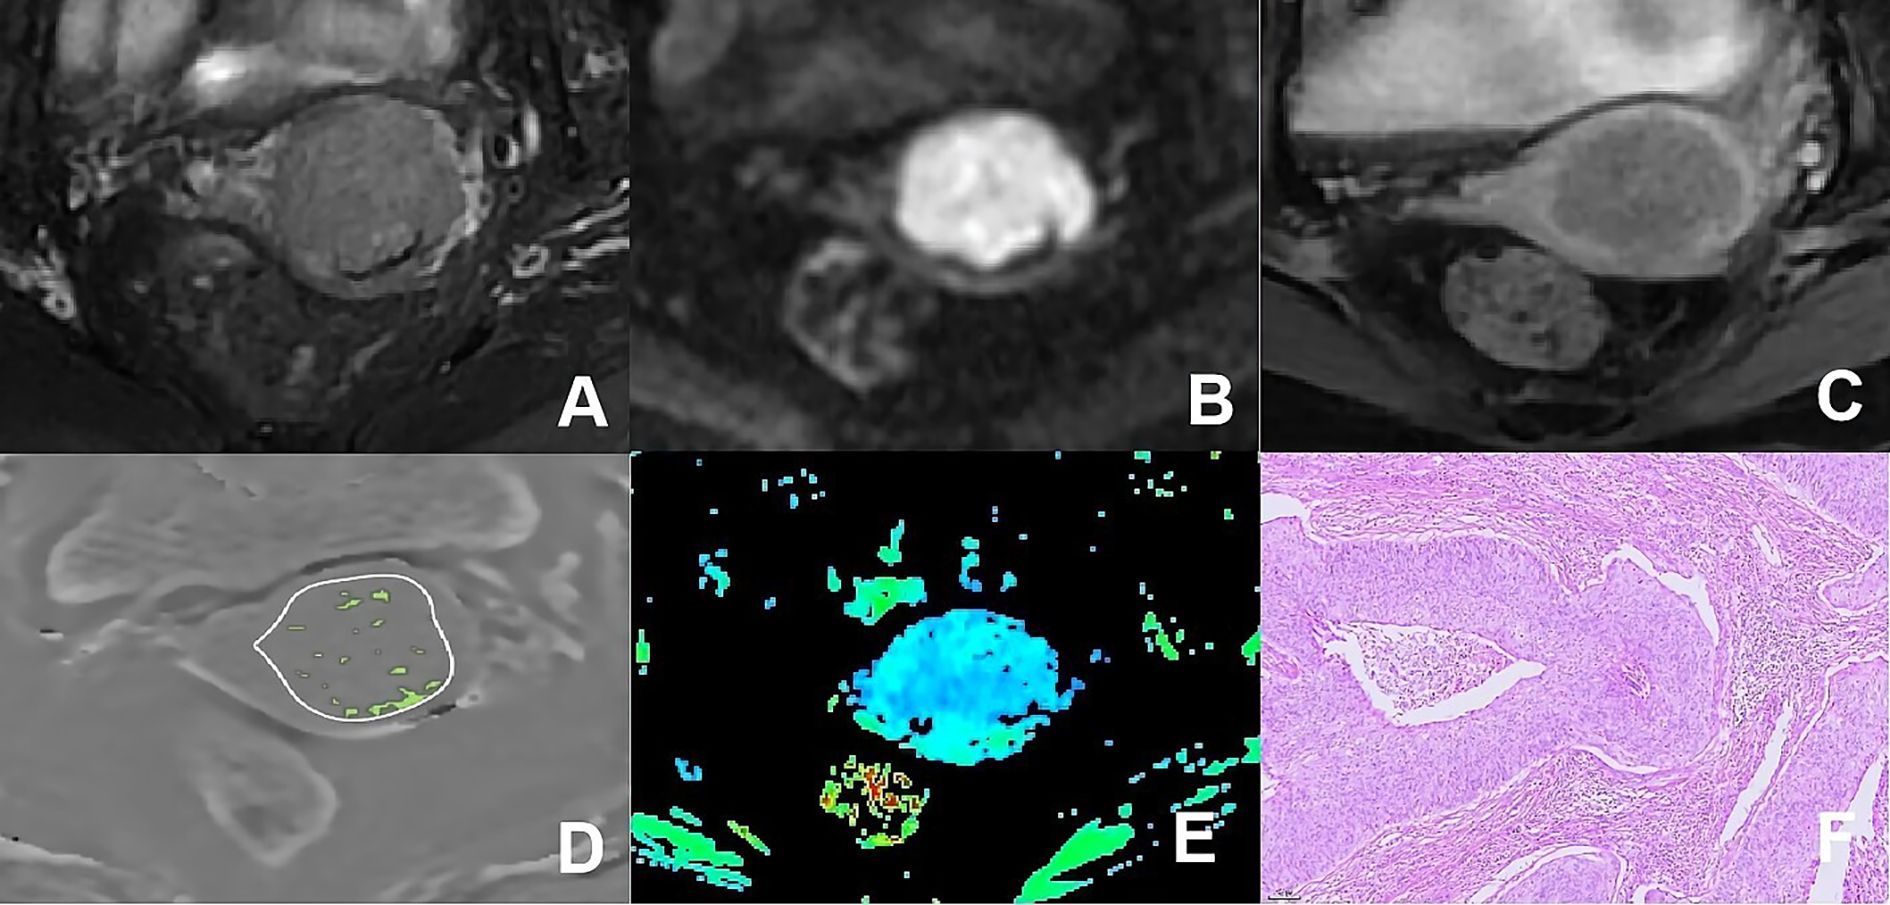
Figure 4. (A–F) presented a 66-year-old patient diagnosed with poorly differentiated CSC, classified as FIGO stage IIA. (A) Axial T2WI image: the mass presented isointense signal; (B) Axial DWI image: the mass with restricted diffusion exhibited significant hyperintense signal; (C) Axial enhanced image of the delayed period: the mass displayed low level of enhancement; (D) The schematic diagram illustrated the ITSS intensity measured using AS software, where the green area on the diagram signified the ITSS within the tumor, with an ITSSs of 0.091 and ITSSv of 0.077; (E) R2* map of the ESWAN sequence, where the mean value of R2* for this patient was 10.440Hz. (F) Pathological image confirmed CSC.
Statistical analysis
Statistical analysis was performed using SPSS 21.0 software (Chicago, IL, USA) and MedCalc 15.2.2 software (Med Calc Software, Ostend, Belgium). Intra-class correlation coefficients were utilized to evaluate the agreement between ITSSs, ITSSv, and R2* values measured by two observers. The Shapiro-Wilk test was employed to assess the normality of the measurements, and either the two independent samples t-test or the Mann-Whitney U-test was employed to compare quantitative parameters between CA and CSC groups. The clinicopathological data of the two groups were presented as frequencies or percentages, with group comparisons conducted using the chi-square test or Fisher’s exact test. Binary logistic regression was employed to identify independent predictors that differentiate CA from CSC. Receiver operating characteristic curve analysis was applied to assess the statistically significant parameters and their combinations for distinguishing between CA and CSC. The Delong test was utilized to compare the differences in the AUC.
Results
Comparison of the general clinicopathological data between the two groups
The AFP and PNI levels in the CA group were significantly lower than those in the CSC group (P< 0.05). Other general clinicopathological features, including age, irregular vaginal bleeding, tumor size, FIGO stage, carcinoembryonic antigen, carbohydrate antigen 12-5, carbohydrate antigen 19-9, epididymal protein 4, neutrophil-lymphocyte ratio, monocyte-lymphocyte ratio, platelet-lymphocyte ratio, systematic immune inflammation index, pan-immune inflammation value, aspartate aminotransferase to lymphocyte ratio index, aspartate aminotransferase to platelet ratio index, degree of differentiation, lymphatic vascular space invasion, perineural invasion and lymph node metastasis, were analyzed; however, the differences were not statistically significant (P>0.05). As shown in Table 2.
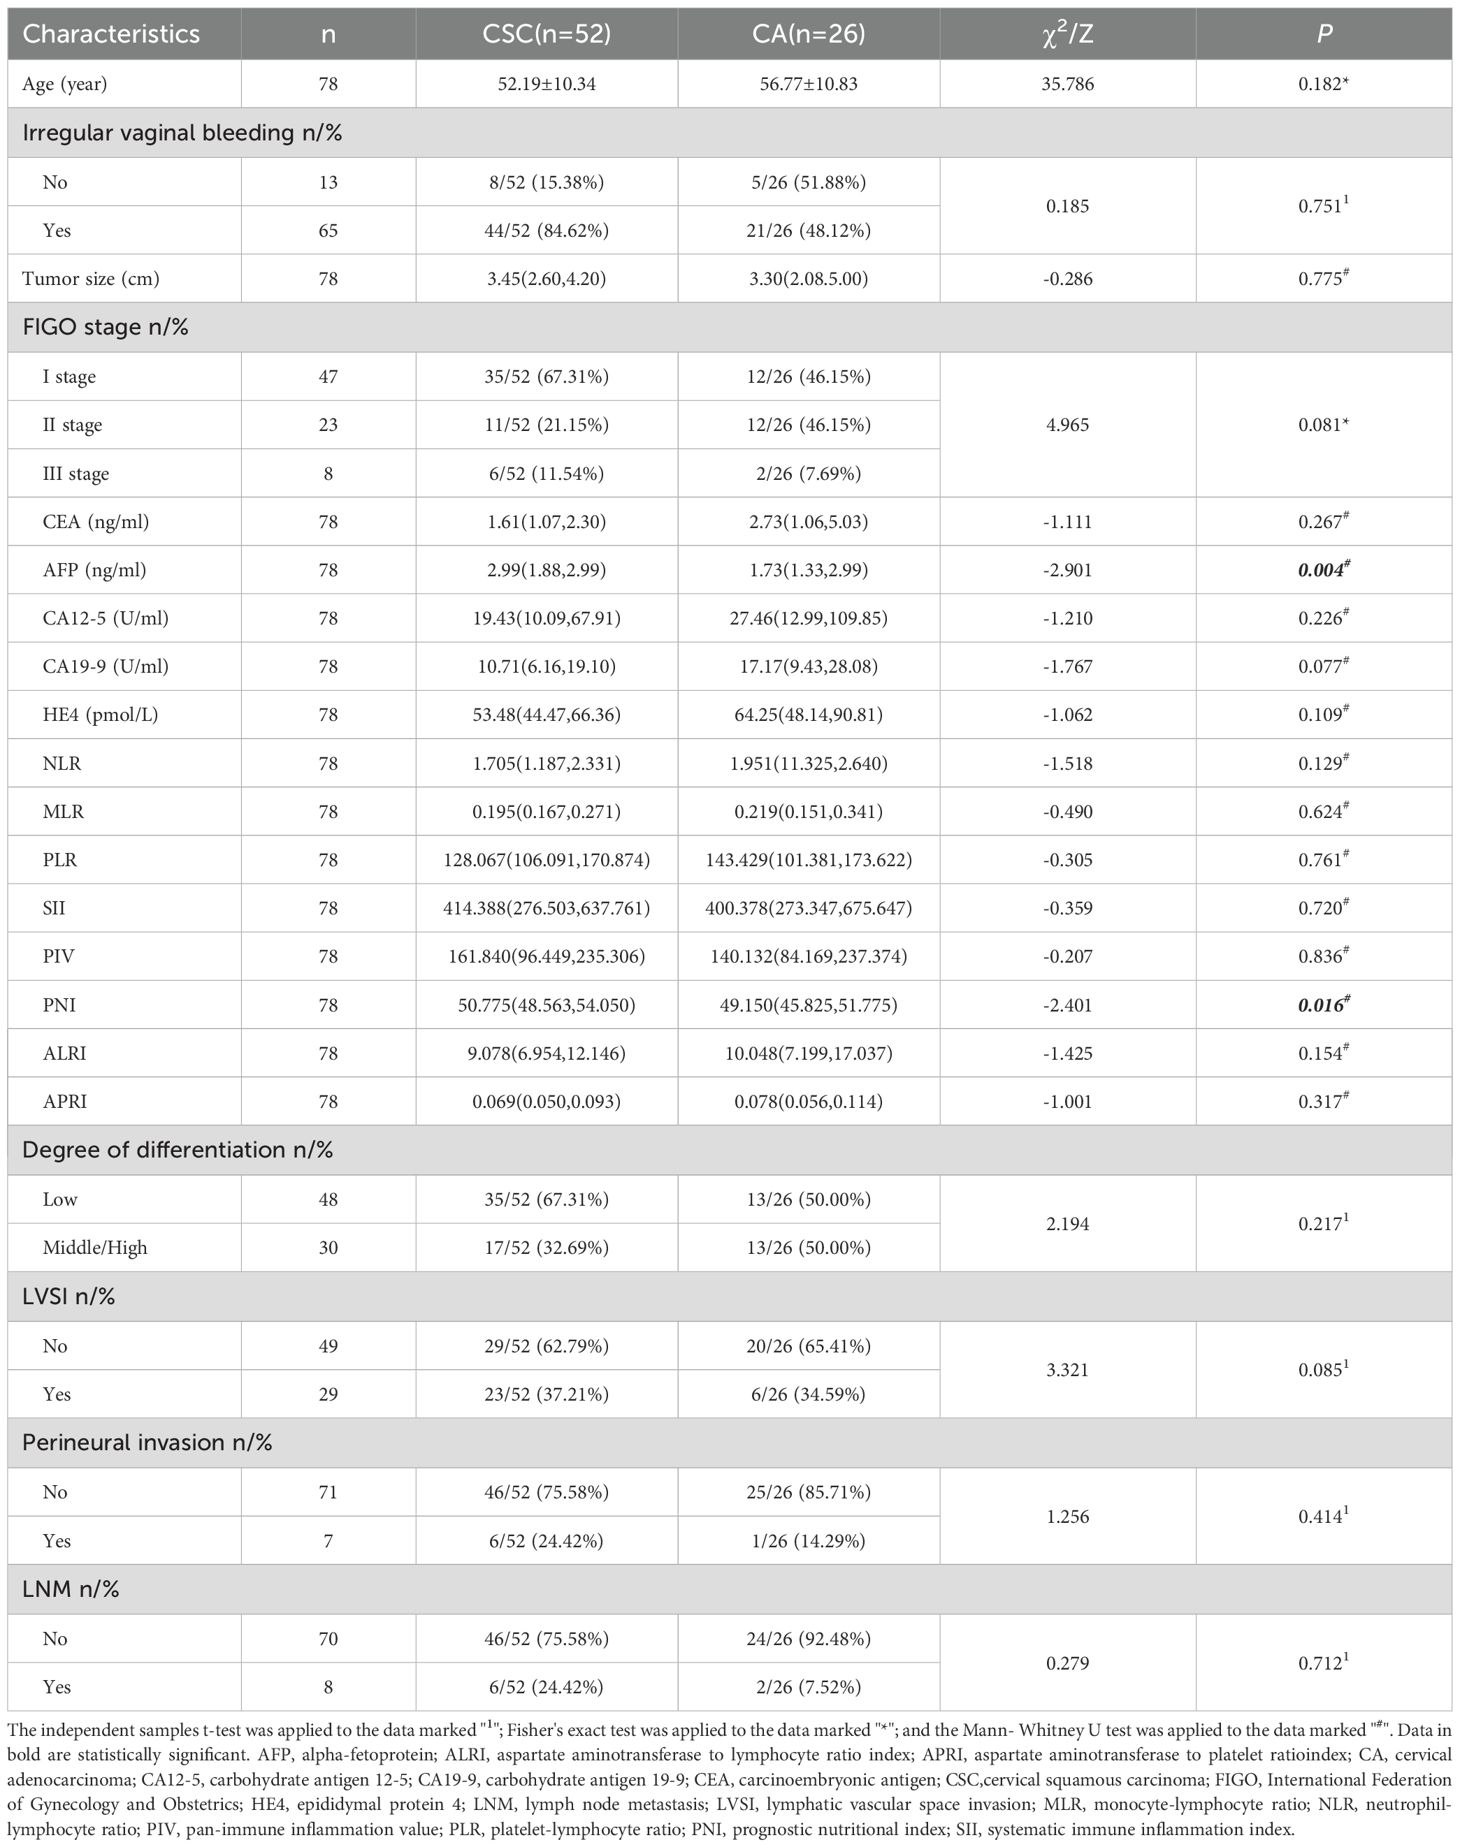
Table 2. Comparison of general clinical data of two groups of patients.
Consistency analysis of the measurements between the two observers
The inter-rater reliability of the ITSSs, ITSSv and R2* values, as assessed by the two observers, was deemed satisfactory, with all intra-class correlation coefficients values exceeding 0.75, as indicated in Table 3. The average of the measurements obtained from the two observers was utilized for subsequent analysis.
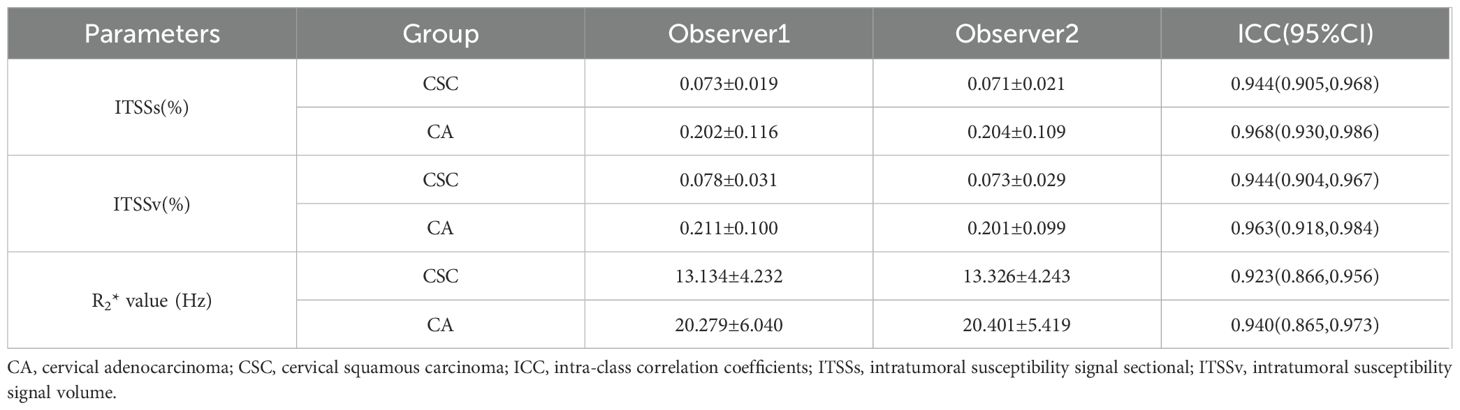
Table 3. Comparison of consistency of measurement data between two observers.
Comparison of the ITSSs, ITSSv and R2* values between the two groups
The ITSSs, ITSSv and R2* values of the CA group were significantly higher than those of the CSC group (P< 0.05), as shown in Table 4 and Figure 5.
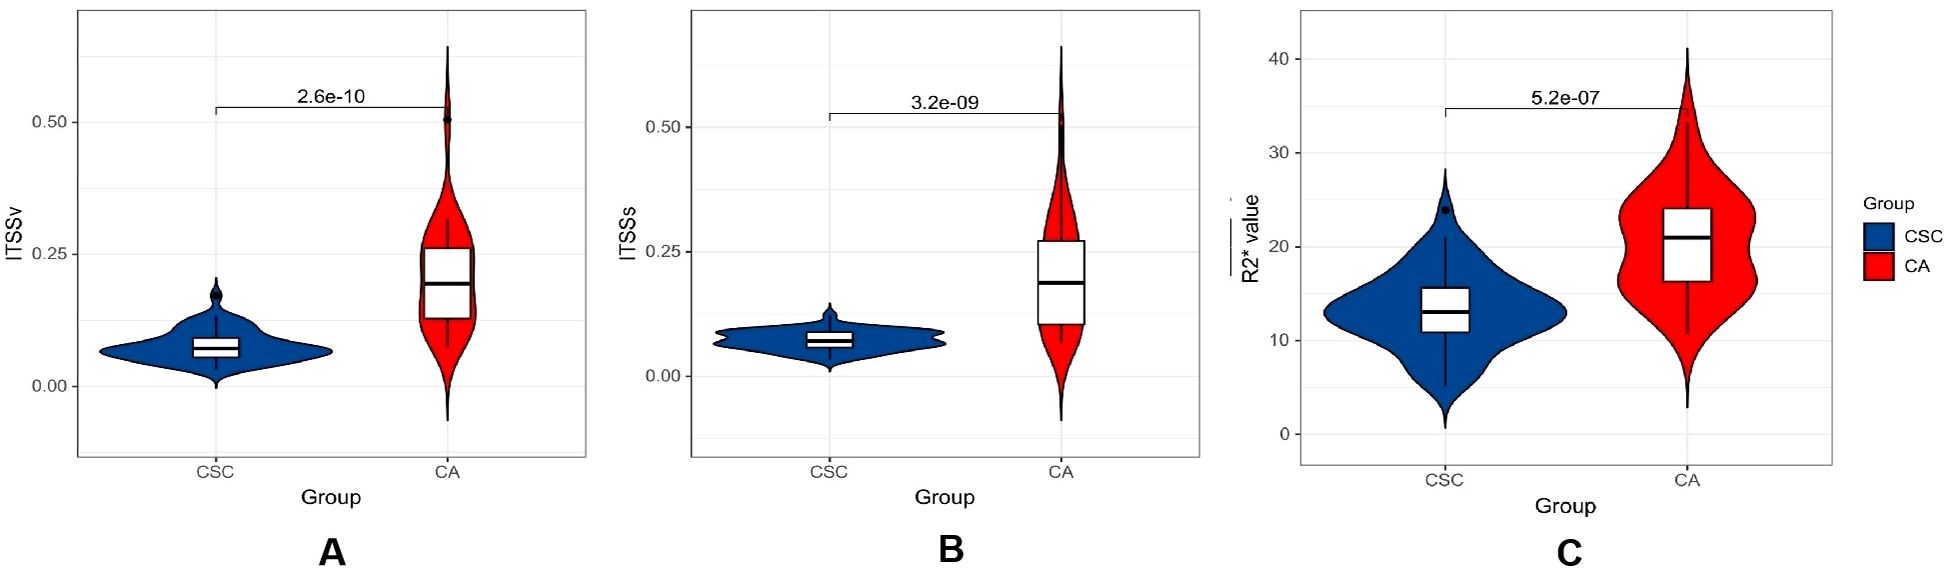
Figure 5. Violin plot displaying the distribution of parameters within CA and CSC group. (A–C) differential comparison of ITSSv, ITSSs and R2* value between two groups of patients.
Table 4. Comparison of the differences between the parameters in the two groups of patients.
Independent predictors for differentiating between CA and CSC
The comprehensive clinicopathological data and various quantitative MRI parameters with P values below 0.1 between the two groups were incorporated into the subsequent analysis. Following univariate and multivariate logistic regression analyses, the ITSSv and R2* value emerged as independent predictors for differentiating between CA and CSC, as illustrated in Table 5.
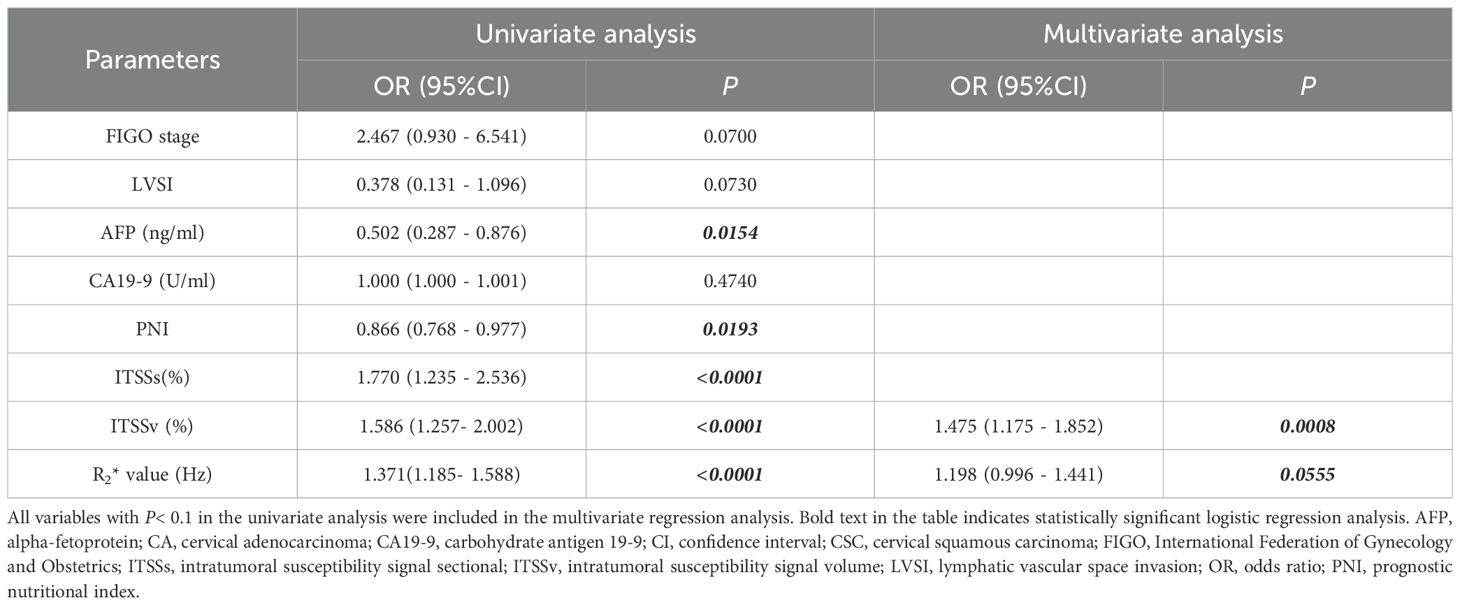
Table 5. Univariate and multivariate analyses to distinguish CA and CSC.
Efficiency of ITSSv, R2* value and the combined model for differentiating between CA and CSC
The AUC for ITSSv, R2* value, and the combined model for differentiating between CA and CSC were 0.942, 0.851, and 0.950, respectively, as depicted in Figure 6. The Delong test indicated that the diagnostic efficacy of the combined model was superior to that of the R2* value (P< 0.05); however, there was no significant difference when compared to ITSSv (P>0.05), as shown in Table 6.
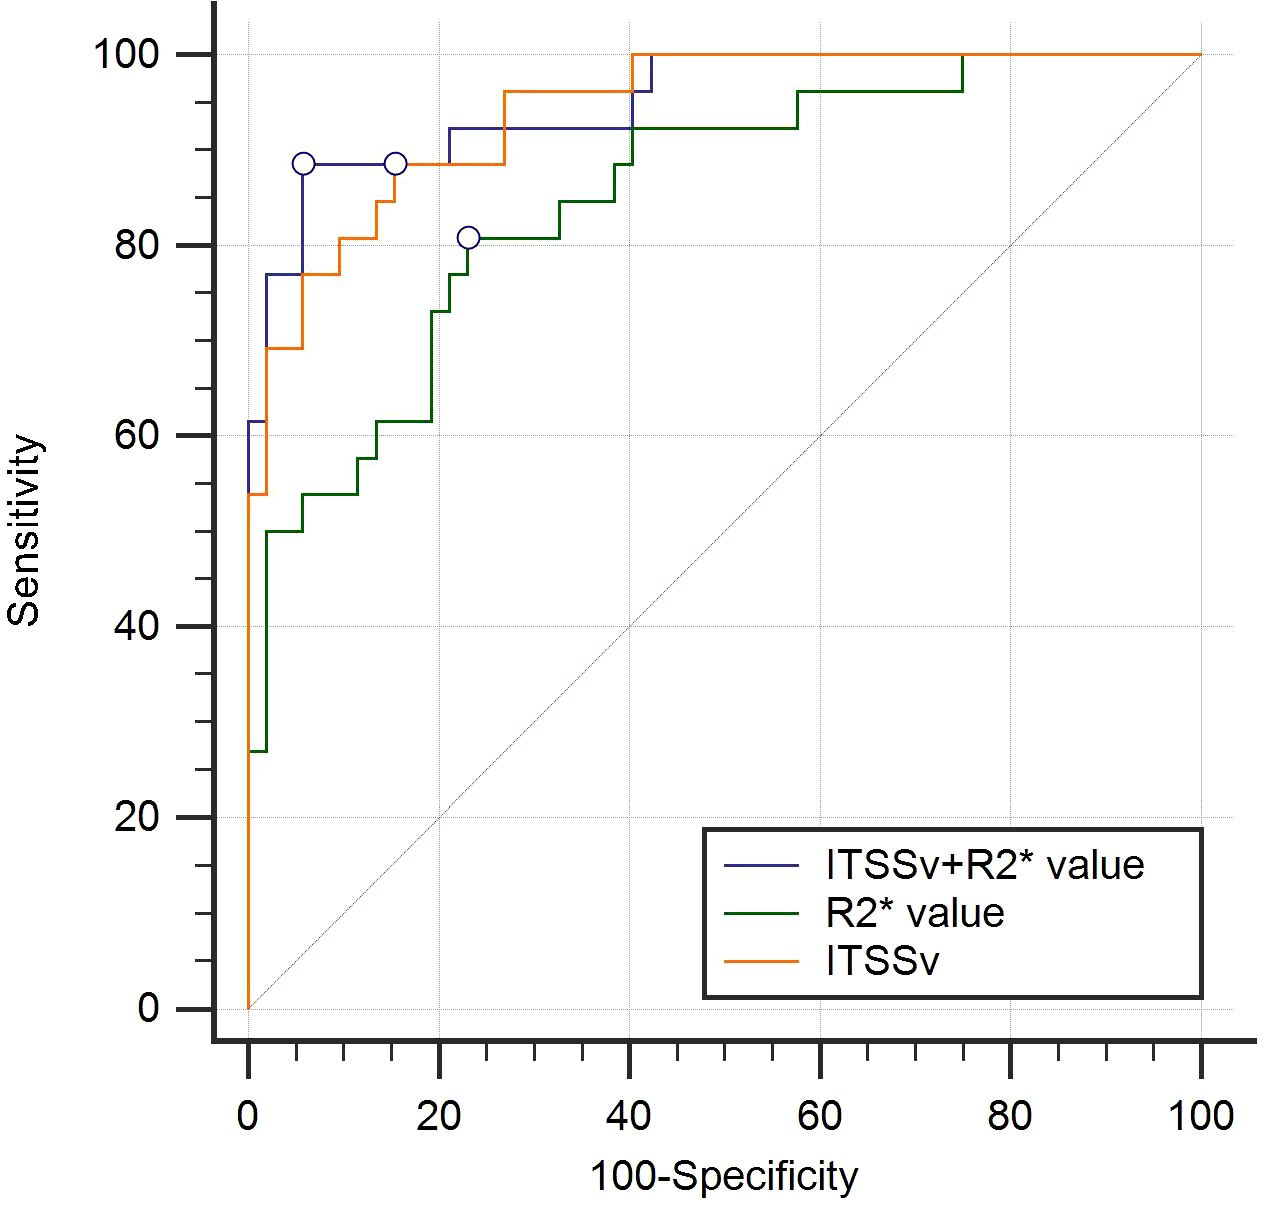
Figure 6. Receiver operating characteristic curves analyzing the efficacy of ITSSv+R2*value, R2* value and ITSSv to distinguish CA and CSC with AUC values of 0.950, 0.851 and 0.942, respectively.
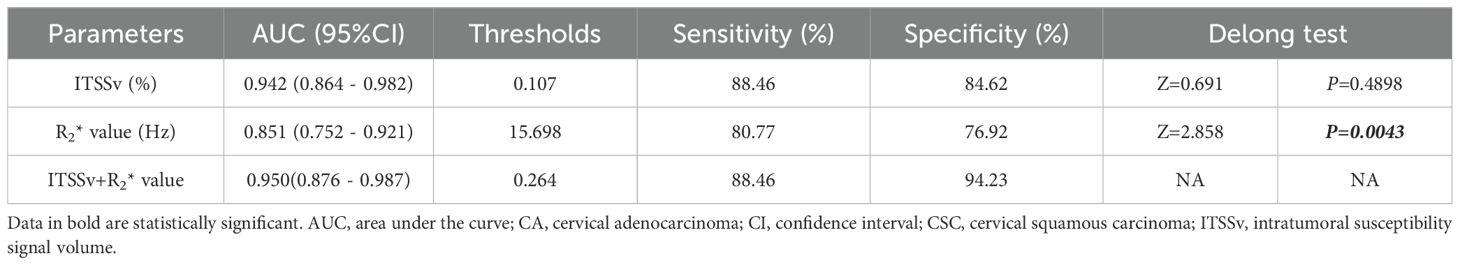
Table 6. The efficiency of ITSSv, R2* value and the combined parameter to distinguish CA and CSC.
Pairwise comparisons of the single parameters ITSSs, ITSSv, R2* value, and the combined models were compared pairwise. The Delong test revealed that the AUCs for ITSSv compared to R2* value, ITSSs + R2* value compared to R2* value, ITSSv + R2* value compared to R2* value, and ITSSs + ITSSv + R2* value compared to R2* value between the two groups were statistically significant (P< 0.05), as presented in Table 7.
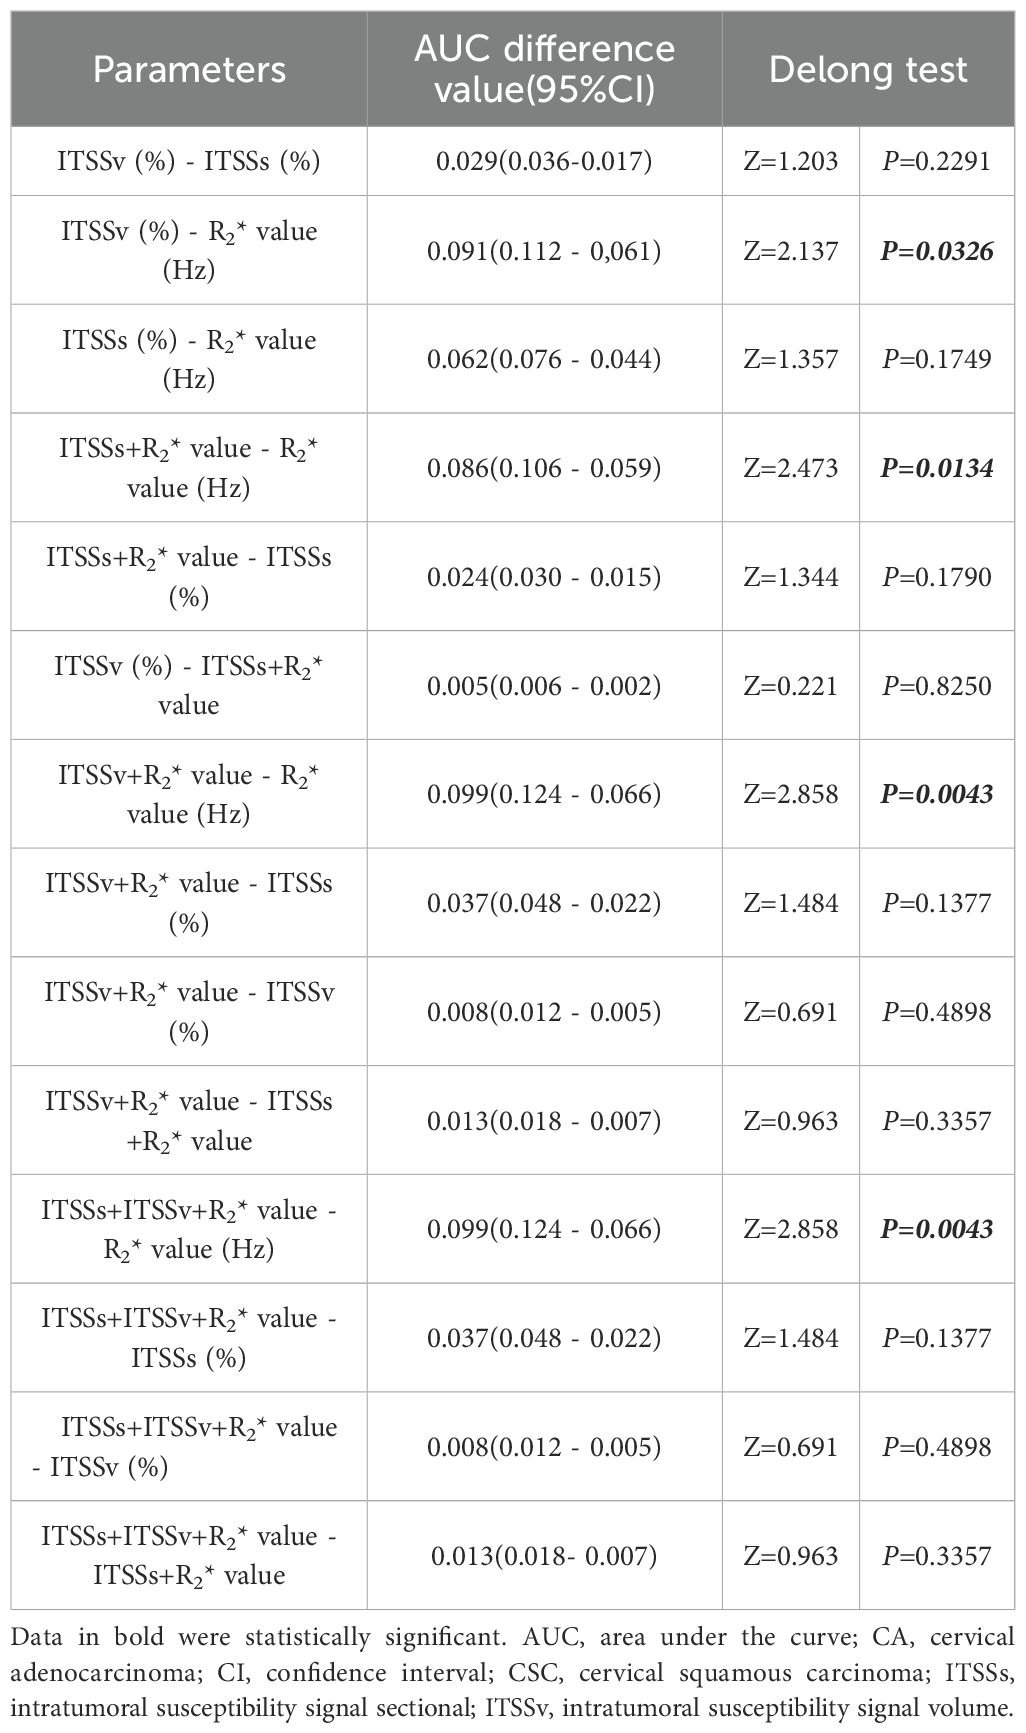
Table 7. Comparison of multiple quantitative parameters and combined parameters to distinguish CA and CSC.
Discussion
The primary discovery of this study was the efficacy of automated ITSS intensity extraction in conjunction with R2* values for differentiating between CA and CSC. Our research revealed that the ITSSs, ITSSv and R2* values in the CA group were significantly higher than those in the CSC group. Furthermore, after controlling for confounding variables, ITSSv and R2* values emerged as independent factors. The combined model demonstrated high diagnostic efficacy in distinguishing between CA and CSC, revealing significant differences when compared to R2* values alone.
In this study, the clinical manifestations of patients with CA and CSC were found to be similar, primarily, presenting as irregular vaginal bleeding. There was no statistically significant difference between the two groups, which complicates differentiation. Most laboratory tests indicated no obvious discrepancies between CA and CSC; however, AFP and PNI exhibited significant differences. AFP, a glycoprotein belonging to the serum albumin gene family, is commonly utilized as a biomarker for liver cancer. Nevertheless, He et al. (21) observed elevated serum AFP levels in patients with various cancers and non-cancerous diseases, including CC. The results of this study demonstrated that AFP levels in the CA group were significantly lower than those in the CSC group, suggesting its potential clinical utility, although the underlying molecular mechanisms warrant further investigation. PNI, derived from serum albumin levels and peripheral blood lymphocyte counts, serves as an important indicator of both nutritional status and systemic inflammation. Serum albumin, an acute-phase protein, is linked to systemic inflammation, while lymphocytes are essential components of cell-mediated immunity. Both nutrition and inflammation significantly influence tumorigenesis, cancer progression, and metastasis by affecting the tumor microenvironment (22). Therefore, PNI may serve as a powerful prognostic indicator for patients with various types of cancer, as confirmed by numerous studies (23–27). Niu et al. (28) conducted a meta-analysis that revealed a significant association between decreased PNI and poorer overall survival and progression-free survival, as well as an increased likelihood of tumor metastasis and higher tumor burden. The results of this study indicated that PNI values in the CA group were notably lower than those in the CSC group, suggesting that CA represents a more advanced tumor with a worse prognosis compared to CSC. However, the diagnostic efficacy of AFP and PNI was found to be limited, with AUC of 0.698 and 0.667, respectively. Consequently, this study aims to explore the value of imaging indicators in the differential diagnosis of CA and CSC.
Currently, the predominant assessments of ITSS primarily rely on semi-quantitative methods (17, 29–36). Bhattacharjee et al. (37) attempted to conduct a quantitative analysis of ITSS in brain glioma. However, these approaches are constrained by several limitations. Firstly, manual counts in previous studies have not always been consistent, likely due to the absence of an established objective standard for ITSS quantification. This inconsistency is further exacerbated by the challenges associated with manually calculating ITSS, which is susceptible to subjective interpretation by the evaluator, resulting in inadequate reproducibility. Secondly, the focus on the head as the study subject, which experiences minimal interference from respiratory and motion artifacts, highlights the need for further investigation into the applicability and reliability of these methods for abdominal organs. Thirdly, the failure to address phase diagram artifacts may result in inaccuracies in the findings. To overcome the limitations of existing methodologies, this study utilized the ESWAN sequence for pre-processing phase map artifacts, specifically targeting challenges related to respiratory and motion-induced artifacts in abdominal organs. Furthermore, an automated approach was implemented to extract the ITSS ratios for patients with CC, calculated based on the ratio of low-signal region pixels within the tumor to the total number of pixels in both the maximum ITSS layer (ITSSs) and the whole tumor volume (ITSSv). This method is characterized by its simplicity, reproducibility, and reduced subjectivity, rendering it highly suitable for clinical applications.
In this study, we demonstrated the potential utility of ITSS in differentiating between CA and CSC. ITSS provides a comprehensive depiction of neovascularization and microhemorrhage within tumors, serving as a noninvasive and intuitive imaging marker for vascular proliferation. Our findings indicated that ITSSs and ITSSv were significantly higher in the CA group compared to the CSC group. This observation can be attributed to the more malignant and aggressive nature of CA, which expresses markedly higher levels of vascular endothelial growth factor-A than CSC (38). This over expression leads to neovascularization characterized by thin walls, high vascular permeability, and frequent microhemorrhages, thereby contributing to the elevated ITSSs and ITSSv. Furthermore, ITSS ratios offer the advantage of automated quantification, simplifying implementation and minimizing subjective bias when compared to other quantitative parameters, such as R2*, derived from ESWAN.
ESWAN is a type of magnetic-sensitive sequence, specifically a multi-echo T2*-weighted 3D gradient echo sequence, that reflects the magnetic-sensitive characteristics of tissues (39). The R2* value represents the apparent transverse relaxation rate, which is obtained through gradient echo imaging at different time intervals. The presence of paramagnetic substances, such as iron compounds, can induce inhomogeneity in the magnetic field, resulting in accelerated proton phase dispersion. This phenomenon leads to a more rapid attenuation of the transverse magnetization vector and an increase in the R2* value. Consequently, the R2* value is directly related to the concentration of deoxyhemoglobin containing iron ions. A higher R2* value, indicative of increased deoxyhemoglobin, suggests lower oxygen content, thereby allowing the R2* value to quantitatively evaluate changes in local tissue oxygen levels (40). Typically, paramagnetic substances, including iron and hemosiderin, influence the R2* value. Notably, the liver, which is the primary organ in the body that stores iron, exhibits characteristics that differ from those of other tissues or organs; however, to date, no evidence of iron deposition has been found in normal cervical tissue or cervical lesions (41, 42). Therefore, we conclude that R2* has promising applications in the detection of hypoxia in cervical cancer (43).
Currently, the R2* value has been preliminarily applied in the context of diseases affecting the female pelvic system (15, 44). However, its application in CC is limited and warrants further exploration. Li et al. (45) investigated the R2* value as a predictor of prognosis in advanced CSC treated with concurrent chemoradiotherapy. Additionally, research by Li-Ou Z et al. (43) confirmed a moderate correlation between activated hypoxia inducible factor-1α expression and the R2* value in CC. Our study found that R2* values were significantly higher in the CA group compared to the CSC group. CA is characterized by relatively aggressive tumor behavior (46), with tumor cells exhibiting rapid proliferation and metabolism. This results in an increased uptake of nutrients, including sugars and proteins, along with heightened oxygen consumption (47). Hypoxia prompts tumor cells to release various angiogenic factors, stimulating the formation of immature neovascularization, which further reduces oxygen saturation. Consequently, the increase in deoxygenated hemoglobin leads to elevated R2* values, resulting in higher R2* values in the CA group compared to the CSC group.
In this study, ITSSv and R2* values were identified as independent factors for distinguishing between CA and CSC. The combined model utilizing ITSSv and R2* values demonstrated the highest diagnostic efficiency, achieving an AUC of 0.950; notably, the inclusion or exclusion of ITSSs did not influence the results. The combined model outperformed the R2* value, but did not surpass ITSSv, indicating that ITSSv carries greater significance within the model compared to both ITSSs and R2* values. This can be attributed to the following reasons: (1) The comprehensive three-dimensional evaluation provided by ITSSv offers a holistic view of the lesions, particularly for irregular and complex formations. In contrast, ITSSs only capture the maximum ITSS layer of the lesion, which fails to convey complete information. (2) ITSSv is derived from the automatic extraction of the AS software and is calculated through volume delineation, streamlining the process and effectively minimizing variability between observers. Conversely, the R2* value can be influenced by subjective interpretations among observers regarding the solid tumor portions and lesion boundaries, potentially affecting the accuracy of the results. Furthermore, utilizing a ratio to characterize ITSS intensity provides a more accurate reflection of the relationship between the ITSS components and the entire tumor. This method also enables more effective comparisons between lesions, which is preferable to the ITSS volume value employed by Bhattacharjee et al. (36).
The limitations of this study are as follows: (1) The limited number of cases of CA restricted the ability to refine the pathological classification of CA, including subtypes such as mucinous adenocarcinoma and gastric-type adenocarcinoma. (2) This study was conducted at a single center and involved a relatively small sample size. Future research will aim to increase the sample size and conduct a multi-center study to facilitate a more comprehensive analysis.
Conclusion
In conclusion, the combination of ITSSv and R2* values derived from ESWAN has the potential to significantly enhance the accuracy of differentiating between CA and CSC. By integrating the automated extraction process of ITSS with AS software, both two-dimensional (ITSSs) and three-dimensional (ITSSv) parameters can be obtained concurrently. ITSSv serves as an independent risk predictor, demonstrating notable advantages over ITSSs and exhibiting strong diagnostic efficacy comparable to the combined use of ITSSv and R2* values. This approach facilitates a comprehensive assessment of lesions and yields more precise information. This advancement is poised to supplant traditional R2* value measurements, presenting promising prospects for future clinical applications and widespread adoption.
Data availability statement
The data generated and analyzed during this study cannot be made publicly available due to regulations at the institutional review board concerning the potential of disclosure of an individual’s personal health information. Please contact the corresponding author regarding access to anonymized data.
Ethics statement
The studies involving human participants were reviewed and approved by The First Affiliated Hospital of Dalian Medical University (PJ-KS-KY-2021-180, August 18, 2021). Written informed consent for participation was not required for this study in accordance with the national legislation and the institutional requirements.
Author contributions
AC: Conceptualization, Data curation, Formal analysis, Investigation, Methodology, Writing – original draft. XM: Conceptualization, Data curation, Formal analysis, Investigation, Methodology, Writing – original draft. CM: Investigation, Software, Writing – original draft. ST: Methodology, Supervision, Writing – original draft. QS: Resources, Supervision, Writing – review & editing. AL: Conceptualization, Methodology, Resources, Writing – review & editing. MZ: Software, Writing – review & editing. HW: Software, Writing – review & editing.
Funding
The author(s) declare that no financial support was received for the research, and/or publication of this article.
Conflict of interest
The authors declare that the research was conducted in the absence of any commercial or financial relationships that could be construed as a potential conflict of interest.
Generative AI statement
The author(s) declare that no Generative AI was used in the creation of this manuscript.
Any alternative text (alt text) provided alongside figures in this article has been generated by Frontiers with the support of artificial intelligence and reasonable efforts have been made to ensure accuracy, including review by the authors wherever possible. If you identify any issues, please contact us.
Publisher’s note
All claims expressed in this article are solely those of the authors and do not necessarily represent those of their affiliated organizations, or those of the publisher, the editors and the reviewers. Any product that may be evaluated in this article, or claim that may be made by its manufacturer, is not guaranteed or endorsed by the publisher.
Supplementary material
The Supplementary Material for this article can be found online at: https://www.frontiersin.org/articles/10.3389/fonc.2025.1578525/full#supplementary-material
Abbreviations
CC, cervical cancer; CSC, cervical squamous carcinoma; CA, cervical adenocarcinoma; FIGO, the International Federation of Gynecology and Obstetrics; ESWAN, enhanced T2* weighted angiography; R2*, transverse relaxation rate (R2*); ITSS, intertumoral susceptibility signal; ITSSs, intratumoral susceptibility signal sectional; ITSSv, intratumoral susceptibility signal volume; MRI, magnetic resonance imaging; T1WI, T1-weighted imaging; T2WI, T2-weighted imaging; DWI, diffusion-weighted imaging; ROI, region of interest; AFP, alpha-fetoprotein; PNI, prognostic nutritional index; AS, Anatomy Sketch software; DCE-MRI, dynamic contrast-enhanced MRI; AUC, area under the curve.
References
1. Siegel RL, Giaquinto AN, and Jemal A. Cancer statistics, 2024. CA Cancer J Clin. (2024) 74:12–49. doi: 10.3322/caac.21820
2. Bray F, Laversanne M, Sung H, Ferlay J, Siegel RL, Soerjomataram I, et al. Global cancer statistics 2022: GLOBOCAN estimates of incidence and mortality worldwide for 36 cancers in 185 countries. CA Cancer J Clin. (2024) 74:229–63. doi: 10.3322/caac.21834
3. Han B, Zheng R, Zeng H, Wang S, Sun K, Chen R, et al. Cancer incidence and mortality in China, 2022. J Natl Cancer Cent. (2024) 4:47–53. doi: 10.1016/j.jncc.2024.01.006
4. Smith AJB, Beavis AL, Rositch AF, and Levinson K. Disparities in diagnosis and treatment of cervical adenocarcinoma compared with squamous cell carcinoma: an analysis of the national cancer database, 2004-2017. J Low Genit Tract Dis. (2023) 27:29–34. doi: 10.1097/LGT.0000000000000702
5. Hanna TP, Delaney GP, and Barton MB. The population benefit of radiotherapy for gynaecological cancer: Local control and survival estimates. Radiother Oncol. (2016) 120:370–7. doi: 10.1016/j.radonc.2016.04.008
6. Wang W, Jiao Y, Zhang L, Fu C, Zhu X, Wang Q, et al. Multiparametric MRI-based radiomics analysis: differentiation of subtypes of cervical cancer in the early stage. Acta Radiol. (2022) 63:847–56. doi: 10.1177/02841851211014188
7. Wu C, Ma C, Yuan J, and Zhou P. Exploration of potential therapeutic and prognostic value of CXC chemokines in cervical squamous cell carcinoma and endocervical adenocarcinoma based on bioinformatics analysis. Math Biosci Eng. (2021) 18:8201–22. doi: 10.3934/mbe.2021407
8. Zhang H, Cheng C, Gao R, Yan Z, Zhu Z, Yang B, et al. Rapid identification of cervical adenocarcinoma and cervical squamous cell carcinoma tissue based on Raman spectroscopy combined with multiple machine learning algorithms. Photodiagnosis Photodyn Ther. (2021) 33:102104. doi: 10.1016/j.pdpdt.2020.102104
9. Meng N, Wang J, Sun J, Liu W, Wang X, Yan M, et al. Using amide proton transfer to identify cervical squamous carcinoma/adenocarcinoma and evaluate its differentiation grade. Magn Reson Imaging. (2019) 61:9–15. doi: 10.1016/j.mri.2019.05.005
10. Kalliala I, Anttila A, Nieminen P, Halttunen M, and Dyba T. Pregnancy incidence and outcome before and after cervical intraepithelial neoplasia: a retrospective cohort study. Cancer Med. (2014) 3:1512–6. doi: 10.1002/cam4.300
11. Moukarzel LA, Angarita AM, VandenBussche C, Rositch A, Thompson CB, Fader AN, et al. Preinvasive and invasive cervical adenocarcinoma: preceding low-risk or negative pap result increases time to diagnosis. J Low Genit Tract Dis. (2017) 21:91–6. doi: 10.1097/LGT.0000000000000286
12. Zheng C, Qing S, Wang J, Lü G, Li H, Lü X, et al. Diagnosis of cervical squamous cell carcinoma and cervical adenocarcinoma based on Raman spectroscopy and support vector machine. Photodiagnosis Photodyn Ther. (2019) 27:156–61. doi: 10.1016/j.pdpdt.2019.05.029
13. Bhatla N, Aoki D, Sharma DN, and Sankaranarayanan R. Cancer of the cervix uteri. Int J Gynaecol Obstet. (2018) 143:22–36. doi: 10.1002/ijgo.12611
14. Hori M, Mori H, Aoki S, Abe O, Masumoto T, Kunimatsu S, et al. Three-dimensional susceptibility-weighted imaging at 3 T using various image analysis methods in the estimation of grading intracranial gliomas. Magn Reson Imaging. (2010) 28:594–8. doi: 10.1016/j.mri.2010.01.002
15. Han X, Sun M, Wang M, Fan R, Chen D, Xie L, et al. The enhanced T(2) star weighted angiography (ESWAN) value for differentiating borderline from Malignant epithelial ovarian tumors. Eur J Radiol. (2019) 118:187–93. doi: 10.1016/j.ejrad.2019.07.011
16. Ren X, Zhao Y, Wang N, Liu J, Zhang S, Zhuang M, et al. Intravoxel incoherent motion and enhanced T2*-weighted angiography for preoperative prediction of microvascular invasion in hepatocellular carcinoma. Front Oncol. (2024) 14:1389769. doi: 10.3389/fonc.2024.1389769
17. Park MJ, Kim HS, Jahng GH, Ryu CW, Park SM, and Kim SY. Semiquantitative assessment of intratumoral susceptibility signals using non-contrast-enhanced high-field high-resolution susceptibility-weighted imaging in patients with gliomas: comparison with MR perfusion imaging. AJNR Am J Neuroradiol. (2009) 30:1402–8. doi: 10.3174/ajnr.A1593
18. Gaudino S, Marziali G, Pezzullo G, Guadalupi P, Giordano C, Infante A, et al. Role of susceptibility-weighted imaging and intratumoral susceptibility signals in grading and differentiating pediatric brain tumors at 1.5 T: a preliminary study. Neuroradiology. (2020) 62:705–13. doi: 10.1007/s00234-020-02386-z
19. Christoforidis GA, Kangarlu A, Abduljalil AM, Schmalbrock P, Chaudhry A, Yates A, et al. Susceptibility-based imaging of glioblastoma microvascularity at 8 T: correlation of MR imaging and postmortem pathology. AJNR Am J Neuroradiol. (2004) 25:756–60.
20. Yang T, Huang L, Chen C, Luo H, and Jiang Y. Comparison between clinicopathological characteristics, BRAF V600E and TERT promoter mutation of familial non-medullary thyroid carcinomas, and sporadic case. Front Oncol. (2021) 11:616974. doi: 10.3389/fonc.2021.616974
21. He Y, Lu H, and Zhang L. Serum AFP levels in patients suffering from 47 different types of cancers and noncancer diseases. Prog Mol Biol Transl Sci. (2019) 162:199–212. doi: 10.1016/bs.pmbts.2019.01.001
22. Zitvogel L, Pietrocola F, and Kroemer G. Nutrition, inflammation and cancer. Nat Immunol. (2017) 18:843–50. doi: 10.1038/ni.3754
23. Fu M, Yu L, Yang L, Chen Y, Chen X, Hu Q, et al. Predictive value of the preoperative prognostic nutritional index for postoperative progression in patients with pancreatic neuroendocrine neoplasms. Front Nutr. (2022) 9:945833. doi: 10.3389/fnut.2022.945833
24. Sun H, Chen L, Huang R, Pan H, Zuo Y, Zhao R, et al. Prognostic nutritional index for predicting the clinical outcomes of patients with gastric cancer who received immune checkpoint inhibitors. Front Nutr. (2022) 9:1038118. doi: 10.3389/fnut.2022.1038118
25. Kageyama S, Yoshida T, Kobayashi K, Wada A, Nagasawa M, Kubota S, et al. Prognostic nutritional index of early post-pembrolizumab therapy predicts long-term survival in patients with advanced urothelial carcinoma. Oncol Lett. (2023) 25:49. doi: 10.3892/ol.2022.13635
26. Persano M, Rimini M, Tada T, Suda G, Shimose S, Kudo M, et al. Role of the prognostic nutritional index in predicting survival in advanced hepatocellular carcinoma treated with atezolizumab plus bevacizumab. Oncology. (2023) 101:283–91. doi: 10.1159/000528818
27. Shen Z, Zhang S, Chen X, Zhang Q, Jiao Y, Shi Y, et al. Prognostic value of prognostic nutritional index on extranodal natural killer/T-cell lymphoma patients: A multicenter propensity score matched analysis of 1022 cases in Huaihai Lymphoma Working Group. Hematol Oncol. (2023) 41:380–8. doi: 10.1002/hon.3124
28. Niu Z and Yan B. Prognostic and clinicopathological effect of the prognostic nutritional index (PNI) in patients with cervical cancer: a meta-analysis. Ann Med. (2023) 55:2288705. doi: 10.1080/07853890.2023.2288705
29. Xu J, Xu H, Zhang W, and Zheng J. Contribution of susceptibility- and diffusion-weighted magnetic resonance imaging for grading gliomas. Exp Ther Med. (2018) 15:5113–8. doi: 10.3892/etm.2018.6017
30. Fahrendorf D, Hesselmann V, Schwindt W, Wölfer J, Jeibmann A, Kooijman H, et al. Variations of ITSS-morphology and their relationship to location and tumor volume in patients with glioblastoma. J Neuroimaging. (2015) 25:1015–22. doi: 10.1111/jon.12228
31. Zeng S, Ma H, Xie D, Huang Y, Wang M, Zeng W, et al. Quantitative susceptibility mapping evaluation of glioma. Eur Radiol. (2023) 33:6636–47. doi: 10.1007/s00330-023-09647-4
32. Yang X, Xing Z, She D, Lin Y, Zhang H, Su Y, et al. Grading of IDH-mutant astrocytoma using diffusion, susceptibility and perfusion-weighted imaging. BMC Med Imaging. (2022) 22:105. doi: 10.1186/s12880-022-00832-3
33. Tanji M, Mineharu Y, Sakata A, Okuchi S, Fushimi Y, Oishi M, et al. High intratumoral susceptibility signal grade on susceptibility-weighted imaging: a risk factor for hemorrhage after stereotactic biopsy. J Neurosurg. (2023) 138:120–7. doi: 10.3171/2022.4.JNS212505
34. Kong LW, Chen J, Zhao H, Yao K, Fang SY, Wang Z, et al. Intratumoral susceptibility signals reflect biomarker status in gliomas. Sci Rep. (2019) 9:17080. doi: 10.1038/s41598-019-53629-w
35. Yang X, Hu C, Xing Z, Lin Y, Su Y, Wang X, et al. Prediction of Ki-67 labeling index, ATRX mutation, and MGMT promoter methylation status in IDH-mutant astrocytoma by morphological MRI, SWI, DWI, and DSC-PWI. Eur Radiol. (2023) 33:7003–14. doi: 10.1007/s00330-023-09695-w
36. Xu Z, Chen M, Zheng S, Chen S, Xiao J, Hu Z, et al. Differential diagnosis of parotid gland tumours: Application of SWI combined with DWI and DCE-MRI. Eur J Radiol. (2022) 146:110094. doi: 10.1016/j.ejrad.2021.110094
37. Bhattacharjee R, Gupta RK, Patir R, Vaishya S, Ahlawat S, and Singh A. Quantitative vs. semiquantitative assessment of intratumoral susceptibility signals in patients with different grades of glioma. J Magn Reson Imaging. (2020) 51:225–33. doi: 10.1002/jmri.26786
38. Piškur I, Topolovec Z, Bakula M, Zagorac I, Milić Vranješ I, and Vidosavljević D. Expression of vascular endothelial growth factor-A (VEGF-A) in adenocarcinoma and squamous cell cervical cancer and its impact on disease progression: single institution experience. Med (Kaunas). (2023) 59:1189. doi: 10.3390/medicina59071189
39. Guo LF, Wang G, Zhu XY, Liu C, and Cui L. Comparison of ESWAN, SWI-SPGR, and 2D T2*-weighted GRE sequence for depicting cerebral microbleeds. Clin Neuroradiol. (2013) 23:121–7. doi: 10.1007/s00062-012-0185-7
40. Chuang TC, Chen YL, Shui WP, Chung HW, Hsu SS, and Lai PH. Intra-tumoral susceptibility signal: a post-processing technique for objective grading of astrocytoma with susceptibility-weighted imaging. Quant Imaging Med Surg. (2022) 12:558–67. doi: 10.21037/qims-21-58
41. Ohara T, Tomono Y, Boyi X, Yingfu S, Omori K, and Matsukawa A. A novel, nontoxic iron chelator, super-polyphenol, effectively induces apoptosis in human cancer cell lines. Oncotarget. (2018) 9:32751–60. doi: 10.18632/oncotarget.25973
42. Zhang J and Chen X. p53 tumor suppressor and iron homeostasis. FEBS J. (2019) 286:620–9. doi: 10.1111/febs.14638
43. Li-Ou Z, Hong-Zan S, Xiao-Xi B, Zhong-Wei C, Zai-Ming L, Jun X, et al. Correlation between tumor glucose metabolism and multiparametric functional MRI (IVIM and R2*) metrics in cervical carcinoma: Evidence from integrated (18) F-FDG PET/MR. J Magn Reson Imaging. (2019) 49:1704–12. doi: 10.1002/jmri.26557
44. Li Y, Song QW, Sun MY, Wang HQ, Wang S, Wei Q, et al. Use of enhanced T2 star-weighted angiography (ESWAN) and R2* values to distinguish ovarian cysts due to endometriosis from other causes. Abdom Imaging. (2015) 40:1733–41. doi: 10.1007/s00261-014-0314-7
45. Li XS, Fan HX, Fang H, Song YL, and Zhou CW. Value of R2* obtained from T2*-weighted imaging in predicting the prognosis of advanced cervical squamous carcinoma treated with concurrent chemoradiotherapy. J Magn Reson Imaging. (2015) 42:681–8. doi: 10.1002/jmri.24837
46. Noh JM, Park W, Kim YS, Kim JY, Kim HJ, Kim J, et al. Comparison of clinical outcomes of adenocarcinoma and adenosquamous carcinoma in uterine cervical cancer patients receiving surgical resection followed by radiotherapy: a multicenter retrospective study (KROG 13-10). Gynecol Oncol. (2014) 132:618–23. doi: 10.1016/j.ygyno.2014.01.043
Keywords: cervical adenocarcinoma, cervical squamous carcinoma, intertumoral susceptibility signal, R2* value, ESWAN
Citation: Chen A, Meng X, Ma C, Tian S, Song Q, Liu A, Zhuang M and Wang H (2025) Automated ITSS extraction combined with R2* values obtained from enhanced T2*-weighted angiography in magnetic resonance imaging: a promising approach for differentiate cervical adenocarcinoma from squamous carcinoma. Front. Oncol. 15:1578525. doi: 10.3389/fonc.2025.1578525
Received: 17 February 2025; Accepted: 20 October 2025;
Published: 18 November 2025.
Edited by:
Dorothy Lombe, Cancer Screening, Treatment and Support Services MidCentral, New ZealandReviewed by:
Sijia Liu, Third Affiliated Hospital of Harbin Medical University, ChinaSaw Myat Thitsar, Palmerston North Hospital, New Zealand
Copyright © 2025 Chen, Meng, Ma, Tian, Song, Liu, Zhuang and Wang. This is an open-access article distributed under the terms of the Creative Commons Attribution License (CC BY). The use, distribution or reproduction in other forums is permitted, provided the original author(s) and the copyright owner(s) are credited and that the original publication in this journal is cited, in accordance with accepted academic practice. No use, distribution or reproduction is permitted which does not comply with these terms.
*Correspondence: Ailian Liu, bGl1YWlsaWFuQGRtdS5lZHUuY24=
†These authors have contributed equally to this work