 Yunbo Wu
 Yunzhan Zhang1
 Yunkai Dai
 Ling Hu
- 1Institute of Gastroenterology, Science and Technology Innovation Center, Guangzhou University of Chinese Medicine, Guangzhou, China
- 2Gastroenterology Department, First Affiliated Hospital of Guangzhou University of Chinese Medicine, Guangzhou, China
Background: This study investigates the role of CDH1 gene single nucleotide polymorphisms (SNPs), mRNA transcription levels, and E-cadherin protein localization in Helicobacter pylori (Hp)-associated gastric diseases and their contribution to gastric mucosal carcinogenesis.
Methods: Gastric mucosal samples were analyzed for histopathology (Hematoxylin-Eosin staining) and Hp detection (rapid urease test, Giemsa staining). SNPs at the CDH1 gene rs16260 locus were identified via sequencing, mRNA levels were quantified by real-time PCR, and E-cadherin localization was assessed using Elivision™ Plus. Statistical analyses were performed with SPSS 25.0.
Results: Participants were grouped by gastric mucosal pathology: normal (NOR), gastric inflammation (GI), gastric atrophy (GA), gastric premalignant lesion (GPL), severe dysplasia (GSD), and gastric cancer (GC). No significant differences were found in CDH1 rs16260 genotypes. However, CDH1 transcription was higher in GC compared to NOR and GPL groups. Intestinal metaplasia showed lower CDH1 mRNA levels. E-cadherin expression was higher in GSD and GC compared to other groups. Localization analysis revealed decreased membrane-bound E-cadherin with increased cytoplasmic expression as lesion severity increased. Quantitative analysis showed higher E-cadherin expression in GA than other groups, indicating an initial rise followed by a decline in malignancy. Regression analysis suggested that elevated CDH1 mRNA increased gastric cancer risk, while E-cadherin cytoplasmic ectopic expression heightened the risk of precancerous lesions and gastric cancer.
Conclusion: The A allele of the CDH1 gene rs16260 locus show no effect in gastric mucosal pathological evolution, while the elevated mRNA transcription levels potentially increasing the risk of gastric cancer. The loss and ectopic expression of E-cadherin may be significant risk factors for malignant transformation in the gastric mucosa.
1 Introduction
Gastric cancer (GC) is one of the most prevalent cancers globally, ranking fifth in incidence and fourth in mortality among all cancers, posing a significant threat to human health (1). The development of GC results from the combined effect of multiple factors, including genetic predispositions, dietary habits, smoking, and alcohol consumption, with Helicobacter pylori (Hp) infection being a major risk factor in non-cardia gastric cancer (2). Long-term Hp infection can lead to gradual gastric mucosal atrophy and intestinal metaplasia, and without timely intervention, may ultimately progress to dysplasia and carcinogenesis (3). Diseases encompassing the pathological changes from benign to malignant in gastric mucosa are collectively termed Hp-associated gastric diseases (HpGD), including gastric ulcers, chronic gastritis, and gastric cancer.
E-cadherin is a calcium-dependent type I transmembrane glycoprotein that plays a crucial role in maintaining cell adhesion, stabilizing the cytoskeleton, and preserving the normal morphological structure of tissues and organs (4). Abnormal E-cadherin expression is closely associated with the occurrence of various cancers, including breast cancer, ovarian cancer, and colorectal cancer. Decreased or absent expression of E-cadherin is significantly correlated with the high malignancy, invasiveness, and metastasis of tumor tissues (5–7). Previous studies have also indicated abnormal expression of E-cadherin in gastric cancer tissues, closely correlated with clinical characteristics such as Lauren classification, depth of infiltration, degree of differentiation, lymph node metastasis, and TNM staging (8, 9). However, previous studies mainly focused on the expression changes of E-cadherin in gastric cancer, and the specific patterns of E-cadherin protein variation in the malignant transformation of gastric mucosa remain unclear.
CDH1, gene encoding E-cadherin, is located in the q22.1 region of chromosome 16, comprising 16 exons and 15 introns. Recent studies have identified multiple single nucleotide polymorphisms (SNPs) in the promoter region that regulate CDH1 transcriptional activity, with the CDH1-160 (rs16260) locus being among the more common variants (10). It has been reported that the CDH1–160 C>A polymorphism significantly influences the occurrence, development, and prognosis of various cancers (11–13), while its specific role in gastric cancer remains controversial (14, 15).
This study aims to investigate the roles of CDH1 gene SNPs, mRNA expression levels, and qualitative and locational expression of its protein E-cadherin in HpGD, exploring these factors longitudinally in the benign and malignant pathological evolution of gastric mucosa, providing potential early warning indicators for gastric cancer ultimately.
2 Methods
2.1 Study population and specimens collection
This study recruited a total of 504 participants from November 2016 to September 2019 from the Endoscopy Center of the First Affiliated Hospital of Guangzhou University of Chinese Medicine, including patients diagnosed with chronic gastritis, gastric ulcers, and gastric cancer, as well as participants undergoing routine health examinations. General information and clinical data were collected from all participants. Four tissue samples were collected from suspected lesions (around ulcers for ulcer patients; from the gastric antrum for health examination participants) for histopathological classification, Hp detection, CDH1 (rs16260) gene polymorphism analysis, CDH1 gene mRNA transcription level measurement, and qualitative and locational analysis of E-cadherin expression. This research was approved by the Ethics Committee of the First Affiliated Hospital of Guangzhou University of Chinese Medicine (Ethics Approval No [2015]: 009), and all participants provided informed consent.
2.2 Pathology evaluation and Hp detection
The gastric mucosal tissue was stained using the Hematoxylin and Eosin (HE) method. Pathological evaluation followed the Sydney System (16), categorizing participants into six groups based on endoscopic findings and gastric mucosal pathological features, including inflammation severity, activity, atrophy degree, intestinal metaplasia degree, dysplasia degree, and cancerous changes. Participants were classified as follows: (1) Normal group (NOR): No apparent abnormalities observed on gastric mucosa under endoscopy, with no significant pathological changes or only mild inflammation. (2) Gastric inflammation group (GI): Significant lesions observed on gastric mucosa under endoscopy, accompanied by chronic or active inflammatory changes, without atrophy, intestinal metaplasia, or dysplasia. (3) Gastric atrophy group (GA): Intrinsic glandular atrophy of gastric mucosa, with or without chronic or active inflammation, without intestinal metaplasia or dysplasia. (4) Gastric premalignant lesion group (GPL): Intestinal metaplasia present in gastric mucosa or mild to moderate dysplastic changes, with or without gastric mucosal atrophy, chronic or active inflammation. (5) Gastric severe dysplasia group (GSD): Severe dysplastic changes observed in gastric mucosa, with or without inflammation, atrophy, or intestinal metaplasia. (6) Gastric cancer group (GC): Participants meeting diagnostic criteria for gastric cancer. Hp infection was detected using rapid urease testing and the Giemsa staining method (17). A positive result in either test indicated Hp infection, classified as mild, moderate, or severe based on Giemsa staining results.
2.3 CDH1 SNP detection
This study conducted single nucleotide polymorphism (SNP) testing on the CDH1-160 (rs16260) locus of gastric mucosal tissue. The gene sequence for this locus was retrieved from the NCBI database, and primers were designed and synthesized using Primer Expression2.0 software as follows:
Outer amplification: Upstream primer: ctgtactcccagctactagag.
Downstream primer: cgtaccgctgattggctgag.
Inner amplification: Upstream primer: cttgagcccaggagttcgag.
Downstream primer: gccacagccaatcagcag.
DNA from gastric mucosal tissue was extracted using the HiPure Tissue DNA Kits (Magen, Cat. No: D3121-02), followed by nested PCR amplification (outer and inner rounds) using TaKaRa LA Taq® with GC Buffer (Takara, Cat. No: RR02AG). The amplification conditions were set as follows: 94°C for 30 seconds, 61.4°C for 30 seconds, and 72°C for 30 seconds, for a total of 35 cycles. Extension was performed at 72°C for 10 minutes, and the reaction was terminated at 10°C for 30 seconds. PCR products were separated and analyzed using 1% agarose gel electrophoresis. A clear, single band of 339 bp confirmed successful amplification. Subsequently, direct sequencing was performed on the amplified products.
2.4 Quantitative real-time PCR reaction
Quantitative real-time PCR (qPCR) was employed to assess the mRNA transcription levels of the CDH1 gene. Primer sequences were 5’-ccttagaggtgggtgactac-3’ (forward) and 5’-caagaatccccagaatggcag-3’ (reverse). The procedure involved several specific steps: RNA extraction from gastric mucosal tissue using RNAiso Plus solution (TaKaRa, Cat. No: AKA1202); reverse transcription using the ReverTra Ace qPCR RT Kit (TOYOBO, Cat. No: FSQ-101); and fluorescence-based qPCR using SYBR Premix Ex TaqTM (TliRNaseH Plus) (TaKaRa, Cat. No: AK6006). Reaction conditions included an initial denaturation at 95°C for 30 seconds, followed by amplification cycles at 95°C for 5 seconds, 60°C for 30 seconds, and 72°C for 1 minute, repeated 40 times. Melting curve analysis was conducted with a denaturation step at 95°C for 15 seconds, annealing at 65°C for 1 minute, and final denaturation at 95°C for 15 seconds. The relative gene expression differences were evaluated using the 2^-ΔΔCp method, with Actinβ serving as the internal reference gene.
2.5 E-cadherin detection
Following dewaxing of paraffin-embedded gastric mucosal tissue, E-cadherin protein localization was detected using the Elivision™ plus labeling method. Endogenous peroxidase activity was inhibited by immersion in 3% H2O2 at room temperature (20-25°C) for 10 minutes. Subsequently, sections were incubated with the Anti-E-cadherin antibody (EP700Y) (dilution 1:1500, ab40772, Abcam) at 4°C overnight (mainly recognized the C-terminal cytoplasm domain of human E-cadherin). After washing with PBS, sections were incubated with Goat Anti-Rabbit IgG H&L (HRP) (ab6721, Abcam) as the secondary antibody for 30 min at 37°C.DAB solution was applied for color development, followed by mounting and observation under an optical microscope. The evaluation of protein expression was based on a combined of the positive cell percentage and staining intensity. Specifically, the scoring for positive cell percentage includes: 0 points: ≤25% positive cells, 1 point: 26%–75% positive cells, 2 points: ≥76% positive cells; the scoring for staining intensity includes: 0 points: No staining, 1 point: Light yellow staining, 2 points: Brown staining. The final score(ranging from to 4) was calculated as the sum of the two scores and categorized as follow: 0–1: Negative (–), 2: Weakly positive (+), 3: Positive (++), 4: Strongly positive (+++). Additionally, protein localization of E-cadherin was assessed according to staining patterns.
2.6 Statistical analysis
Statistical analysis was performed using SPSS 25.0 software. For categorical data such as genotype distribution and E-cadherin protein expression, Chi-square test or Fisher’s exact test was employed. Ordinal data including Hp infection severity and E-cadherin protein quantitative scores were analyzed using Kruskal-Wallis H test. Analysis of CDH1 gene mRNA transcription levels utilized either one-way analysis of variance (ANOVA) or Kruskal-Wallis test, with Spearman’s rank correlation assessing the relationship between CDH1 gene mRNA transcription levels and severity of gastric mucosal histopathology. Multivariate logistic regression analysis was conducted to evaluate the association between CDH1 gene polymorphisms, CDH1 gene mRNA transcription levels, E-cadherin protein qualitative localization expression, and gastric mucosal histopathological features, using odds ratios (OR) and 95% confidence intervals (CI). Power analysis was performed to examine the statistical power. The significance level was set at α=0.05, indicating P<0.05 was considered statistically significant.
3 Results
3.1 Basic characteristics
This study included a total of 504 participants, comprising 270 males and 234 females, with a mean age of 49.74 ± 11.98 years and an average disease duration of 1315.61 ± 1903.71 days. The overall Hp infection rate was 75.6%. Baseline characteristics of each pathological group are presented in Table 1. There were no statistically significant differences in gender distribution and age among the groups. However, there was a statistically significant difference in Hp infection rates among the groups (P = 0.001). Specifically, the Hp infection rate in the GPL group was higher than that in the NOR group (80.8% vs 52.9%, P = 0.004) and the GI group (80.8% vs 64.3%, P = 0.020). Figure 1 illustrates the relationship between different Hp infection statuses and histopathological features of gastric mucosa in the participants.
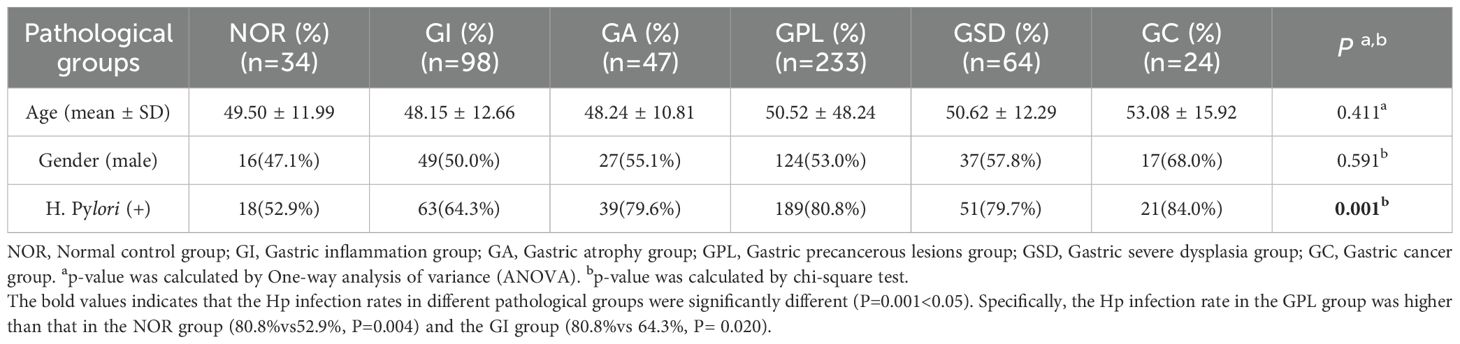
Table 1. Demographic information of study subjects.
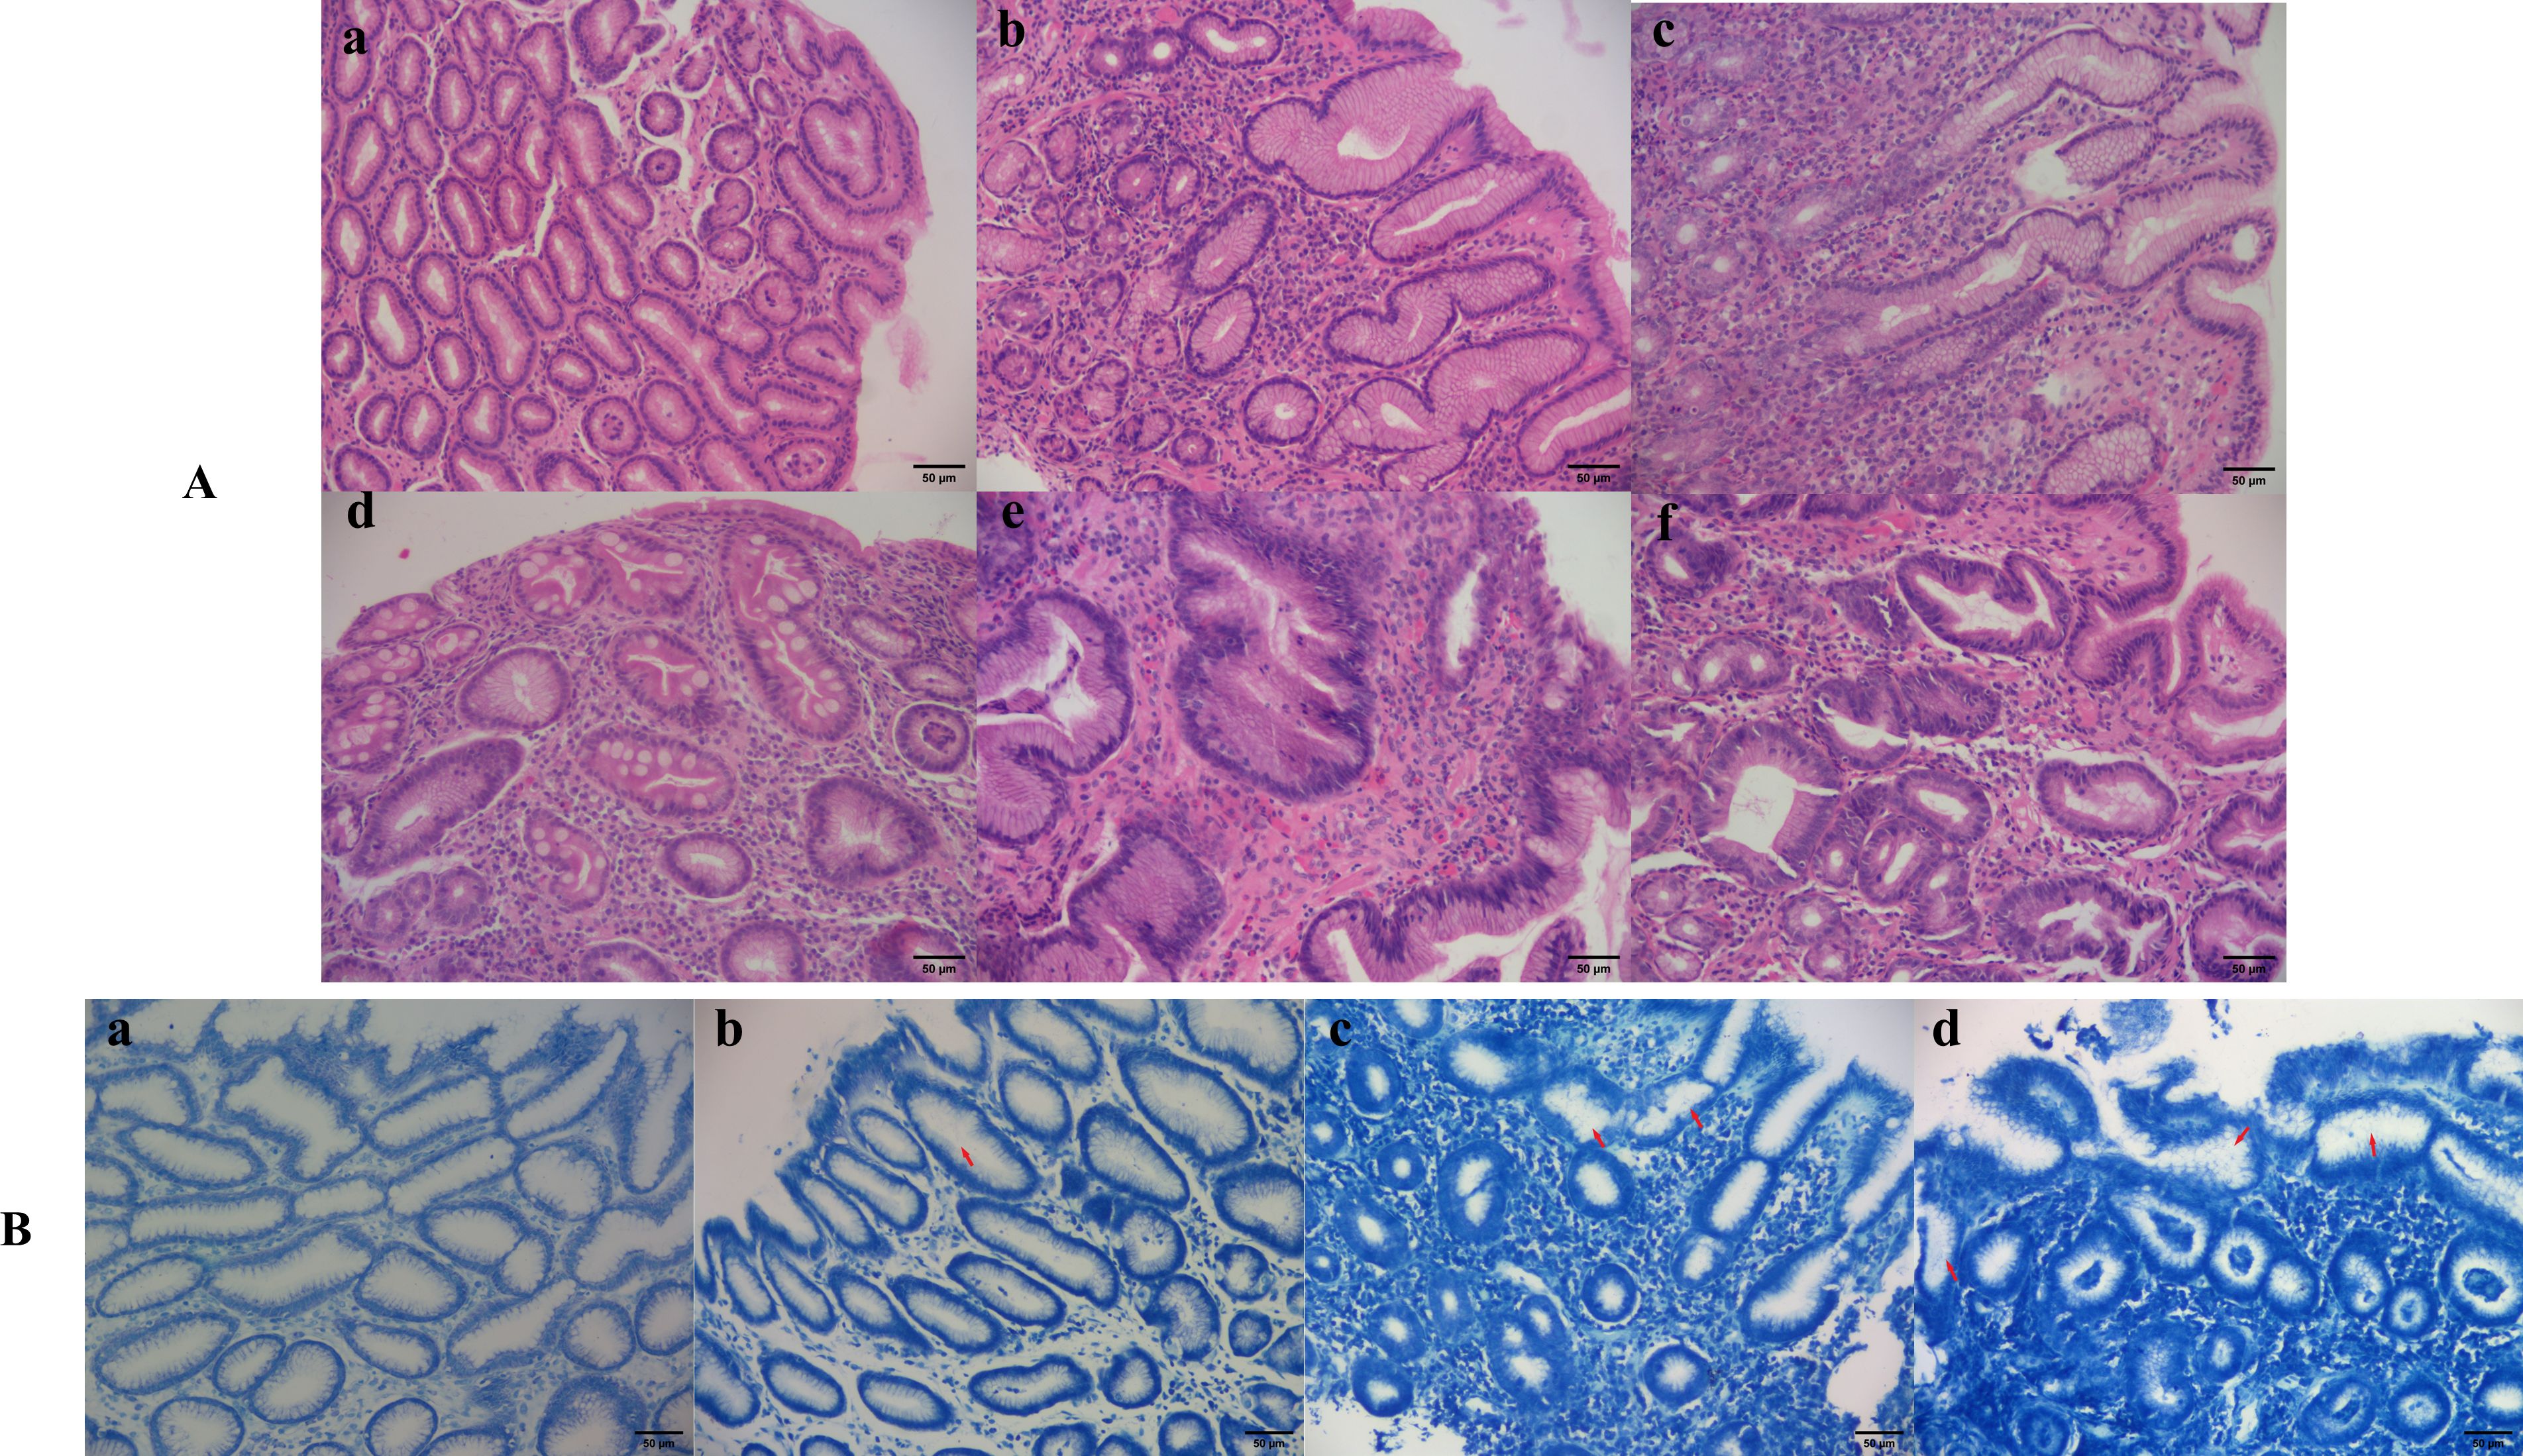
Figure 1. Different histopathological features and Hp infection states of gastric mucosa. (A) Histopathological features of gastric mucosa (hematoxylin-eosin staining 200×): (a) Normal gastric mucosa; (b) Gastric mucosa with moderate inflammation; (c) Gastric mucosa with moderate atrophy and severe inflammation; (d) Gastric mucosa with severe inflammation, severe intestinal metaplasia and mild dysplasia; (e) Moderate atrophic gastric mucosa with moderate dysplasia and severe inflammation; (f) Cancerous gastric mucosa. (B) Hp infection situations (methylene blue staining 200×): (a) Negative; (b) Mild; (c) Moderate; (d) Severe.
3.2 CDH1 SNP and HpGD
The PCR product of CDH1 is displayed in Figure 2A, and the SNP at the CDH1-160 (rs16260) locus was identified as a C>A mutation, presenting three genotypes: C/C wild-type homozygote, C/A mutant heterozygote, and A/A mutant homozygote (Figure 2B). Hardy-Weinberg equilibrium testing indicated that the genetic balance of this locus in the subjects was maintained (P=0.87>0.05), suggesting they originated from the same Mendelian population. The distribution of genotypes across different pathological groups is shown in Figure 2C(a), with no statistically significant differences in genotype or allele distribution among the groups (genotype P=0.465, allele P=0.863). To exclude the impact of Hp infection on gastric mucosal pathology, statistical analysis was performed separately for Hp-negative (Figure 2C(b)) and Hp-positive subjects (Figure 2C(c)). The results indicated no significant differences in CDH1-160 (rs16260) genotype or allele distribution among the pathological groups, regardless of Hp infection status (genotype: Hp-positive P=0.938, Hp-negative P=0.642; allele: Hp-positive P=0.990, Hp-negative P=0.825). To further investigate the effect of the CDH1–160 SNP on gastric mucosal pathology, the pathological changes in the gastric mucosa of different genotype carriers were analyzed. As shown in Table 2, there were no statistically significant differences in the likelihood of atrophy, intestinal metaplasia, or dysplasia in the gastric mucosa among patients with different genotypes, regardless of Hp infection status.

Figure 2. Genotyping for CDH1–160 SNP and its frequency in pathological groups. (A) gel electrophoresis of PCR product, M: Marker; Lane 1 to 10 represents 10 different individuals. (B) Results of genotyping: (a) CC homozygous wild, (b) CA heterozygous mutant, (c) GG homozygous mutant type. (C) Distribution of genotype in pathological groups: (a) all subjects, (b) H. pylori-negative subjects. (c) H. pylori-positive subjects.
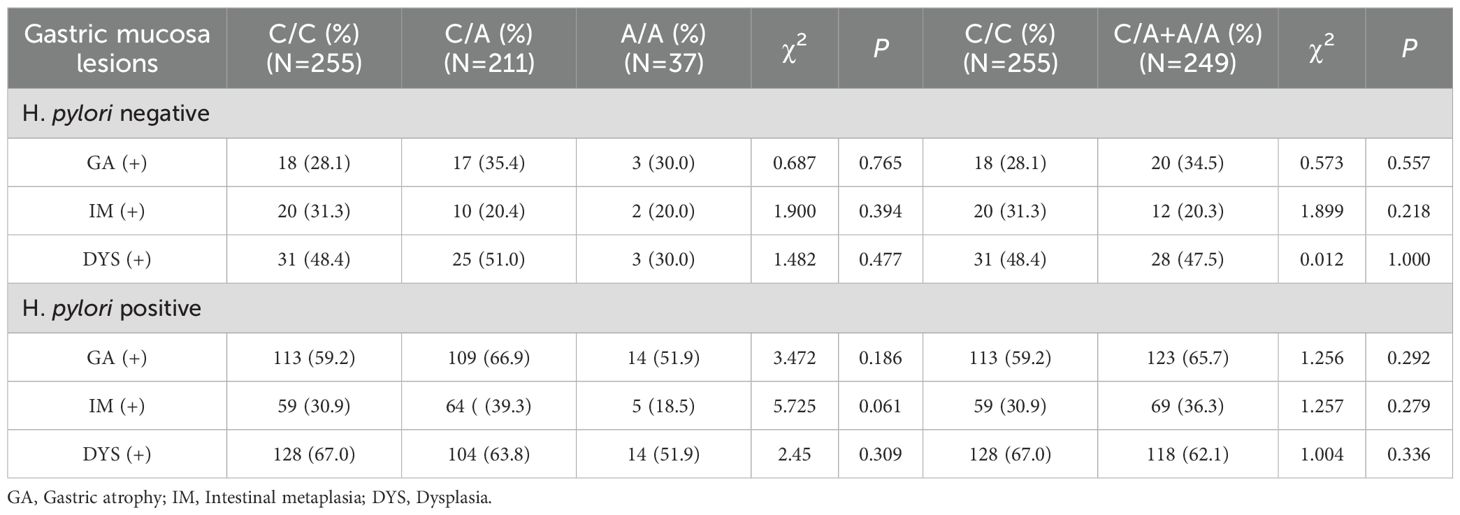
Table 2. CDH1–160 SNPs and gastric pathological change.
3.3 CDH1 mRNA and HpGD
The expression levels of mRNA in different pathological groups are illustrated in Figure 3A. The non-parametric tests revealed statistically significant differences in mRNA expression levels among the groups; specifically, the mRNA transcription level in the GC group was higher than that in the NOR group (2.34 vs. 0.83, P=0.046) and the GPL group (2.34 vs. 1.06, P=0.024). Further analysis of the relationship between CDH1 mRNA transcription levels and gastric mucosal pathology indicated that overall, the mRNA transcription level of the CDH1 gene was significantly lower in intestinal gastric mucosal tissue compared to non-intestinal tissue (1.35 vs. 0.97, P=0.030, Figure 3B(a)). Correlation analysis showed a positive correlation between the degree of gastric mucosal atrophy and CDH1 gene mRNA expression (r=0.112, P=0.012, Figure 3C(a)).
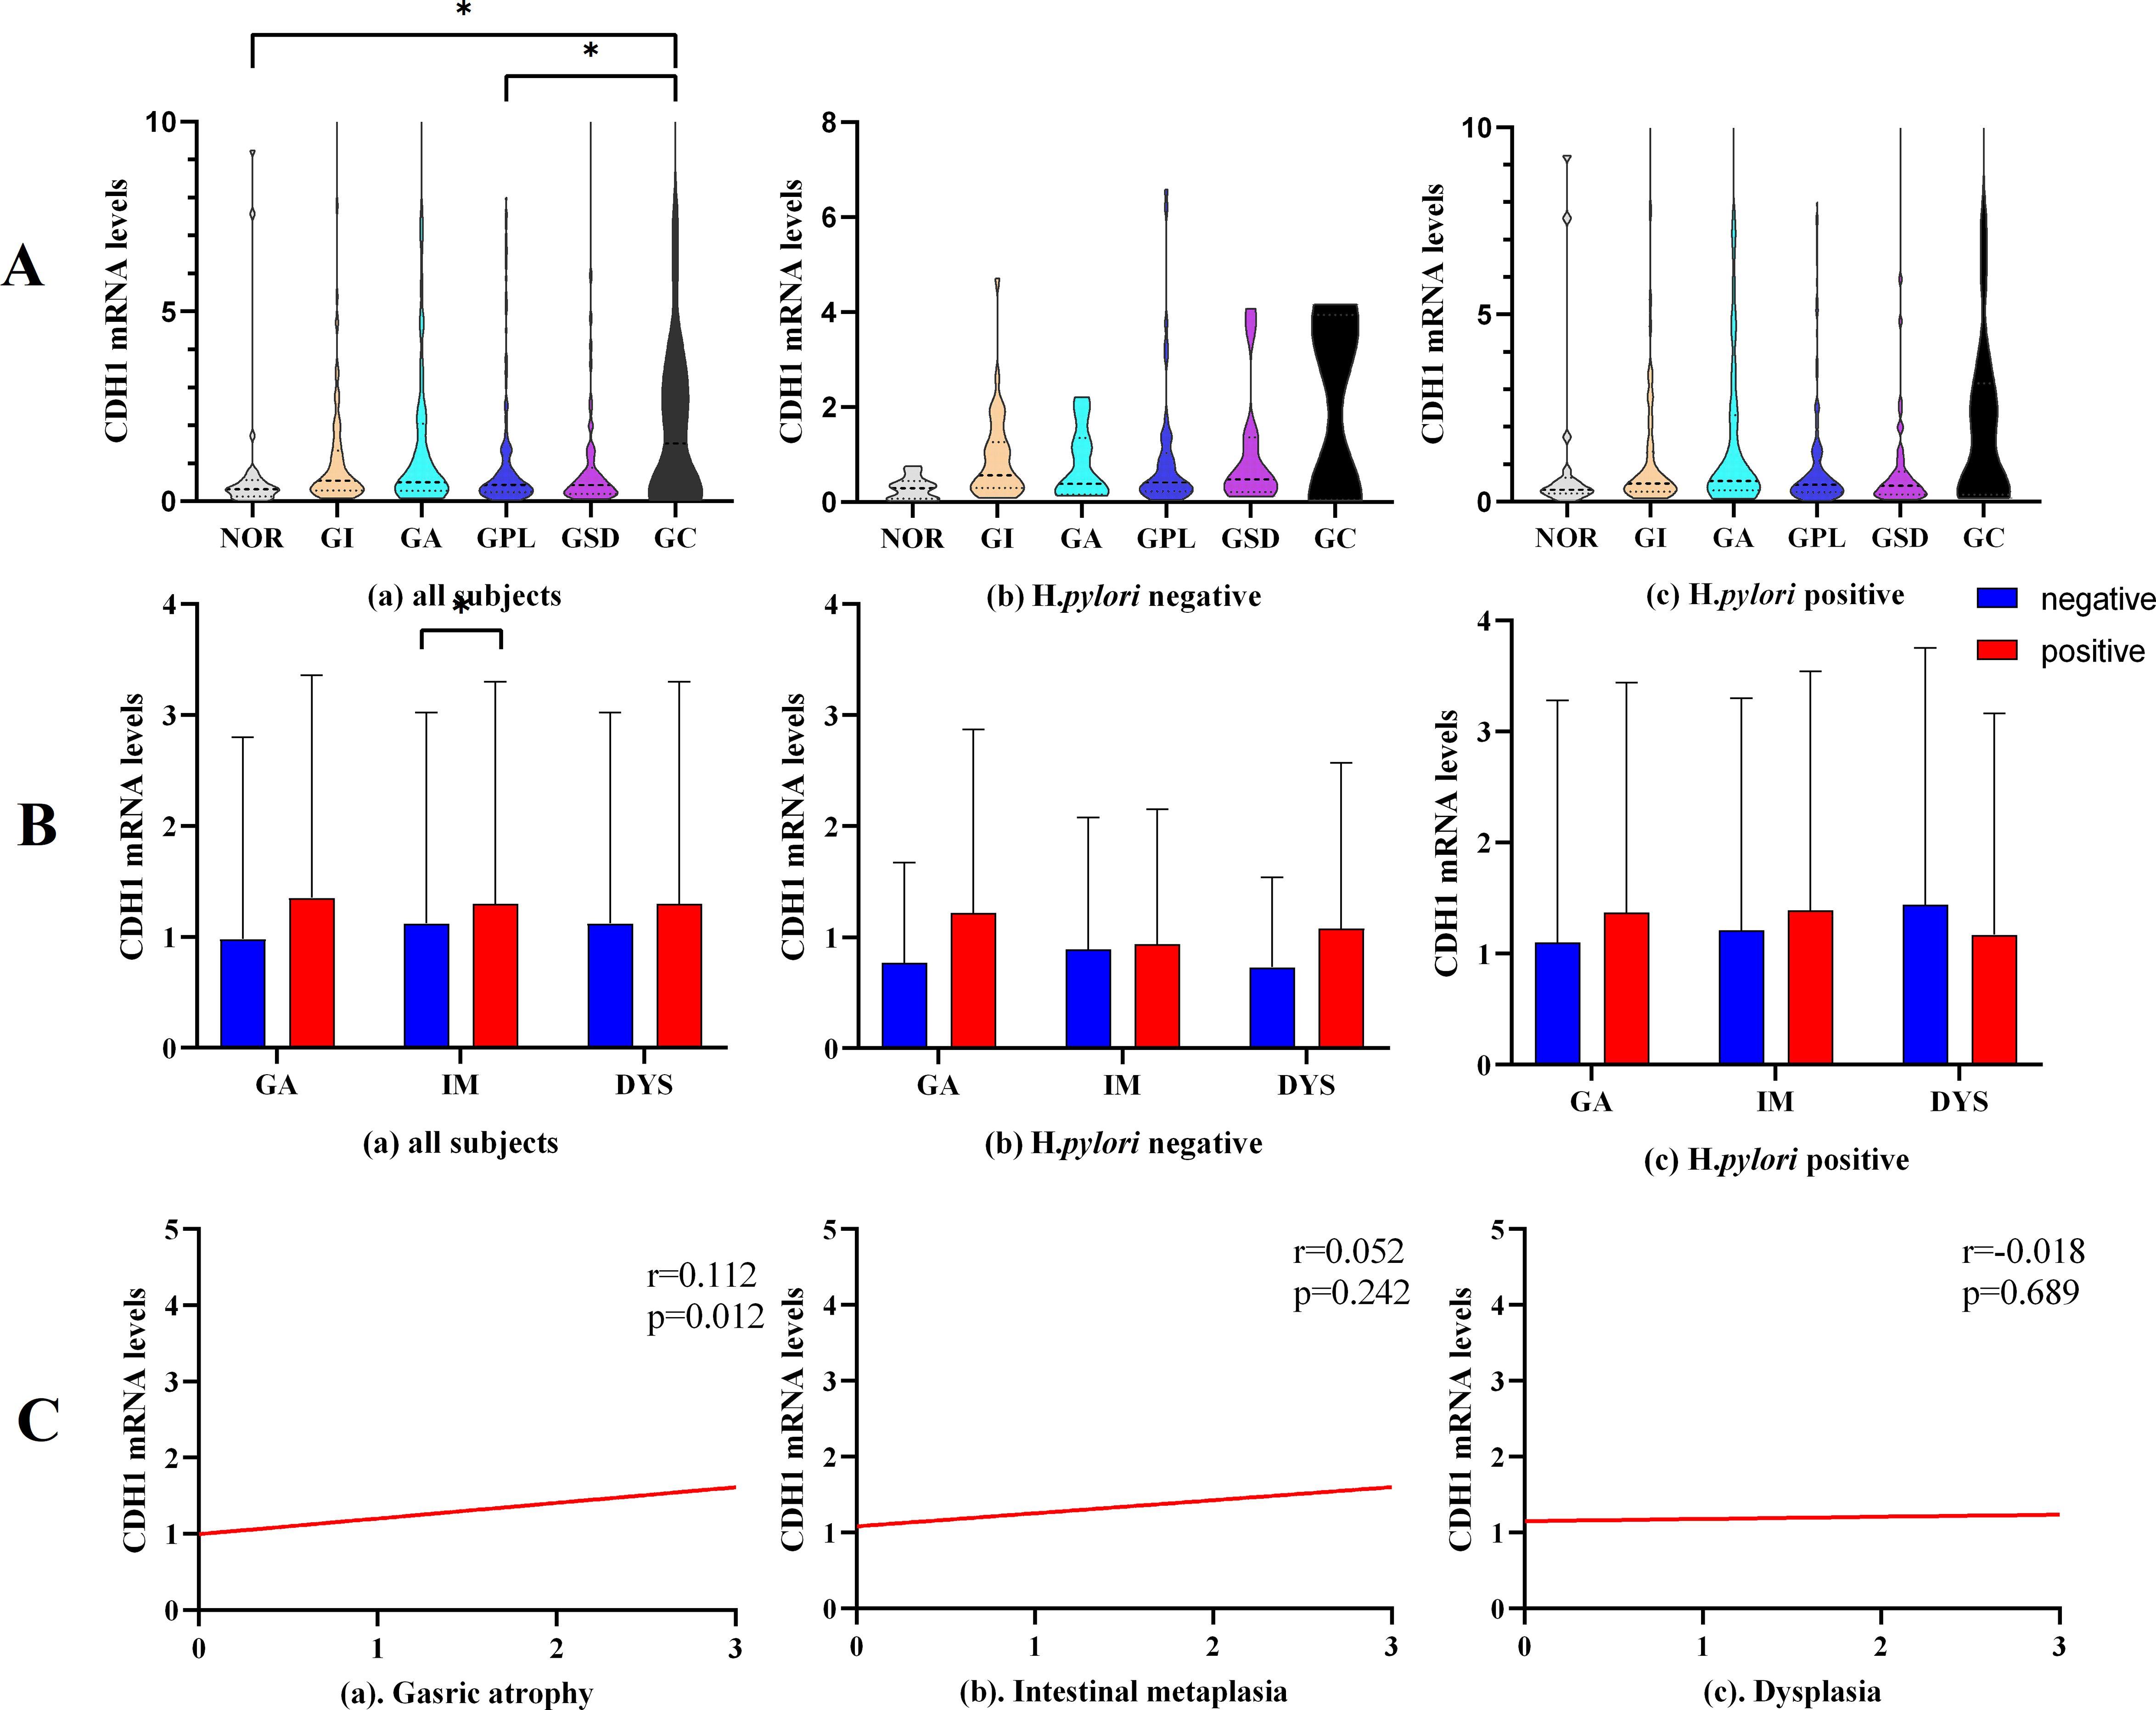
Figure 3. CDH1 mRNA expression. (A) CDH1 mRNA expression in different pathological groups. (B) CDH1 mRNA expression in gastric mucosa with different pathological changes. (C) Correlation analysis between CDH1 mRNA level and gastric pathological change. GA, gastric atrophy, IM, intestinal metaplasia, DYS, dysplasia. *P<0.05.
3.4 E-cadherin expression and HpGD
E-cadherin protein, an important adhesion molecule located primarily on the membrane of epithelial cells, exhibited varying expression across different pathological groups, as shown in Figure 4. Analysis of E-cadherin expression in different regions of the gastric mucosa (Figure 5A) revealed higher expression rates in the GSD group within the gastric pits of Hp-positive subjects compared to the NOR, GI, GA, and GPL groups (87.5% vs. 17.6%, 54.2%, 31.4%, 46.0%, P= 0.001, <0.001, 0.002, 0.006, respectively). The GC group also showed higher expression rates than the NOR and GI groups (62.0% vs. 17.6%, 21.4%, P= 0.024, 0.005), while the GPL group had higher expression rates than the GI group (54.2% vs. 31.4%, P=0.002). However, no significant differences were observed in the epithelial area, lamina propria, or overall E-cadherin expression rates.
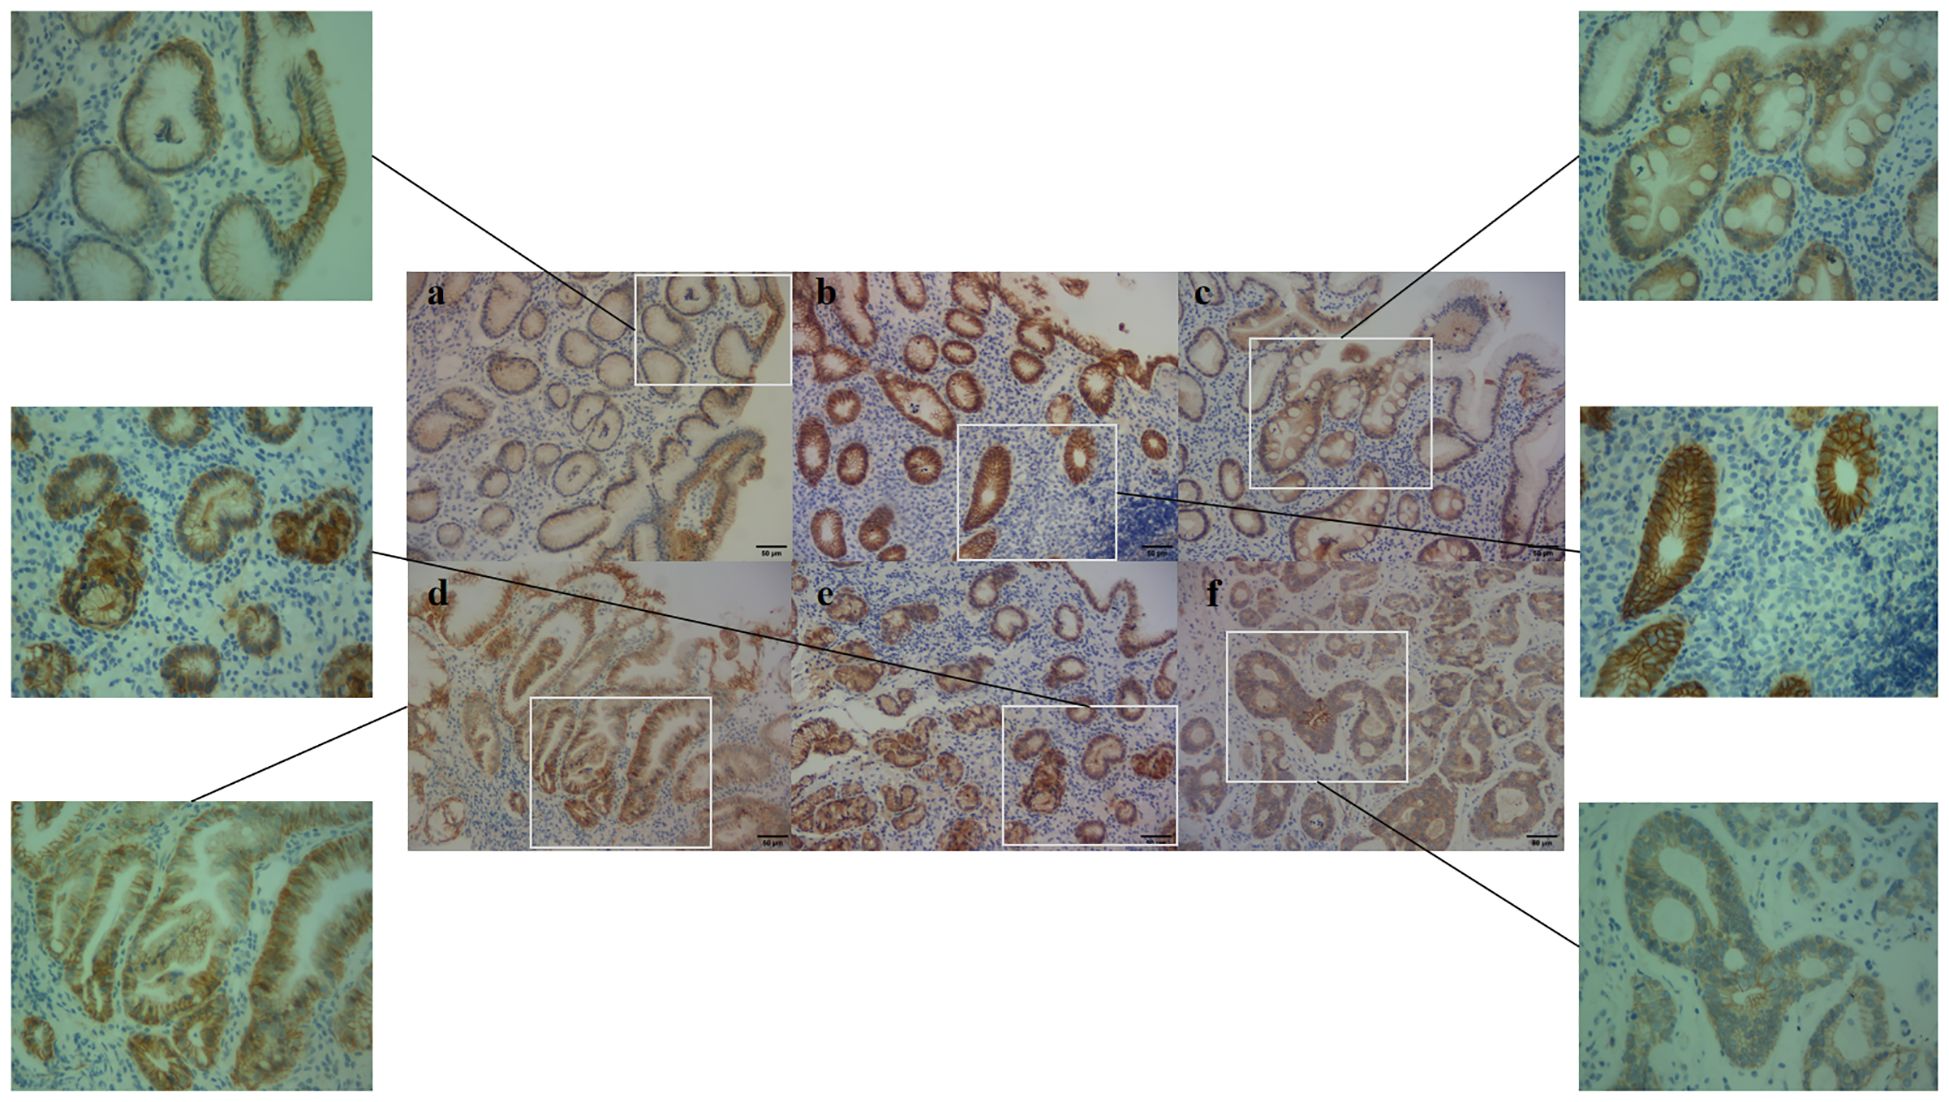
Figure 4. E-cadherin expression in different pathological groups (200× and 400x). (a) NOR group, E-cadherin membrane expression, (b) GPL group, E-cadherin both membrane and cytoplasm expression, (c) GPL group, E-cadherin cytoplasm expression, (d) GSD group, E-cadherin membrane expression, (e) GSD group, E-cadherin cytoplasm expression, (f) GC group, E-cadherin cytoplasm expression.
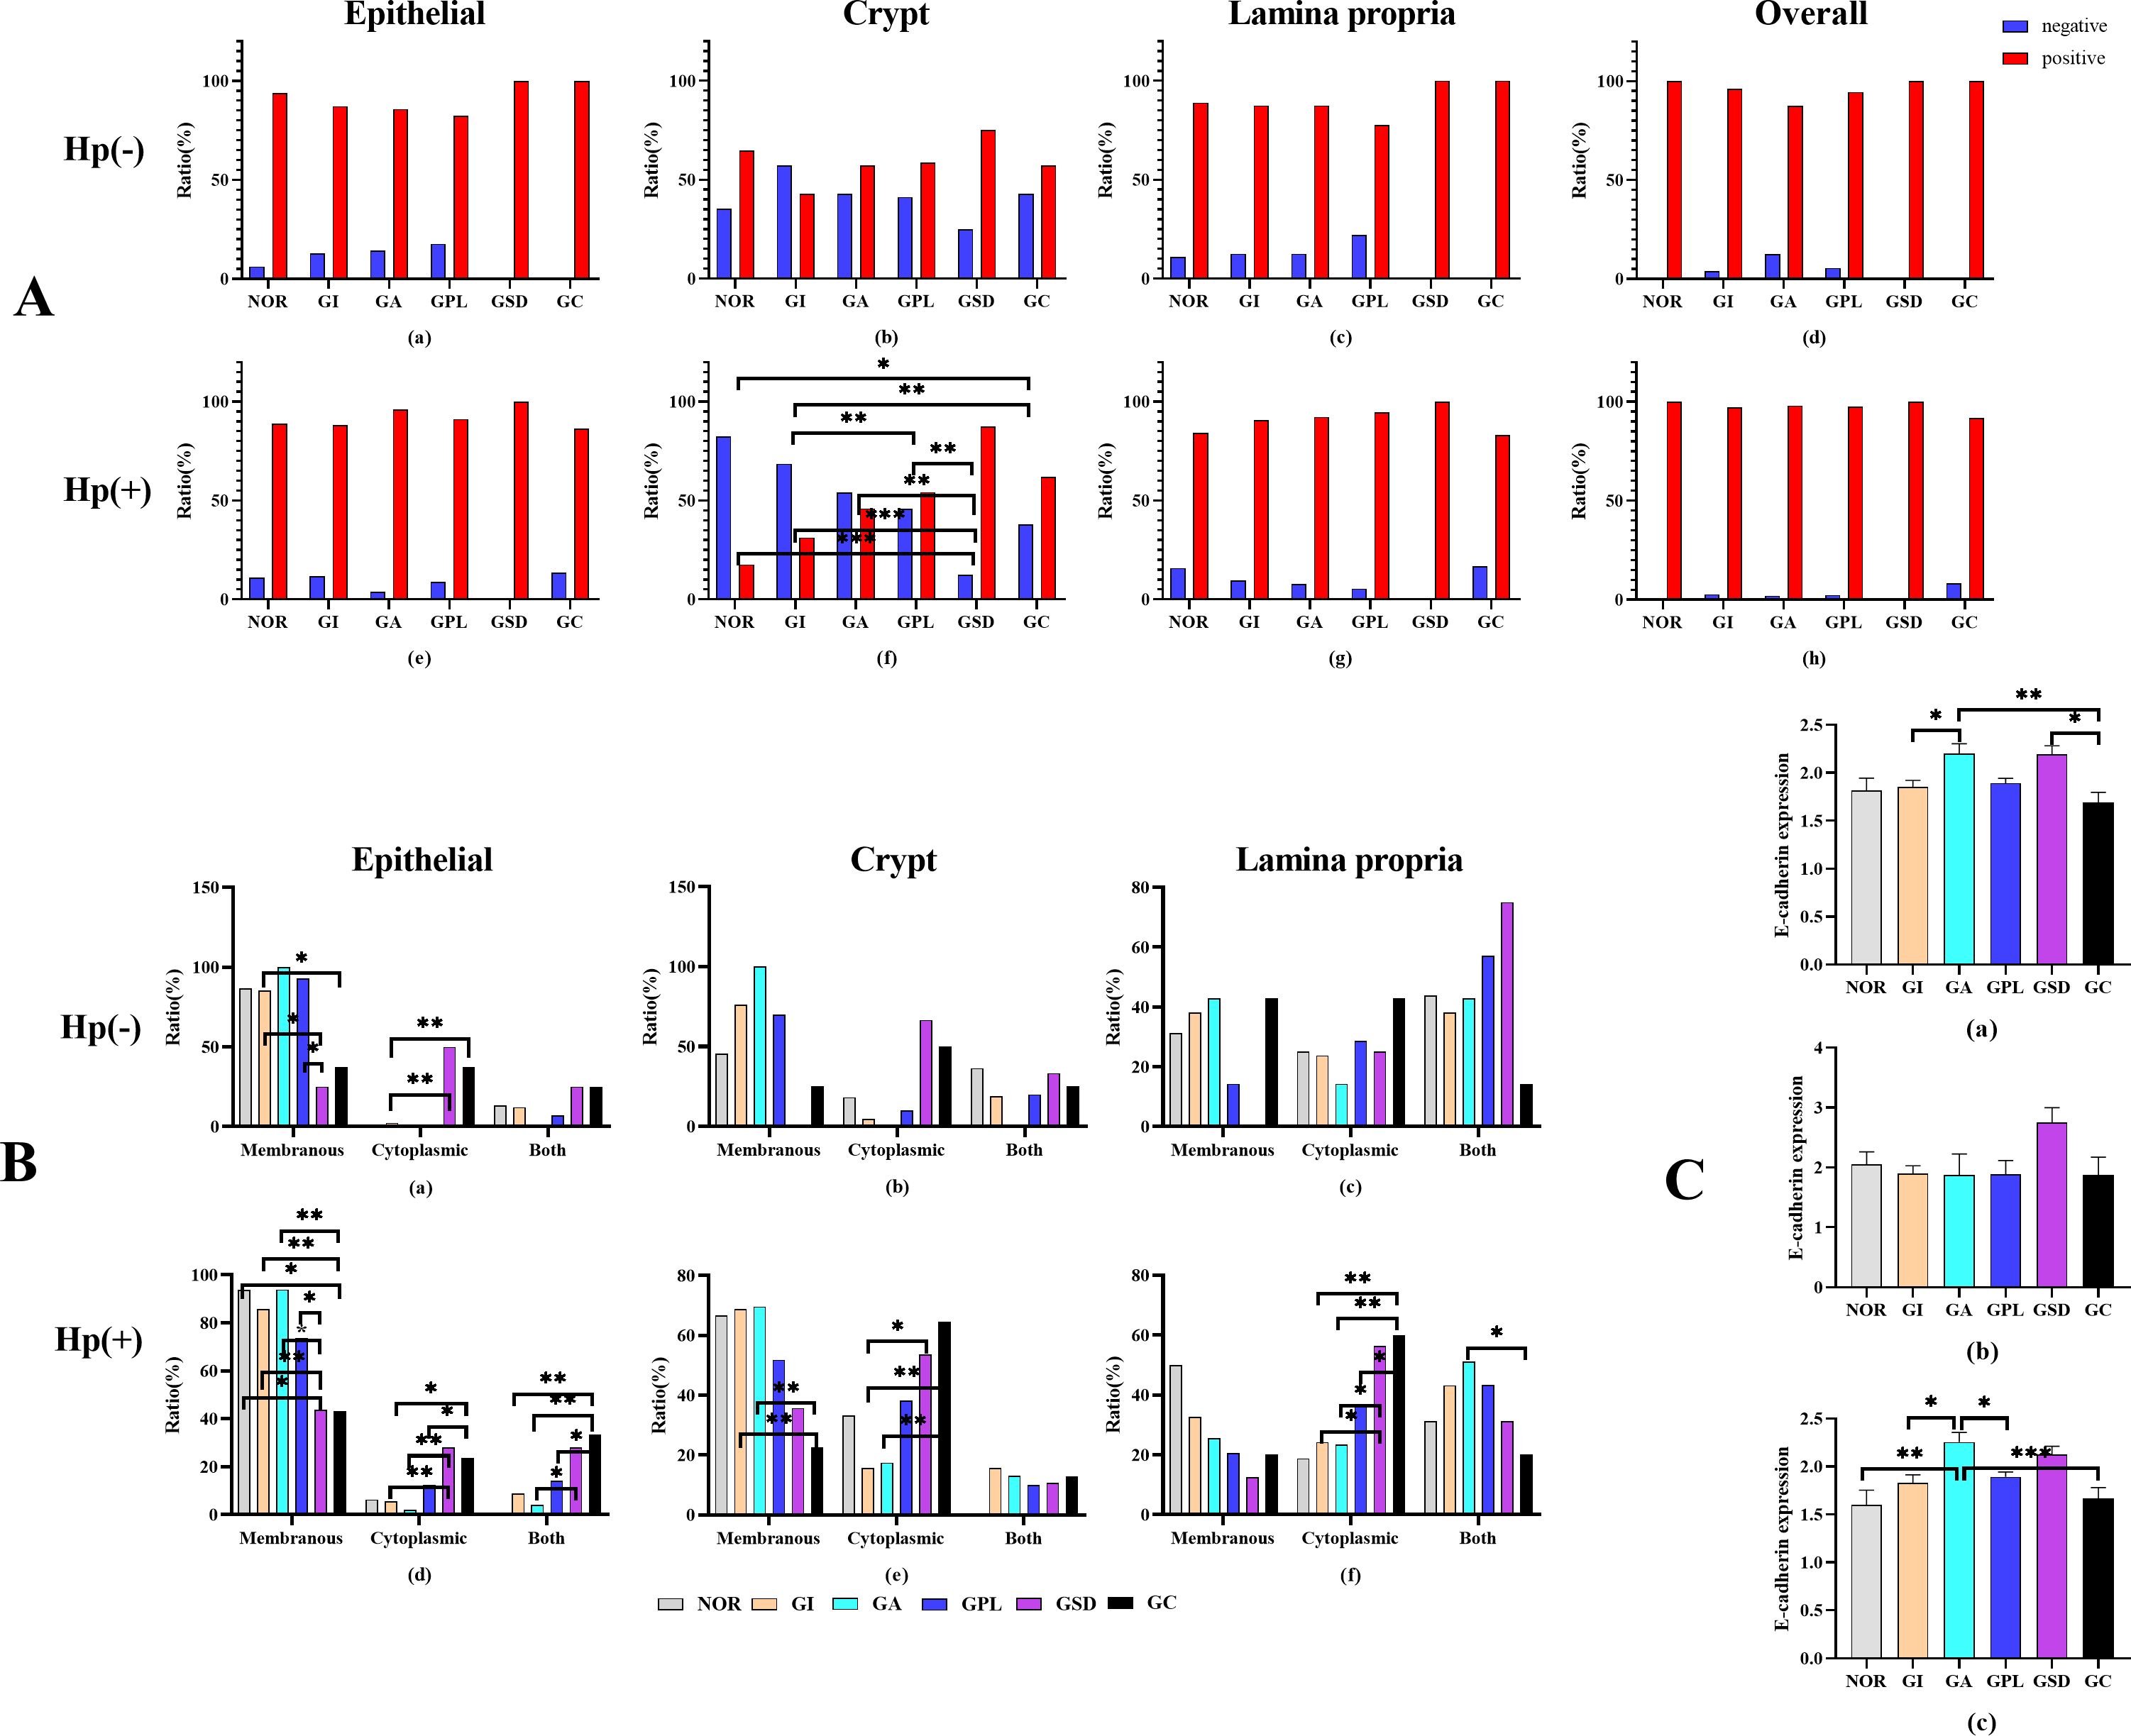
Figure 5. (A) Ratio of E-cadherin in different area of histopathological groups. (B) E-cadherin situation in histopathological groups. (C) Semiquantitative analysis in histopathological groups. (a) all subjects, (b) H. pylori-negative subjects. (c) H. pylori-positive subjects. *P<0.05, **P<0.01.
Subsequent analysis of the localization of E-cadherin protein expression revealed significant differences among the pathological groups (Figure 5B). In Hp-negative subjects, the epithelial region showed higher membrane expression rates in the GI group compared to the GSD and GC groups (P=0.040 and P=0.030, respectively), and the GPL group had higher membrane expression rates than the GSD group (P=0.040). Conversely, the GI group had lower cytoplasmic expression rates than the GSD and GC groups (P=0.001 and P=0.003, respectively). In Hp-positive subjects, the membrane expression rates in the NOR, INF, GA, and GPL groups were higher than in the GSD (P=0.013, <0.001, <0.001, and 0.011, respectively) and GC groups (P=0.006, <0.001, <0.001, and 0.001, respectively), with the GA group exhibiting higher membrane expression rates than the GPL group (P=0.036). Additionally, the cytoplasmic expression rates in the GSD and GC groups were higher than in the GI (P=0.08 and 0.022) and GA groups (P=0.007 and 0.021), with the GC group showing higher membrane and cytoplasmic co-expression rates compared to the GI, GA, and GPL groups (P=0.002, 0.002, and 0.015, respectively). The GSD group also had higher membrane and cytoplasmic co-expression rates than the GA group (P=0.020). In the gastric pits, the membrane expression rates in the GI and GA groups were higher than in the GC group (P=0.004 and 0.008), while the cytoplasmic expression rates in the GSD and GC groups were higher than in the GI group (P=0.028 and 0.001) and the GC group had higher cytoplasmic expression rates than the GA group (P=0.009). In the lamina propria, the cytoplasmic expression rates in the GSD and GC groups were higher than in the GI (P=0.012 and 0.001) and GA groups (P=0.044 and 0.005), with the GC group showing higher cytoplasmic expression rates than the GPL group (P=0.049). The GA group exhibited higher membrane and cytoplasmic co-expression rates than the GC group (P=0.029). Overall, as the malignancy of the gastric mucosa progressed, E-cadherin protein expression shifted from membrane expression to combined membrane and cytoplasmic expression and then predominantly to cytoplasmic expression.
Finally, we investigated the E-cadherin protein expression levels among different pathological groups. The results (Figure 5C) indicated significant differences in E-cadherin protein expression, with higher levels in the GA and GSD compared to the GC group (P=0.041 and 0.004) and higher levels in the GA compared to the GI group (P=0.028). In Hp-positive subjects, the GA group showed higher E-cadherin protein expression levels than the NOR, GI, GPL, and GC groups (P=0.009, 0.011, 0.031, and 0.001, respectively), whereas no significant differences were observed among Hp-negative subjects (P=0.576). These preliminary findings suggest that Hp infection may influence E-cadherin protein expression to some extent.
3.5 Multivariant logistic regression analysis
To further investigate the effects of the CDH1 gene (rs16260) SNP, CDH1 mRNA transcription levels, and E-cadherin protein localization on the benign and malignant pathological evolution of the gastric mucosa, a multivariate logistic regression analysis was performed. The results indicated that overexpression of CDH1 mRNA significantly increased the risk of developing GC (OR=1.37, 95% CI: 1.01-1.85). Aberrant expression of E-cadherin protein significantly increased the risk of developing GPL, GSD, and GC. Specifically, in the epithelial region, E-cadherin cytoplasmic ectopic expression increased the risk of GSD and GC by 20.53 (OR=20.53, 95% CI: 2.41-174.70) and 16.80 times (OR=16.80, 95% CI: 2.07-136.49), respectively. Membrane and cytoplasmic co-expression increased the risk of GSD and GC by 9.33 (OR=9.33, 95% CI: 1.81-48.24) and 10.64 times (OR=10.64, 95% CI: 2.25-50.31), respectively. In the crypt region, E-cadherin cytoplasmic ectopic expression significantly increased the risk of developing GC (OR=6.42, 95% CI: 1.33-31.03). In the lamina propria, E-cadherin cytoplasmic ectopic expression increased the risk of developing GPL, GSD, and GC by 1.27 (OR=1.27, 95% CI: 1.21-8.84), 1.82 (OR=1.82, 95% CI: 2.14-36.37), and 1.64 times (OR=1.64, 95% CI: 1.49-14.47), respectively (Table 3).
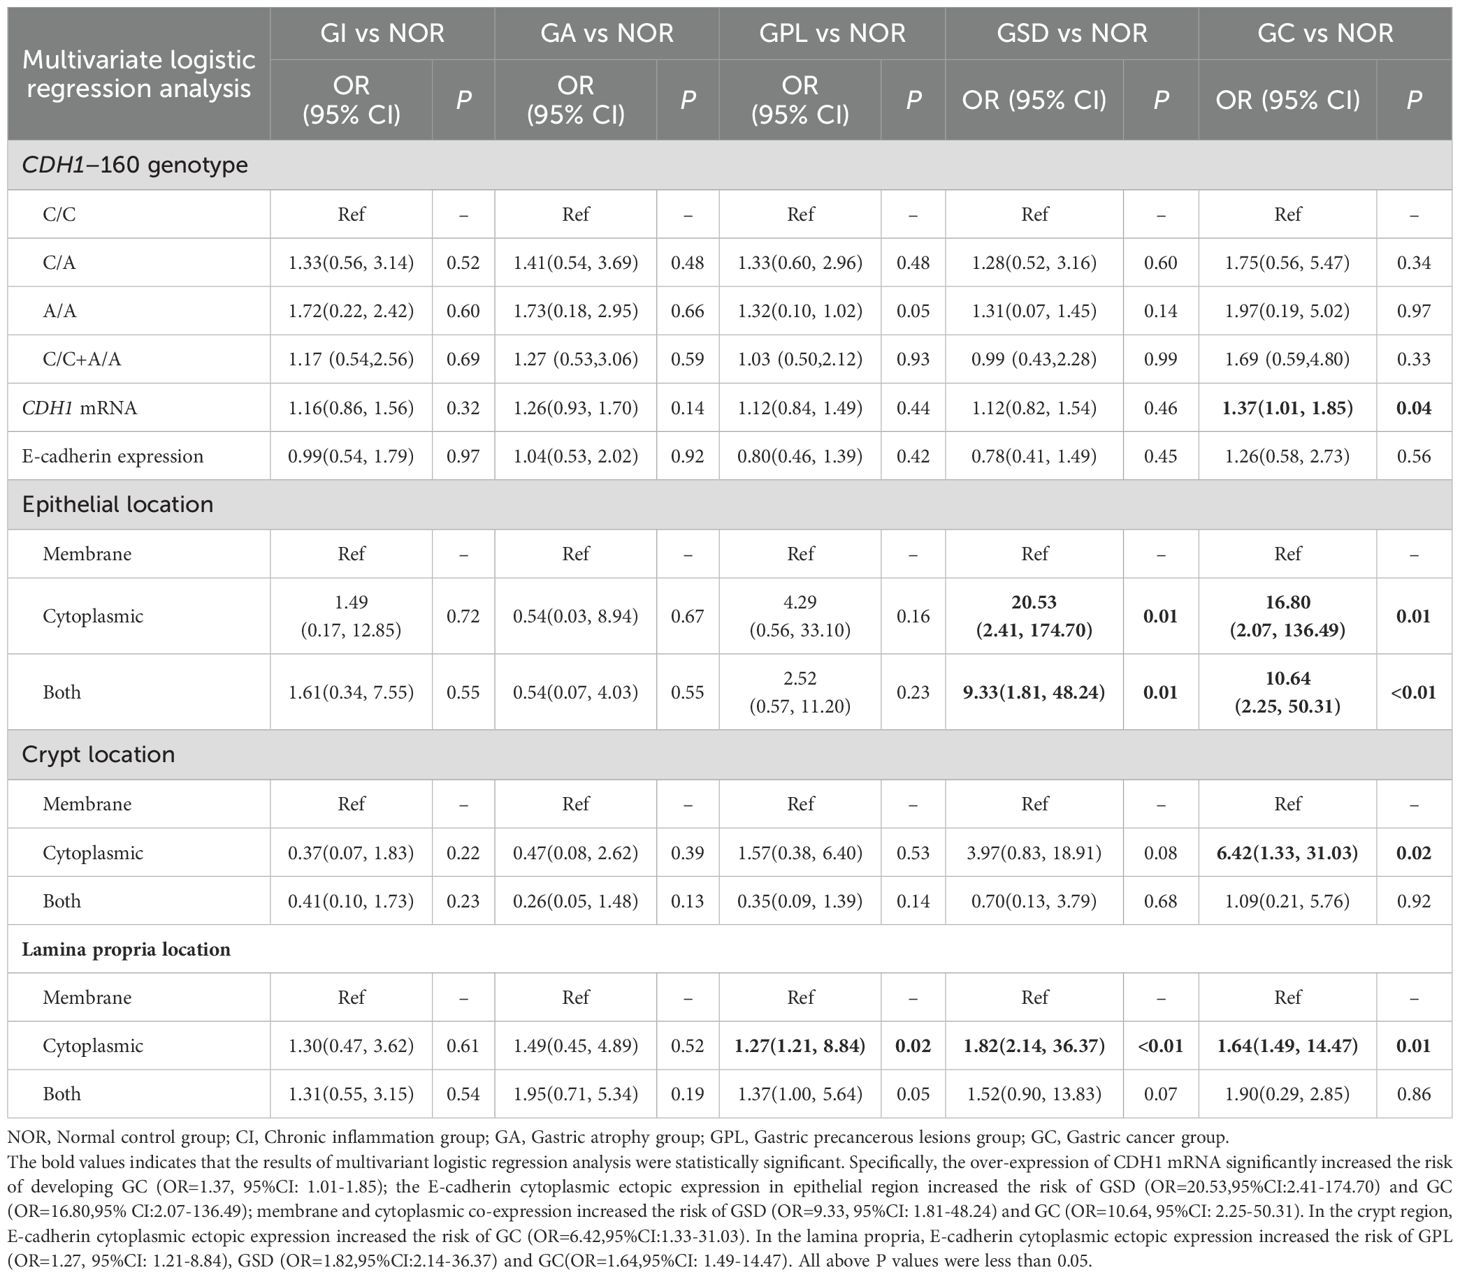
Table 3. Multivariable logistic regression analysis.
3.6 Statistical power analysis
To examine the statistical power of the study, post-hoc power analysis was conducted (Supplementary File 2). Post-hoc power analysis revealed that among the 18 statistically significant results, 12 exhibited strong power (power >80%), 6 had moderate power (power 60-80%). This indicates that our findings were supported by sufficient statistical power to detect clinically meaningful effects.
4 Discussion
This study investigated the impact of CDH1-160C>A gene (rs16260) polymorphism, CDH1 gene mRNA transcription levels, and the differential qualitative localization of its protein, E-cadherin, on gastric mucosal pathology progression. Power analysis showed sufficient statistical power to detect clinically meaningful effects.
The CDH1-160C>A (rs16260) polymorphism, located in the promoter region of the gene, can influence gene expression levels and has been associated with various cancers, including breast, bladder, and ovarian cancer (11–13). Previous studies on the association between CDH1-160C>A polymorphism and gastric cancer have yielded conflicting results. Al-Moundhri et al. found that the CDH1–160 A/A genotype increased the risk of gastric cancer in the Omani population (14), whereas Menbari et al. reported no significant association between this polymorphism and gastric cancer risk in the Kurdish population (15). A meta-analysis involving 6,399 subjects suggested that the CDH1–160 A allele might serve as a protective factor against gastric cancer in Asian populations (OR=0.67), but no such association was found in Caucasian populations (18). Our study indicated no statistically significant differences in genotype distribution among different pathological groups, regardless of Hp infection status, and no GC related risk was found on this SNP in Chinese. This disparity may be attributed to differences in genetic background, as populations from various ethnic or geographic regions may exhibit different genetic predispositions affecting the correlation between CDH1-160C>A polymorphism and gastric cancer risk. Additionally, environmental and lifestyle factors, including dietary habits, smoking, alcohol consumption, and other lifestyle elements, may influence gastric cancer risk and potentially confound or obscure the relationship between CDH1-160C>A polymorphism and gastric cancer susceptibility.
mRNA transcription serves as a critical bridge between genes and proteins, directly influencing protein synthesis and playing a significant role in the progression and prognosis of various cancers. Our results demonstrated significant differences in CDH1 mRNA transcription levels among different pathological groups, with notably higher levels in the GC group compared to the NOR and GPL groups. Overexpression of CDH1 mRNA was associated with an increased risk of developing GC, which contrasts with the findings of Rossi et al., who reported significantly lower CDH1 transcription levels in gastric cancer tissues compared to normal tissues (19). However, some studies have suggested that compensatory upregulation of CDH1 gene expression may occur in the early stages of certain cancers (20), potentially as an adaptive response by cancer cells to maintain a degree of cell adhesion, specific to the tumor microenvironment or cancer progression stage. Our study also found lower CDH1 transcription levels in intestinal gastric mucosal tissues compared to non-intestinal tissues. Loss of E-cadherin protein expression is a hallmark of epithelial-mesenchymal transition (EMT) (21), a process wherein cells lose adhesion properties and acquire increased invasiveness and metastatic potential. The alterations in gastric mucosal epithelium during intestinal metaplasia may modify the cellular environment, promoting EMT formation and contributing synergistically to gastric cancer development.
As a tumor suppressor, E-cadherin can inhibit cancer cell proliferation and metastasis through various pathways, and its loss is associated with the progression of multiple cancers (22). Our findings showed that in the presence of Hp infection, the expression rate of E-cadherin protein in the gastric pits of severe dysplasia and cancerous gastric mucosa was higher than in other pathological tissues. As the severity of gastric mucosal lesions increased, the expression rate of E-cadherin protein also rose, with no significant changes observed in the epithelial and glandular regions of the lamina propria. The gastric pits represent a transitional zone from the mucus neck region to the epithelial surface, containing a high density of stem cells responsible for repairing damaged gastric mucosa (23). Due to the high cellular activity and weak adhesion in this area, E-cadherin protein expression is typically low. Murata et al. found that CagA, a factor released by Hp, can interact with E-cadherin protein, disrupting the E-cadherin/β-catenin complex, leading to β-catenin activation and transformation of epithelial cells from a gastric to an intestinal phenotype (24). Consequently, we hypothesize that Hp infection damages the gastric mucosa, prompting a proliferative response in stem cells within the gastric pits to repair the damage. Concurrently, Hp’s virulence factors may impair E-cadherin function, resulting in compensatory upregulation of E-cadherin protein expression. This dual influence of Hp infection and loss of E-cadherin adhesion function significantly increases the risk of intestinal metaplasia, dysplasia, and carcinogenesis in the gastric mucosa.
Many researchers have focused solely on the differences in E-cadherin protein expression between gastric cancer tissues and normal tissues, concluding that the loss of E-cadherin protein is closely associated with the occurrence, classification, differentiation, metastasis, and prognosis of gastric cancer (9, 25). Our study, however, revealed that during the benign-to-malignant pathological progression of the gastric mucosa, E-cadherin protein expression exhibits an initial increase followed by a decrease. Specifically, E-cadherin protein expression increases from normal gastric mucosa to atrophic and dysplastic stages, but decreases once the pathology advances to the cancerous stage. The progression of gastric mucosal carcinogenesis involves the loss of contact inhibition, uncontrolled proliferation, loss of cell polarity, reduced or absent adhesion function, and increased invasiveness (9, 26). As an epithelial adhesion molecule, E-cadherin mediates intercellular adhesion, inhibiting abnormal proliferation and metastasis (27).
Moreover, E-cadherin regulates multiple signaling pathways, such as promoting the expression of p27 to inhibit cdk-cyclin activity, upregulating the Egr1 gene, promoting PTEN transcription, and inhibiting the PI3K/Akt signaling pathway, thereby suppressing malignant proliferation and differentiation of cells (28, 29). Through the Hippo pathway and RTK/SRC family kinase signaling pathways, E-cadherin mediates contact inhibition, preventing tumor cell proliferation and metastasis (30, 31). We speculate that in the early stages of gastric mucosal lesions, E-cadherin protein expression may be upregulated to exert its tumor-suppressive function compensatively. However, as the disease progresses and the severity of Hp infection and cellular malignancy increases, the expression of E-cadherin protein gradually decreases, potentially contributing to the loss of normal physiological function in cells.
Mature E-cadherin protein is located on the cell membrane, spanning inside and outside the cell, and comprises three parts: the intracellular domain, the transmembrane region, and the extracellular domain (32). The intracellular domain connects with the actin cytoskeleton by binding to various catenin (α, β, P120), mediating multiple signaling pathways that regulate cell growth and differentiation. The extracellular domain facilitates intercellular adhesion and maintains epithelial integrity (33, 34). Our findings indicated that as the pathological severity of the gastric mucosa increased, E-cadherin protein expression on the cell membrane in the epithelial, gastric pit, and lamina propria regions gradually decreased, while its cytoplasmic expression increased. Regression analysis demonstrated that the E-cadherin ectopic expression from the membrane to the cytoplasm significantly increased the risk of premalignant lesions and cancer in the gastric mucosa. Coupled with the finding that E-cadherin expression does not decrease but rather increases in the early stages of gastric mucosal lesions, we hypothesize that the E-cadherin ectopic expression might be a crucial factor in early gastric carcinogenesis.
However, several limitations also exist. Firstly, the sample sizes in different pathological groups were unbalanced, and were relatively small such GC Group (N=24), which may lower the statistical power. Although we conducted the power analysis to minimize the bias, a large cohort’s replication was still needed in the future.
5 Conclusion
The A allele of the CDH1 gene rs16260 locus show no effect in gastric mucosal pathological evolution, while the elevated mRNA transcription levels potentially increasing the risk of gastric cancer. The loss and ectopic expression of E-cadherin may be significant risk factors for malignant transformation in the gastric mucosa.
Data availability statement
All relevant data is contained within the article. The original contributions presented in the study are included in the article/Supplementary Material, further inquiries can be directed to the corresponding author.
Ethics statement
The studies involving humans were approved by Ethics Committee of the First Affiliated Hospital of Guangzhou University of Chinese Medicine. The studies were conducted in accordance with the local legislation and institutional requirements. The participants provided their written informed consent to participate in this study.
Author contributions
YW: Data curation, Project administration, Software, Writing – original draft, Writing – review & editing. YZ: Investigation, Project administration, Supervision, Writing – review & editing. YD: Investigation, Project administration, Supervision, Writing – review & editing. QL: Project administration, Resources, Supervision, Writing – review & editing. SL: Project administration, Resources, Supervision, Writing – review & editing. XC: Investigation, Project administration, Supervision, Writing – review & editing. WC: Supervision, Validation, Writing – review & editing. RL: Supervision, Validation, Writing – review & editing. LH: Conceptualization, Funding acquisition, Methodology, Supervision, Validation, Writing – review & editing.
Funding
The author(s) declare that financial support was received for the research and/or publication of this article. This work was funded by the National Natural Science Foundation of China (No. 82174298, 81774238, and 81373563).
Conflict of interest
The authors declare that the research was conducted in the absence of any commercial or financial relationships that could be construed as a potential conflict of interest.
Generative AI statement
The author(s) declare that no Generative AI was used in the creation of this manuscript.
Publisher’s note
All claims expressed in this article are solely those of the authors and do not necessarily represent those of their affiliated organizations, or those of the publisher, the editors and the reviewers. Any product that may be evaluated in this article, or claim that may be made by its manufacturer, is not guaranteed or endorsed by the publisher.
Supplementary material
The Supplementary Material for this article can be found online at: https://www.frontiersin.org/articles/10.3389/fonc.2025.1590680/full#supplementary-material
References
1. Sung H, Ferlay J, Siegel RL, Laversanne M, Soerjomataram I, Jemal A, et al. Global cancer statistics 2020: GLOBOCAN estimates of incidence and mortality worldwide for 36 cancers in 185 countries. CA Cancer J Clin. (2021) 71:209–49. doi: 10.3322/caac.21660
2. Smyth EC, Nilsson M, Grabsch HI, van Grieken NC, Lordick F. Gastric cancer. Lancet. (2020) 396:635–48. doi: 10.1016/S0140-6736(20)31288-5
3. Megraud F, Bessede E, Varon C. Helicobacter pylori infection and gastric carcinoma. Clin Microbiol Infect. (2015) 21:984–90. doi: 10.1016/j.cmi.2015.06.004
4. Gumbiner BM. Regulation of cadherin-mediated adhesion in morphogenesis. Nat Rev Mol Cell Biol. (2005) 6:622–34. doi: 10.1038/nrm1699
5. Bruun J, Eide PW, Bergsland CH, Bruck O, Svindland A, Arjama M, et al. E-cadherin is a robust prognostic biomarker in colorectal cancer and low expression is associated with sensitivity to inhibitors of topoisomerase, aurora, and HSP90 in preclinical models. Mol Oncol. (2022) 16:2312–29. doi: 10.1002/1878-0261.13159
6. Padmanaban V, Krol I, Suhail Y, Szczerba BM, Aceto N, Bader JS, et al. E-cadherin is required for metastasis in multiple models of breast cancer. Nature. (2019) 573:439–44. doi: 10.1038/s41586-019-1526-3
7. Dong LL, Liu L, Ma CH, Li JS, Du C, Xu S, et al. E-cadherin promotes proliferation of human ovarian cancer cells in vitro via activating MEK/ERK pathway. Acta Pharmacol Sin. (2012) 33:817–22. doi: 10.1038/aps.2012.30
8. Yuan W, Chen Z, Wu S, Ge J, Chang S, Wang X, et al. Expression of EphA2 and E-cadherin in gastric cancer: correlated with tumor progression and lymphogenous metastasis. Pathol Oncol Res. (2009) 15:473–8. doi: 10.1007/s12253-008-9132-y
9. Xing X, Tang YB, Yuan G, Wang Y, Wang J, Yang Y, et al. The prognostic value of E-cadherin in gastric cancer: a meta-analysis. Int J Cancer. (2013) 132:2589–96. doi: 10.1002/ijc.v132.11
10. Pisignano G, Napoli S, Magistri M, Mapelli SN, Pastori C, Di Marco S, et al. A promoter-proximal transcript targeted by genetic polymorphism controls E-cadherin silencing in human cancers. Nat Commun. (2017) 8:15622. doi: 10.1038/ncomms15622
11. Kang S, Li Y, Li B, Wang N, Zhou RM, Zhao XW. Genetic variation of the E-cadherin gene is associated with primary infertility in patients with ovarian endometriosis. Fertil Steril. (2014) 102:1149–54.e1. doi: 10.1016/j.fertnstert.2014.07.005
12. Ma YY, Wu WQ, Liu ZC, Yu XF, Guo K, He QW, et al. The CDH1 -160C/A polymorphism is associated with breast cancer: evidence from a meta-analysis. World J Surg Oncol. (2016) 14:169. doi: 10.1186/s12957-016-0927-0
13. Qiu LX, Li RT, Zhang JB, Zhong WZ, Bai JL, Liu BR, et al. The E-cadherin (CDH1)–160 C/A polymorphism and prostate cancer risk: a meta-analysis. Eur J Hum Genet. (2009) 17:244–9. doi: 10.1038/ejhg.2008.157
14. Al-Moundhri MS, Al-Khanbashi M, Al-Kindi M, Al-Nabhani M, Burney IA, Al-Farsi A, et al. Association of E-cadherin (CDH1) gene polymorphisms and gastric cancer risk. World J Gastroenterol. (2010) 16:3432–6. doi: 10.3748/wjg.v16.i27.3432
15. Menbari MN, Nasseri S, Menbari N, Mehdiabadi R, Alipur Y, Roshani D. The -160 (C>A) CDH1 gene promoter polymorphism and its relationship with survival of patients with gastric cancer in Kurdistan. Asian Pac J Cancer Prev. (2017) 18:1561–5. doi: 10.22034/APJCP.2017.18.6.1561
16. Stolte M, Meining A. The updated Sydney system: classification and grading of gastritis as the basis of diagnosis and treatment. Can J Gastroenterol. (2001) 15:591–8. doi: 10.1155/2001/367832
17. Sugano K, Tack J, Kuipers EJ, Graham DY, El-Omar EM, Miura S, et al. Kyoto global consensus report on Helicobacter pylori gastritis. Gut. (2015) 64:1353–67. doi: 10.1136/gutjnl-2015-309252
18. Li YL, Tian Z, Zhang JB, Fu BY. CDH1 promoter polymorphism and stomach cancer susceptibility. Mol Biol Rep. (2012) 39:1283–6. doi: 10.1007/s11033-011-0860-9
19. Rossi T, Tedaldi G, Petracci E, Abou KR, Ranzani GN, Morgagni P, et al. E-cadherin downregulation and microRNAs in sporadic intestinal-type gastric cancer. Int J Mol Sci. (2019) 20(18):4452. doi: 10.3390/ijms20184452
20. Xie D, Chen Y, Wan X, Li J, Pei Q, Luo Y, et al. The potential role of CDH1 as an oncogene combined with related miRNAs and their diagnostic value in breast cancer. Front Endocrinol (Lausanne). (2022) 13:916469. doi: 10.3389/fendo.2022.916469
21. Kalluri R, Weinberg RA. The basics of epithelial-mesenchymal transition. J Clin Invest. (2009) 119:1420–8. doi: 10.1172/JCI39104
22. Na TY, Schecterson L, Mendonsa AM, Gumbiner BM. The functional activity of E-cadherin controls tumor cell metastasis at multiple steps. Proc Natl Acad Sci U S A. (2020) 117:5931–7. doi: 10.1073/pnas.1918167117
23. Burclaff J, Willet SG, Saenz JB, Mills JC. Proliferation and differentiation of gastric mucous neck and chief cells during homeostasis and injury-induced metaplasia. Gastroenterology. (2020) 158:598–609.e5. doi: 10.1053/j.gastro.2019.09.037
24. Murata-Kamiya N, Kurashima Y, Teishikata Y, Yamahashi Y, Saito Y, Higashi H, et al. Helicobacter pylori CagA interacts with E-cadherin and deregulates the beta-catenin signal that promotes intestinal transdifferentiation in gastric epithelial cells. Oncogene. (2007) 26:4617–26. doi: 10.1038/sj.onc.1210251
25. Im S, Cho YK, Kang D, Shin GY, Jung ES, Song KY, et al. Combined high NEDD9 expression and E-cadherin loss correlate with poor clinical outcome in gastric cancer. J Gastroenterol Hepatol. (2022) 37:2255–63. doi: 10.1111/jgh.v37.12
26. Mariette C, Carneiro F, Grabsch HI, van der Post RS, Allum W, de Manzoni G. Consensus on the pathological definition and classification of poorly cohesive gastric carcinoma. Gastric Cancer. (2019) 22:1–9. doi: 10.1007/s10120-018-0868-0
27. Jeanes A, Gottardi CJ, Yap AS. Cadherins and cancer: how does cadherin dysfunction promote tumor progression? Oncogene. (2008) 27:6920–9. doi: 10.1038/onc.2008.343
28. Lau MT, Klausen C, Leung PC. E-cadherin inhibits tumor cell growth by suppressing PI3K/Akt signaling via beta-catenin-Egr1-mediated PTEN expression. Oncogene. (2011) 30:2753–66. doi: 10.1038/onc.2011.6
29. St CB, Sheehan C, Rak JW, Florenes VA, Slingerland JM, Kerbel RS. E-Cadherin-dependent growth suppression is mediated by the cyclin-dependent kinase inhibitor p27(KIP1). J Cell Biol. (1998) 142:557–71. doi: 10.1083/jcb.142.2.557
30. Kim NG, Gumbiner BM. Adhesion to fibronectin regulates Hippo signaling via the FAK-Src-PI3K pathway. J Cell Biol. (2015) 210:503–15. doi: 10.1083/jcb.201501025
31. Kim NG, Koh E, Chen X, Gumbiner BM. E-cadherin mediates contact inhibition of proliferation through Hippo signaling-pathway components. Proc Natl Acad Sci U S A. (2011) 108:11930–5. doi: 10.1073/pnas.1103345108
32. Nagafuchi A, Shirayoshi Y, Okazaki K, Yasuda K, Takeichi M. Transformation of cell adhesion properties by exogenously introduced E-cadherin cDNA. Nature. (1987) 329:341–3. doi: 10.1038/329341a0
33. Okegawa T, Li Y, Pong RC, Hsieh JT. Cell adhesion proteins as tumor suppressors. J Urol. (2002) 167:1836–43. doi: 10.1016/S0022-5347(05)65245-7
Keywords: E-caderin, CDH1, gastric cancer, SNP, Helicobacer pylori
Citation: Wu Y, Zhang Y, Dai Y, Luo Q, Lan S, Chen X, Chen W, Li R and Hu L (2025) Role of CDH1 gene variants and E-cadherin localization in gastric mucosal cancerization. Front. Oncol. 15:1590680. doi: 10.3389/fonc.2025.1590680
Received: 10 March 2025; Accepted: 16 April 2025;
Published: 09 May 2025.
Edited by:
Luca Saragoni, Santa Maria delle Croci Hospital, ItalyReviewed by:
Junji Itou, National Cerebral and Cardiovascular Center, JapanHang Yin, University of Georgia, United States
Copyright © 2025 Wu, Zhang, Dai, Luo, Lan, Chen, Chen, Li and Hu. This is an open-access article distributed under the terms of the Creative Commons Attribution License (CC BY). The use, distribution or reproduction in other forums is permitted, provided the original author(s) and the copyright owner(s) are credited and that the original publication in this journal is cited, in accordance with accepted academic practice. No use, distribution or reproduction is permitted which does not comply with these terms.
*Correspondence: Ling Hu, ZHJodWxpbmdAMTYzLmNvbQ==