- 1Department of Epidemiology and Health Statistics, Dalian Medical University, Dalian, China
- 2Dalian Municipal Central Hospital, Central Hospital of Dalian University of Technology, Dalian, China
Background: Epithelial ovarian cancer(EOC) has a higher mortality and morbidity rate than other types, and it has a dramatic impact on the survival of ovarian cancer(OC) patients. Therefore, investigating, developing and validating prognostic models to predict overall survival(OS) in patients with epithelial ovarian cancer represents an area of research with significant clinical implications.
Methods: Patients with a confirmed diagnosis of epithelial ovarian cancer from 2010 to 2017 in The Surveillance, Epidemiology, and End Results(SEER) database were identified for enrollment based on inclusion and exclusion criteria(N=10902). Patients with epithelial ovarian cancer diagnosed from 2010 to 2022 were selected from Dalian Municipal Central Hospital as an external validation cohort based on the same criteria (N=116). COX proportional risk regression for screening independent prognostic factors. Survival outcomes were compared between different risk subgroups based on Kaplan-Meier analysis. Three predictive models were developed using machine learning(ML) techniques, and another was a nomogram based on COX proportional risk regression for estimating 3-year and 5-year overall survival in patients with epithelial ovarian cancer. Evaluation of several models based on multiple metrics including C-index, ROC curve, calibration curve and decision curve analysis (DCA).
Results: Through univariate and multivariate COX proportional risk regression analyses, we selected 12 significantly independent prognostic factors affecting overall survival (P<0.05). In conclusion, comparing several models cited, it was found that DeepSurv (Deep Survival) model had the best performance in both internal validation set and external validation set. The C-index for internal validation was 0.715, and the 3-year and 5-year ROC curves were 0.746 and 0.766; the C-index for external validation was 0.672, and the 3-year and 5-year ROC curves were 0.731 and 0.756.
Conclusion: This study successfully developed a nomogram and three machine learning models, which collectively served as important predictive instruments to support clinical decision making.
1 Introduction
Ovarian cancer, as the fourth leading cause of cancer-related deaths in women (1), is also the fifth leading cause of death after several other cancers such as lung and breast cancer (2). The histologic types of ovarian cancer are classified by the World Health Organization(WHO) into the following broad categories:epithelial, germ cell, gonadal mesenchymal, metastatic and others (3). Among these histological subtypes, epithelial ovarian cancer, accounting for the majority of all types, and demonstrates distinct histopathological features (4). Epithelial ovarian cancer is complex and can be subdivided into five histological subtypes, including high-grade serous OC(HGSOC), low-grade serous OC(LGSOC), clear cell OC (CCOC), endometrioid OC (EMOC) and mucinous OC (MCOC),among which HGSOC and LGSOC belong to serous ovarian cancer (SOC). Different histological subtypes are characterized by different clinical characteristics and molecular profiles. According to a prospective study, ovarian cancer patients with different histological subtypes were diagnosed at different stages according to The International Federation of Gynecology and Obstetrics (FIGO) staging system (5). Studies have shown that different molecular subtypes can result in different prognostic outcomes (6, 7). This emphasizes the importance of considering histological subtypes in the prognosis of OC patients (8). Over the past 30 years, the five year relative survival rate for all cancers has a significant improvement, increasing by 20%. However,despite recent diagnostic and therapeutic advancements. Even in resource-rich countries such as the United States, the 5-year survival rate among ovarian cancer patients is merely 47% (9). The common treatments for ovarian cancer today are surgery and chemotherapy treatments (10). The clinical management of epithelial ovarian cancer faces great challenges, mainly due to the lack of reliable early diagnostic symptoms and effective diagnostic indicators. This diagnostic limitation leads to 70-75% of epithelial ovarian cancer cases being identified at advanced stages, seriously affecting patients survival and posing substantial threats to women’s health (11). Meantime, the advanced-stage diagnosis of patients often leads to patients missing the optimal time for surgery. Furthermore, even when surgical treatment is implemented, the efficacy of radical surgery is less effective, ultimately contributing to the poor survival in epithelial ovarian cancer patients (12). Although advanced medical techniques and drug therapies have been adopted for patients, the 5-year survival rate of patients is still less than 50% (13). Every year, about 230000 people are diagnosed with epithelial ovarian cancer, resulting in 150000 deaths (14).
Currently, the application of machine learning models in predicting the prognosis of ovarian cancer remains relatively rare. Firstly, although previous studies have used six machine learning methods to predict the survival rate of ovarian cancer (15), and other studies have used ten machine learning methods to predict the impact of preoperative blood characteristics on the prognosis of ovarian cancer (16). However, there are relatively fewer studies on prediction based on deep learning(DL) models, and potential reasons for this phenomenon may be that deep learning is currently more widely applied in research on image recognition (17–19). Moreover, most existing studies have generally not performed external validation of cited models (3, 13). Therefore, it is crucial to find effective methods to predict the prognosis of patients with epithelial ovarian cancer. Our study not only applied deep learning-based models such as DeepSurv and DeepHit for models establishment and evaluation but also incorporated external validation data to enhance the clinical utility of the results.
Nomogram is a sophisticated tool that can be used to assess survival with great predictive accuracy compared to conventional staging systems (20). The perceptual machine model, which is the basis for the development of modern neural networks, was created by Rosenblatt in 1958 (21). Deep learning is a novel machine learning (ML) technique. It has advantages over other machine learning methods such as logistic regression in solving complex computational problems (22). Some event-time machine learning models such as DeepSurv, DeepHit and Random Survival Forest (RSF) and so on, have been demonstrated to have good prediction performance (23), but it is unclear how these models predict the prognosis of epithelial ovarian cancer.
The Surveillance, Epidemiology, and End Results database, established in the United States, is an official cancer database. It contains population-based clinical survival data from registries for 34.6% of the national population (24). Deep learning is an algorithm based on neural network. In our study, we constructed survival analysis models for predicting patients with epithelial ovarian cancer by applying data from the SEER database. We developed a nomogram and implemented three machine learning models (DeepSurv, DeepHit, RSF), while simultaneously identifying critical prognostic factors in epithelial ovarian cancer patients. This provides clinicians with a powerful tool for accurate prognostic prediction and individualized risk assessment when treating patients with epithelial ovarian cancer.
2 Materials and methods
2.1 Data sources
The SEER database is supported by the National Cancer Institute (NCI) and has been in existence since 1973 to the present. Patients diagnosed with ovarian cancer between 2010 and 2017 were identified from the SEER*Stat software (version 8.4.3, https://seer.cancer.gov/seerstat/) (25). These data were publicly accessible and do not require ethics committee review or approval and informed patient consent (2). The primary tumor site code was C56.9-Ovarian. Patients with epithelial ovarian cancer were selected according to the inclusion and exclusion criteria, the International Classification of Diseases of Oncology ICD-O-3 Morphologic codes “8441/3-8442/3,8460/3-8463/3,9014/3” were used to identify patients with serous ovarian cancer; “8470/3-8472,8480/3- 8482/3,9015/3” for identifying women with mucinous ovarian cancer; “8380/3-8382/3,8560/3,8570/3” for identifying patients with endometrioid/adenocarcinoma; “8310/3, 8313/3” for identifying women with clear cell ovarian cancer. Patients in the SEER database were randomly assigned to both the training cohort and the internal validation cohort in a 7:3 ratio. In addition, we collected data on epithelial ovarian cancer patients who met the same criteria from 2010 to 2022 from Dalian Municipal Central Hospital as an external validation cohort. All clinical information was anonymized before analysis, and the study was approved by the Medical Research Ethics Committee of Dalian Municipal Central Hospital (Ethics Approval No. YN2024-111-01).
2.2 Selection of enrolled cases
Inclusion criteria: (1) Patients were diagnosed with epithelial ovarian cancer by pathologic diagnosis. (2) Patients were stage I-IV according to FIGO stage. (3) All follow-up and clinical data of the patients were available. (4) The patients underwent surgery at the primary site.
Exclusion criteria: (1) The patient’s histologic type was non epithelial ovarian cancer. (2) Combination of malignant tumors in other sites. (3) Patients with incomplete follow-up time. (4) Missing clinical or follow-up data. (5) Only be proven at autopsy or death.
2.3 Data collection and processing
2.3.1 Data collection
We collected the following information on epithelial ovarian cancer patients in the SEER database: age at diagnosis, race, region of residence, marital status, serum CA125 level, surgery, tumor grade, histologic type, FIGO stage, T stage, N stage, tumor laterality, chemotherapy, bone metastasis, liver metastasis, brain metastasis, lung metastasis, survival time, survival status.
The following information on all enrolled patients was collected from Dalian Municipal Central Hospital: age at diagnosis, serum CA125 level, surgery, tumor grade, histologic type, FIGO stage, T stage, tumor laterality, chemotherapy, bone metastasis, liver metastasis, lung metastasis, survival time, survival status.
2.3.2 Data processing
Samples with missing data in the SEER database as well as in the clinical data were excluded from this study. Statistically significant variables(P<0.05) were identified by univariate and multivariate COX proportional risk regression, and the results of multivariate regression screening were included in the models as pretreatment variables for prediction.
2.4 Survival analysis model
In order to select meaningful indicators, we first conducted a univariate analysis based on COX proportional risk regression models (P<0.05). Meaningful indicators were then incorporated into the multifactorial analysis, not only to create a nomogram but also to incorporate them into survival analysis modes. The three machine learning models used in this study to perform survival analysis include the decision tree-based model Random Survival Forest (RSF) (26) and two deep learning based models [DeepHit (27) and DeepSurv (28)]. DeepSurv, a deep neural network framework built upon the Cox proportional hazards model. This method outperforms linear and nonlinear survival analysis methods in predicting patients risk. DeepHit represents a deep learning-based non-proportional hazards algorithm that employs multi-task learning to address competing events (23). RSF is a decision tree-based machine learning method for survival analysis. It can efficiently handle nonlinear effects, correlation parameters and variable interactions (29).
2.5 Statistical analysis
The patients data in this study were statistically analyzed using R software version 4.4.3 and Excel. Age was classified as young (<45 years), middle-aged (45–59 years), and old (≥60 years) according to the World Health Organization population age distribution. Categorical variables were expressed as counts and percentages, and baseline characteristics of the training and testing cohorts were compared using chi-square and Fisher’s exact tests. Comparison of survival rates in different risk groups of patients with epithelial ovarian cancer was based on Kaplan-Meier survival curves by R-studio 4.4.3 software. And the survival rates of the different groups were analyzed using the log-rank test. The rms, foreign, and survival packages in R software were used to create the nomogram, and we used the pyCOX package in python 3.9.0 to build the DeepSurv and DeepHit models, and the RandomForestSRC package in R software was used to build the RSF model. The calibration curves allowed assessment of the relationship between patients follow-up outcomes and predicted survival. Calibration curves were plotted using the rms R software package for assessing the calibration of the cited models, and Bootstrap methods were applied for repeat sampling (B =1000); ROC curves were plotted over time based on the use of the timeROC R package; and DCA decision curves were plotted using the ggDCA package for nomogram and different machine learning models (30, 31).
3 Results
3.1 Data on demographic and clinical characteristics
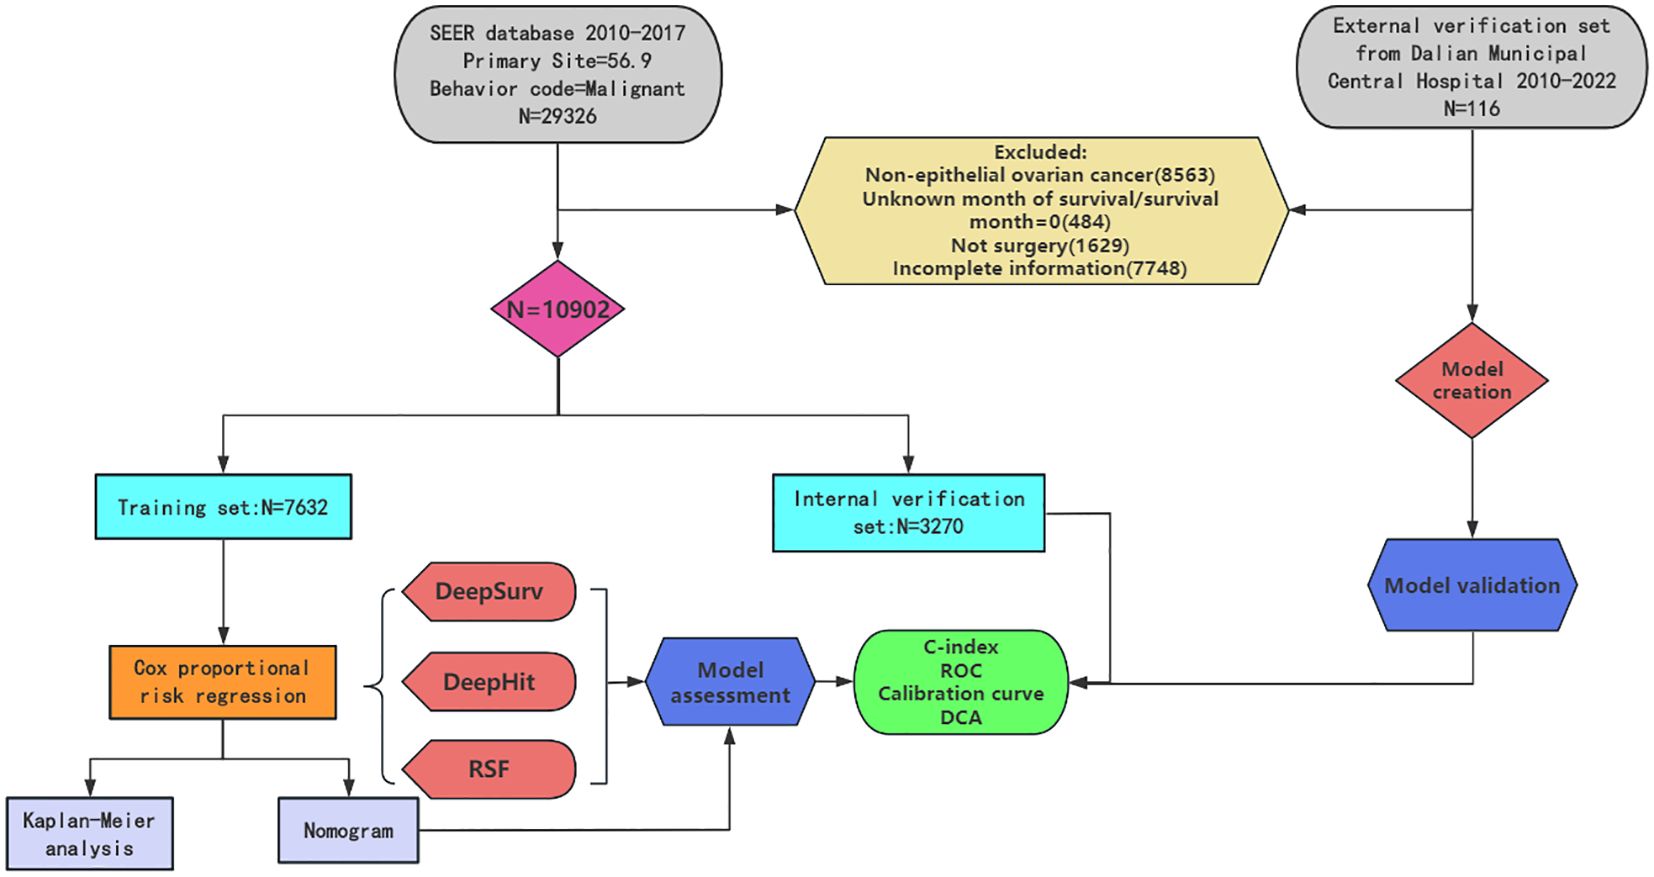
The demographic and clinical characteristics of the 10902 patients with primary epithelial ovarian cancer in the SEER database are presented in Table 1, which showed that 7632 patients were assigned to the training cohort and 3270 patients to the internal validation cohort by R-studio 4.4.3 software. There were no significant differences between the two cohorts in terms of demographic and clinicopathologic characteristics (P>0.05), which represents comparable data between the two cohorts. The distribution of age groups revealed that the majority of epithelial ovarian cancer patients were older (49.8%), with a higher percentage of married patients (80.2%), a high percentage of serum CA125 positivity (87.9%), more serous ovarian cancer (70.3%), most of them grade III/IV (73.7%), and FIGOIII-IV (63.6%). Only a few patients did not receive chemotherapy (17.3%). The flowchart and patients selection process for this study was shown in Figure 1.
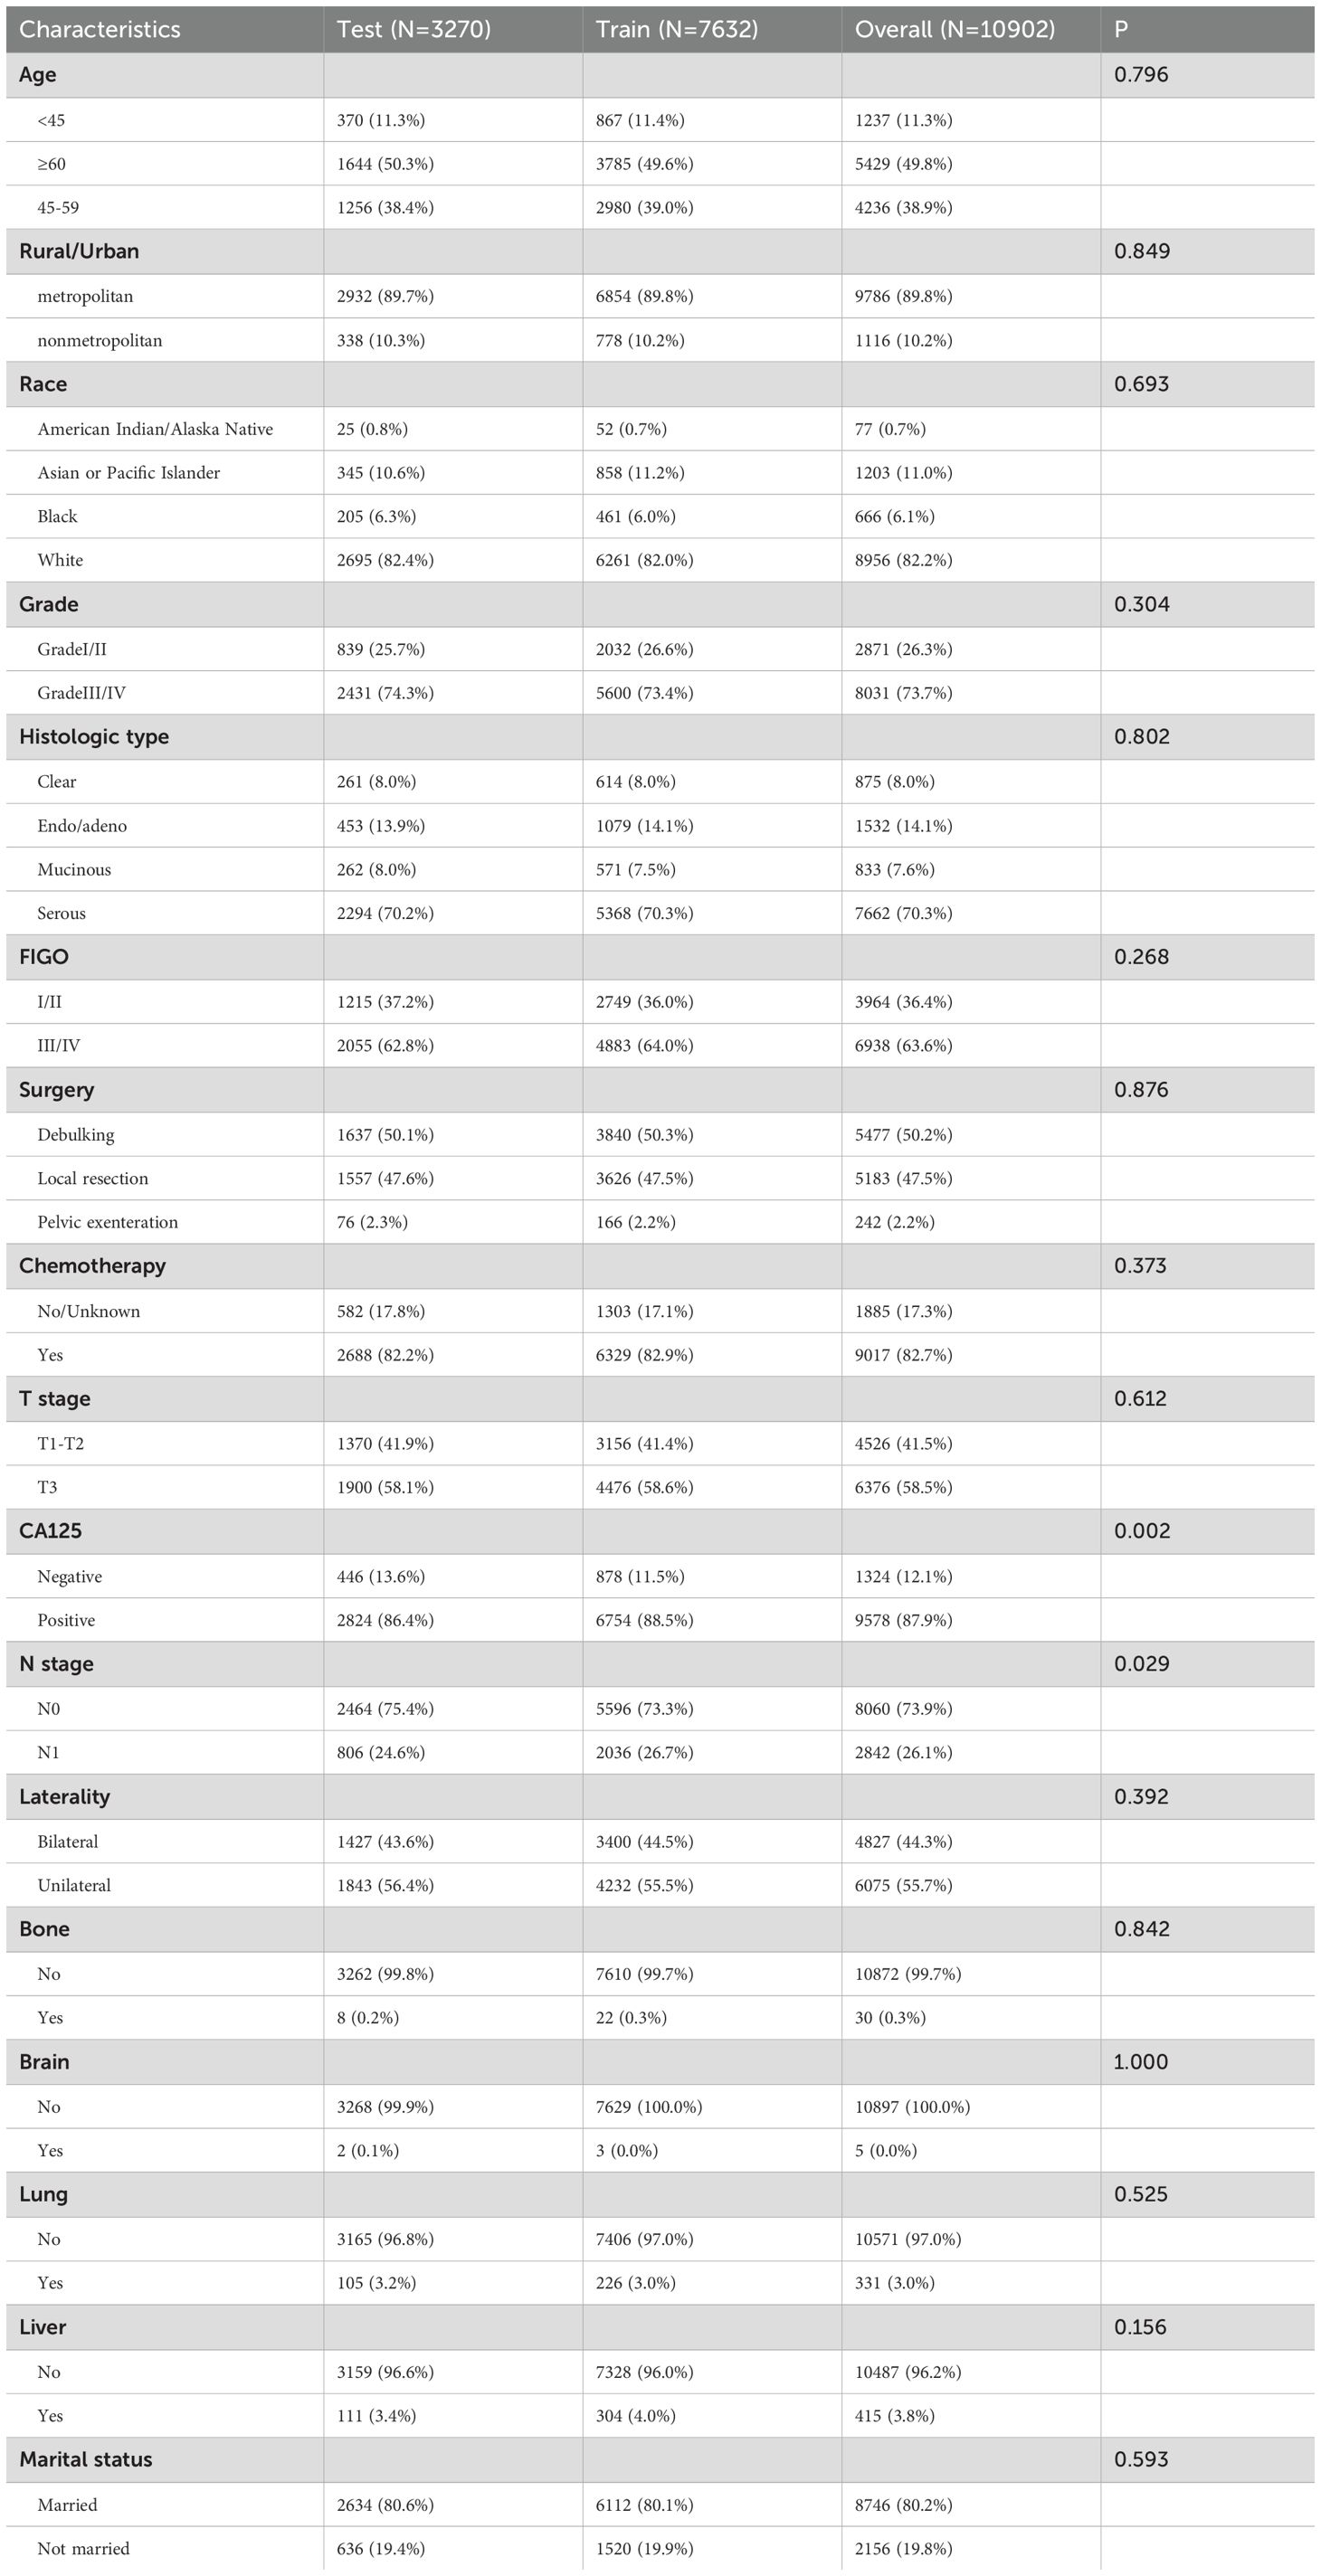
Table 1. General data on training and internal validation cohort for patients with epithelial ovarian cancer n (%).
3.2 Survival analysis
First, we performed univariate COX proportional risk regression analysis on data from the training cohort of patients with epithelial ovarian cancer to identify prognostic variables. And the results showed that age at diagnosis, serum CA125 level, surgery, tumor grade, histologic type, FIGO stage, T stage, N stage, tumor laterality, chemotherapy, marital status, and bone metastasis, liver metastasis, and lung metastasis were the risk factors (P<0.05). Subsequent multifactorial COX proportional risk regression analysis showed that age at diagnosis, serum CA125 level, surgery, tumor grade, histologic type, FIGO stage, T stage, tumor laterality, chemotherapy, and bone metastasis, liver metastasis, and lung metastasis were independent prognostic factors affecting the overall survival of patients (P < 0.05). The results of the univariate and multivariate COX proportional risk regressions were displayed in the Table 2.
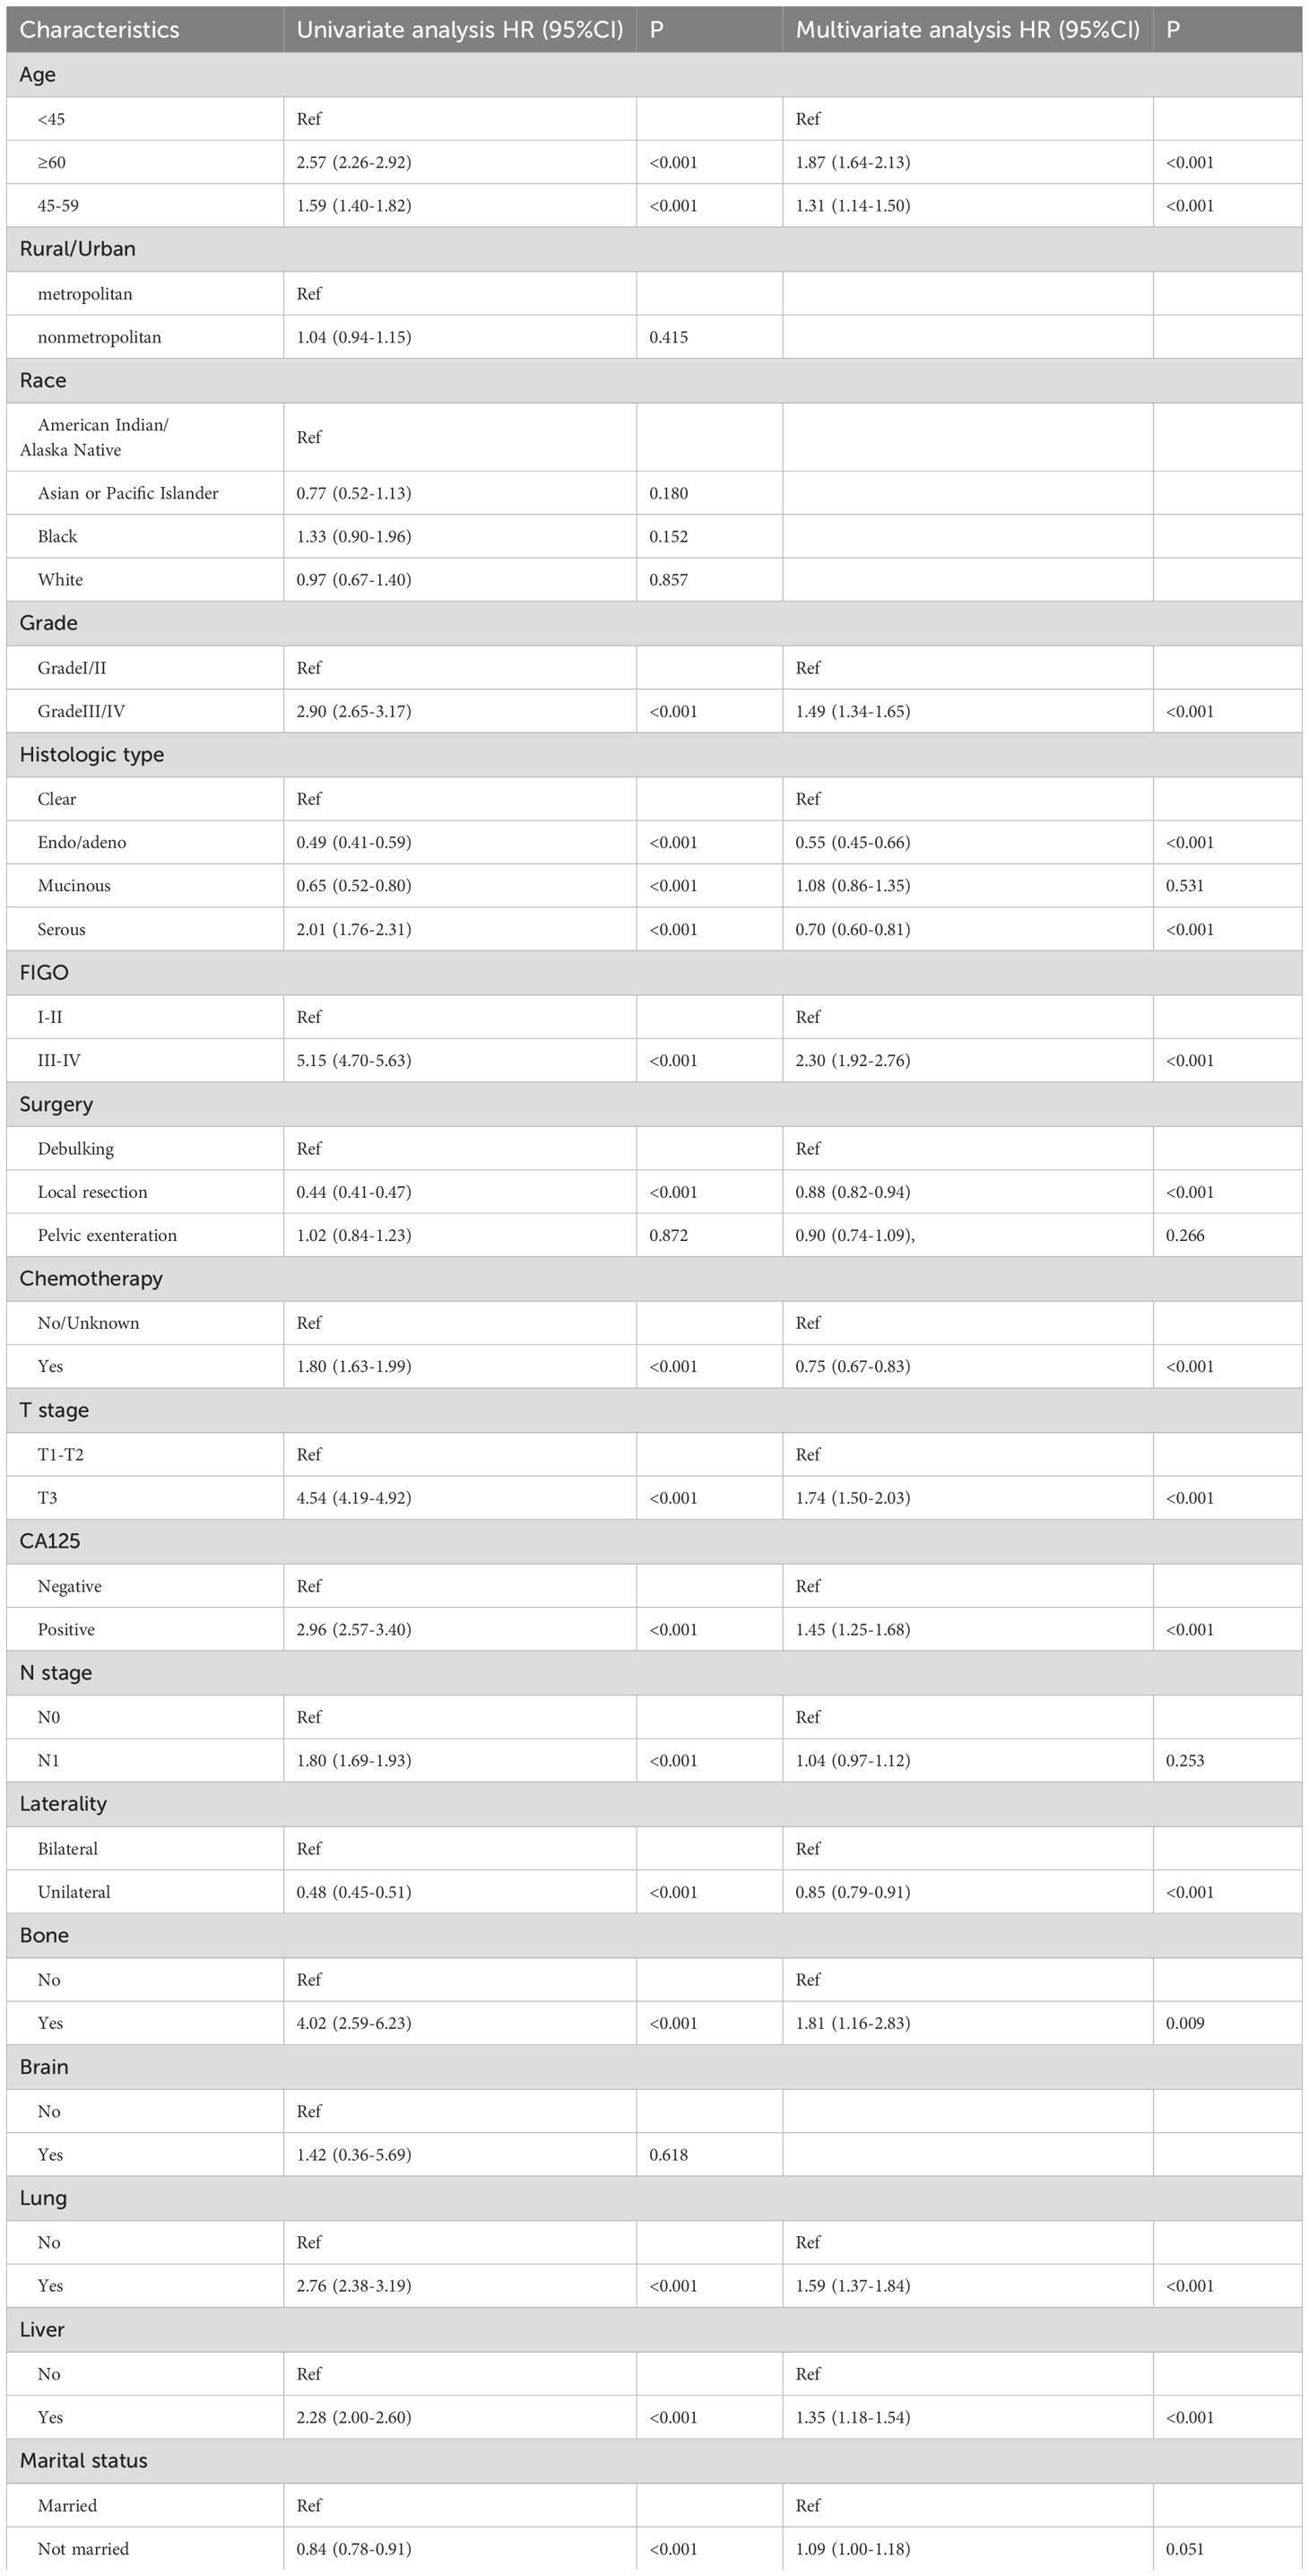
Table 2. Epithelial ovarian cancer patients performed univariate and multivariate COX proportional risk regression analyses on the training cohort of patients.
In addition, we used Kaplan-Meier analysis to assess 14 variables screened by univariate Cox risk regression in the training cohort. In the meantime, we performed Kaplan-Meier analysis of these 14 factors in our internal validation cohort. And the results were all shown in the Supplementary Material, with corresponding results for the training cohort and internal validation cohort designated in the Supplementary Figures 7 and 8.
3.3 Creation of nomogram
Variables screened in the multifactorial COX proportional risk regression(P < 0.05) were analyzed by applying R software to create a nomogram, and the result was presented in Figure 2. The nomogram was constructed based on COX proportional risk regression results. The results showed that the occurrence of FIGO stage contributed most to the nomogram, followed by histologic type. From our established nomogram, we found that patients with FIGO stage = III/IV had a higher risk of death than patients with FIGO stage of I/II, which was consistent with the finding that patients with advanced ovarian cancer have a worse prognosis. Risk scores were determined based on individual scores calculated using nomogram (32).
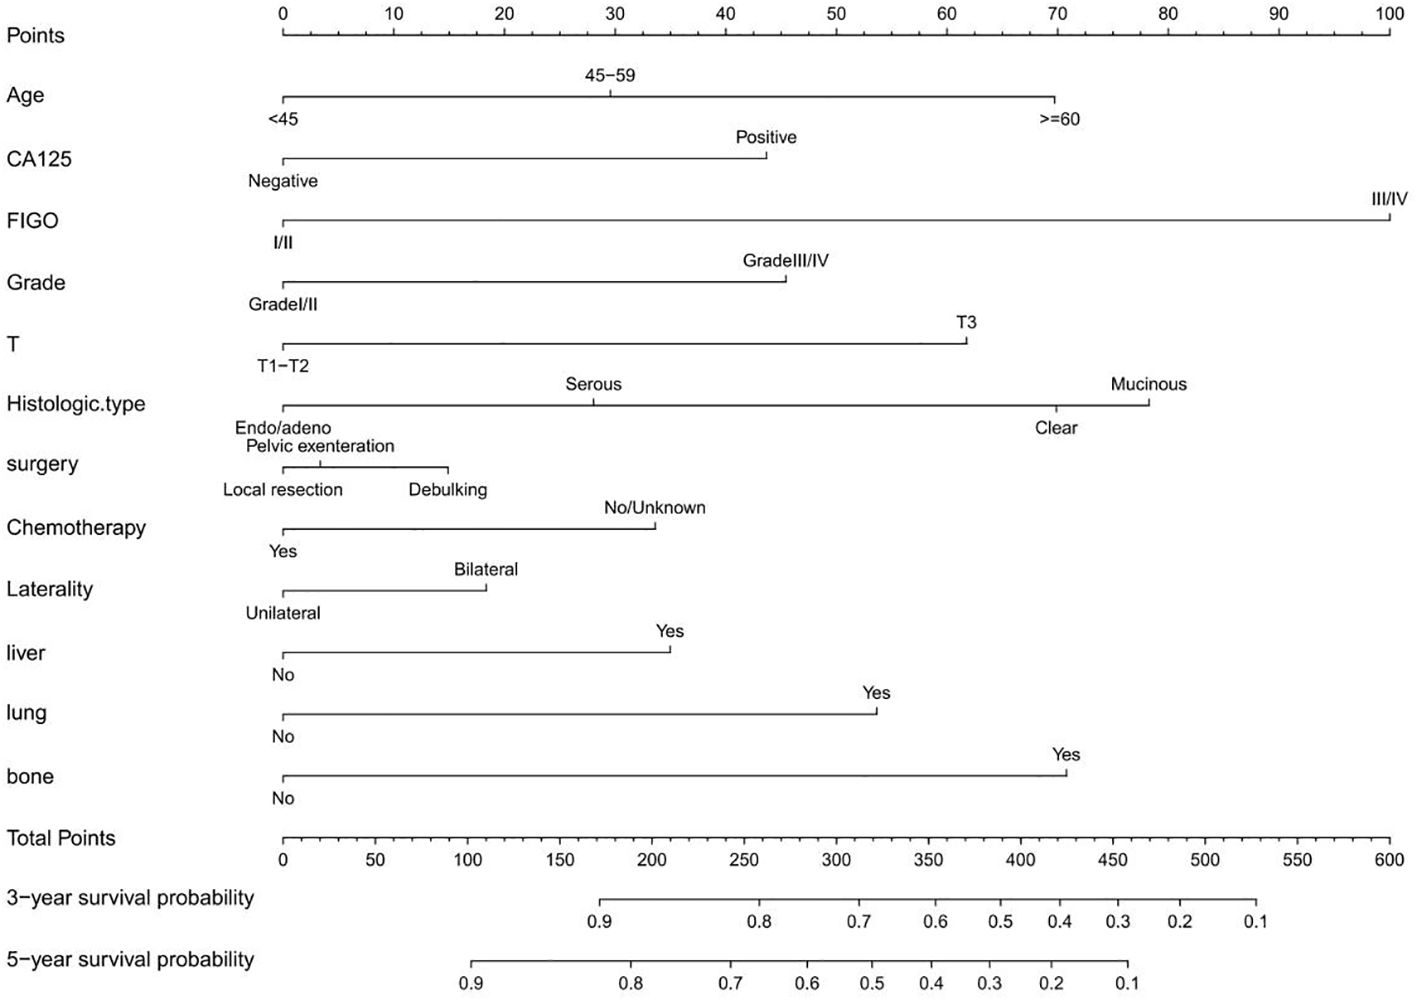
Figure 2. Nomogram of 3 year and 5 year survival prediction for patients with epithelial ovarian cancer.
3.4 Validation of nomogram
We utilized the internal validation cohort of the SEER database to validate the model built based on the training cohort, and the area under the ROC curve was used to evaluate the accuracy of the model in Figure 3. Calibration curves and DCA curves were showed in the Supplementary Figures 9 and 10 to assess the calibration and clinical utility of the model at 3-year and 5-year,respectively. The results of the study found that the C-index of the COX proportional risk regression model for the internal validation cohort and the external validation cohort were 0.711 and 0.664,respectively. Epithelial ovarian cancer patients from Dalian Municipal Central Hospital (N=116) were used as external validation, and the variable characteristics of the patients were shown in Table 3. Based on nomogram score, patients were categorized into high and low risk groups. According to Figure 4 survival curves plotted based on Kaplan-Meier analysis showed a significant difference in survival between the low and high risk groups (p<0.0001). Patients in the high risk group had significantly worse survival outcomes compared to low risk patients.
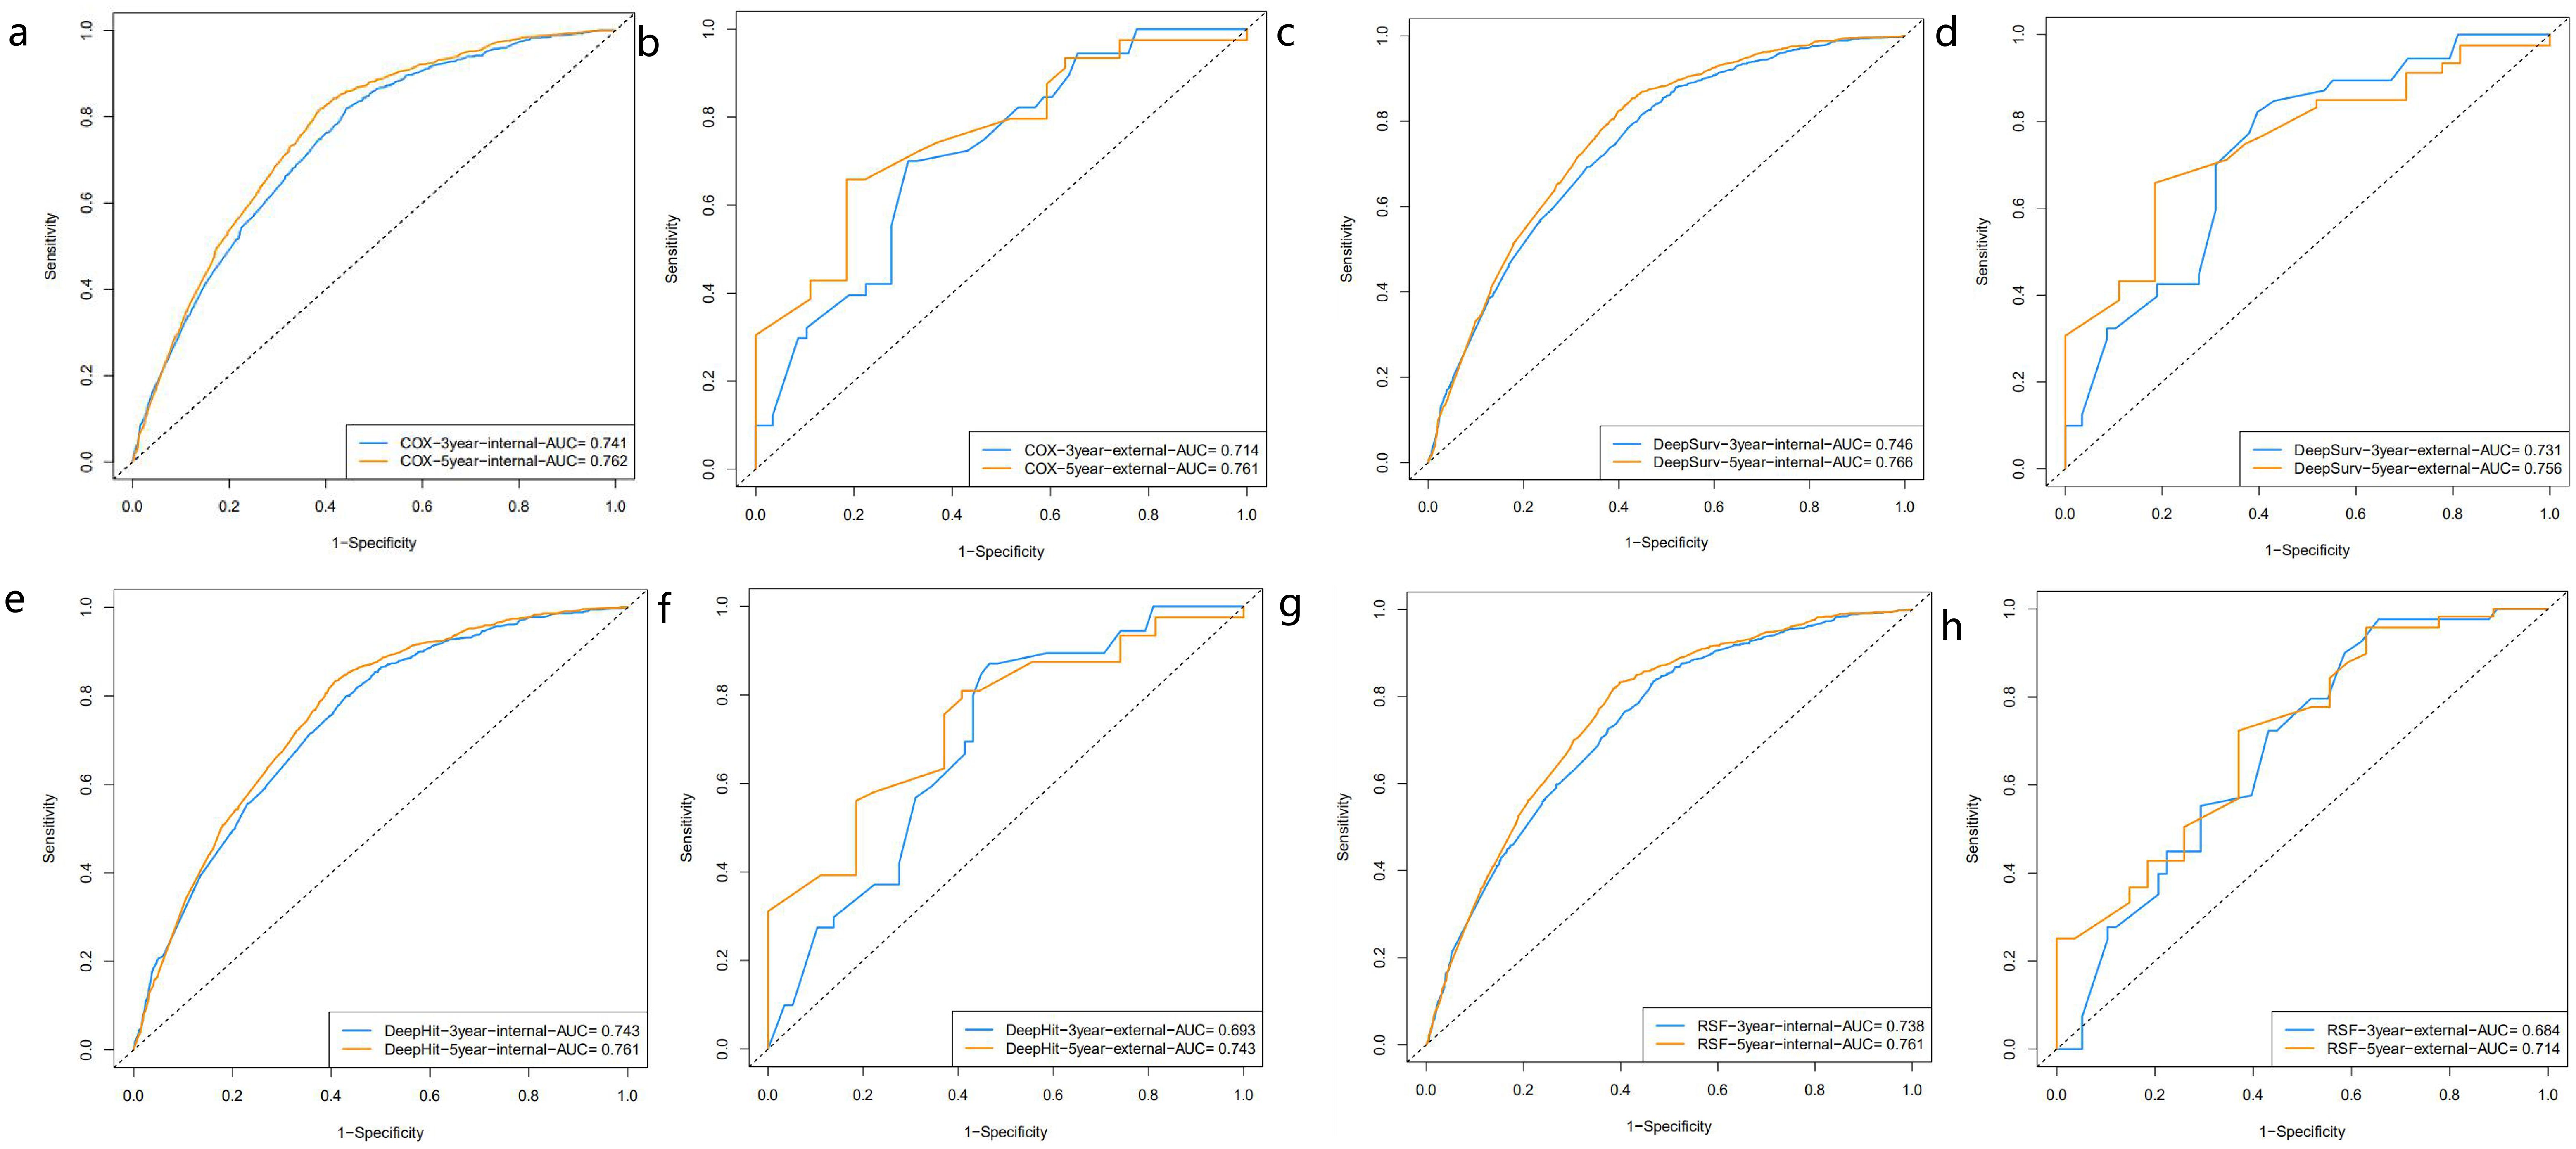
Figure 3. ROC curves of 3 year and 5 year survival prediction in patients with epithelial ovarian cancer [(a, c, e, g) are the internal validation cohort, (b, d, f, h) are the external validation cohort].
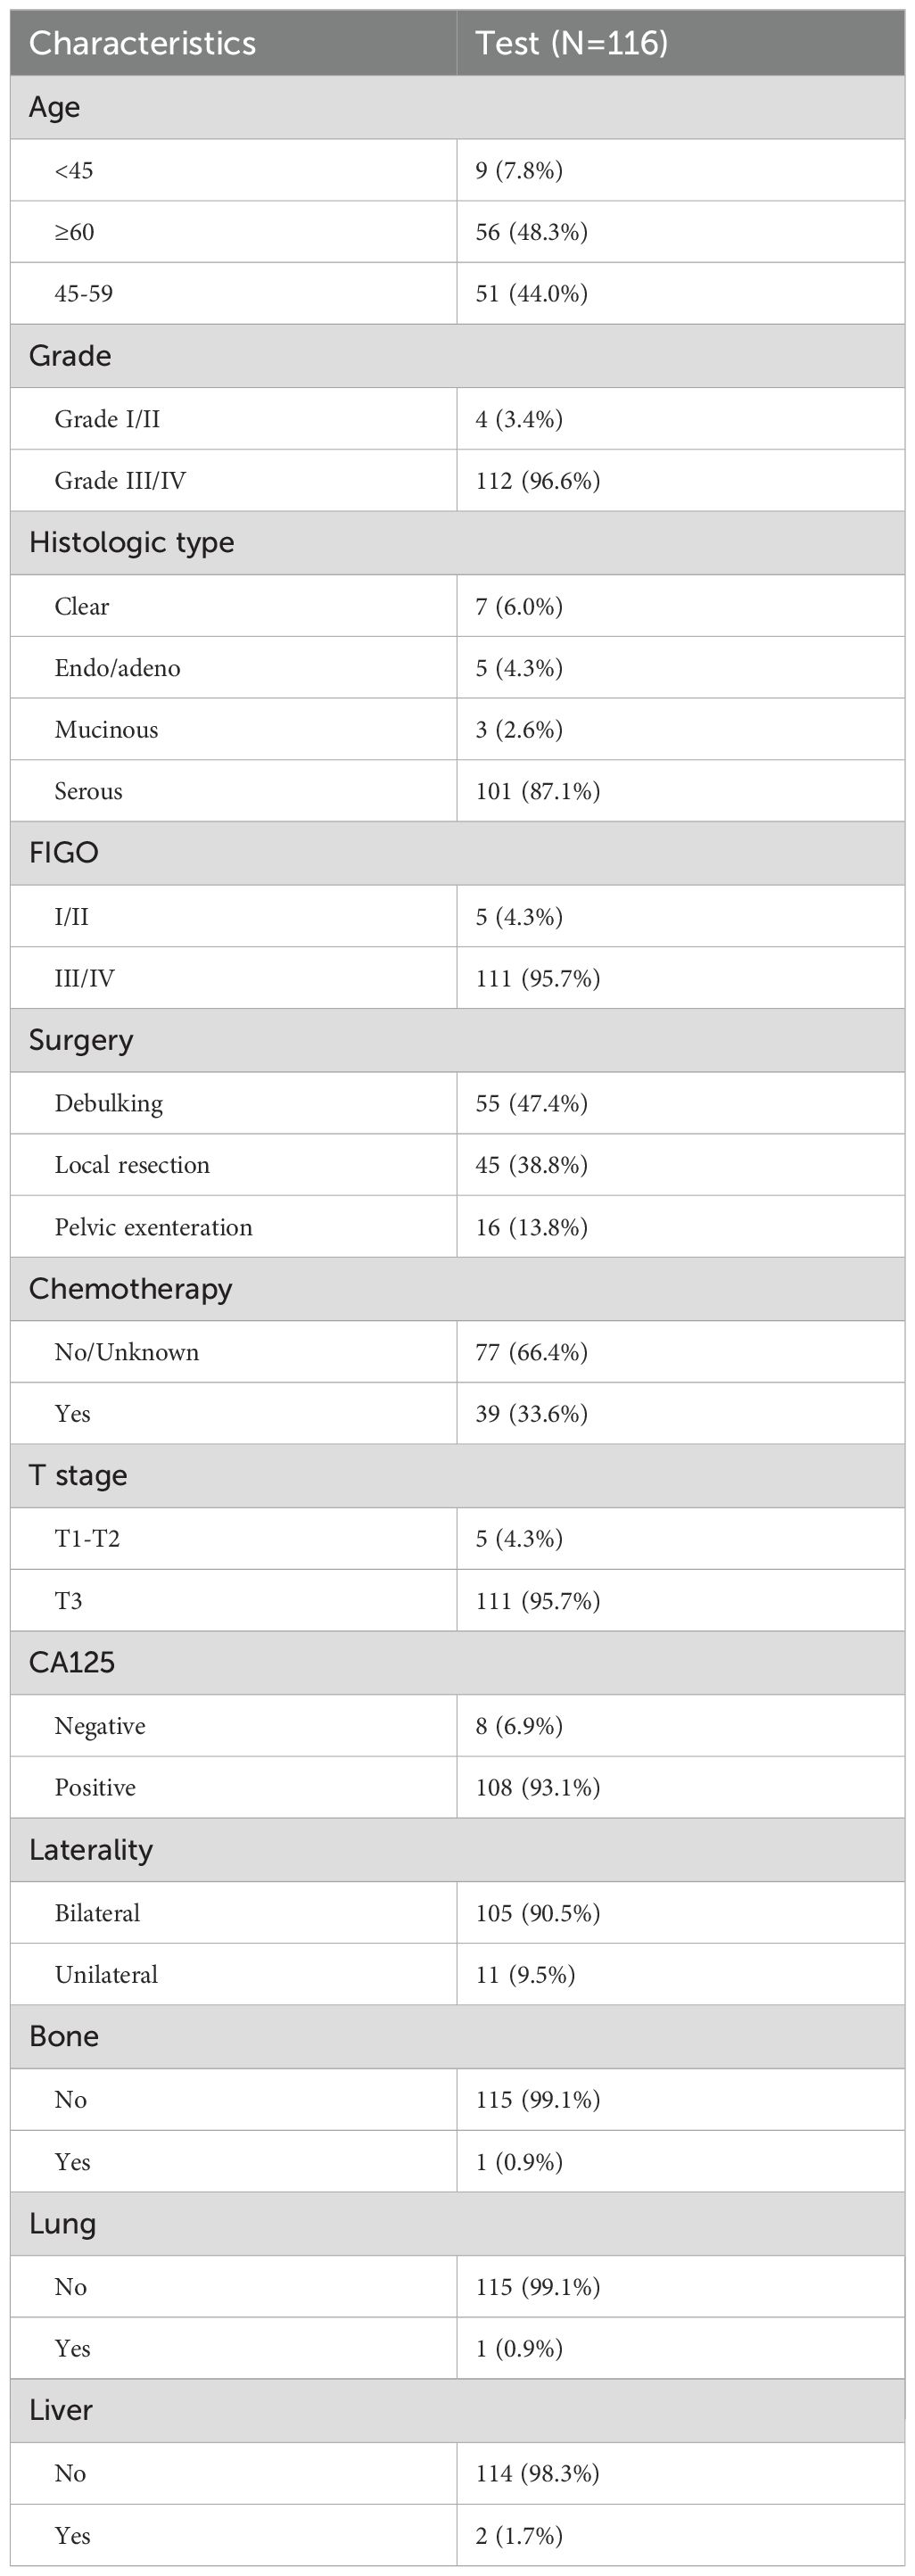
Table 3. General data on external validation cohort for patients with epithelial ovarian cancer n (%).

Figure 4. Kaplan-Meier survival curves comparing overall survival in patients with epithelial ovarian cancer in different risk groups. (a) Training cohort. (b) Internal test cohort. (c) External test cohort.
3.5 Comparison of model performance
We constructed three machine learning models for survival analysis using the training cohort. Harrell’s C-index was first used to measure the relationship between the model’s prediction of the risk profile and the actual survival of the patients to reflect the model’s predictive effectiveness. In the DeepSurv model, the C-index of the internal validation cohort was 0.715 and the external validation cohort was 0.672, whereas the C-index of the internal validation cohort of the DeepHit model was 0.712 and the external validation cohort was 0.661. The C-index of the internal validation set and the C-index of the external validation set of the RSF model were 0.709 and 0.634, respectively.
We then calculated 3-year and 5-year AUC values for the three machine learning models to verify the accuracy of the models. Figure 3 showed the ROC curves assessing different survival analysis models for predicting patients survival outcomes at three and five years, representing the overall performance of the models. We also validated these models by applying calibration curves and DCA decision curves. DeepSurv presented superior performance in our study. Its calibration curves for internal and external validation were displayed in Figure 5. The calibration curves for the other models were displayed in Supplementary Figure 9. The results showed that the RSF model had the best calibration, and the DeepHit model was slightly less calibrated than other models. The analysis results of the DCA decision curve of the DeepSurv model were shown in Figure 6, and the DCA decision curve results of the other models were presented in Supplementary Figure 10. If the net benefit rate of the curve is higher than the extreme curve, it indicates that the curve has some application. The results founded that the internal validation results are better than the external validation results. Our study revealed that the COX proportional risk regression model, which is a traditional model, performed similarly to the other machine learning models. However, in the results in Table 4 we found that the DeepSurv model outperformed the other machine learning models as well as the COX proportional risk regression model in both the internal and the external validation. Integrative analysis of these assessment metrics conclusively found that DeepSurv model outperform other models in both internal and external validation cohorts. Table 4 showed a comparison of the C-index and AUC values for several models.
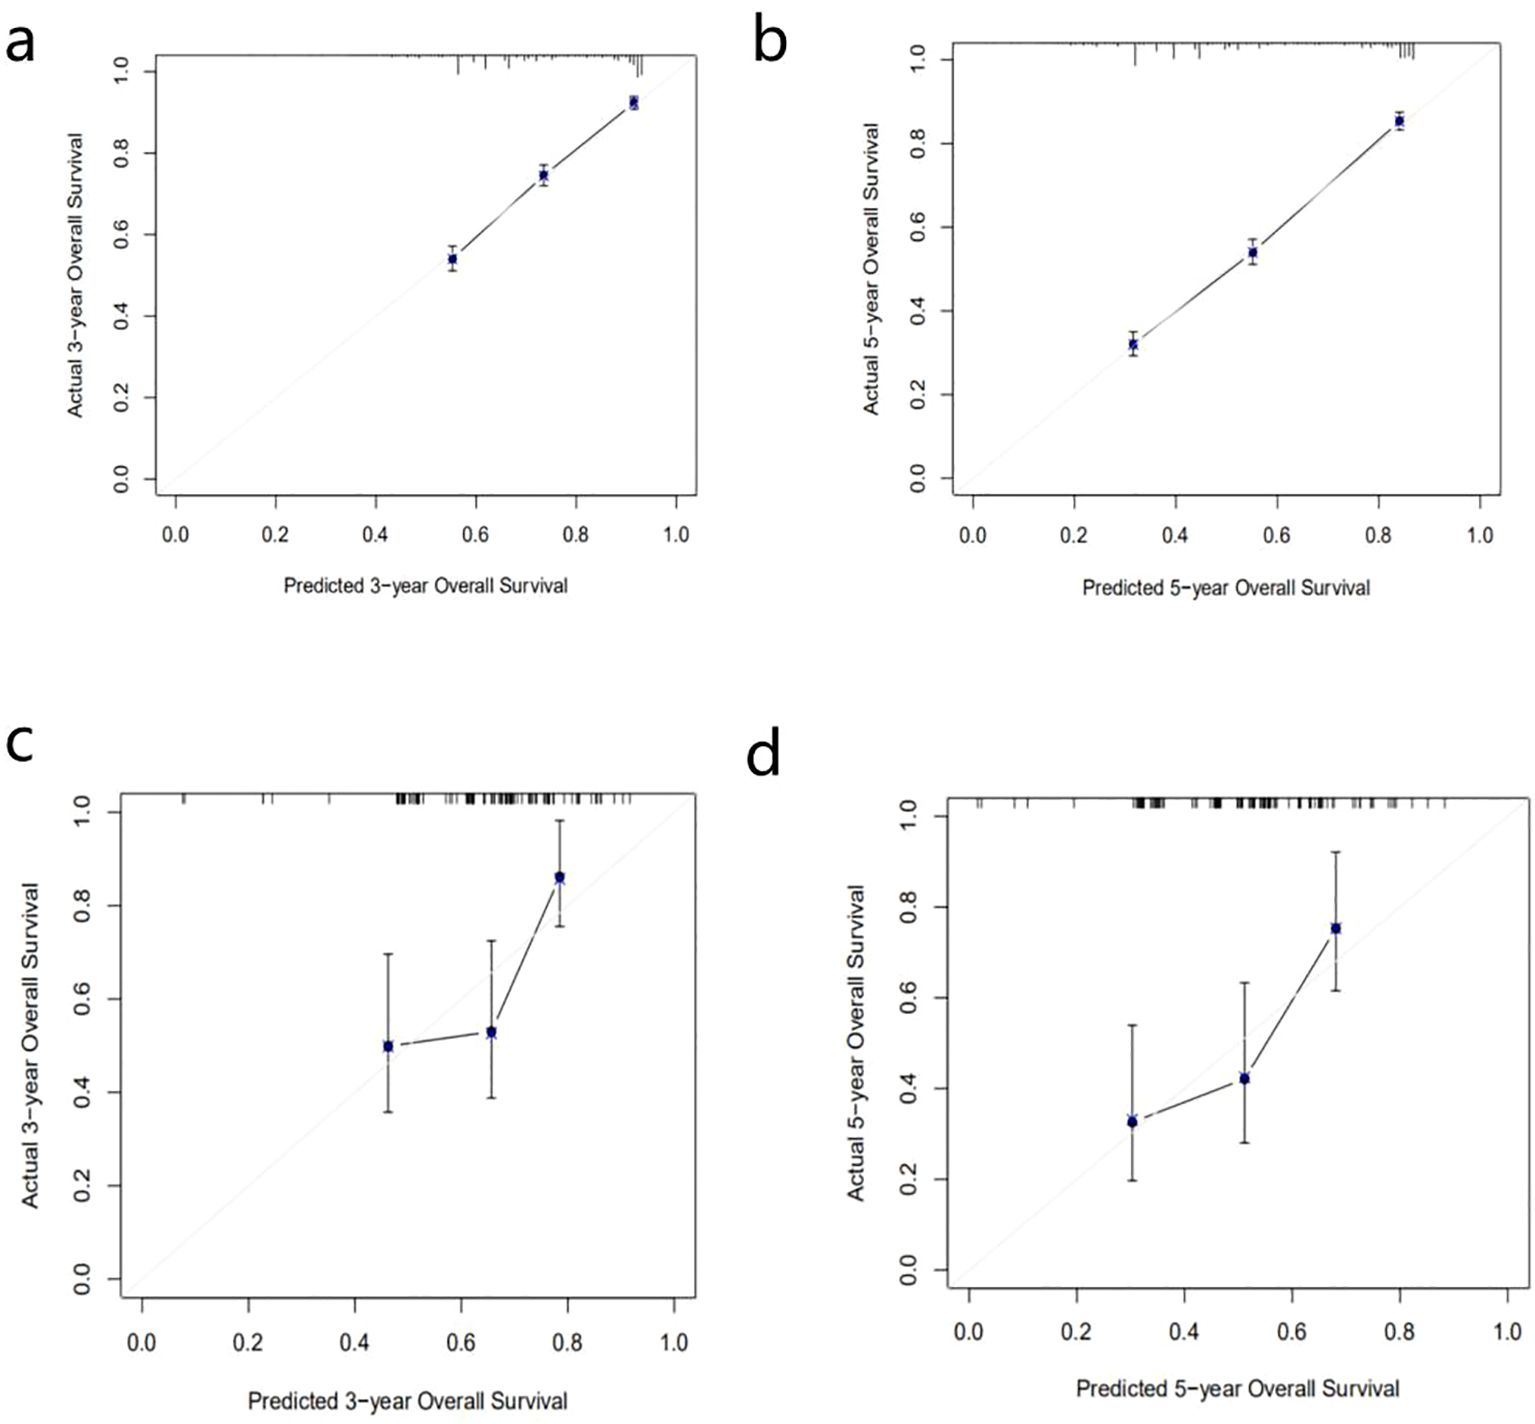
Figure 5. DeepSurv 3 year and 5 year survival calibration curves for patients with epithelial ovarian cancer (a, b) are internal validation set; (c, d) are external validation set).
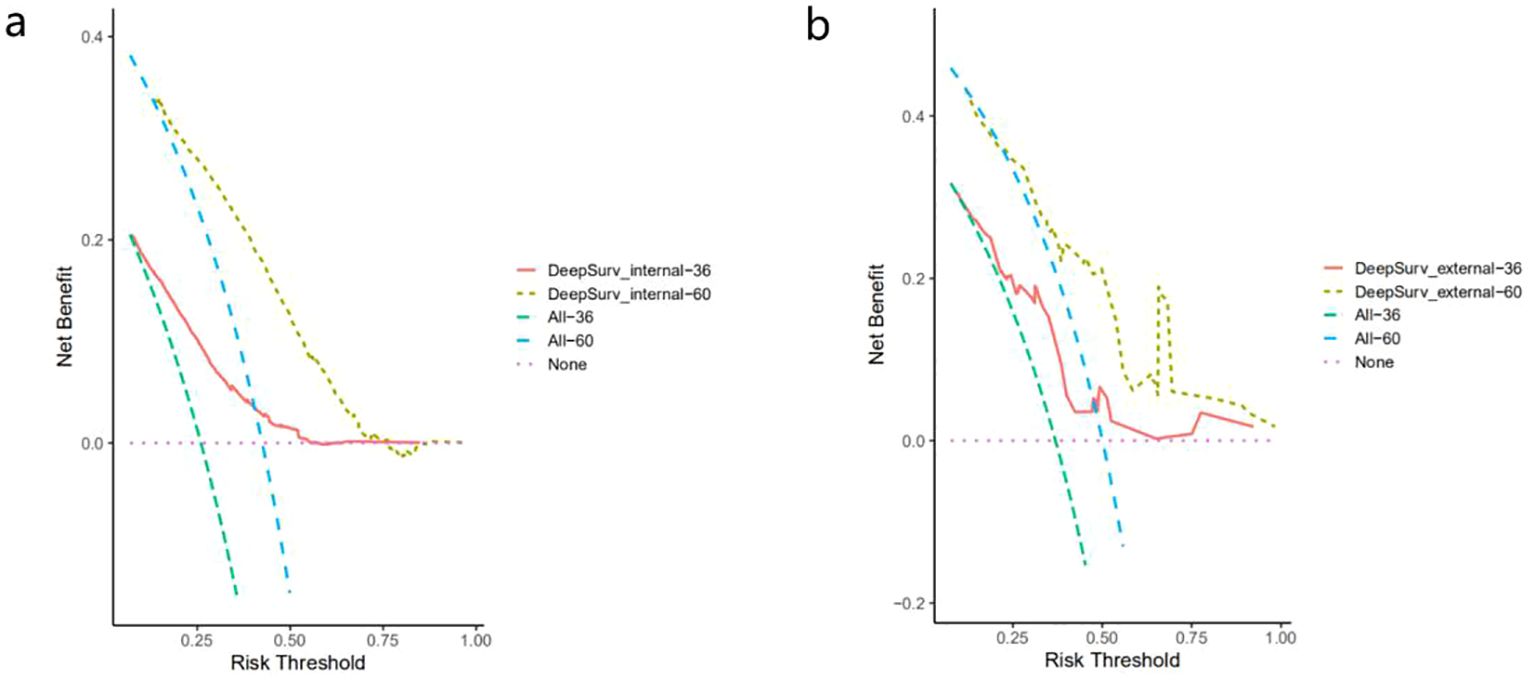
Figure 6. DeepSurv 3 year and 5 year decision curve analysis for patients with epithelial ovarian cancer. (a) internal validation sex; (b) external validation set.

Table 4. COX proportional risk regression model and three machine learning models C-index and AUC values.
4 Discussion
Among the principal gynecologic cancers (endometrial, cervical, and ovarian cancer), ovarian cancer has the second highest mortality rate and the worst prognosis (4), and represents a significant clinical challenge in women’s health. Ovarian cancer is classified based on histologic type, and epithelial ovarian cancer is arguably the most common type (33). The symptoms of early stage ovarian cancer are relatively less obvious. And the prognosis of patients relatively display favorable prognosis. However, about 75% of ovarian cancer patients are advanced at the time of diagnosis. Due to the lack of early specific symptoms and effective screening tools in these patients, the diagnosis of ovarian cancer can be delayed. This delay in diagnosis seriously affects the prognosis of patients and is a key factor in the generally poor prognosis of ovarian cancer (34). Therefore, more appropriate methods should be explored to deeply investigate the risk factors affecting the prognosis of patients with epithelial ovarian cancer. In our study, the best model we cited, DeepSurv, we found that its 3-year and 5-year AUC values in internal validation were 0.746,0.766; its AUC values in external validation were 0.731 and 0.756. It reflected that the model had relatively good accuracy.
Based on real clinical studies, DeepSurv demonstrated equivalent or better performance than other survival analysis methods in terms of time-to-event data. Our results showed that the overall performance of the DeepSurv model was superior to that of the traditional Cox proportional hazards regression model. The results demonstrated that the DeepSurv model outperformed traditional methods in complex survival analysis, particularly with high-dimensional data or non-proportional hazards. This advantage may derive from DeepSurv’s ability to jointly consider both linear and nonlinear effects of covariates. Beyond prognostic prediction, DeepSurv could also be used in survival analysis to generate personalized treatment recommendations based on the predictive impact of treatment regimens on individual risks, which highlighted an important direction for further research to better leverage the potential of this model (28, 35).
Numerous clinical studies have consistently indicated that surgical intervention significantly influences patients survival, with non-surgical treatment associated with much worse prognosis. Furthermore, the surgical approach significantly influences patients survival outcomes (13, 36, 37). Studies have shown that residual lesions following debulking surgery are an important prognostic factor affecting the overall survival rate of patients. Alternatively, failure to achieve satisfactory debulking may be the reason for the poor prognosis of patients after debulking surgery (38, 39). Zheng et al. conducted an analysis of surgical outcomes, revealing that patients undergoing pelvic exenteration demonstrated significantly higher mortality risk compared to other surgical approaches (30). According to the study conducted by Song et al, advanced stage (III/IV) epithelial ovarian cancer patients undergoing debulking or pelvic exenteration demonstrated significantly improved survival outcomes, with reduced mortality risk (36). Cheng et al. demonstrated significantly improved survival outcomes in patients undergoing local resection (13). We found that our study was consistent with the findings of Cheng et al.
Role of chemotherapy in ovarian cancer still controversial. Whether in studies of different histological types such as mucinous cancer, clear cell cancer, or older epithelial ovarian cancer based on age group classification (13, 40, 41). In our study, according to the COX proportional risk regression analysis, it can be determined that whether or not patients undergoes chemotherapy is a significant risk factor influencing the overall survival of patients with epithelial ovarian cancer (P < 0.05), the nomogram revealed that patients with unknown chemotherapy status or those who did not receive chemotherapy demonstrated significantly higher mortality. The International Federation of Gynecology and Obstetrics (FIGO) clinical data reveal that advanced stage (III-IV) ovarian cancer patients who receive neoadjuvant chemotherapy may survive better than those who do not (42). A prior randomized trial demonstrated that hyperthermic intraperitoneal chemotherapy (HIPEC) combined with interstitial cytoreductive surgery and neoadjuvant chemotherapy is a promising option for improving the 5-year overall survival and disease-free survival (DFS) of patients with primary ovarian cancer (43). At the same time, a retrospective analysis in Italy found that cytoreductive surgery (peritonectomy procedures) combined with HIPEC can treat advanced ovarian cancer (44). Pressurized intraperitoneal aerosol chemotherapy(PIPAC) therapy has demonstrated significant efficacy in the treatment of patients with peritoneal carcinomatosis, and it is one of the most innovative methods of intraperitoneal chemotherapy (45). However, since the only available data on chemotherapy in the SEER database is whether the patients received chemotherapy or not. And the surgical information does not include whether patients underwent peritonectomy. Therefore, it is difficult to analyze specifically the effects of neoadjuvant chemotherapy, PIPAC and HIPEC. However, we must acknowledge that these methods show promising survival benefits on the survival outcomes of ovarian cancer patients and are of great significance in the field of therapeutic community. In the future, we will focus on strengthening research on neoadjuvant chemotherapy and PIPAC, while also increasing our exploration of peritonectomy and HIPEC.
Histological type is strongly associated with the prognosis of ovarian cancer. Zhou et al. found that among epithelial ovarian cancer patients, mucinous ovarian cancer and clear cell cancer displayed significantly poorer survival compared to serous ovarian cancer. Meantime, better survival in endometrioid ovarian cancer compared to serous ovarian cancer (2). This finding has been validated by our study, further strengthening the clinical significance of histological type as a prognostic factor. This further demonstrated that different histological subtypes were closely related to patients prognosis, with different subtypes leading to different outcomes (8). Therefore, histological subtypes should receive further attention in studies on ovarian cancer prognosis.
We referenced the study by De Felice F et al., which evaluated focused on healthcare professionals’ awareness and adherence to evidence-based nutritional interventions, with an emphasis on the feasibility of clinical nutrition plans, implementation of nutritional assessment plans, composition of multidisciplinary teams and the proficient utilization of screening tools. Current research emphasizes the critical role of nutritional care in oncology (46). However, many patients do not receive adequate nutritional support during treatment, which inevitably increases the risk of weight loss, poor tolerance to treatment and treatment-related complications in cancer patients (47, 48). Therefore, providing adequate nutrition during hospitalization is critical to maintain energy balance for cancer patients. Through this initiative, thereby improving treatment outcomes and ultimately improving patients’ quality of life (49, 50).
FIGO stage is always an important prognostic factor for ovarian cancer patients. And studies have shown that the later the FIGO stage, the worse the prognosis (51). The same conclusion can be drawn from the nomogram we have created. The prognosis of many cancers is related to the age of the patients. With Zhou et al. demonstrating a strong correlation between older patients and poorer clinical outcomes (2). Our study revealed this age-related prognostic pattern, further validating the clinical significance of age stratification in cancer prognosis. In this study, we first constructed a nomogram and built multiple survival-related machine learning models for variables selected by COX proportional risk regression to predict overall survival in patients with epithelial ovarian cancer, and then we performed a Kaplan-Meier survival analysis on 14 variables identified by COX proportional risk regression. Eventually we found that: the closer the FIGO stage was to the advanced stage, mucinous ovarian cancer, older age, positive serum CA125 level, larger tumor (T stage=T3), the less differentiated the tumor, do not or unknown receive chemotherapy, occurrence of metastasis to organs such as liver, lung, bone, etc, and tumors at bilateral sites, the shorter the survival time and the worse the survival. The results of the Kaplan-Meier survival curve analysis verified that all of the factors that we had included were significant (P < 0.05).
Adeoye applied DeepSurv, DeepHit, RSF, and COX-Time simultaneously to survival prediction of oral cancer (52); Li et al. applied CPH, DeepSurv, DeepHit, RSF were applied to the survival prediction of myeloma (53); Yang et al. applied COX-Time, N-MTLR, GBM, DeepSurv, DeepHit, and RSF to the survival prediction of colorectal cancer (23). Reilly et al. analyzed and validated deep neural network algorithms for the detection of ovarian cancer and found that the application of deep neural network algorithms in biomarker detection lays the foundation for future research (54). Our study combines three ML techniques(DeepSurv, DeepHit, RSF) and COX proportional risk regression model to predict the prognosis of patients with epithelial ovarian cancer. By comparing the models performance we selected the best predictive model—DeepSurv. Our study not only validated the model using internal validation, but also collected clinical data for external validation, thereby greatly enhancing the generalizability and clinical applicability of the model. The results proved that DeepSurv model was the optimal model both in the internal and external validation cohort. DeepSurv has great potential to complement traditional survival analysis methods and contribute to the development of the healthcare industry, thereby enhancing predictive accuracy in complex clinical scenarios (28).
In summary, we provided a deep learning based model—DeepSurv, for predicting overall survival of patients with epithelial ovarian cancer, as it outperforms other models in both internal and external validation sets. Of course other models also have good predictive performance. And the results of this study can provide some reference and guidance for the future clinical development of better treatment strategies, which can improve the quality of survival and increase the survival rate of epithelial ovarian cancer patients.
However, some limitations remain in our study. Firstly, our study is a retrospective study, and some information bias is inevitable in the process of collecting external validation follow-up data. Secondly, the database lacks more detailed prognostic information (including specific surgical conditions and postoperative complications, molecular and genomic data), and the baseline table shows that the majority of our study population is white, which may lead to bias in subsequent analyses. DeepSurv is somewhat of a black box. Deep neural networks, characterized by their complex multi-layered nonlinear architecture. Due to their multi-layer non-linear structure, making their internal decision-making processes difficult to interpret (55). Challenges remain for us in understanding the computations or resulting limitations during the model construction process (56). Therefore, we will continue to update and supervise nomogram and survival analysis models in future research efforts. Through this to ensure their continued validity and generalizability for clinical studies.
5 Conclusion
In this study, we established a nomogram for predicting epithelial ovarian cancer prognosis, and also applied DeepSurv and DeepHit and RSF models to predict postoperative prognosis of patients with epithelial ovarian cancer for the first time, which provides some reference value for clinical practice.
Data availability statement
The original contributions presented in the study are included in the article/Supplementary Material. Further inquiries can be directed to the corresponding authors.
Ethics statement
The studies involving humans were approved by Ethics Committee of Dalian Municipal Central Hospital : Central Hospital of Dalian University of Technology, Dalian, China. The studies were conducted in accordance with the local legislation and institutional requirements. Written informed consent for participation was not required from the participants or the participants’ legal guardians/next of kin in accordance with the national legislation and institutional requirements.
Author contributions
ZL: Writing – original draft, Conceptualization, Data curation. JW: Data curation, Writing – original draft. YXZ: Writing – review & editing. ZY: Writing – review & editing. FZ: Writing – review & editing. XB: Writing – review & editing, Methodology. QZ: Writing – review & editing, Methodology. WZ: Methodology, Writing – review & editing. RX: Conceptualization, Writing – review & editing. WW: Conceptualization, Writing – review & editing. ZHY: Conceptualization, Writing – review & editing. XL: Supervision, Writing – review & editing. YY: Writing – review & editing, Supervision.
Funding
The author(s) declare that no financial support was received for the research and/or publication of this article.
Acknowledgments
We thank SEER database for its openness and accessibility to data, and thank the corresponding authors for their help in writing and guiding the revision of the paper. We are grateful to Dalian Municipal Central Hospital for providing external validation data.
Conflict of interest
The authors declare that the research was conducted in the absence of any commercial or financial relationships that could be construed as a potential conflict of interest.
Generative AI statement
The author(s) declare that no Generative AI was used in the creation of this manuscript.
Publisher’s note
All claims expressed in this article are solely those of the authors and do not necessarily represent those of their affiliated organizations, or those of the publisher, the editors and the reviewers. Any product that may be evaluated in this article, or claim that may be made by its manufacturer, is not guaranteed or endorsed by the publisher.
Supplementary material
The Supplementary Material for this article can be found online at: https://www.frontiersin.org/articles/10.3389/fonc.2025.1592746/full#supplementary-material
References
1. Siegel RL, Giaquinto AN, and Jemal A. Cancer statistics, 2024. CA Cancer J Clin. (2024) 74:12–49. doi: 10.3322/caac.21820
2. Zhou Y, Wang A, Sun X, Zhang R, and Zhao L. Survival prognosis model for elderly women with epithelial ovarian cancer based on the SEER database. Front Oncol. (2023) :1257615. doi: 10.3389/fonc.2023.1257615
3. Zhang S, Zhang H, Jia N, Suo S, and Guo J. Effect of different treatment modalities on the prognosis of stage IV epithelial ovarian cancer: analysis of the SEER database. BMC Womens Health. (2024) 24:345. doi: 10.1186/s12905-024-03199-5
4. Zhang T and Zhu L. Nomogram for predicting postoperative cancer-specific early death in patients with epithelial ovarian cancer based on the SEER database: a large cohort study. Arch Gynecol Obstet. (2022) 305:1535–49. doi: 10.1007/s00404-021-06342-x
5. Gaitskell K, Hermon C, Barnes I, Pirie K, Floud S, Green J, et al. Ovarian cancer survival by stage, histotype, and pre-diagnostic lifestyle factors, in the prospective UK Million Women Study. Cancer Epidemiol. (2022) 76:102074. doi: 10.1016/j.canep.2021.102074
6. Tothill RW, Tinker AV, George J, Brown R, Fox SB, Lade S, et al. Novel molecular subtypes of serous and endometrioid ovarian cancer linked to clinical outcome. Clin Cancer Res. (2008) 14:5198–208. doi: 10.1158/1078-0432.CCR-08-0196
7. Konecny GE, Wang C, Hamidi H, Winterhoff B, Kalli KR, Dering J, et al. Prognostic and therapeutic relevance of molecular subtypes in high-grade serous ovarian cancer. J Natl Cancer Inst. (2014) 106. doi: 10.1093/jnci/dju249
8. Qian L, Zhu J, Xue Z, Zhou Y, Xiang N, Xu H, et al. Proteomic landscape of epithelial ovarian cancer. Nat Commun. (2024) 15:6462. doi: 10.1038/s41467-024-50786-z
9. Lheureux S, Braunstein M, and Oza AM. Epithelial ovarian cancer: Evolution of management in the era of precision medicine. CA Cancer J Clin. (2019) 69:280–304. doi: 10.3322/caac.21559
10. Zhang H and Zhang Y. Olaparib and paclitaxel in combination with carboplatin in treatment of ovarian cancer: influence on disease control. Am J Transl Res. (2022) 14:468–75.
11. Timmerman D, Planchamp F, Bourne T, Landolfo C, du Bois A, Chiva L, et al. ESGO/ISUOG/IOTA/ESGE Consensus Statement on pre-operative diagnosis of ovarian tumors. Int J Gynecol Cancer. (2021) 31:961–82. doi: 10.1136/ijgc-2021-002565
12. Tozzi R, Traill Z, Campanile RG, Kilic Y, Baysal A, Giannice R, et al. Diagnostic flow-chart to identify bowel involvement in patients with stage IIIC-IV ovarian cancer: Can laparoscopy improve the accuracy of CT scan? Gynecol Oncol. (2019) 155:207–12. doi: 10.1016/j.ygyno.2019.08.025
13. Cheng H, Xu JH, Kang XH, Wu CC, Tang XN, Chen ML, et al. Nomograms for predicting overall survival and cancer-specific survival in elderly patients with epithelial ovarian cancer. J Ovarian Res. (2023) 16:75. doi: 10.1186/s13048-023-01144-y
14. Machida H, Matsuo K, Yamagami W, Ebina Y, Kobayashi Y, Tabata T, et al. Trends and characteristics of epithelial ovarian cancer in Japan between 2002 and 2015: A JSGO-JSOG joint study. Gynecol Oncol. (2019) 153:589–96. doi: 10.1016/j.ygyno.2019.03.243
15. Sorayaie Azar A, Babaei Rikan S, Naemi A, Bagherzadeh Mohasefi J, Pirnejad H, Bagherzadeh Mohasefi M, et al. Application of machine learning techniques for predicting survival in ovarian cancer. BMC Med Inform Decis Mak. (2022) 22:345. doi: 10.1186/s12911-022-02087-y
16. Wu M, Gu S, Yang J, Zhao Y, Sheng J, Cheng S, et al. Comprehensive machine learning-based preoperative blood features predict the prognosis for ovarian cancer. BMC Cancer. (2024) 24:267. doi: 10.1186/s12885-024-11989-1
17. Zhang D, Luan J, Liu B, Yang A, Lv K, Hu P, et al. Comparison of MRI radiomics-based machine learning survival models in predicting prognosis of glioblastoma multiforme. Front Med (Lausanne). (2023) 10:1271687. doi: 10.3389/fmed.2023.1271687
18. Jin Z, Chen C, Zhang D, Yang M, Wang Q, Cai Z, et al. Preoperative clinical radiomics model based on deep learning in prognostic assessment of patients with gallbladder carcinoma. BMC Cancer. (2025) 25:341. doi: 10.1186/s12885-025-13711-1
19. Yu Y, Ren W, He Z, Chen Y, Tan Y, Mao L, et al. Machine learning radiomics of magnetic resonance imaging predicts recurrence-free survival after surgery and correlation of LncRNAs in patients with breast cancer: a multicenter cohort study. Breast Cancer Res. (2023) 25:132. doi: 10.1186/s13058-023-01688-3
20. Balachandran VP, Gonen M, Smith JJ, and DeMatteo RP. Nomograms in oncology: more than meets the eye. Lancet Oncol. (2015) 16:e173–80. doi: 10.1016/s1470-2045(14)71116-7
21. Egger J, Gsaxner C, Pepe A, Pomykala KL, Jonske F, Kurz M, et al. Medical deep learning-A systematic meta-review. Comput Methods Programs Biomed. (2022) 221:106874. doi: 10.1016/j.cmpb.2022.106874
22. Tran KA, Kondrashova O, Bradley A, Williams ED, Pearson JV, and Waddell N. Deep learning in cancer diagnosis, prognosis and treatment selection. Genome Med. (2021) 13:152. doi: 10.1186/s13073-021-00968-x
23. Yang X, Qiu H, Wang L, and Wang X. Predicting colorectal cancer survival using time-to-event machine learning: retrospective cohort study. J Med Internet Res. (2023) 25:e44417. doi: 10.2196/44417
24. Hu D, Ma D, Zhang ZJ, Zhang Y, Huang K, and Li X. Prognosis comparison between small cell carcinoma of ovary and high-grade serous ovarian cancer: A retrospective observational cohort study. Front Endocrinol (Lausanne). (2023) 14:1103429. doi: 10.3389/fendo.2023.1103429
25. Liu Z, Jing C, Hooblal YM, Yang H, Chen Z, and Kong F. Construction and validation of log odds of positive lymph nodes (LODDS)-based nomograms for predicting overall survival and cancer-specific survival in ovarian clear cell carcinoma patients. Front Oncol. (2024) 14:1370272. doi: 10.3389/fonc.2024.1370272
26. Taylor JM. Random survival forests. J Thorac Oncol. (2011) 6:1974–5. doi: 10.1097/JTO.0b013e318233d835
27. Lee C, Yoon J, and Schaar MV. Dynamic-deepHit: A deep learning approach for dynamic survival analysis with competing risks based on longitudinal data. IEEE Trans BioMed Eng. (2020) 67:122–33. doi: 10.1109/TBME.2019.2909027
28. Katzman JL, Shaham U, Cloninger A, Bates J, Jiang T, and Kluger Y. DeepSurv: personalized treatment recommender system using a COX proportional hazards deep neural network. BMC Med Res Methodol. (2018) 18:24. doi: 10.1186/s12874-018-0482-1
29. Ishwaran H, Gerds TA, Kogalur UB, Moore RD, Gange SJ, and Lau BM. Random survival forests for competing risks. Biostatistics. (2014) 15:757–73. doi: 10.1093/biostatistics/kxu010
30. Zheng H, Chen J, Huang J, Yi H, Zhang S, and Zheng X. A novel clinical nomogram for predicting cancer-specific survival in patients with non-serous epithelial ovarian cancer: A real-world analysis based on the Surveillance, Epidemiology, and End Results database and external validation in a tertiary center. Transl Oncol. (2024) 42:101898. doi: 10.1016/j.tranon.2024.101898
31. Huang T, Huang L, Yang R, Li S, He N, Feng A, et al. Machine learning models for predicting survival in patients with ampullary adenocarcinoma. Asia Pac J Oncol Nurs. (2022) 9:100141. doi: 10.1016/j.apjon.2022.100141
32. Wu J, Zhang H, Li L, Hu M, Chen L, Xu B, et al. A nomogram for predicting overall survival in patients with low-grade endometrial stromal sarcoma: A population-based analysis. Cancer Commun (Lond). (2020) 40:301–12. doi: 10.1002/cac2.12067
33. Guo TA, Wu YC, Tan C, Jin YT, Sheng WQ, Cai SJ, et al. Clinicopathologic features and prognostic value of KRAS, NRAS and BRAF mutations and DNA mismatch repair status: a single-center retrospective study of 1,834 Chinese patients with Stage I-IV colorectal cancer. Int J Cancer. (2019) 145:1625–34. doi: 10.1002/ijc.32489
34. Rosendahl M, Høgdall CK, and Mosgaard BJ. Restaging and survival analysis of 4036 ovarian cancer patients according to the 2013 FIGO classification for ovarian, fallopian tube, and primary peritoneal cancer. Int J Gynecol Cancer. (2016) 26:680–7. doi: 10.1097/IGC.0000000000000675
35. Wang S, Shao M, Fu Y, Zhao R, Xing Y, Zhang L, et al. Deep learning models for predicting the survival of patients with hepatocellular carcinoma based on a surveillance, epidemiology, and end results (SEER) database analysis. Sci Rep. (2024) 14:13232. doi: 10.1038/s41598-024-63531-9
36. Song Z, Zhou Y, Bai X, and Zhang D. A practical nomogram to predict early death in advanced epithelial ovarian cancer. Front Oncol. (2021) 11:655826. doi: 10.3389/fonc.2021.655826
37. Wang B, Wang S, and Ren W. Development and validation of a nomogram to predict survival outcome among epithelial ovarian cancer patients with site-distant metastases: a population-based study. BMC Cancer. (2021) 21:609. doi: 10.1186/s12885-021-07977-4
38. Bryant A, Hiu S, Kunonga PT, Gajjar K, Craig D, Vale L, et al. Impact of residual disease as a prognostic factor for survival in women with advanced epithelial ovarian cancer after primary surgery. Cochrane Database Syst Rev. (2022) 9:CD015048. doi: 10.1002/14651858.CD015048.pub2
39. Kurnit KC, Fleming GF, and Lengyel E. Updates and new options in advanced epithelial ovarian cancer treatment. Obstet Gynecol. (2021) 137:108–21. doi: 10.1097/AOG.0000000000004173
40. Zhang K, Feng S, Ge Y, Ding B, and Shen Y. A nomogram based on SEER database for predicting prognosis in patients with mucinous ovarian cancer: A real-world study. Int J Womens Health. (2022) 14:931–43. doi: 10.2147/IJWH.S372328
41. Chen Q, Wang S, and Lang JH. Development and validation of Nomograms for predicting overall survival and Cancer-specific survival in patients with ovarian clear cell carcinoma. J Ovarian Res. (2020) 13:123. doi: 10.1186/s13048-020-00727-3
42. Nishio S and Ushijima K. Clinical significance of primary debulking surgery and neoadjuvant chemotherapy-interval debulking surgery in advanced ovarian cancer. Jpn J Clin Oncol. (2020) 50:379–86. doi: 10.1093/jjco/hyaa015
43. Filis P, Mauri D, Markozannes G, Tolia M, Filis N, and Tsilidis K. Hyperthermic intraperitoneal chemotherapy (HIPEC) for the management of primary advanced and recurrent ovarian cancer: a systematic review and meta-analysis of randomized trials. ESMO Open. (2022) 7:100586. doi: 10.1016/j.esmoop.2022.100586
44. Di Giorgio A, De Iaco P, De Simone M, Garofalo A, Scambia G, Pinna AD, et al. Cytoreduction (Peritonectomy procedures) combined with hyperthermic intraperitoneal chemotherapy (HIPEC) in advanced ovarian cancer: retrospective italian multicenter observational study of 511 cases. Ann Surg Oncol. (2017) 24:914–22. doi: 10.1245/s10434-016-5686-1
45. Pavone M, Jochum F, Lecointre L, Bizzarri N, Taliento C, Restaino S, et al. Efficacy and safety of pressurized intraperitoneal aerosol chemotherapy (PIPAC) in ovarian cancer: a systematic review of current evidence. Arch Gynecol Obstet. (2024) 310:1845–56. doi: 10.1007/s00404-024-07586-z
46. De Felice F, Malerba S, Nardone V, Salvestrini V, Calomino N, Testini M, et al. Progress and challenges in integrating nutritional care into oncology practice: results from a national survey on behalf of the nutriOnc research group. Nutrients. (2025) 17:188. doi: 10.3390/nu17010188
47. Arends J, Baracos V, Bertz H, Bozzetti F, Calder PC, Deutz NEP, et al. ESPEN expert group recommendations for action against cancer-related malnutrition. Clin Nutr. (2017) 36:1187–96. doi: 10.1016/j.clnu.2017.06.017
48. Fearon KC, Ljungqvist O, Von Meyenfeldt M, Revhaug A, Dejong CH, Lassen K, et al. Enhanced recovery after surgery: A consensus review of clinical care for patients undergoing colonic resection. Clin Nutr. (2005) 24:466–77. doi: 10.1016/j.clnu.2005.02.002
49. Marano L, Marmorino F, Desideri I, Carbone L, Rizzo A, Salvestrini V, et al. Clinical nutrition in surgical oncology: Young AIOM-AIRO-SICO multidisciplinary national survey on behalf of NutriOnc research group. Front Nutr. (2023) 10:1045022. doi: 10.3389/fnut.2023.1045022
50. Zhao T, Zhao H, Zhang X, Jiang X, Liang Q, Ni S, et al. Combined effects of nutrition, inflammatory status, and sleep quality on mortality in cancer survivors. BMC Cancer. (2024) 24:1456. doi: 10.1186/s12885-024-13181-x
51. Said SA, Bretveld RW, Koffijberg H, Sonke GS, Kruitwagen RFPM, de Hullu JA, et al. Clinicopathologic predictors of early relapse in advanced epithelial ovarian cancer: development of prediction models using nationwide data. Cancer Epidemiol. (2021) 75:102008. doi: 10.1016/j.canep.2021.102008
52. Adeoye J, Koohi-Moghadam M, Lo AWI, Tsang RK, Chow VLY, Zheng LW, et al. Deep learning predicts the Malignant-transformation-free survival of oral potentially Malignant disorders. Cancers (Basel). (2021) 13:6054. doi: 10.3390/cancers13236054
53. Bao L, Wang YT, Zhuang JL, Liu AJ, Dong YJ, Chu B, et al. Machine learning-based overall survival prediction of elderly patients with multiple myeloma from multicentre real-life data. Front Oncol. (2022) 12:922039. doi: 10.3389/fonc.2022.922039
54. Reilly G, Bullock RG, Greenwood J, Ure DR, Stewart E, Davidoff P, et al. Analytical validation of a deep neural network algorithm for the detection of ovarian cancer. JCO Clin Cancer Inform. (2022) 6:e2100192. doi: 10.1200/CCI.21.00192
55. Buhrmester V, Münch D, and Arens M. Analysis of explainers of black box deep neural networks for computer vision: A survey. Mach Learn Knowl Extr. (2021) 3:966–89. doi: 10.3390/make3040048
Keywords: deep learning, machine learning, epithelial ovarian cancer, prognosis, survival
Citation: Li Z, Wang J, Zhang Y, Yang Z, Zhou F, Bai X, Zhang Q, Zhen W, Xu R, Wu W, Yao Z, Li X and Yang Y (2025) Predicting the prognosis of epithelial ovarian cancer patients based on deep learning models. Front. Oncol. 15:1592746. doi: 10.3389/fonc.2025.1592746
Received: 13 March 2025; Accepted: 02 July 2025;
Published: 25 July 2025.
Edited by:
Paolo Zola, University of Turin, ItalyReviewed by:
Natale Calomino, University of Siena, ItalyNiccolò Gallio, Ospedale Sant’anna Di Torino, Italy
Copyright © 2025 Li, Wang, Zhang, Yang, Zhou, Bai, Zhang, Zhen, Xu, Wu, Yao, Li and Yang. This is an open-access article distributed under the terms of the Creative Commons Attribution License (CC BY). The use, distribution or reproduction in other forums is permitted, provided the original author(s) and the copyright owner(s) are credited and that the original publication in this journal is cited, in accordance with accepted academic practice. No use, distribution or reproduction is permitted which does not comply with these terms.
*Correspondence: Xiaofeng Li, bHhmX2NoZW5AZG11LmVkdS5jbg==; Yiming Yang, WWFuZ3lpbWluZ195Y2xAMTYzLmNvbQ==
†These authors share first authorship
 Zihan Li
 Jiao Wang2†
 Qian Zhang
 Rongxuan Xu
 Wei Wu
 Zhihan Yao
 Xiaofeng Li