 Sichao Wang1Chuanxi Zhao2
 Dongmei Li2Qingzhi Liu3Cuiping Mao2
 Shanshan Ding2
 Shujun Zhang4
 Wenjing Shang2*
- 1Department of Infectious Disease and Hepatology, The Second Hospital of Shandong University, Jinan, Shandong, China
- 2Department of Clinical Laboratory, Shandong Cancer Hospital and Institute, Shandong First Medical University and Shandong Academy of Medical Sciences, Jinan, Shandong, China
- 3Department of Radiology, Shandong Cancer Hospital and Institute, Shandong First Medical University and Shandong Academy of Medical Sciences, Jinan, Shandong, China
- 4Department of Clinical Laboratory, Qilu Hospital of Shandong University, Jinan, Shandong, China
Background: Histone modification enzymes (HMEs) are associated with cancer development, treatment response, and prognosis. However, the potential roles of HMEs in gastric cancer (GC) remain unclear. This study aimed to investigate their biological functions and mechanisms in GC, with additional focus on exploring the clinical value of SMYD2.
Methods: We performed integrated analyses of transcriptome profiling and somatic mutation alteration in GC samples from the Cancer Genome Atlas (TCGA) and the Gene Expression Omnibus (GEO) datasets to characterize HMEs alterations in GC. Consensus unsupervised clustering analysis was performed to identify HMEs-associated GC subtypes. Various machine learning methods were employed to construct an HMEs-based diagnostic model for GC. The area under the receiver operating characteristic (ROC) curve (AUC) was used to evaluate model performance. SMYD2 expression in GC tissues was analyzed using TCGA and GEO data and validated by immunohistochemistry (IHC). The association between SMYD2 and the tumor immune microenvironment in GC was evaluated using CIBERSORT, ESTIMATE, and TIDE algorithms. Functional characterization of SMYD2 was performed via SMYD2 knockdown in GC cells.
Results: Most HMEs were up-regulated in GC tissues and exhibited relatively high mutation frequencies. GC patients were stratified into three HMEs-associated subtypes, with cluster 2 (C2) demonstrating significantly better prognosis than C1 and C3. The diagnostic model based on HMEs expression profiles showed robust performance for GC diagnosis. Notably, SMYD2 expression showed positive associations with CD8+ T cells, activated CD4+ T cells, and M0/M1 macrophages, but negative associations with M2 macrophages, regulatory T cells, stromal score, and TIDE score. Functional assays demonstrated that SMYD2 promoted GC cell proliferation, invasion, and migration in vitro.
Conclusions: These findings established SMYD2 is a major oncogene that can serve as a candidate diagnostic and prognostic biomarker for GC.
1 Introduction
Globally, an estimated 20 million cancer cases and 9.7 million cancer-related deaths were reported in 2022, with gastric cancer (GC) accounting for 4.9% of new diagnoses and 6.8% of cancer mortality. Ranked as the fifth most prevalent malignancy and the fifth leading cause of cancer death, GC demonstrates multifactorial etiology (1). Established risk factors include pathogenic infections [particularly Helicobacter pylori (H. pylori)], aging, genetic susceptibility, epigenetic dysregulation, and lifestyle/dietary patterns (2–4). As a Group I carcinogen, H. pylori induces chronic gastritis, progressing through gastric intestinal metaplasia and dysplasia to adenocarcinoma (5, 6). Prophylactic H. pylori eradication significantly reduces GC incidence in asymptomatic populations (7, 8). Current therapeutic approaches encompass surgical resection, chemotherapy, radiotherapy, and immunotherapy (9). Despite substantial improvements in treatment strategies, the 5-year survival rate remains suboptimal, primarily due to late-stage diagnosis in most patients (10). These clinical challenges underscore the critical need for identifying pivotal molecular markers to advance GC diagnosis and therapeutic development.
Emerging evidence demonstrates that dysregulation of histone methyltransferases (HMTs) plays pivotal roles in tumorigenesis and cancer progression (11–13). HMTs are divided into protein lysine methyltransferases (PKMTs) and protein arginine methyltransferases (PRMTs) (14, 15). As a PKMT family member, SMYD2 (SET and MYND domain-containing protein 2) catalyzes lysine methylation in both histone and non-histone targets (16, 17). SMYD2 primarily functions as an H3K36 methyltransferase that represses histone transcriptional activity, with additional capacity to mediate H3K4 methylation for gene expression regulation (18, 19). Meanwhile, SMYD2 could methylate non-histone proteins, including P53, RB, PTEN, STAT3, p65, HSP90, MAPKAPK3 (20). Epigenetic silencing of tumor suppressors p53 and RB via methylation establishes SMYD2 as a therapeutic target (21). SMYD2 could methylate PTEN at lysine 313, thereby activating PI3K-AKT pathway and driving the proliferation of breast cancer cells (22). SMYD2 could be recruited to substrates of STAT3 and p65 and methylate STAT3 and p65, leading to the proliferation of TNBC cells (23). HSP90 was methylated by SMYD2 at lysine 531 and 574, thereby accelerating the proliferation of cancer cells (24). SMYD2 could also methylate stress response kinase MAPKAPK3 and increased cell proliferation in pancreatic ductal adenocarcinoma (25).
Aberrant expression of SMYD2 is closely associated with several diseases, including cardiovascular diseases and cancer. The SMYD2-HDAC-SRF axis was a critical epigenetic mechanism and regulated vascular smooth muscle cells' phenotypic switching and neointimal hyperplasia (26). SMYD2 overexpression inhibited cell proliferation and migration of vascular smooth muscle and attenuated arterial narrowing in injured vessels via a myocardin-dependent epigenetic regulatory mechanism in mice (27). SMYD2 physically interacted with HNRNPK and mediated lysine monomethylation at K422 of HNRNPK, promoting colorectal cancer angiogenesis by stabilizing EGFL7 mRNA (28). SMYD2 could methylate c-Myc and promote hepatocellular carcinoma progression by reprogramming glutamine metabolism through c-Myc/GLS1 signaling (29). SMYD2 could activate the transcription of PRS7 by binding to its promoter and promote tumorigenesis and metastasis in lung adenocarcinoma (30). In addition, SMYD2 monomethylated non-histone PPARγ and inhibited its nuclear translocation, which facilitated hypoxia-induced pulmonary hypertension (17).
In this study, we used The Cancer Genome Atlas (TCGA) and Gene Expression Omnibus (GEO) datasets to investigate the molecular alterations of HMEs in GC. Moreover, we explored biological functions, diagnostic and prognostic values of HMEs in GC. Furthermore, we focused on SMYD2, which was up-regulated in GC. SMYD2 could regulate multiple tumor-associated signaling pathways. In addition, in vitro experiments showed that knockdown of SMYD2 inhibited the proliferation, invasion and migration of GC cells. In conclusion, we proved that SMYD2 was an oncogene in GC and could serve as a potential diagnostic target.
2 Materials and methods
2.1 Data acquisition
Gene expression data, associated mutations, and clinical data of GC patients were downloaded from TCGA (https://portal.gdc.cancer.gov/). Series matrix file of GSE13195, GSE66229, GSE15459, GSE26253 and GSE84433 were downloaded from the GEO dataset (https://www.ncbi.nlm.nih.gov/geo/). The differential HMEs were determined using limma R package with adjusted P-value less than 0.05. A tissue microarray comprising 86 paired GC tumor tissues and adjacent normal specimens, supplemented with 8 additional GC cases, was purchased from Shanghai Qutdo Biotech Company (Shanghai, China). The research related to human use has been complied with all the relevant national regulations, institutional policies and in accordance with the tenets of the Helsinki Declaration, and has been approved by the Ethics Committee of the Shandong Cancer Hospital and Institute (Jinan, China).
2.2 Cell culture
AGS cells were obtained from the Cell Bank of the Chinese Academy of Science (Shanghai, P.R. China). MKN-45 cells were obtained from the National Infrastructure of Cell Line Resource (Beijing, P.R. China). AGS cells were cultured in Ham’s F12-medium (HyClone, Logan, UT, USA) supplemented with 12% fetal bovine serum (Gibco, Carlsbad, CA, USA). MKN-45 cells were cultured in RPMI-1640 medium (Gibco) containing 10% fetal bovine serum. All cell lines were incubated under standardized conditions in a humidified atmosphere (37°C, 5% CO2) using a Thermo Fisher Scientific HERAcell 150i incubator (Waltham, MA, USA). All cells were authenticated by short tandem repeat profiling, and tested free from Mycoplasma.
2.3 Consensus clustering analysis of HMEs
A total of 74 HMEs, listed in Supplementary Table 1, were obtained from previous publications (10). 34 shared HMEs between TCGA and GEO GC expression datasets were selected for clustering analysis using the “ConsensusClusterPlus” R package. Three novel GC subtypes were identified based on the cumulative distribution function curve parameters, which exhibited a gradual and smooth increase.
2.4 KEGG and GO
Functional enrichment analysis for KEGG and GO terms was performed using the clusterProfiler R package.
2.5 Immune infiltration analysis
Stromal score, Immune score, and ESTIMATE score for each GC patient were calculated from gene expression profiles using the ESTIMATE R package (31). Immune cell composition in GC tissues was quantified using the CIBERSORT algorithm (32).
2.6 Tumor immune dysfunction and exclusion score and microsatellite instability status analysis
The TIDE scores and the Microsatellite Instability status of GC samples were assessed utilizing the TIDE online platform (http://tide.dfci.harvard.edu/login/) (33, 34).
2.7 Transfection assays
Lipofectamine 2000 (Invitrogen, Carlsbad, CA, USA) was used to transfect siRNAs into GC cells. Cells were collected 72 hours post-transfection. RT-PCR was used to verify the transfection efficiency. The siRNA sequences were listed as follows: si-SMYD2-1 5’-CUCGGAGACUGUAAGACUATT-3’ and si-SMYD2-2 CCCAACGGAAGAUAGAAAUTT-3’.
2.8 H. pylori culture
H. pylori strains 26695 and 11637 were cultured in Brucella broth supplemented with 5% fetal bovine serum at 37°C under microaerophilic conditions. AGS and MKN-45 cells were infected with H. pylori at varying concentrations and collected at specified time points.
2.9 RNA extraction and RT-PCR
Trizol reagent (Invitrogen, Carlsbad, CA, USA) was used to extract RNAs following the manufacturer’s instructions. RT reagent Kit gDNA Eraser (Takara, Shiga, Japan) was employed to reverse mRNAs to cDNA. Finally, SYBR Green (Takara) was used for qRT-PCR of cDNAs. Primer sequences were listed as follows: SMYD2 forward 5’-TGTGTTTGAGGACAGTAACGTG-3’ and reverse 5’-GAGGGAGTACAAAGGATAGTGC-3’; β-actin forward 5’ - AGTTGCGTTACACCCTTTCTTG - 3’ and reverse 5’ - CACCTTCACCGTTCCAGTTTT - 3’.
2.10 Colony formation and CCK8 assay
500 cells per well with different treatments were plated in 6-well plates and cultured for 1–2 weeks. Colonies were fixed with methanol and stained with Giemsa solution. Colonies containing > 50 cells were counted for analysis.
1200 cells per well with different treatments were plated in 96-well plates and cultured for 24, 48, or 72 hours for CCK8 assay. CCK8 reagent (Med Chem Express, Monmouth Junction, NJ, USA) was added to the conditioned medium and incubated for 3 hours. Absorbance was measured at 450 nm using a spectrophotometer. Both assays were performed in triplicate.
2.11 Wound healing and transwell migration assays
For wound healing assays, cells (5 × 10⁵) with different treatments were seeded into 12-well plates and grown to confluence. A sterile pipette tip was used to create a linear scratch. Wound width was measured at 0 and 48 hours. Wound closure rate was calculated as: (wound width at 0 hours – wound width at 48 hours)/wound width at 0 hours × 100%. An inverted phase-contrast microscope was used to view the cells and photograph.
For migration assays, cells (5 × 10⁴) were seeded into the upper chamber of a Matrigel-coated transwell insert. The medium containing 20% FBS was added to the lower chamber. After 48 hours, methanol and crystal violet staining solution were used to fix and stain the cells respectively.
2.12 IHC for tissue microarray
Tissue microarray on glass slides was subjected to deparaffination and dehydration. Then, the array was subjected to epitope retrieval. Next, the array was treated with H2O2 and blocked in goat serum for 30 minutes. Primary antibody of SMYD2 was used to incubate the array at 4°C overnight. The array was incubated with the corresponding secondary antibody on the second day. Finally, a DAB staining kit (Vector Laboratories, Burlingame, CA, USA) was used to stain. Images were used to assess the IHC score. The intensity of positive staining was scored as follows: 0 (negative), 1 (weak), 2 (moderate) and 3 (strong). A scale from 0 to 3 was used to score the proportion of positively stained cells: 0 (0%), 1 (<25%), 2 (25-75%) and 3 (>75%). Final IHC score = Intensity score × Proportion score.
2.13 Western blotting
Lysis buffer supplemented with protease inhibitors was used to extract proteins from cells. The lysates were resolved by SDS-PAGE. Protein was then transferred to PVDF membranes, which were blocked with 5% non-fat milk powder and subsequently incubated with primary antibodies overnight at 4°C. Following this, PVDF membranes were incubated with appropriate secondary antibodies. Signals were detected using an ECL detection reagent (Millipore, St. Louis, MO, USA). The primary antibody used was SMYD2 (D14H7; Cell Signaling Technology, Danvers, MA, USA).
2.14 Statistical analysis
Data were presented as mean ± SEM from three independent experiments. Mann-Whitney U-test or Student’s t-test was used to compare variables between experimental group and control group by GraphPad PRISM version 9 (San Diego, CA, USA). SPSS version 23.0 (IBM, Armonk, NY, USA) was used to analyze clinical data. P < 0.05 was considered statistically significant.
3 Results
3.1 Genetic and transcription alterations of HMEs in GC
In order to investigate the association between HMEs and GC, we performed a comprehensive analysis of somatic mutation frequencies for 74 HMEs using TCGA-STAD data. The results indicated a relatively high mutation frequency in GC samples. In detail, 171 GC samples (90.96%) had HME mutations. Among these, KMT2D exhibited the highest mutation frequency (36%), followed by KMT2C, KMT2B, KMT2A, JARID2, JMJD1C, KMT2E, PHF2, NSD3, SETDB1, NSD2, PRDM16 and HR (Figure 1A). Next, we compared expression of HMEs between GC tissues and adjacent normal samples from the TCGA cohort. 24 HMEs were differentially expressed, with 15 up-regulated and 9 down-regulated genes in GC (Figure 1B). Similar trends were observed in the GSE13195 and GSE66229 datasets (Supplementary Figure 1A). Correlation analysis revealed moderately correlated HMEs expression patterns between TCGA and GEO datasets (Figure 1C; Supplementary Figure 1B). We categorized GC patients into three subtypes based on the expression profiles of HMEs using a consensus clustering algorithm (Figure 1D; Supplementary Figures 2A, B). Survival analysis indicated that patients with GC in cluster 2 (C2) had a higher survival probability than those in cluster 1 (C1) and cluster 3 (C3) (Figure 1E; Supplementary Figure 2C). To identify subtype-associated pathways, gene set variation analysis was performed comparing C1 + C3 with C2. The results showed that C1+C3 was significantly enriched in cell cycle and p53 pathways (Figure 1F). These findings collectively highlighted the critical regulatory role of HMEs in GC tumorigenesis and progression.
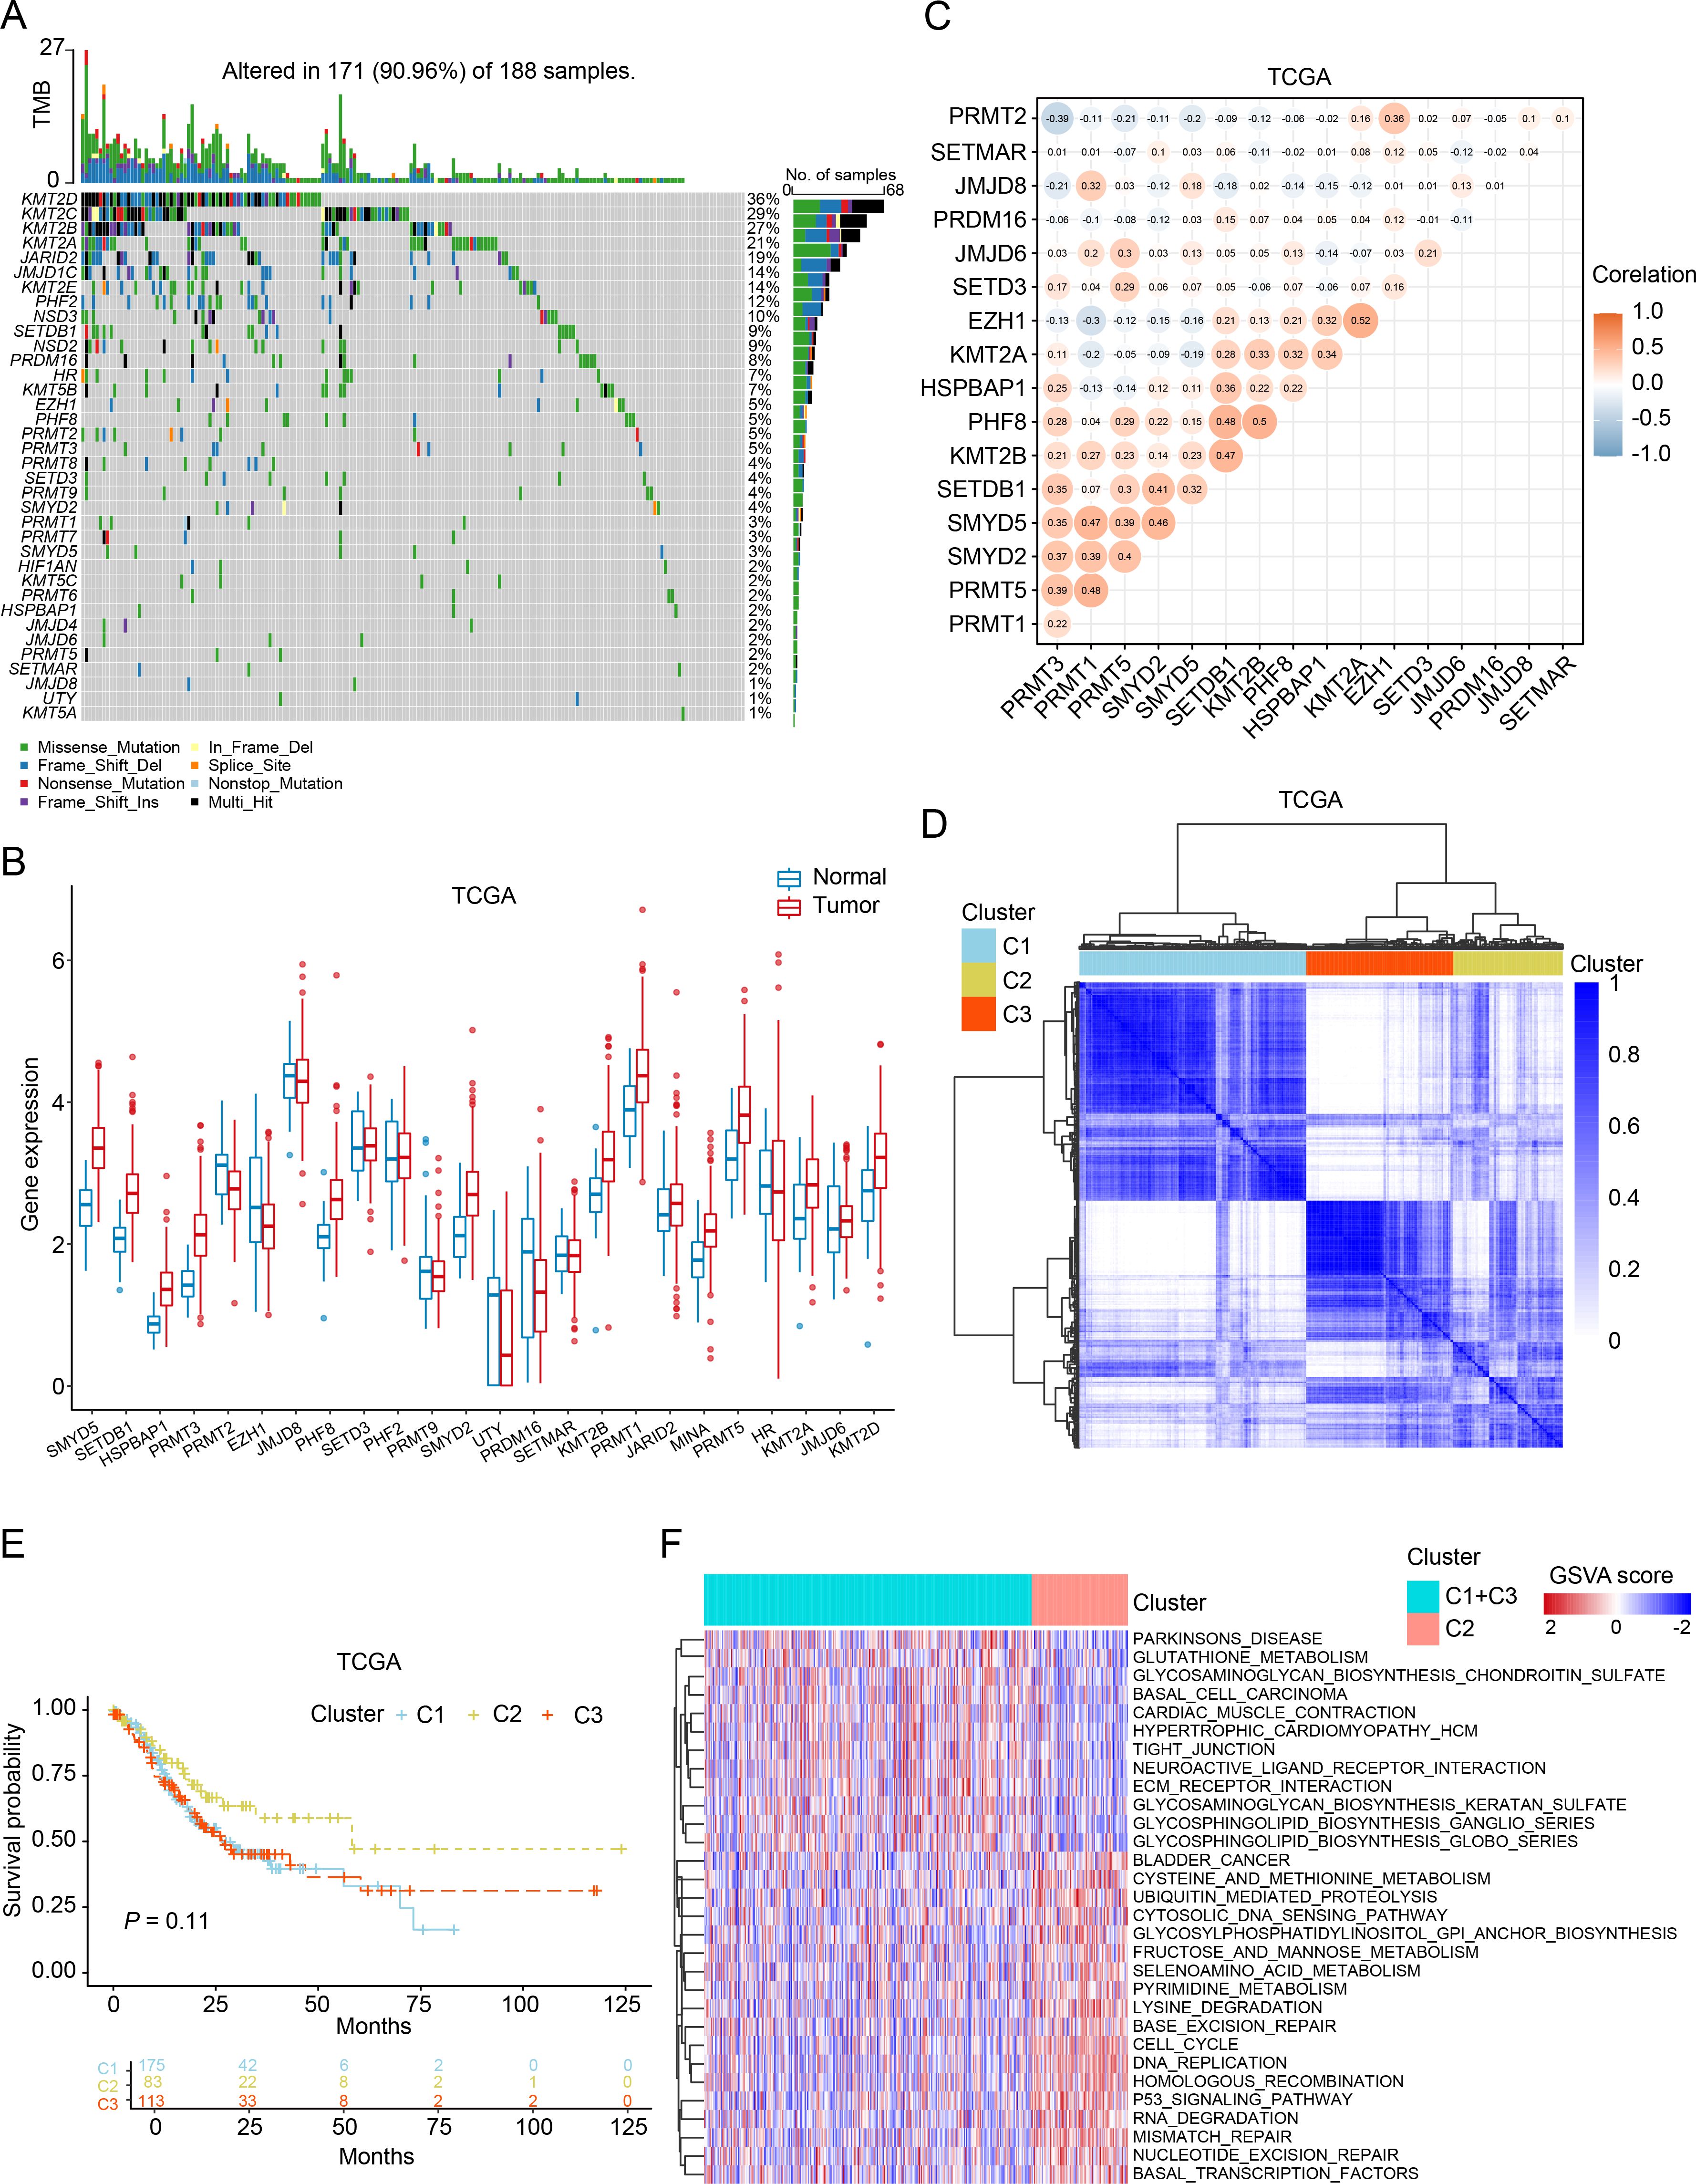
Figure 1. Genetic, transcriptional alterations, and molecular subtypes of HMEs in GC. (A) MAFtool exhibited the incidence of somatic mutations of HMEs in 188 GC patients from the TCGA dataset. (B) Differential expression of HMEs between GC tissues and paired para-carcinoma tissues. The data were obtained from the TCGA dataset. (C) Correlation analysis of HMEs. (D) Identification of three molecular subtypes in TCGA GC samples via consensus clustering analysis. (E) Survival analysis among C1, C2, and C3. Kaplan-Meier plot and log-rank tests were conducted. (F) GSVA enrichment analysis comparing subtypes C2 versus C1+C3. Red indicates pathway enrichment; blue indicates depletion.
3.2 The diagnostic performance of HMEs in GC
We have found that the expression of some HMEs was different in GC tissues compared to para-carcinoma tissues. To evaluate their diagnostic potential, we systematically analyzed HMEs expression profiles in TCGA, GSE13195 and GSE66229 datasets, respectively. Consistent intersection analysis revealed 9 consistently up-regulated and 1 down-regulated HME across all datasets (Figure 2A; Supplementary Figure 3A). We used 9 up-regulated HMEs to train the diagnostic model with ten-fold cross-validation using Random Forest, Logistic Regression, Support Vector Machine, Naive Bayes, Linear Discriminant Analysis, Bagging, and Gradient Boosting Decision Tree (Supplementary Figure 3B). Notably, all models demonstrated high diagnostic accuracy with AUC values ranging from 0.95 to 0.96 (Figure 2B). Feature selection via Random Forest reduced the biomarker set to six HMEs using an importance threshold of 0.075 (Figure 2C). The simplified 6-HME model maintained comparable performance with AUC 0.96 (Figure 2D). Validation in TCGA and GSE13195 cohorts confirmed robust diagnostic capability, achieving AUC values of 0.88 and 0.96 respectively (Figure 2E). Collectively, these findings demonstrated that HME-based biomarkers exhibit strong potential for gastric cancer diagnosis.
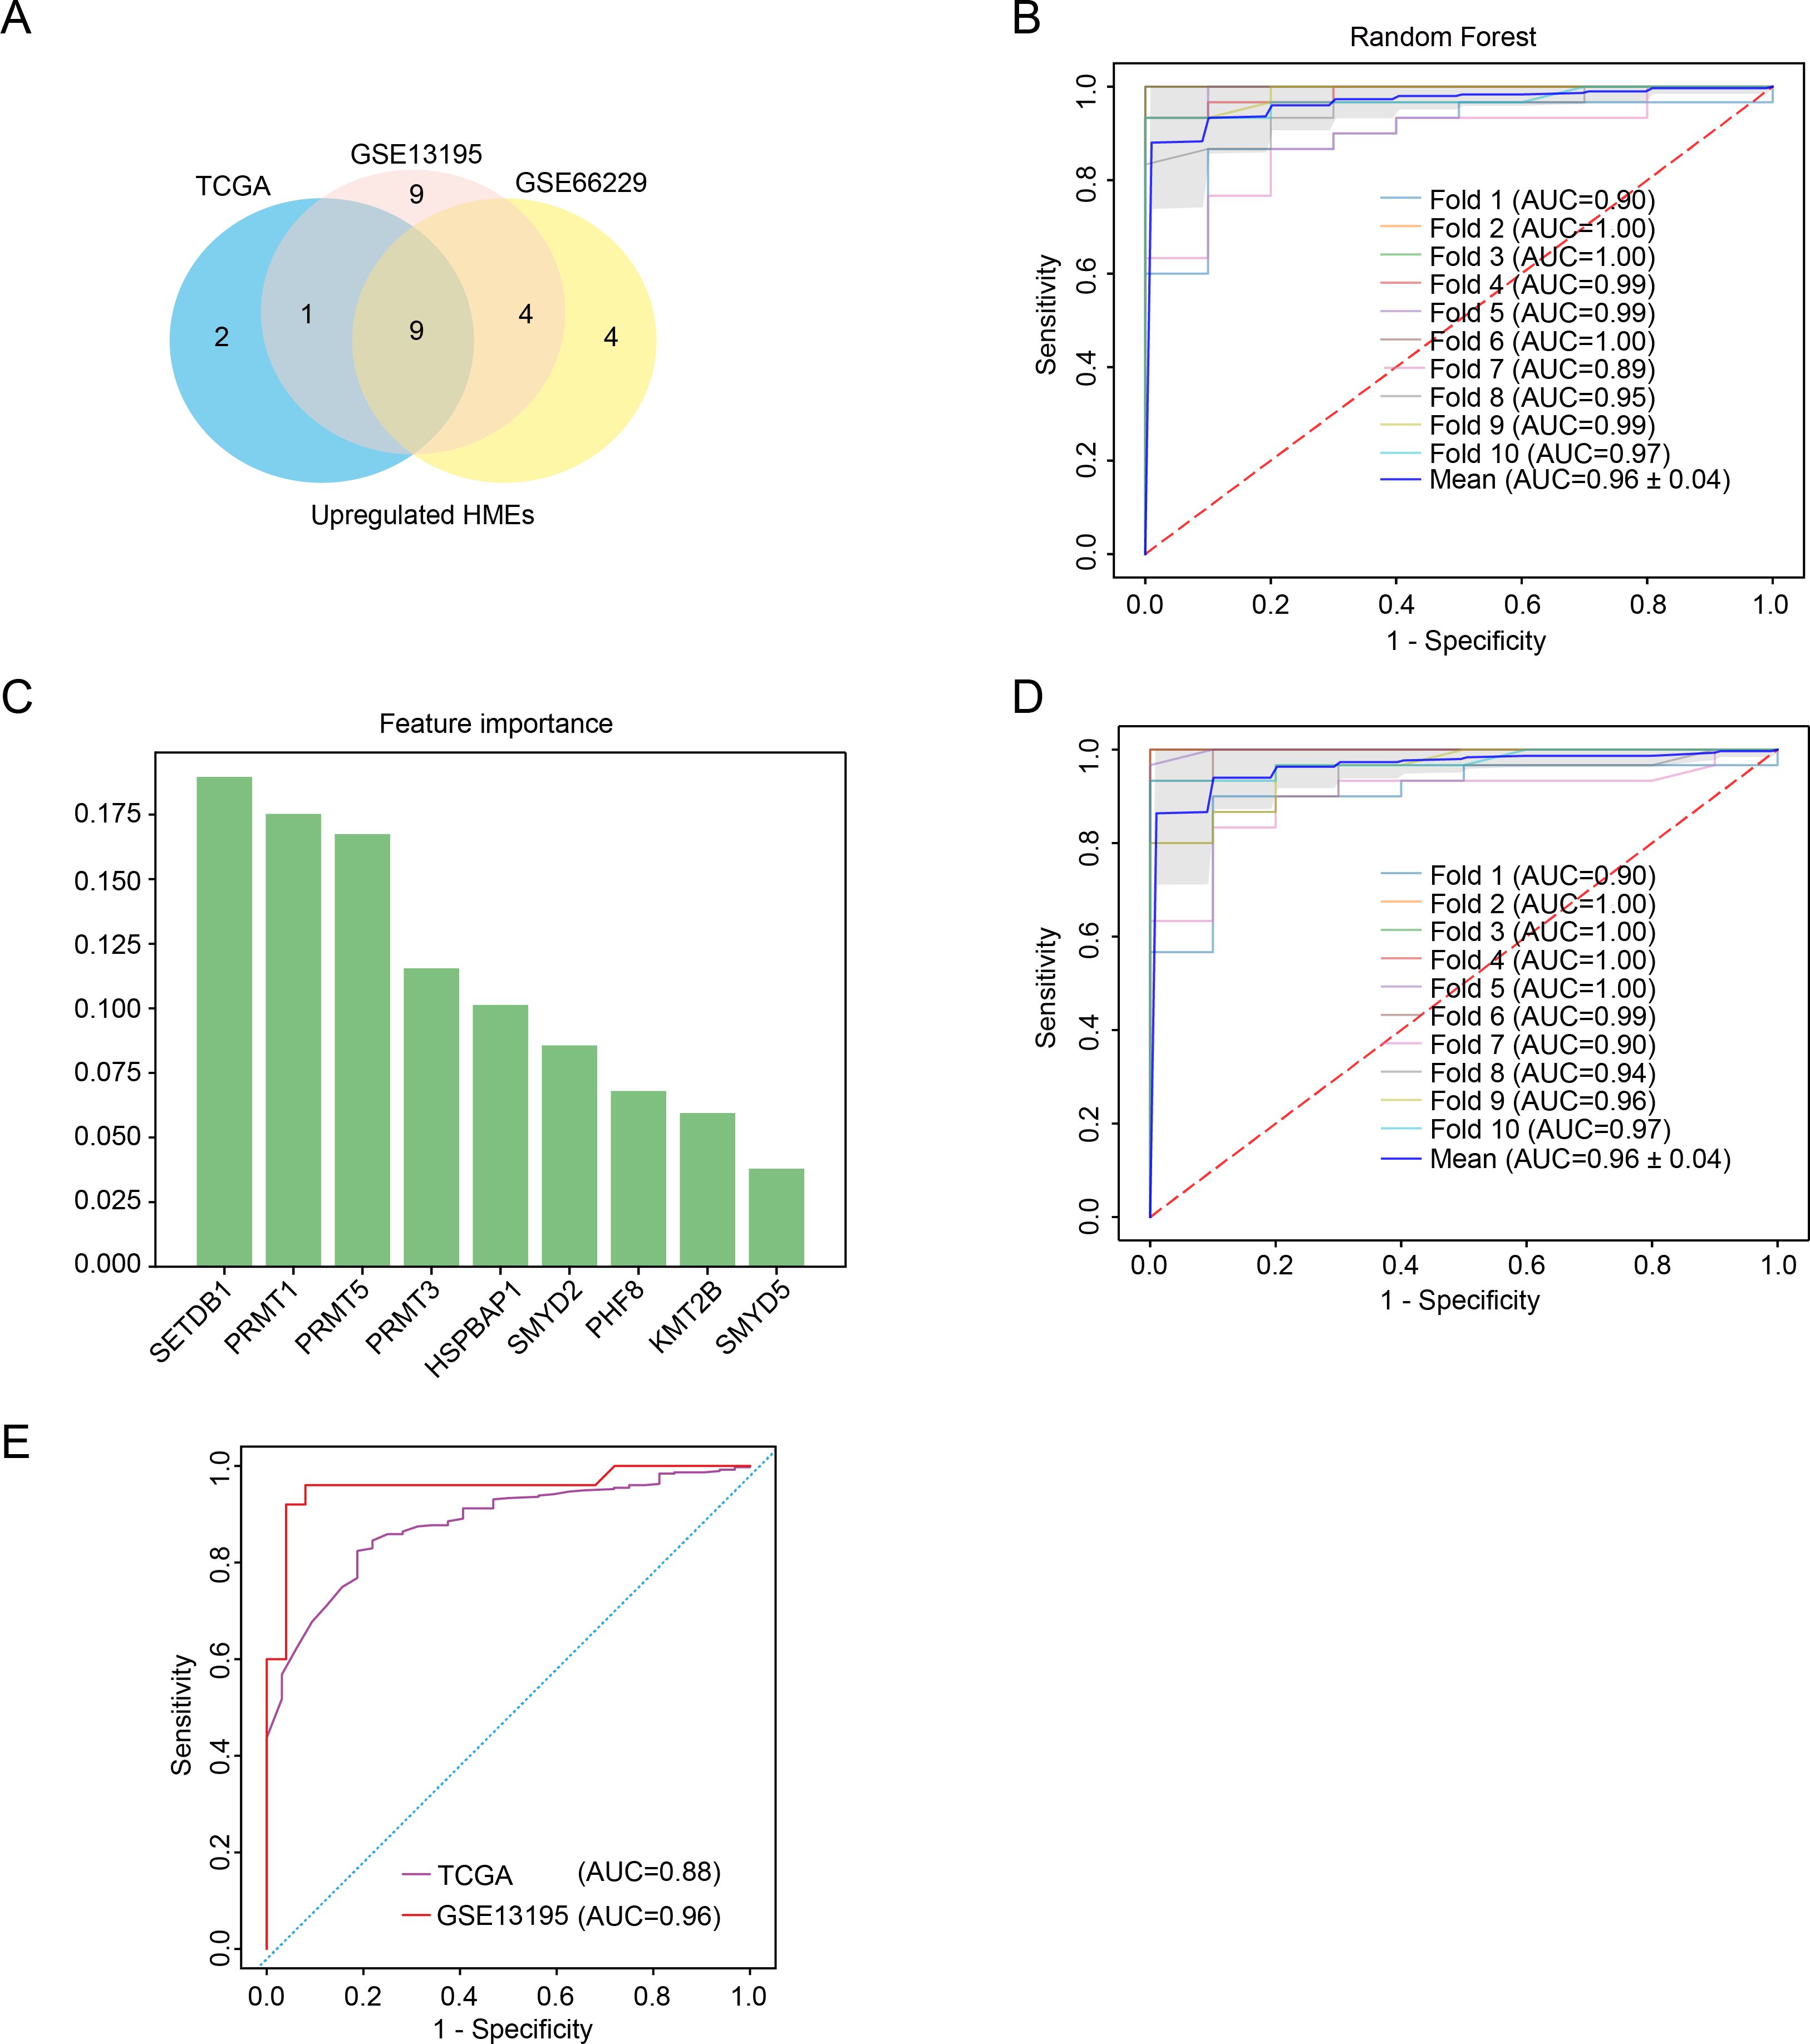
Figure 2. Characterization of key HMEs in GC. (A) Venn diagram identifying common upregulated HMEs across GSE13195, GSE66229 and TCGA datasets. (B) ROC curve assessing the diagnostic potential of 9 upregulated HMEs using random forest with ten-fold cross-validation. (C) Feature importance ranking of the 9 upregulated HMEs derived from the random forest model. (D) ROC curve evaluating the diagnostic potential of the 6 upregulated HMEs using ten-fold cross-validation. (E) Validation of the 6-HME signature’s diagnostic performance in TCGA GC data and GSE13195.
3.3 SMYD2 overexpression in GC patients associated with poor prognosis
To identify pivotal regulators of GC development, we focused on the six HMEs including SETDB1, PRMT1, PRMT5, PRMT3, HSPBAP1 and SMYD2. There are fewer studies on SMYD2 than the other genes. Notably, elevated SMYD2 expression correlated significantly with poorer patient prognosis (Figure 3A). SMYD2 was also up-regulated across multiple cancer types (Figure 3B). Comparative analysis of paired tumor and para-carcinoma tissues showed SMYD2 overexpression across most cancer types, except for lung adenocarcinoma (Figure 3C). Furthermore, SMYD2 expression was positively related to tumor mutation burden in GC (Supplementary Figure 4A). The high-SMYD2 group exhibited higher mutation counts (Figure 3D) and increased mutational co-occurrence compared to the low-SMYD2 group (Supplementary Figure 4B).
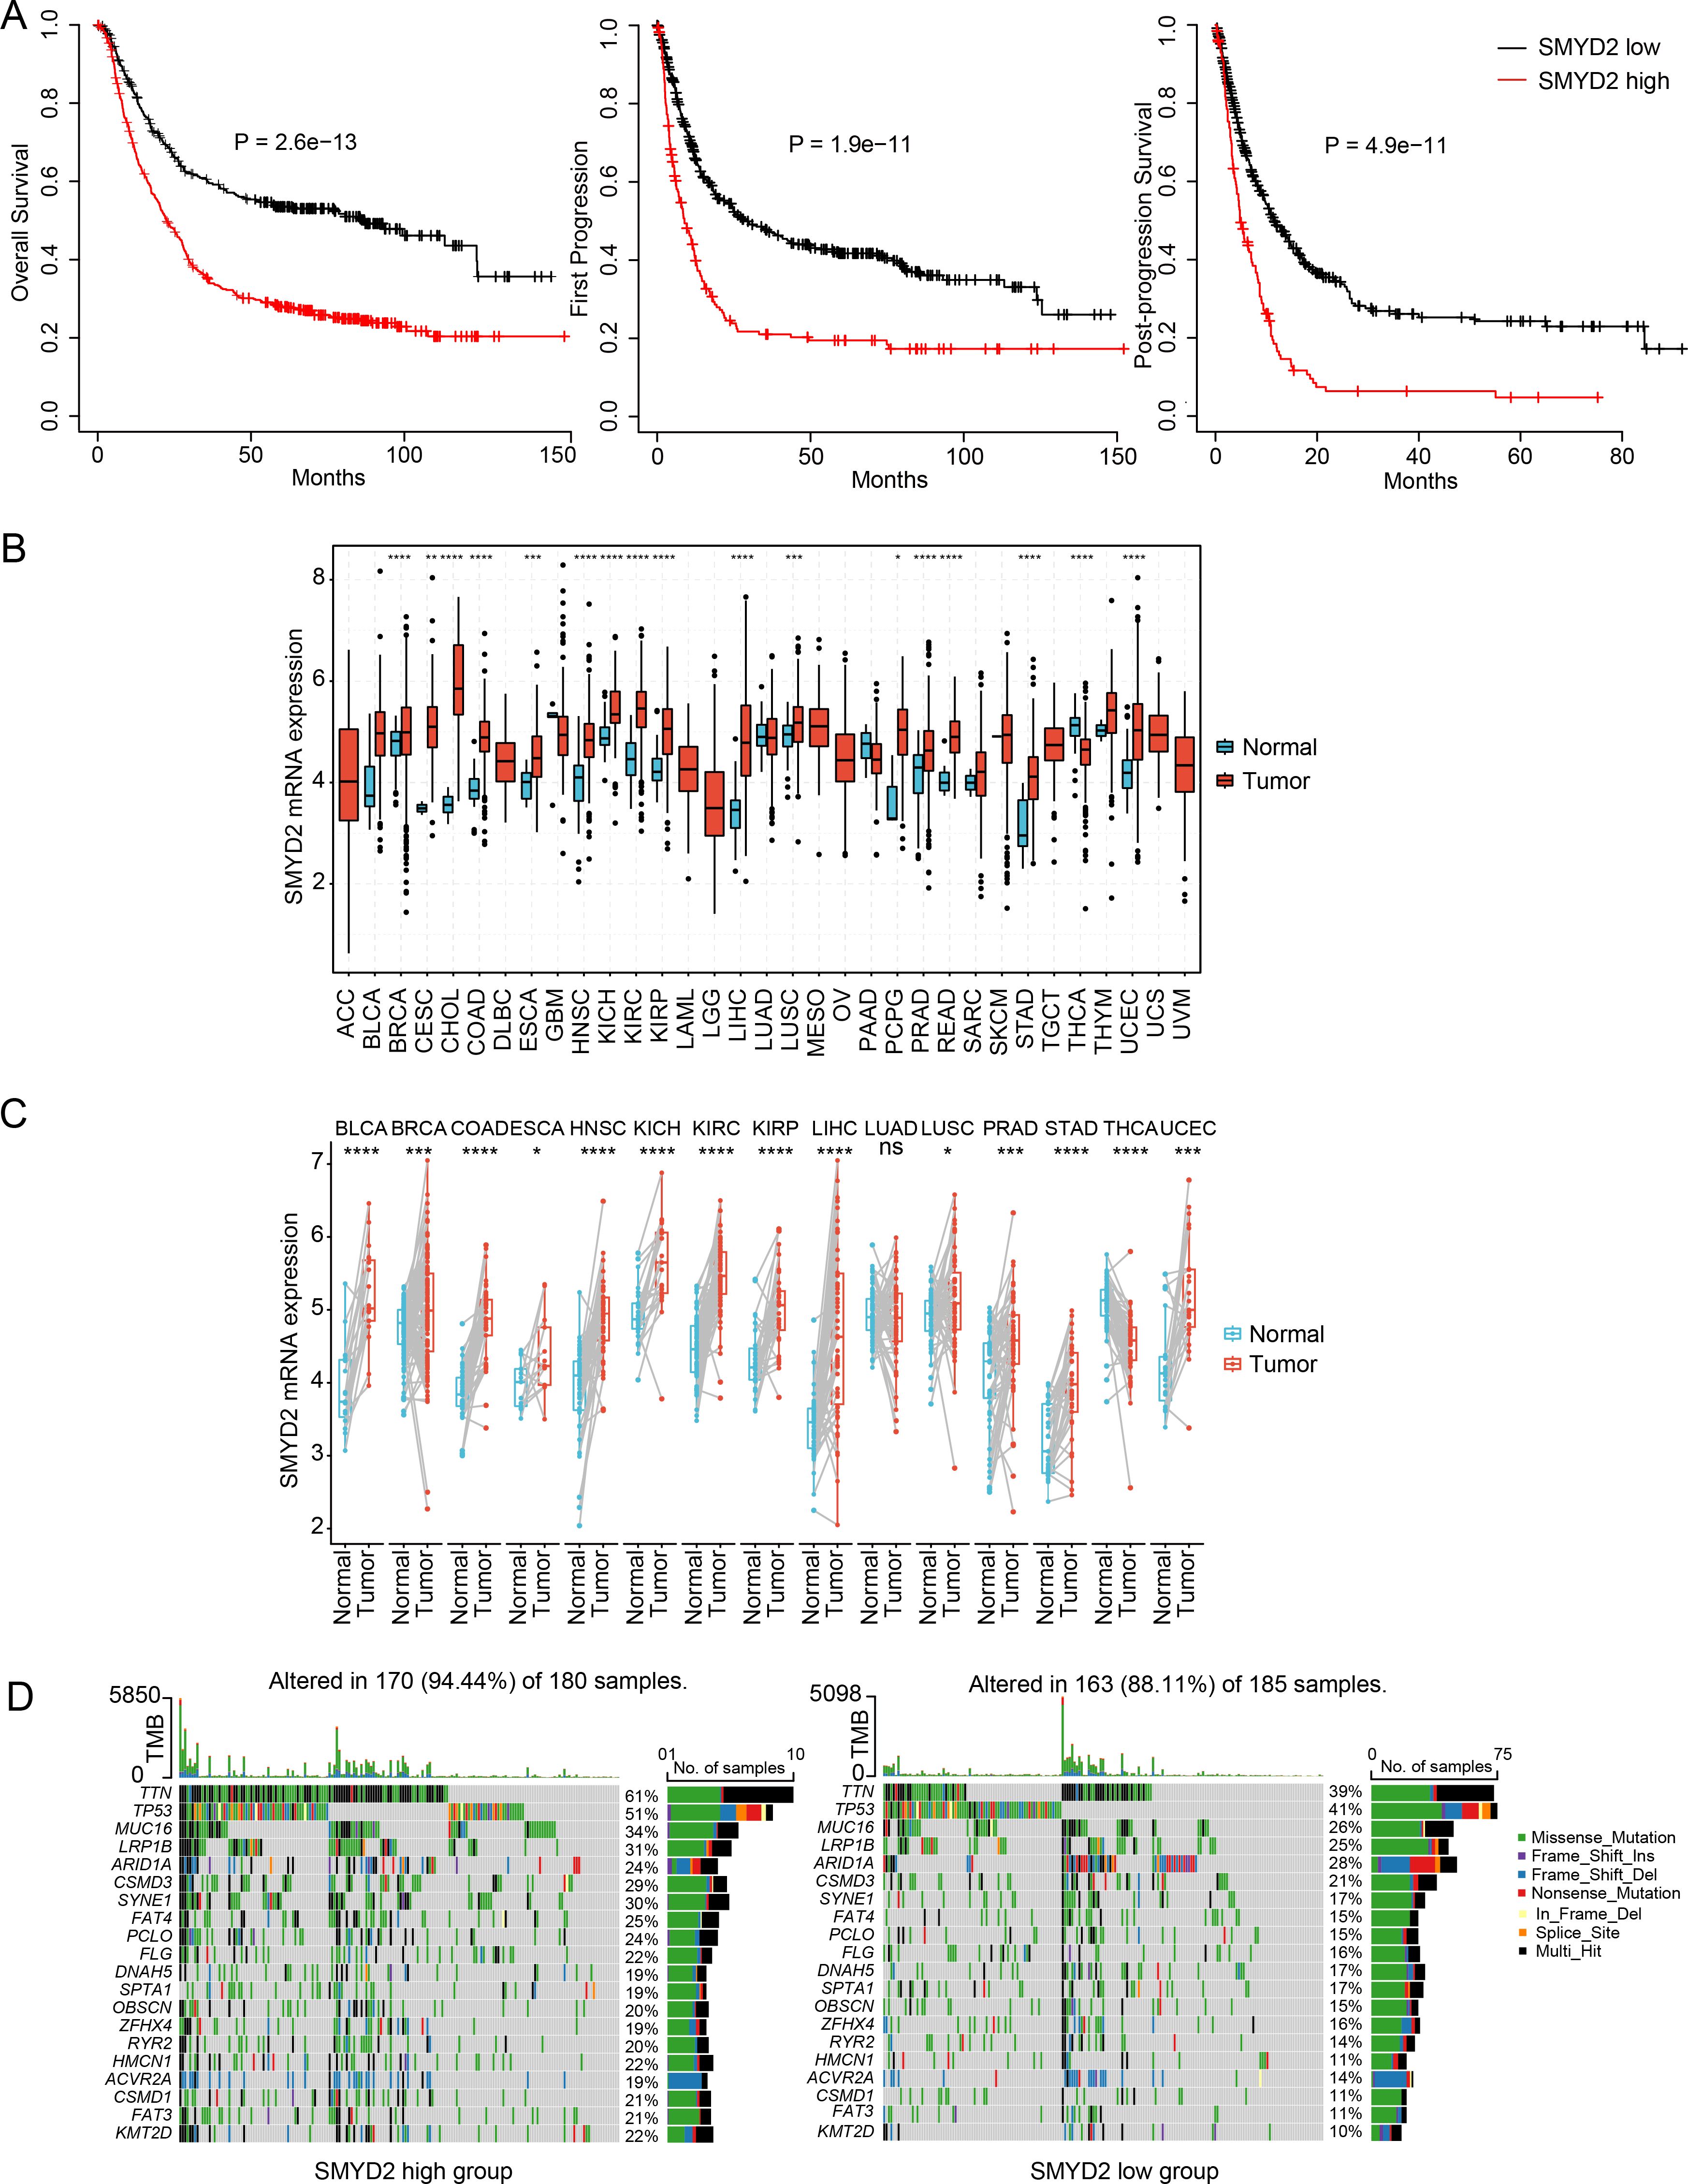
Figure 3. Expression and prognosis significance of SMYD2 in GC. (A) Kaplan-Meier survival analysis comparing survival in GC patients stratified by SMYD2 expression. (B) SMYD2 expression levels across tumor tissues versus normal tissues based on TCGA dataset. (C) SMYD2 expression in paired GC tumor tissues and adjacent normal tissues based on TCGA dataset. (D) Waterfall plot depicting somatic mutation profiles in high versus low SMYD2 groups. *P < 0.05, **P < 0.01, ***P < 0.001, ****P < 0.0001.
3.4 Function landscape of SMYD2 in GC
To identify SMYD2-associated genes and pathways, we performed comparative transcriptomic analysis of TCGA and GEO datasets, analyzing differentially expressed genes (adjusted p-value < 0.05) between SMYD2-high and SMYD2-low expression groups (stratified by median expression cutoff) (Figure 4A). Venn diagram analysis identified 252 consistently up-regulated genes (Figure 4B) and 277 down-regulated genes (Supplementary Figure 5A). GO enrichment analysis revealed that up-regulated genes were predominantly associated with mitochondrial function, mitotic processes and cell cycle checkpoint pathways (Figure 4C). Concurrently, KEGG pathway analysis demonstrated significant enrichment of up-regulated genes in proteasome activity, cell cycle regulation and DNA replication pathways (Figure 4D). For down-regulated genes, both GO and KEGG analyses showed primary enrichment in biological processes related to cell-substrate adhesion, cytoskeletal organization, and focal adhesion pathways (Supplementary Figures 5B, C). These collective findings suggest that SMYD2 may modulate signaling networks governing tumor cell proliferation and metastatic processes.
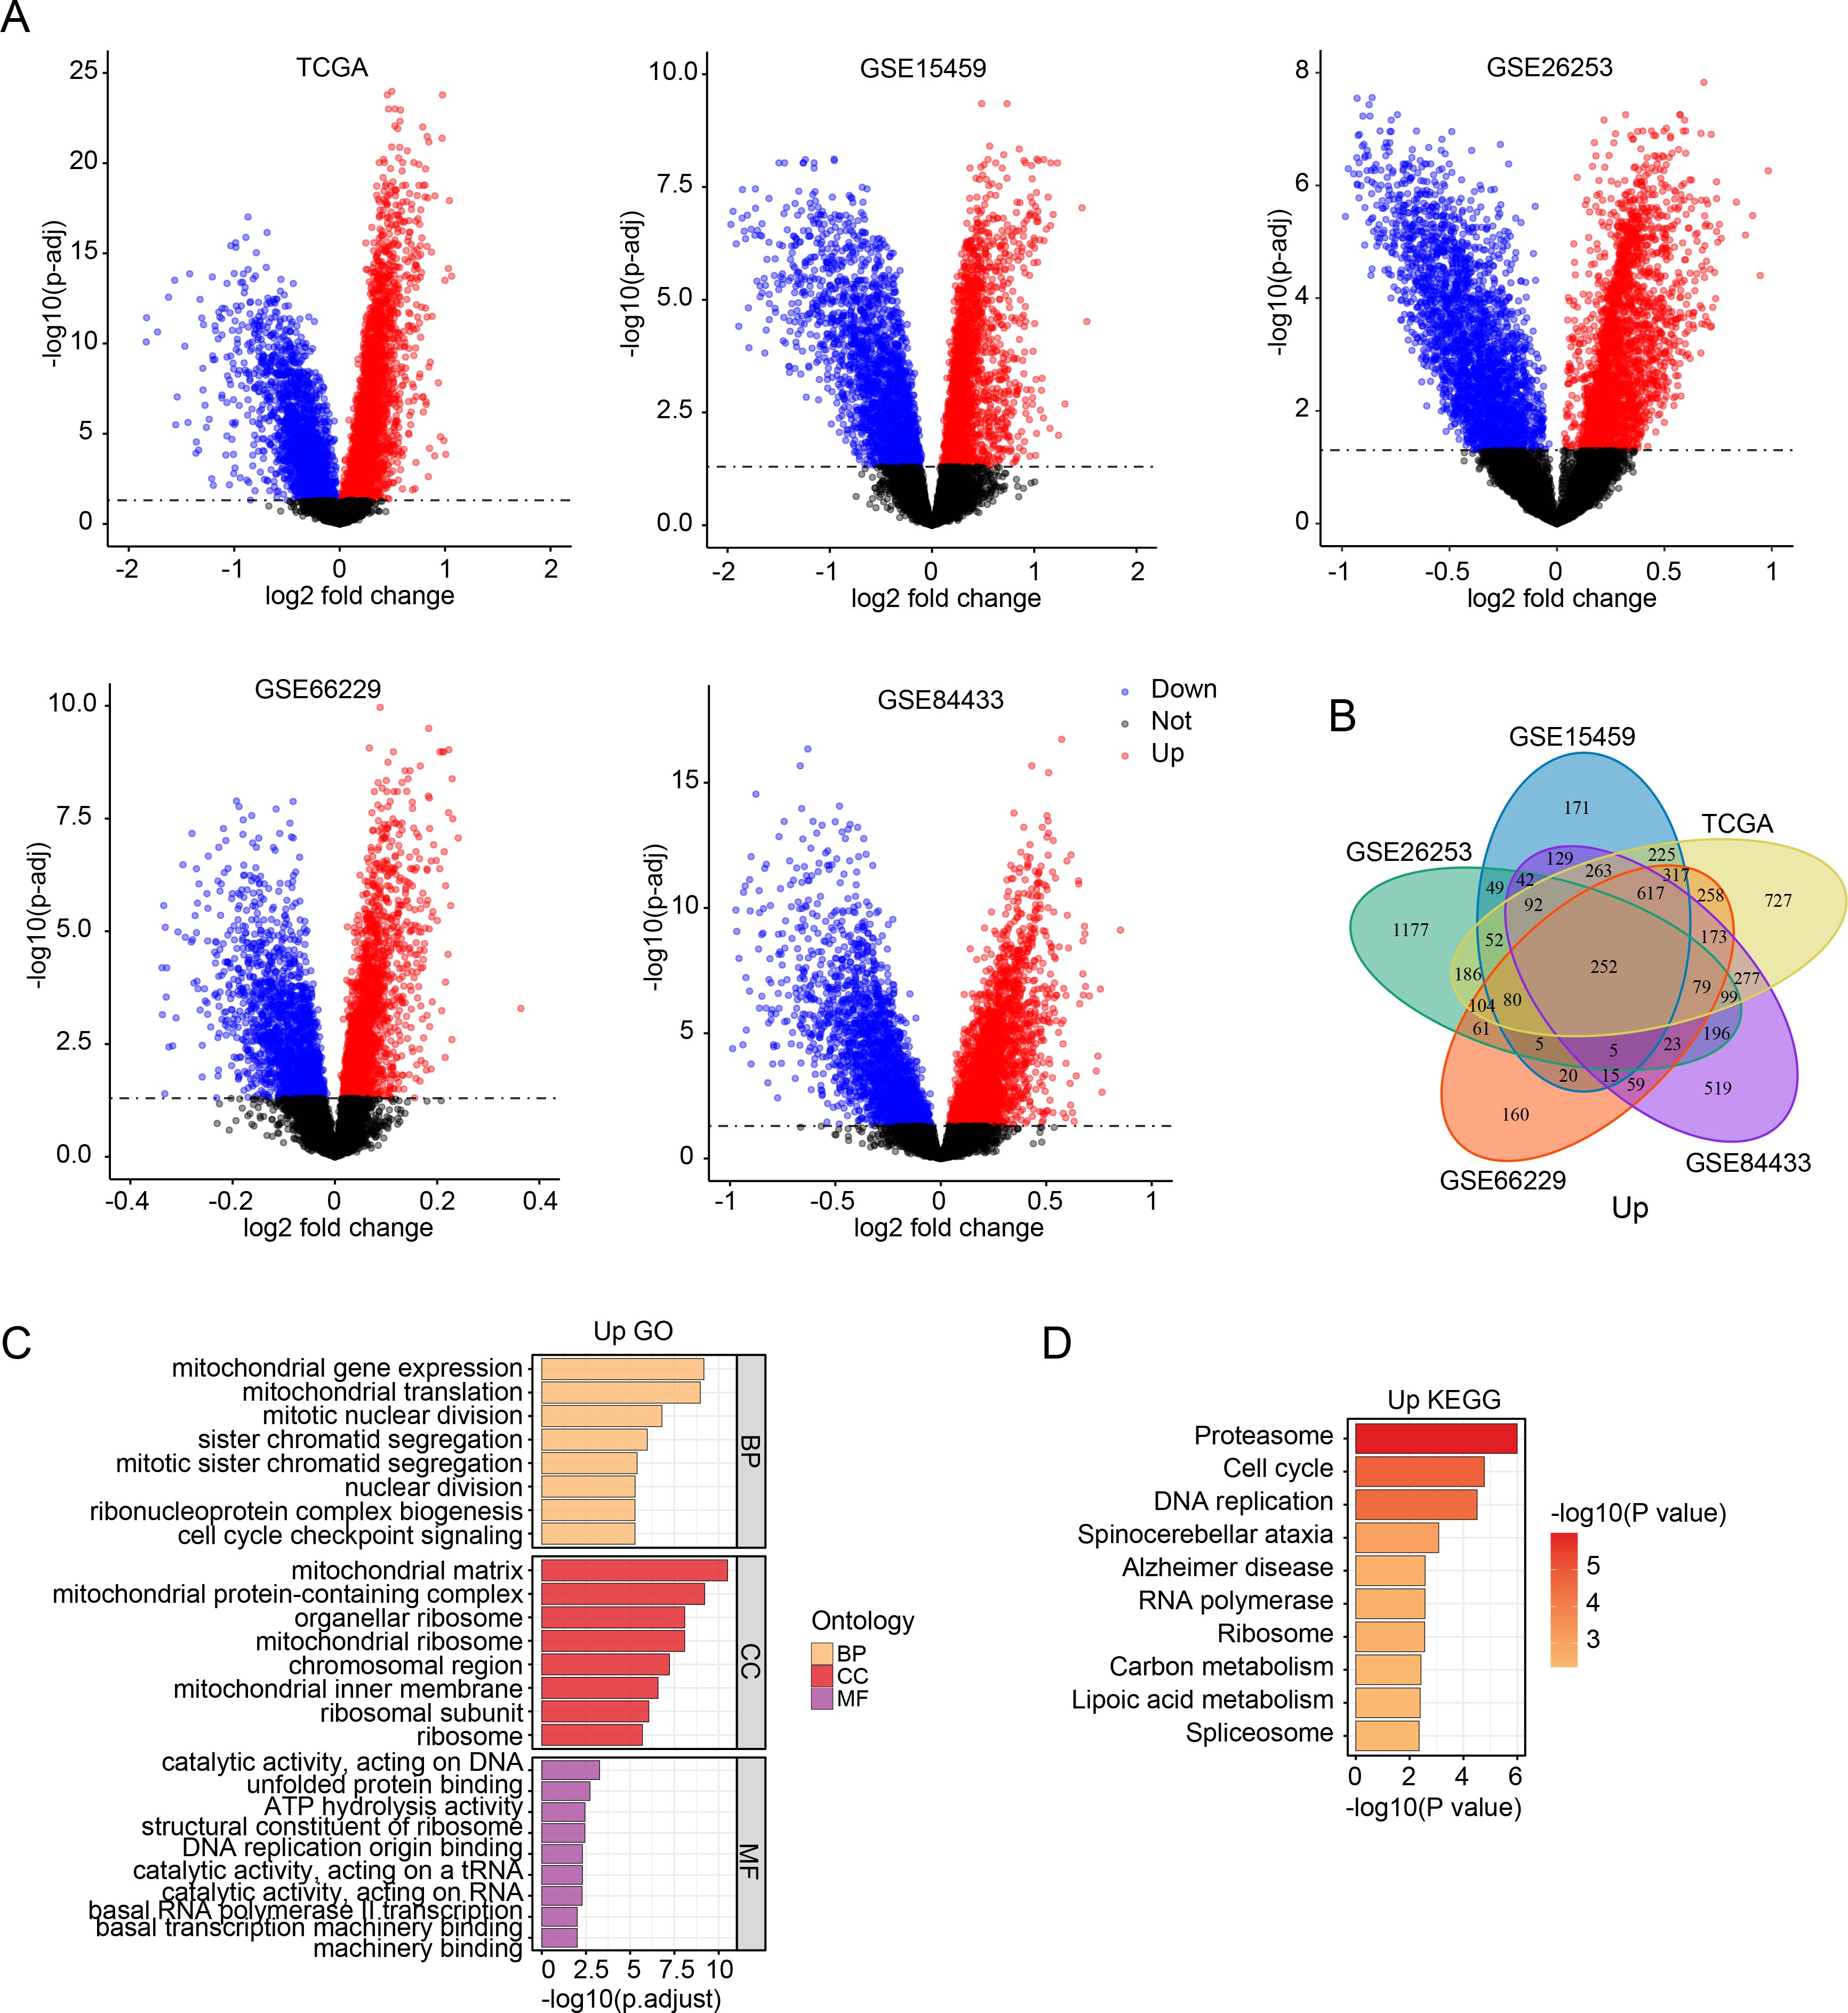
Figure 4. SMYD2-associated genes and pathway enrichment. (A) Volcano plots of differentially expressed genes between SMYD2-high and SMYD2-low groups across five datasets (TCGA, GSE15459, GSE26253, GSE66229, GSE84433). (B) Venn diagram identifying common upregulated genes in SMYD2-high group across TCGA, GSE15459, GSE26253, GSE66229 and GSE84433 datasets. (C, D) GO (C) and KEGG (D) pathway enrichment analyses of the 252 consistently upregulated genes in SMYD2-high group.
3.5 Association between SMYD2 and immune infiltration in GC
To explore the association between SMYD2 expression and tumor immune infiltration in GC patients, we performed CIBERSORT analysis in TCGA and GEO datasets. SMYD2 expression positively correlated with CD8+ T cells, activated CD4+ T cells, and M0/M1 macrophage infiltration, but negatively correlated with M2 macrophages and regulatory T cells (Tregs) (Figure 5A). Subsequent analysis revealed SMYD2 positively correlated with tumor purity while inversely correlating with immune score, stromal score, and ESTIMATE score (Figure 5B). Using the TIDE algorithm (34), we evaluated immunotherapy response potential, where lower TIDE scores indicate greater predicted benefit. High SMYD2 expression associated with reduced TIDE, dysfunction, and exclusion scores (Figure 5C), suggesting enhanced immunotherapy sensitivity in SMYD2-high GC patients. These findings implicate SMYD2 as a predictive biomarker for immunotherapy efficacy in GC.
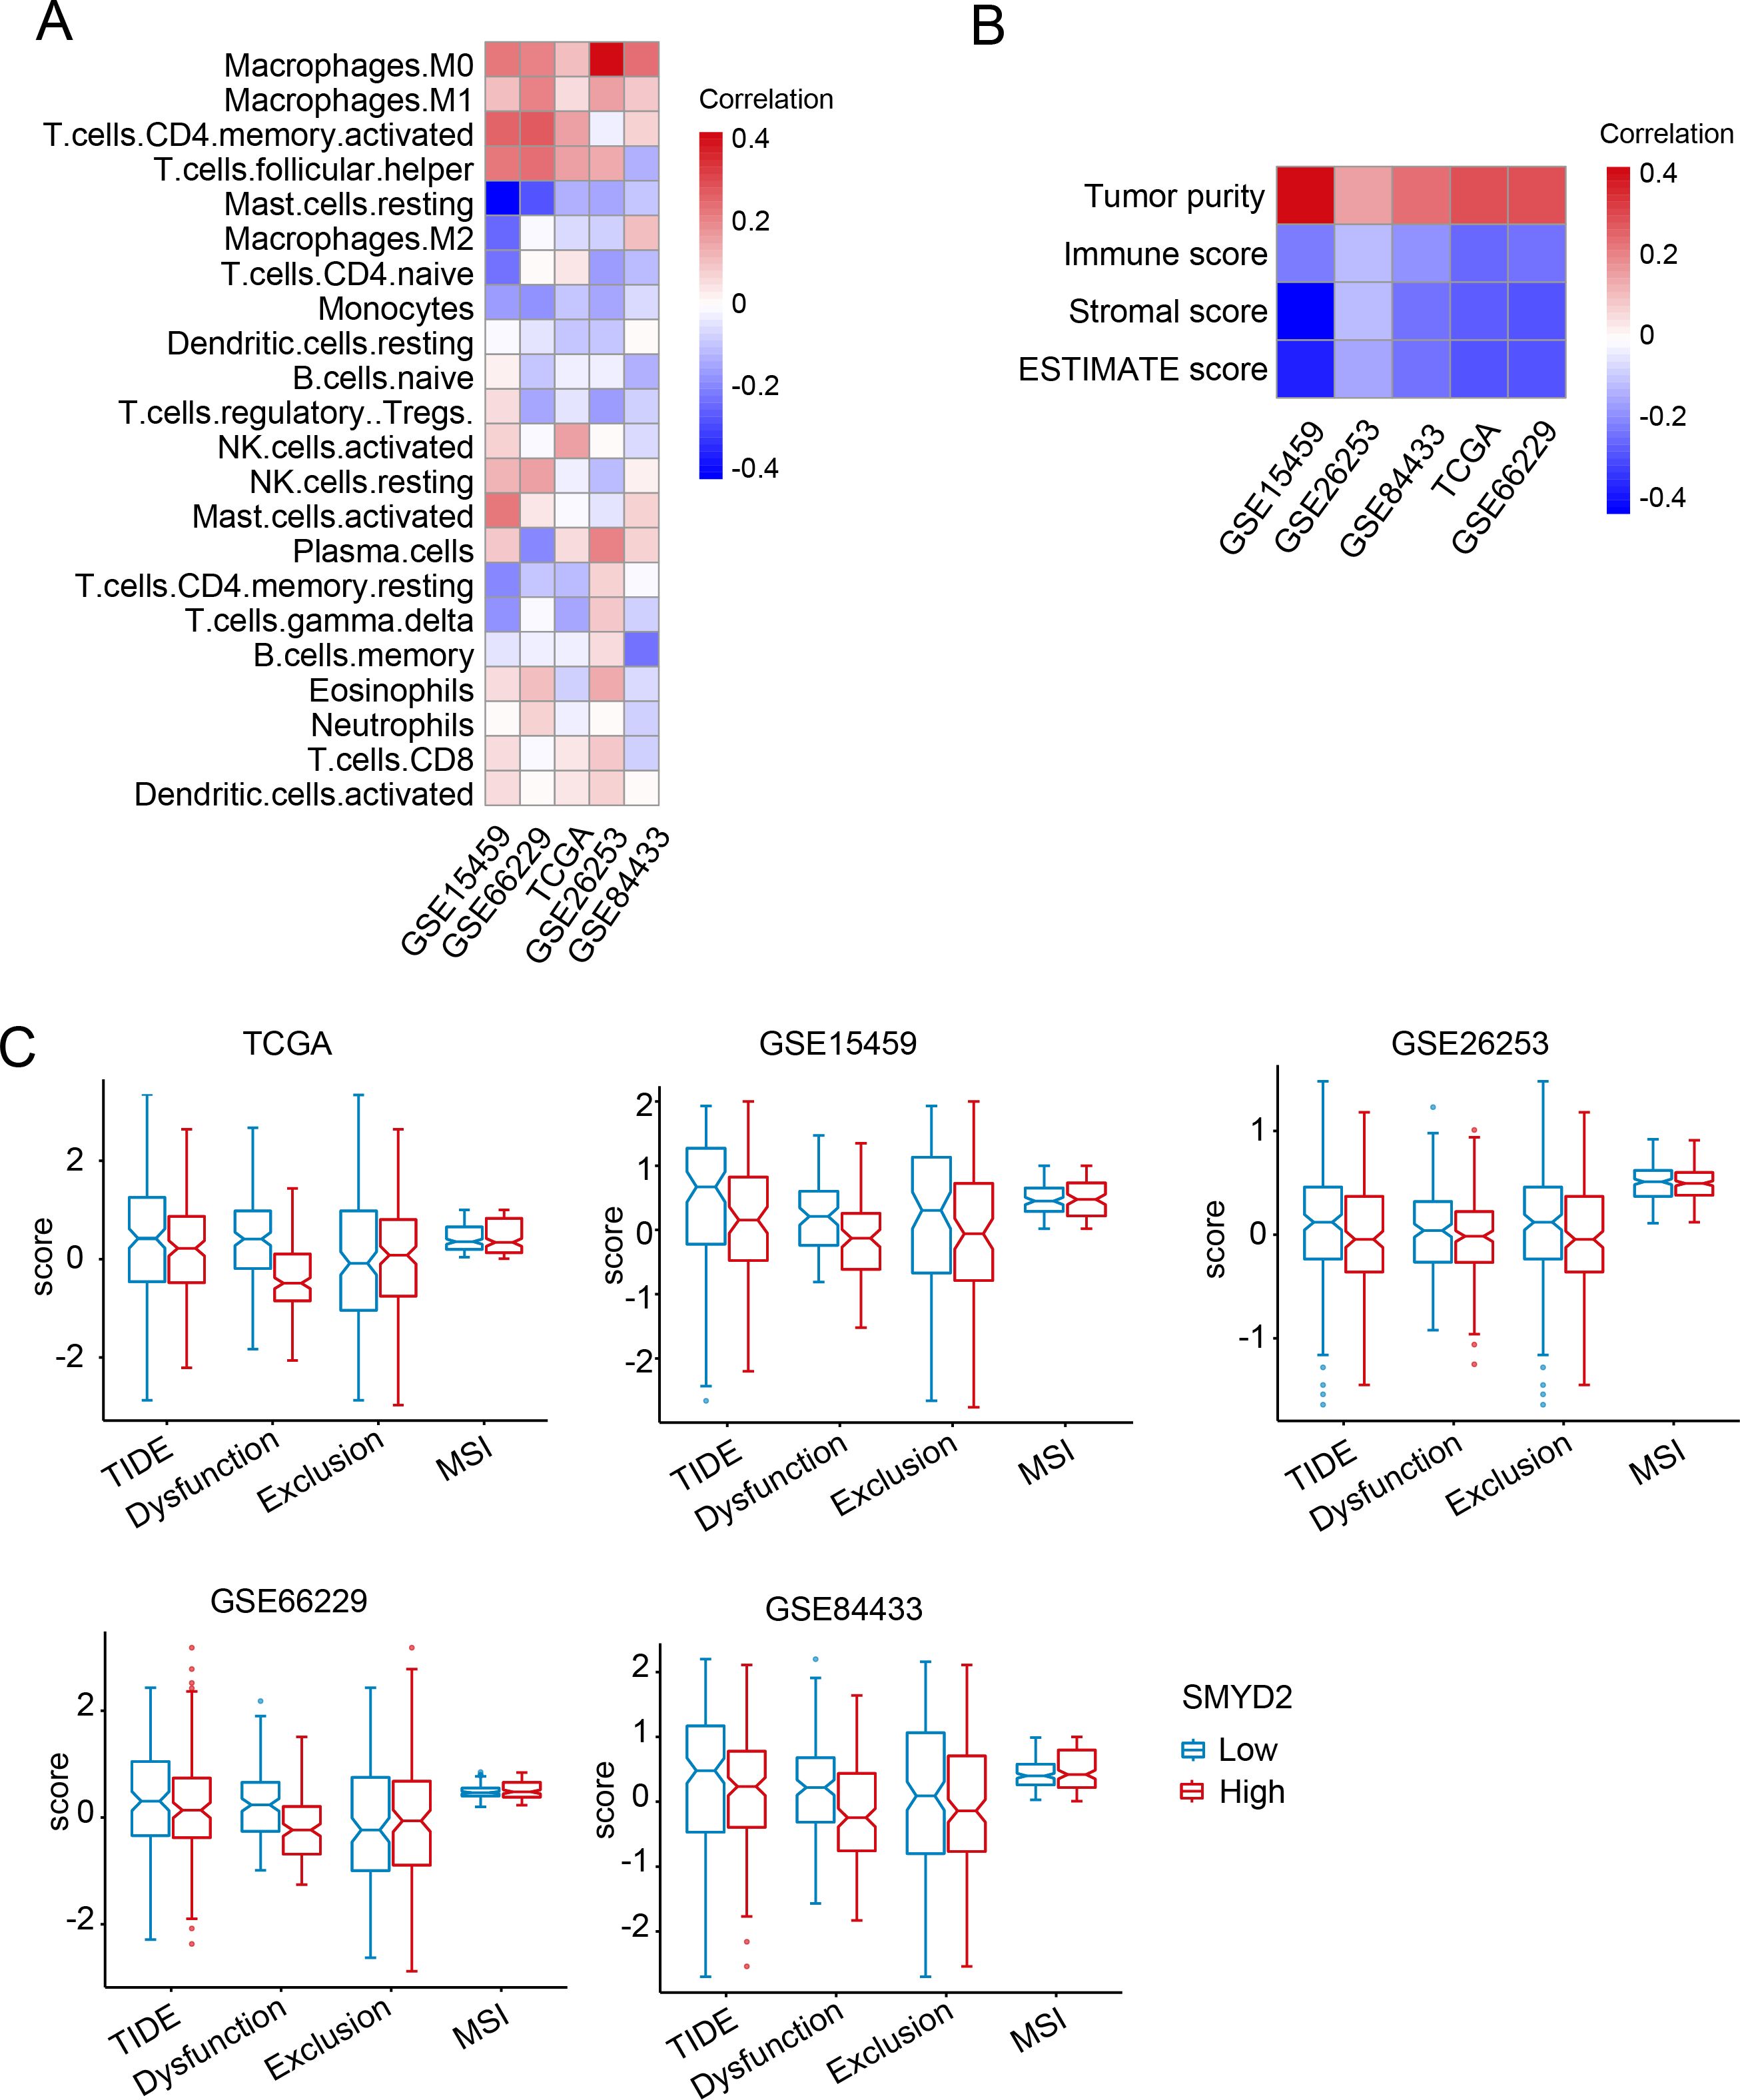
Figure 5. Correlation of SMYD2 with tumor immunity in GC. (A) Association between SMYD2 expression levels and immune cell infiltration across multiple GC expression datasets. (B) Association between SMYD2 expression and immune/stromal/ESTIMATE scores. (C) Correlation of SMYD2 expression with Tumor Immune Dysfunction and Exclusion (TIDE) scores, T cell dysfunction, T cell exclusion, and microsatellite instability (MSI) in TCGA and GEO datasets.
3.6 SMYD2 expression was elevated in GC tissues
We measured SMYD2 expression in human GC samples and adjacent normal samples using a tissue microarray. Results showed that SMYD2 expression was significantly elevated in GC samples (Figures 6A, B). ROC curve analysis revealed SMYD2’s discriminative capacity for GC diagnosis, yielding an AUC of 0.877 (Figure 6C). Association analysis between SMYD2 expression and clinicopathological characteristics revealed significant correlation with Borrmann subtype (P = 0.005), while showing non-significant associations with other parameters (Supplementary Table 2).
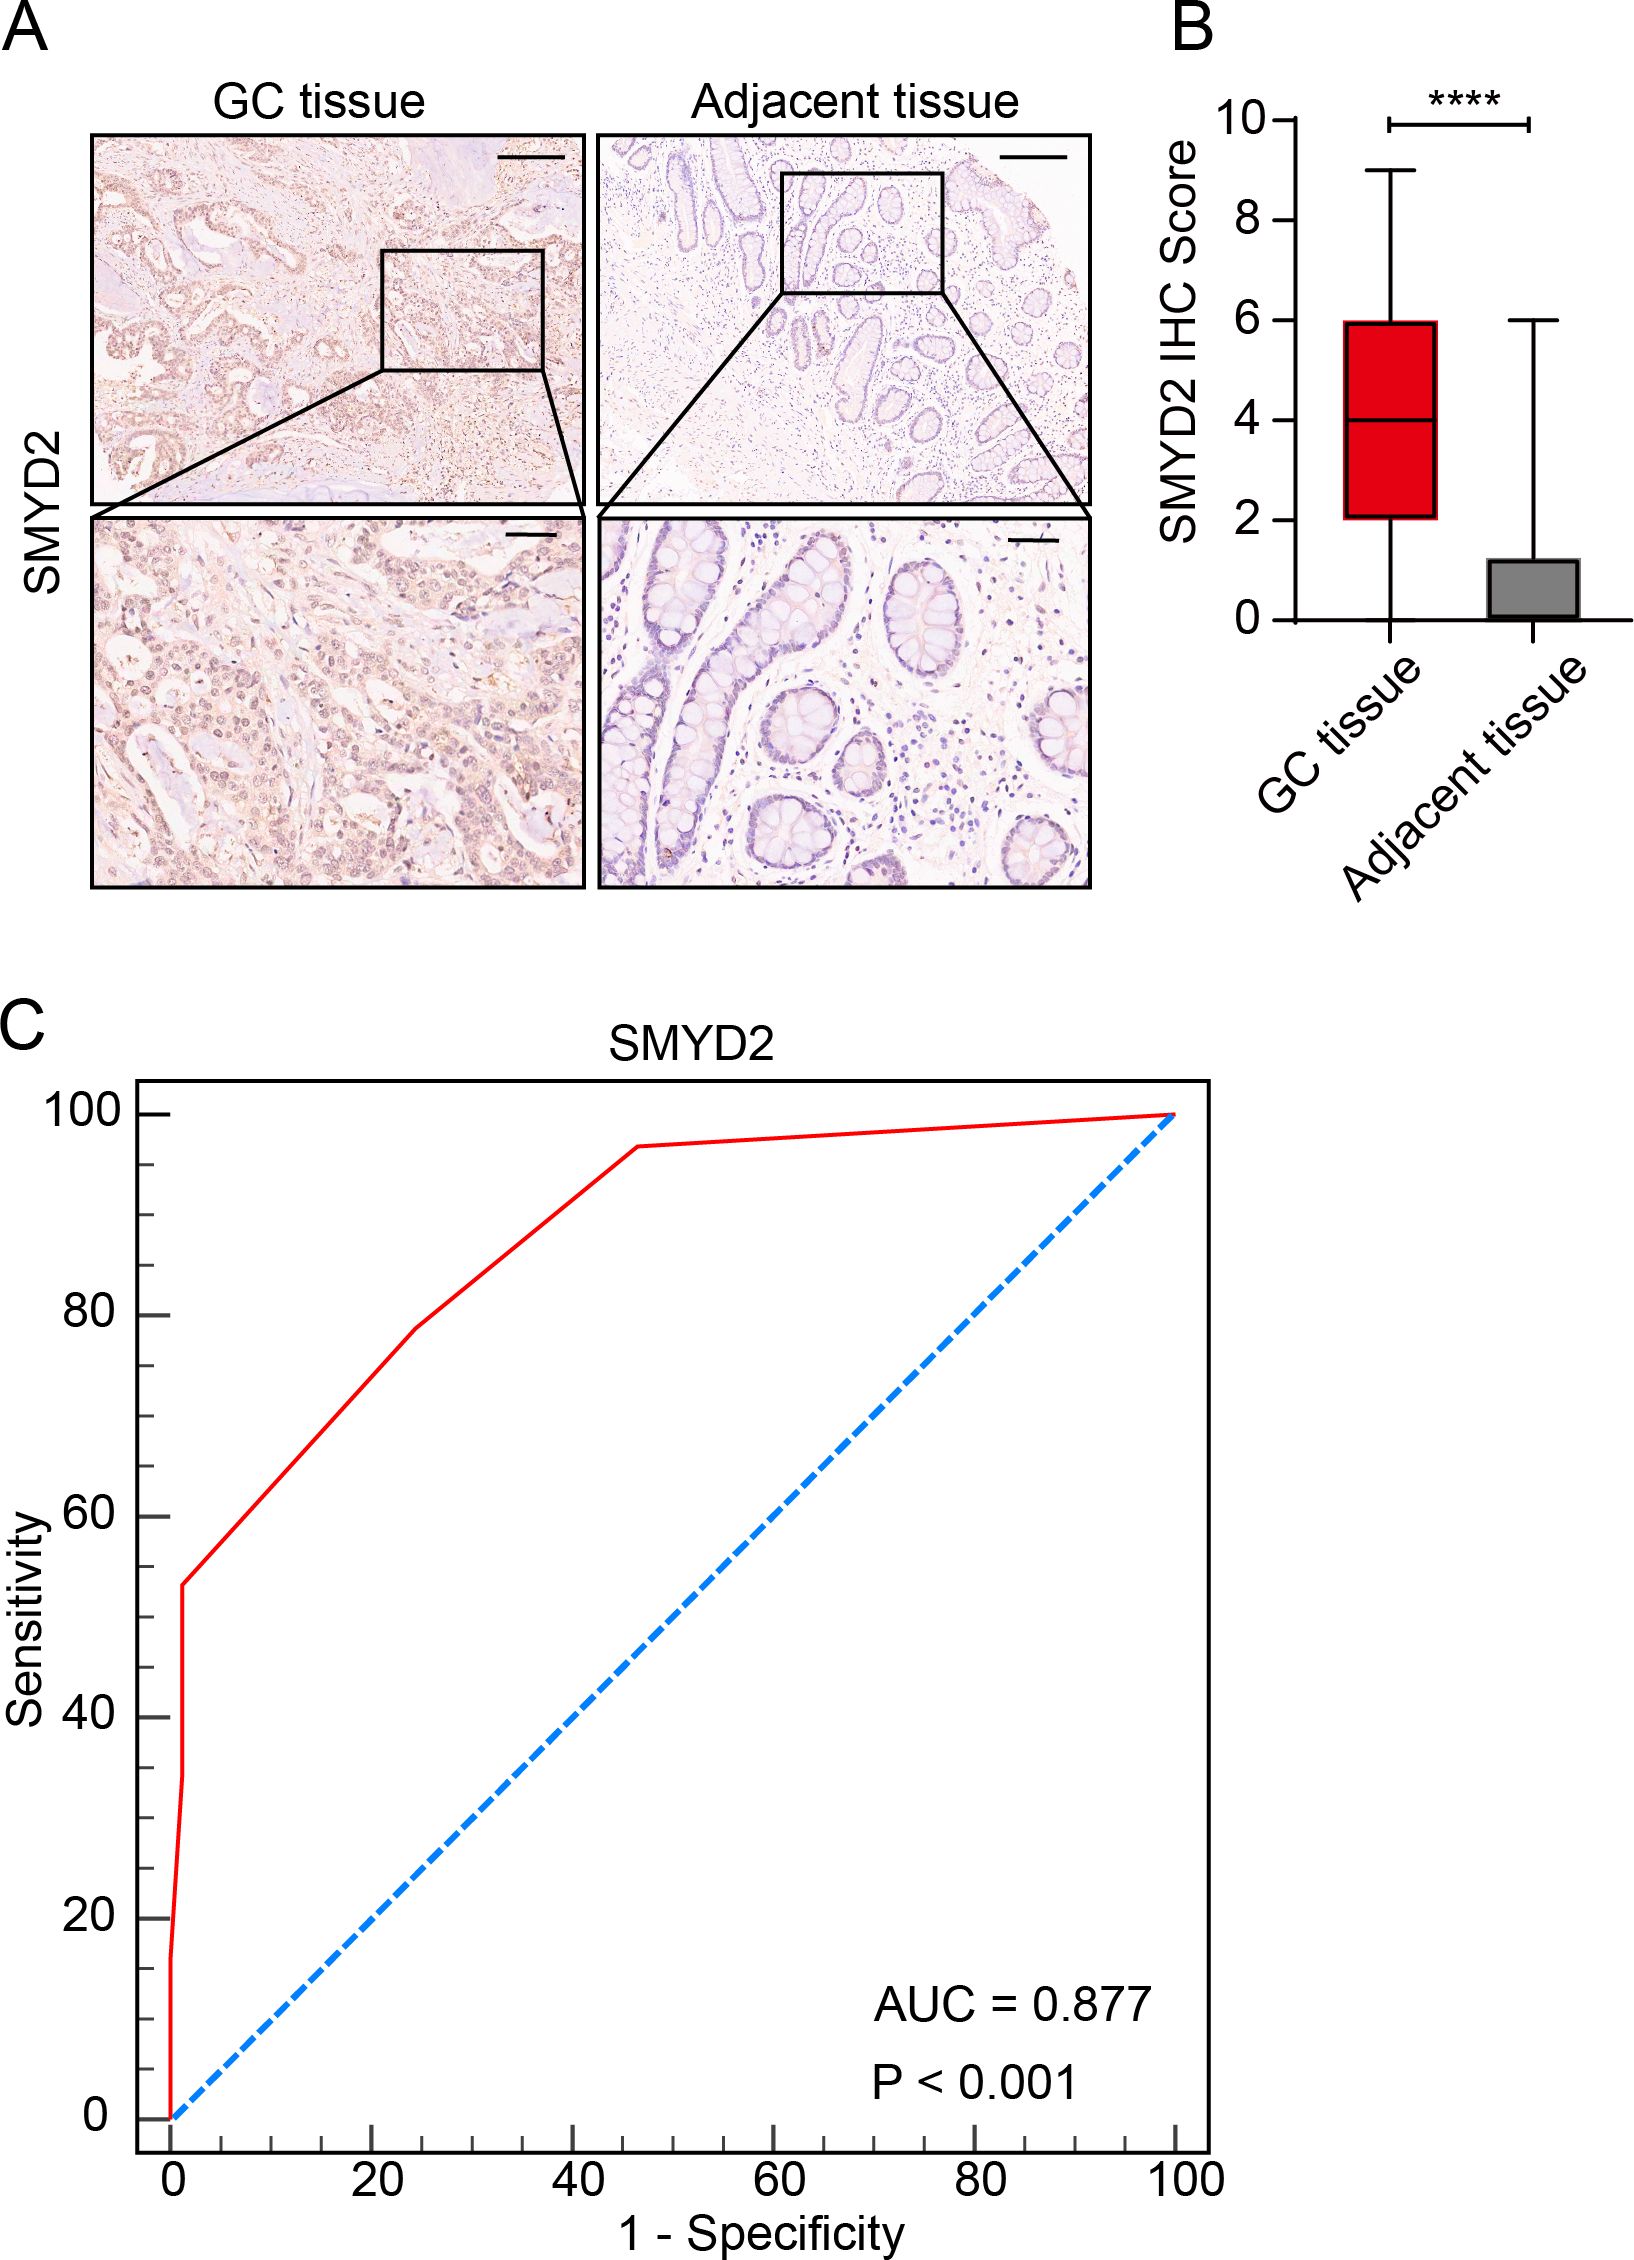
Figure 6. Validation of SMYD2 expression and diagnostic potential in GC tissues. (A) Representative IHC staining of SMYD2 in GC tissues and adjacent non-tumor tissues. Scale bars: 200 μm (insets: 50 μm). (B) Quantification of SMYD2 IHC staining intensity demonstrating significantly elevated expression in GC tissues compared to adjacent tissues (****P < 0.0001, unpaired Student’s t-test). (C) ROC curve evaluating the diagnostic performance of SMYD2 IHC score.
3.7 SMYD2 promoted GC cell proliferation, invasion and metastasis
We next explored the functions of SMYD2, and we performed siRNA-mediated knockdown in GC cells (Figures 7A, B). SMYD2 suppression significantly attenuated cellular proliferation, as evidenced by colony formation and CCK-8 assays (Figures 7C, D). Furthermore, SMYD2 silencing markedly impaired invasion and migration capacities in Transwell and wound healing assays, respectively (Figures 7E, F). These results reiterated the positive role of SMYD2 in tumorigenesis and progression of GC in vitro.
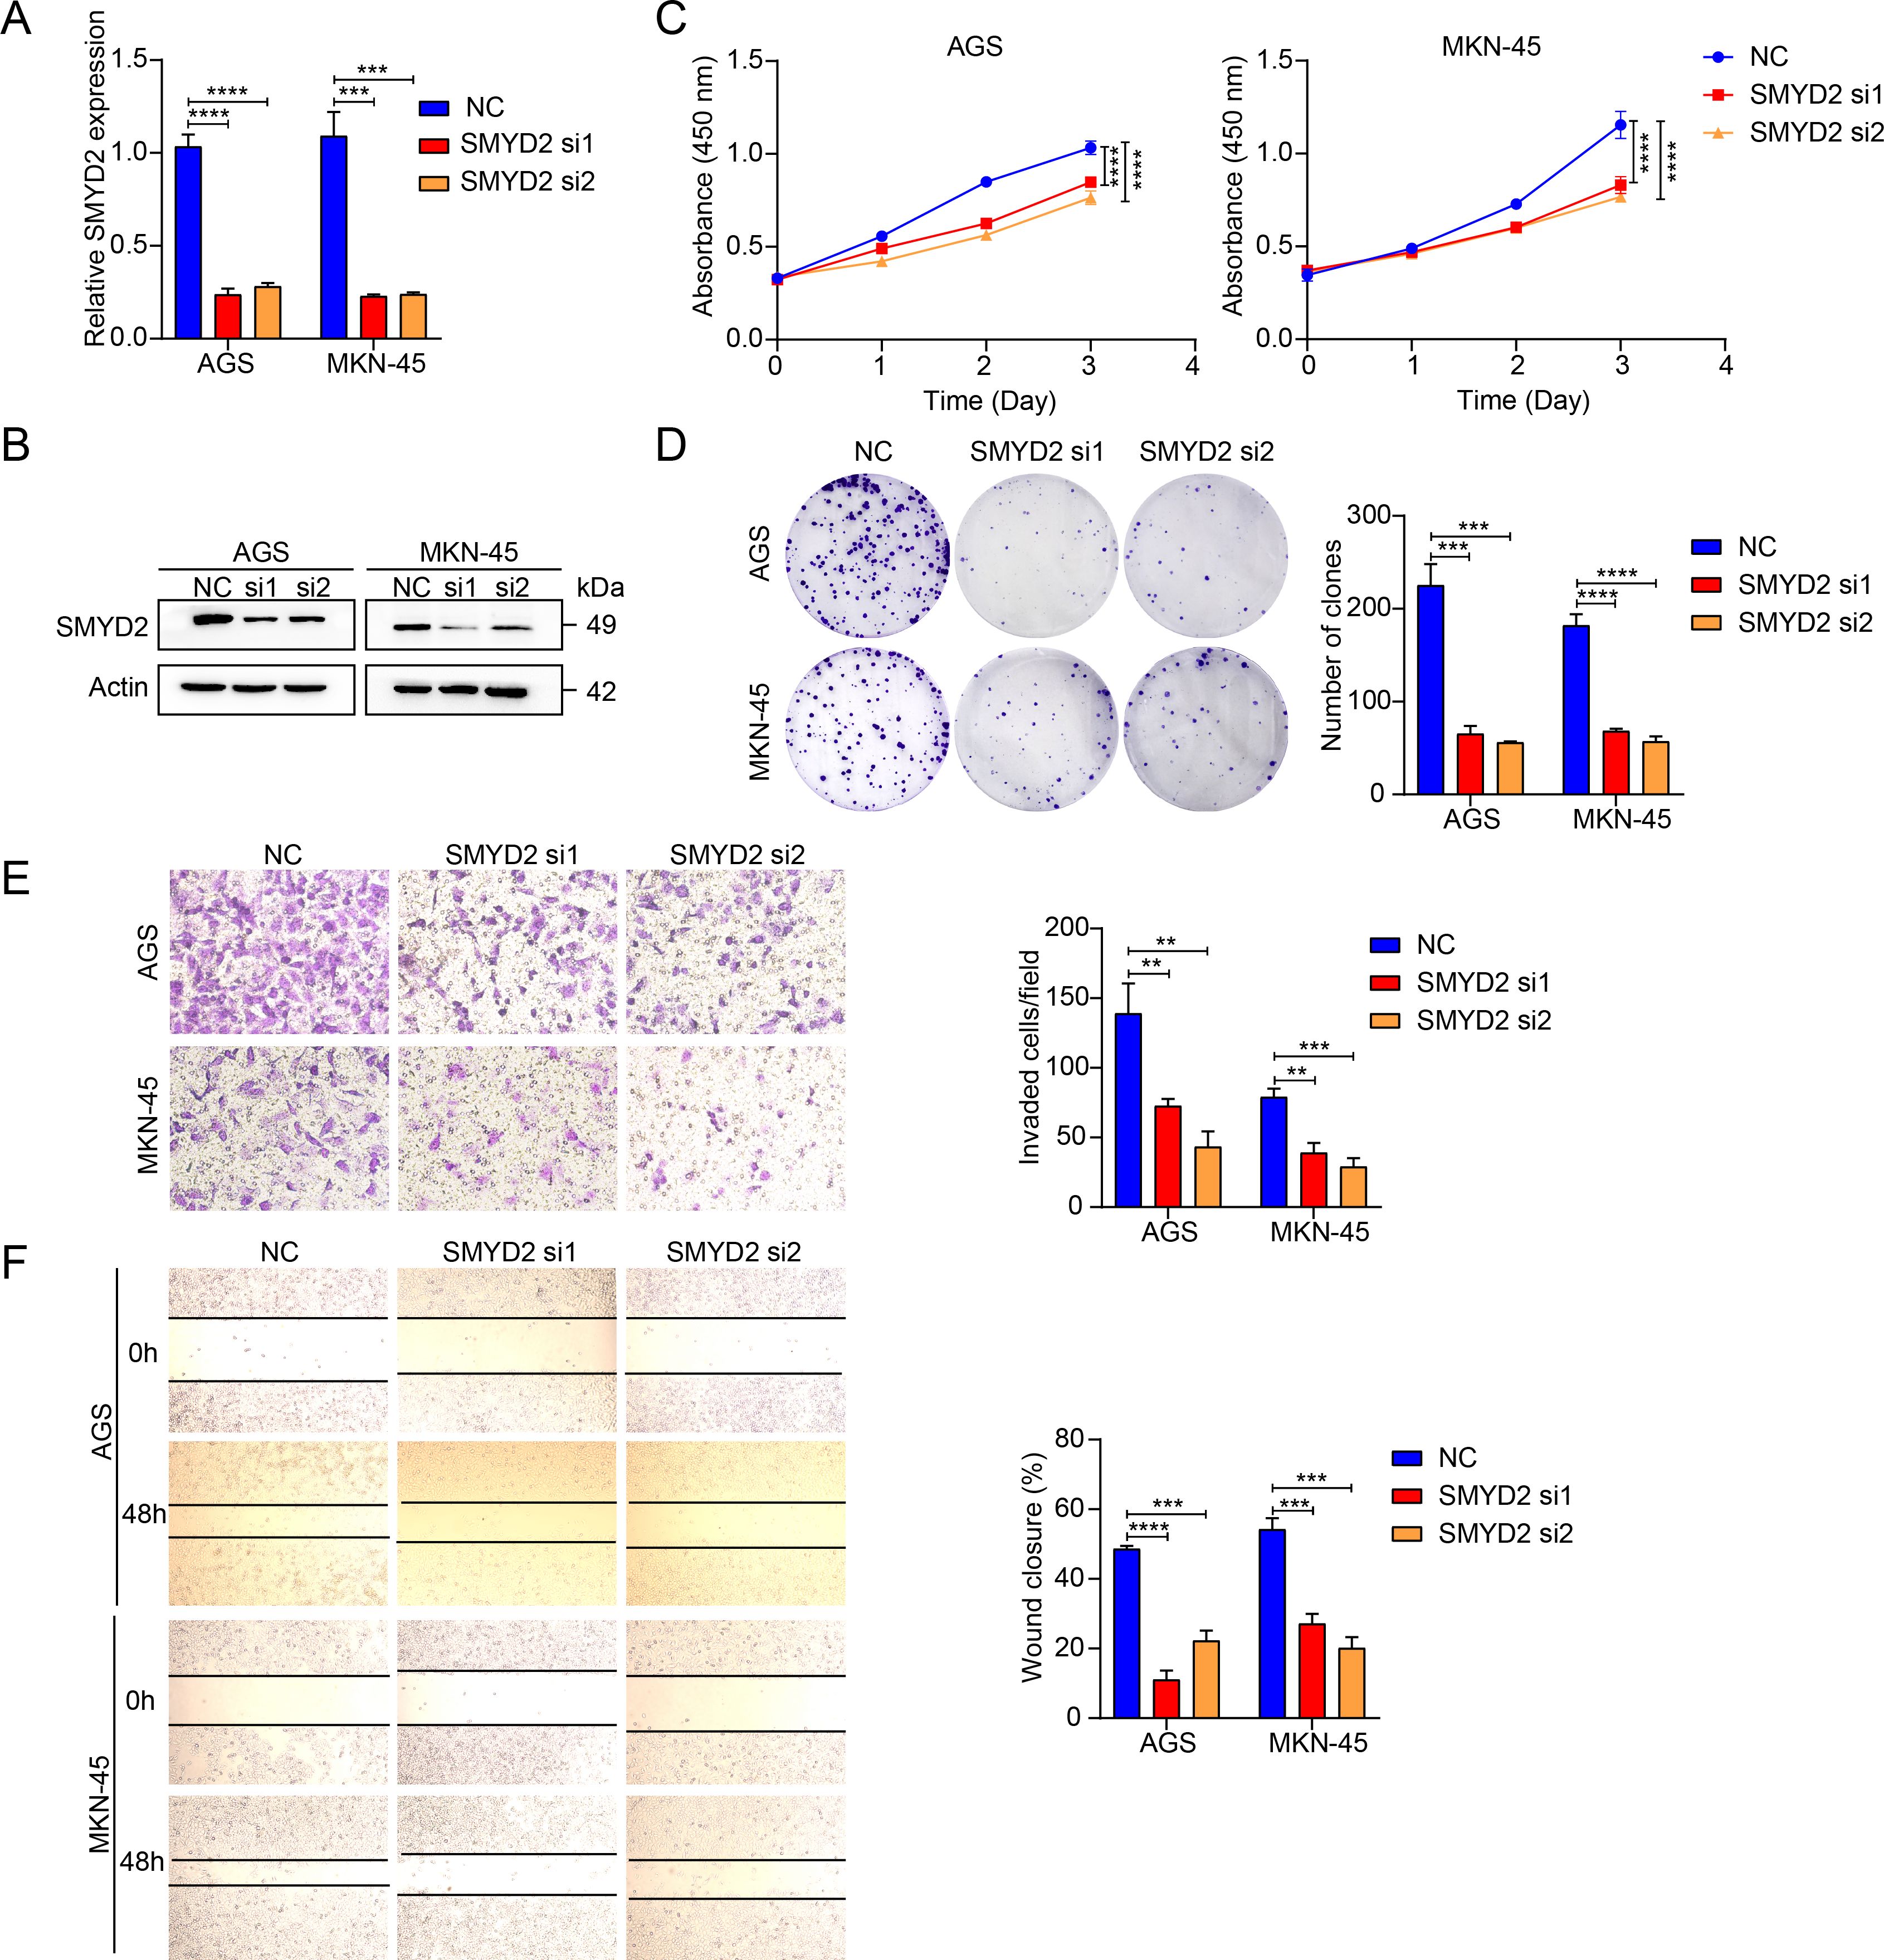
Figure 7. SMYD2 facilitates GC cell proliferation and metastasis. (A) SMYD2 mRNA expression following transfection with SMYD2-targeting siRNAs. (B) SMYD2 protein expression following transfection with SMYD2-targeting siRNAs. (C) CCK8 assay after cells transfected with SMYD2 siRNAs. (D) Colony formation assay after cells transfected with SMYD2 siRNAs. (E) Transwell penetration assays in SMYD2-knockdown AGS and MKN-45 cells. (F) Cell migration assessed by wound healing assay in SMYD2-knockdown AGS and MKN-45 cells. **P <0.01, ***P < 0.001, P < 0.0001, by Student’s t-test.
3.8 H. pylori promoted SMYD2 expression
Infection of H. pylori is a well-known risk factor for GC (35, 36). Therefore, we explored whether SMYD2 expression was regulated by H. pylori. We detected SMYD2 expression after H. pylori strains (26695 and 11637) infection in AGS and MKN-45 cells. The results showed that SMYD2 expression was significantly up-regulated after infection with H. pylori at different MOIs. Meanwhile, SMYD2 expression was also increased at different time points after infection with H. pylori (Figures 8A, B). This finding was corroborated by bioinformatics analysis of GEO datasets, demonstrating significantly elevated SMYD2 levels in H. pylori-positive clinical specimens compared to uninfected controls (Supplementary Figure 6A).
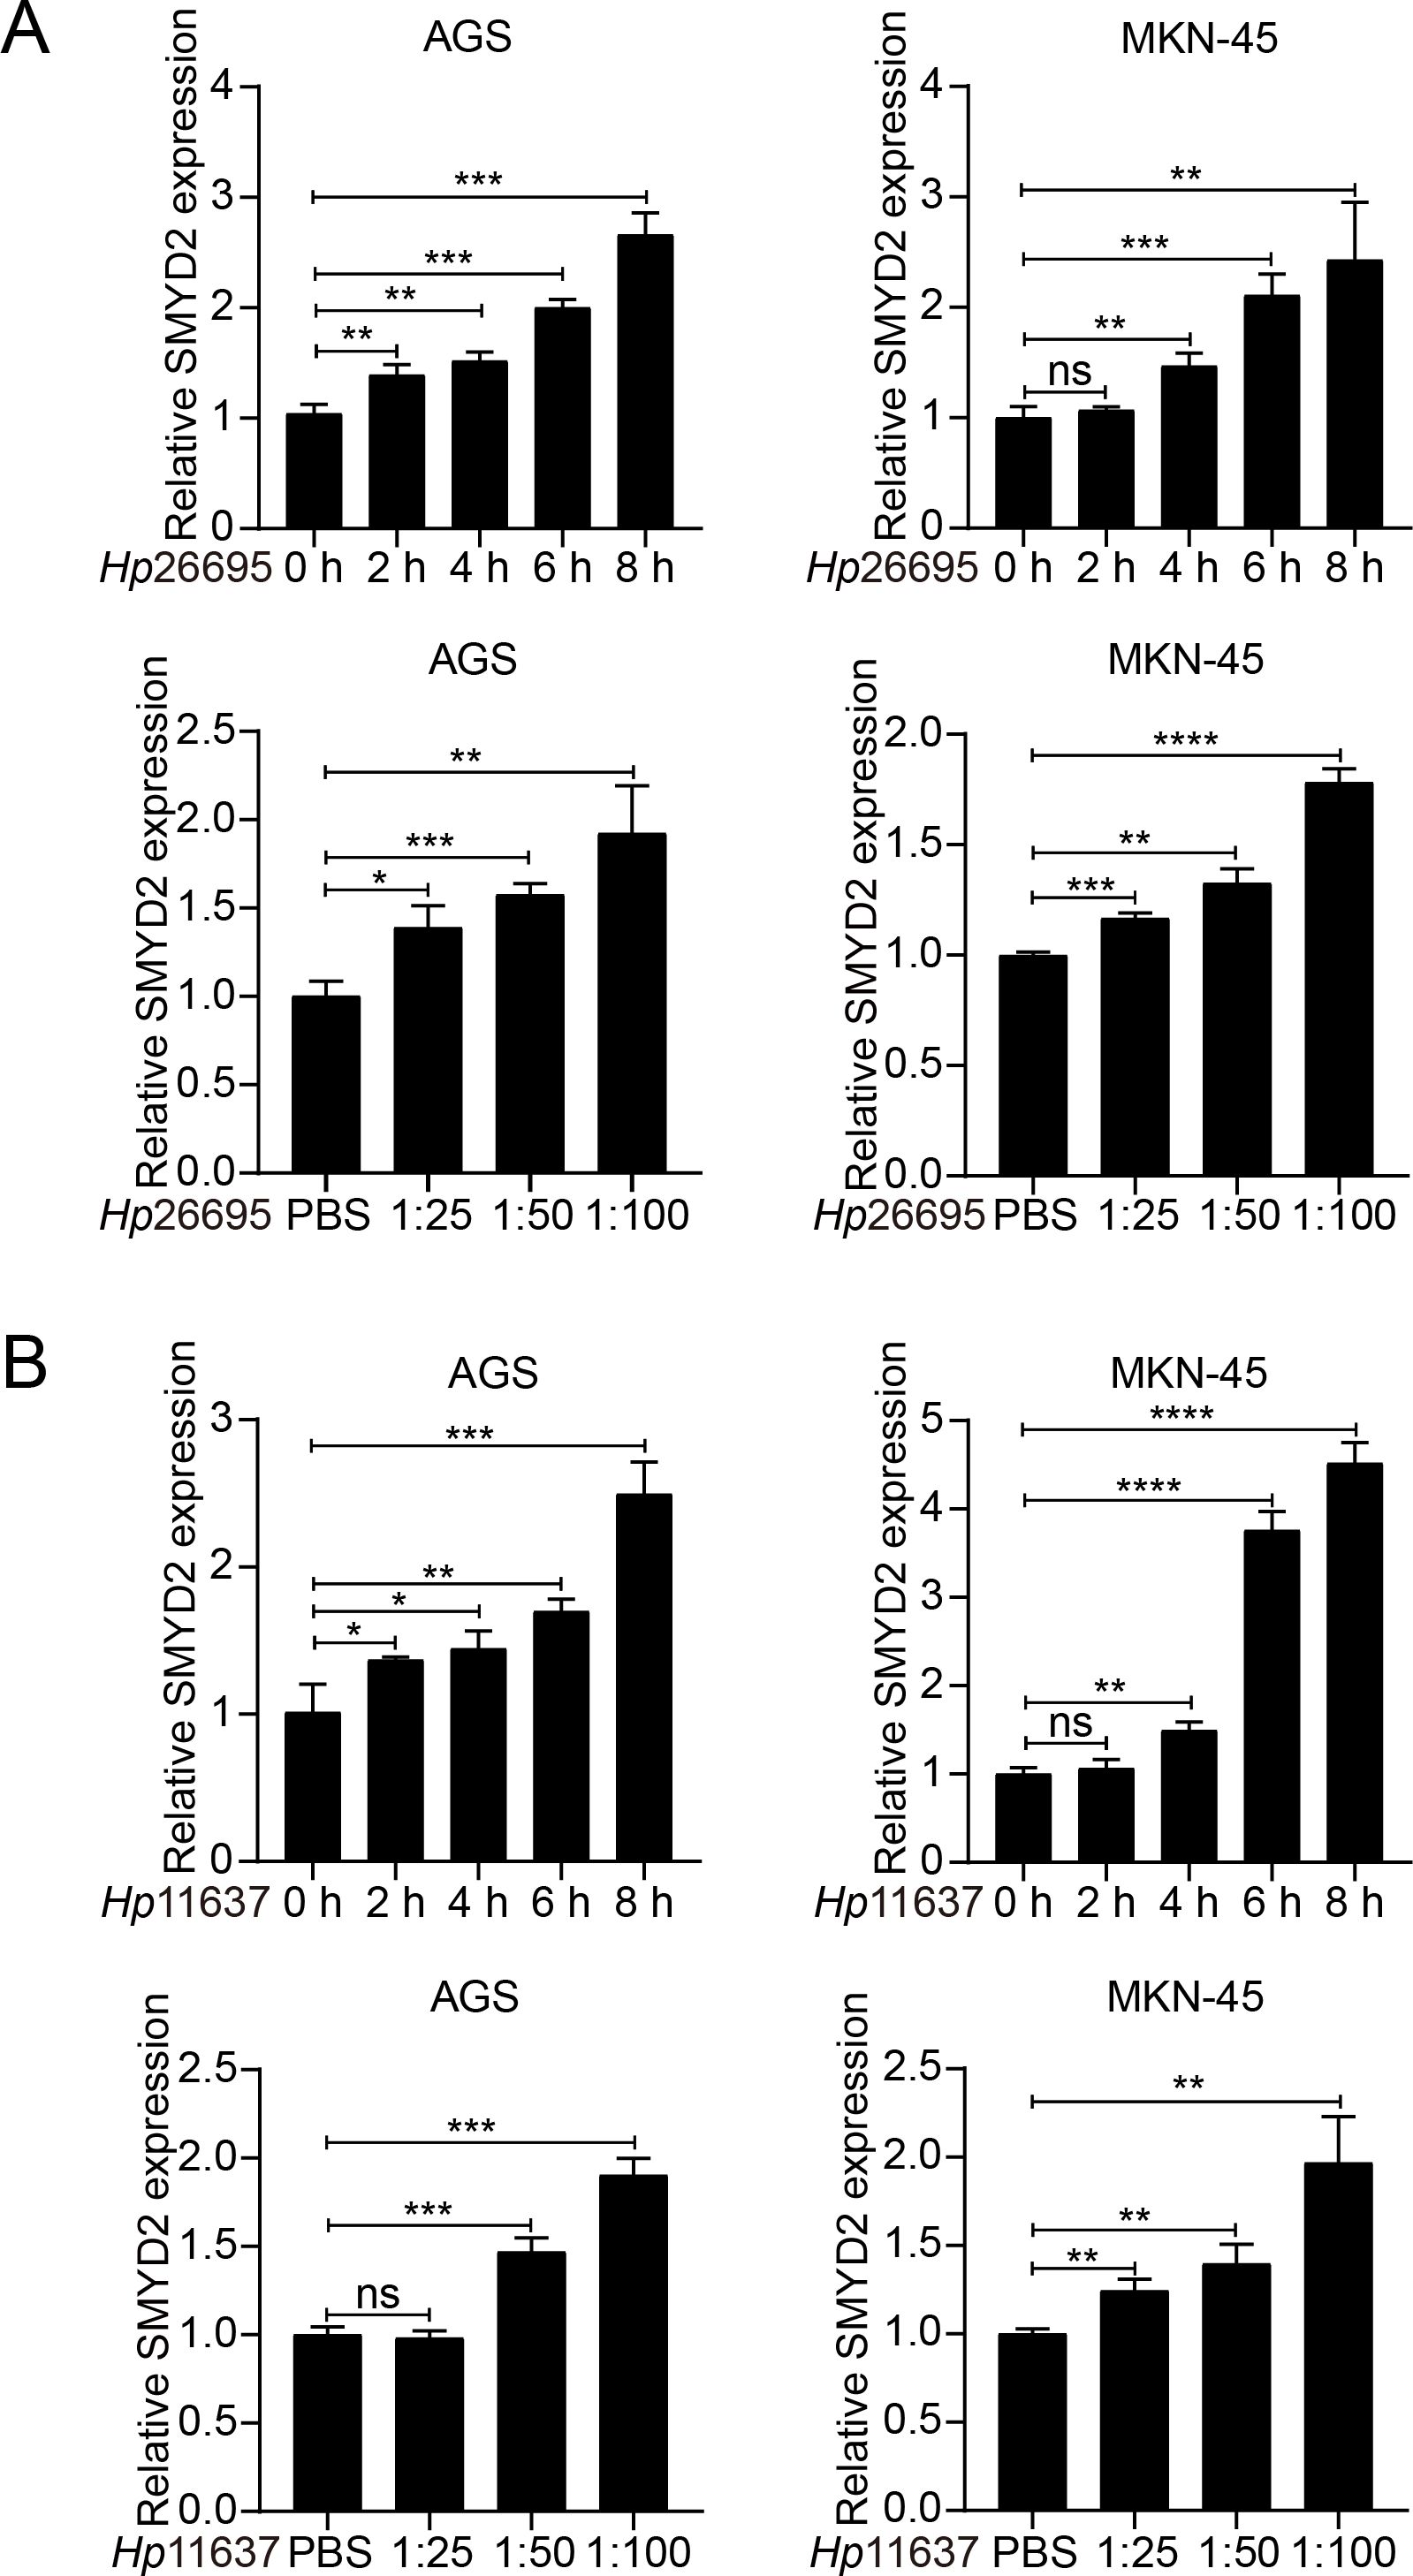
Figure 8. H. pylori infection induces SMYD2 expression. (A) RT-qPCR analysis of SMYD2 mRNA levels in AGS and MKN-45 cells infected with H. pylori strain 26695 at different MOIs and different time points. (B) RT-qPCR analysis of SMYD2 mRNA expression in AGS and MKN-45 cells infected with H. pylori strain 11637 at different MOIs and different time points. *P < 0.05, **P < 0.01, ***P < 0.001, ****P < 0.0001, by Student’s t-test.
4 Discussion
HMTs are post-translational modification-related enzymes, whose abnormal expression could lead to several diseases, such as cancer (37–39). HMTs are divided into PKMTs and PRMTs based on their methyltransferase activity on lysine or arginine residues (40). SMYD2 is a PKMT and possessed five structurally distinct domains, including S-sequence, MYND domain, insertion SET domain, cysteine-rich post-SET domain and tetratricopeptide repeat domain (21). The enzymatic activity of SMYD2 mainly relies on the post-SET domain with complete functional ablation observed upon domain deletion (41). SMYD2 plays an important role in various diseases, including cardiac disease and cancers (42). High expression of SMYD2 is closely associated with the poor prognosis of patients.
Our pan-cancer analysis of TCGA data revealed consistent and significant SMYD2 upregulation across multiple malignancies including GC, breast cancer, colorectal adenocarcinoma, renal cell carcinoma, and prostate cancer (Figures 3B, C), validating and extending prior reports (16, 43–45). Tissue microarray analysis identified a significant association between SMYD2 expression and Borrmann subtype (P = 0.005) but not TNM staging (Supplementary Table 2), a discrepancy potentially attributable to current sample size limitations that warrants investigation in future stage-stratified cohorts. Furthermore, we also found SMYD2 as a highly promising diagnostic biomarker for GC (AUC = 0.877), though its successful clinical implementation will require: large-scale multicenter validation of key diagnostic parameters including accuracy, specificity, inter-laboratory reproducibility, and systematic cost-benefit analyses comparing SMYD2 testing against existing diagnostic paradigms.
Immunotherapeutic implications of SMYD2 were evaluated using TIDE scoring in TCGA and GEO datasets, revealing significant clinical relevance (Figure 4C). SMYD2 expression showed a positive correlation with tumor purity but inverse relationships with immune, stromal, and ESTIMATE scores (Figure 5B). Notably, elevated SMYD2 expression was associated with reduced TIDE scores (Figure 5C), collectively suggesting that GC patients with high SMYD2 expression might demonstrate enhanced responsiveness to immunotherapy. This observation aligns with previous reports that SMYD2 modulates the cGAS-STING pathway to regulate CD8+ T cell activation and antitumor immunity (46). However, the precise mechanisms by which SMYD2 influences immune infiltration in gastric cancer remain to be fully elucidated.
Functional analysis confirmed that SMYD2 knockdown suppressed proliferation, invasion and migration of GC cell in vitro (Figures 7C–F). These results were consistent with those from previous studies (47, 48). Xu et al. demonstrated that LncRNA DLEU1 recruits SMYD2 to upregulate APOC1 expression, thereby enhancing GC cell proliferation and glycolytic activity (47). Similarly, Liu et al. identified that neutrophil extracellular traps promote GC metastasis through SMYD2 modification (48). While these studies implicate SMYD2 in gastric carcinogenesis, the precise molecular mechanisms underlying its oncogenic functions in GC remain incompletely characterized, warranting further mechanistic investigation. H. pylori is the strongest risk factor for gastritis and gastric adenocarcinoma (49–51). We detected SMYD2 expression after infection with H. pylori and found that SMYD2 expression was remarkably increased with H. pylori infection in different MOIs and different time points (Figures 6A, B). To our knowledge, this represents the first report linking H. pylori infection to SMYD2 dysregulation. The molecular pathways mediating this relationship require elucidation in future studies.
In summary, this study establishes SMYD2 as both a pivotal oncogenic driver and a promising diagnostic biomarker in gastric carcinogenesis. The identification of the H. pylori-SMYD2 axis provides novel mechanistic insights into infection-associated GC development.
5 Conclusions
In this study, we found that SMYD2 was highly expressed in GC, which was associated with poor prognosis. SMYD2 promoted the occurrence and progression of GC. Therefore, SMYD2 had an oncogenic role in GC and can be regarded as a potential therapeutic target.
Data availability statement
The original contributions presented in the study are included in the article/Supplementary Material. Further inquiries can be directed to the corresponding author.
Ethics statement
The studies involving humans were approved by Ethics Committee of the Shandong Cancer Hospital and Institute. The studies were conducted in accordance with the local legislation and institutional requirements.
Author contributions
SW: Conceptualization, Writing – original draft. CZ: Data curation, Writing – original draft. DL: Formal Analysis, Writing – original draft. QL: Formal Analysis, Writing – original draft. CM: Formal Analysis, Writing – original draft. SD: Investigation, Writing – original draft. SZ: Methodology, Writing – original draft. WS: Conceptualization, Writing – review & editing.
Funding
The author(s) declare that financial support was received for the research and/or publication of this article. This work was supported by the Natural Science Foundation of Shandong Province (grant number ZR2021QH069) and the Cultivation Fund of the Second Hospital of Shandong University (grant number 2023YP03).
Conflict of interest
The authors declare that the research was conducted in the absence of any commercial or financial relationships that could be construed as a potential conflict of interest.
Generative AI statement
The author(s) declare that no Generative AI was used in the creation of this manuscript.
Publisher’s note
All claims expressed in this article are solely those of the authors and do not necessarily represent those of their affiliated organizations, or those of the publisher, the editors and the reviewers. Any product that may be evaluated in this article, or claim that may be made by its manufacturer, is not guaranteed or endorsed by the publisher.
Supplementary material
The Supplementary Material for this article can be found online at: https://www.frontiersin.org/articles/10.3389/fonc.2025.1617971/full#supplementary-material
Abbreviations
HMEs, Histone modification enzymes; H. pylori, Helicobacter pylori; HMT, histone methyltransferase; PKMT, protein lysine methyltransferases; PRMT, protein arginine methyltransferase; TCGA, The Cancer Genome Atlas; GEO, Gene Expression Omnibus; ROC, receiver operating characteristic; AUC, area under the receiver operating characteristic curve; TIDE, Tumor Immune Dysfunction and Exclusion; IHC, Immunohistochemistry.
References
1. Bray F, Laversanne M, Sung H, Ferlay J, Siegel RL, Soerjomataram I, et al. Global cancer statistics 2022: Globocan estimates of incidence and mortality worldwide for 36 cancers in 185 countries. CA Cancer J Clin. (2024) 74:229–63. doi: 10.3322/caac.21834
2. Li M, Gao N, Wang SL, Guo YF, and Liu Z. Hotspots and trends of risk factors in gastric cancer: A visualization and bibliometric analysis. World J Gastrointest Oncol. (2024) 16:2200–18. doi: 10.4251/wjgo.v16.i5.2200
3. Smyth EC, Nilsson M, Grabsch HI, van Grieken NC, and Lordick F. Gastric cancer. Lancet. (2020) 396:635–48. doi: 10.1016/S0140-6736(20)31288-5
4. Chen YC, Malfertheiner P, Yu HT, Kuo CL, Chang YY, Meng FT, et al. Global prevalence of helicobacter pylori infection and incidence of gastric cancer between 1980 and 2022. Gastroenterology. (2024) 166:605–19. doi: 10.1053/j.gastro.2023.12.022
5. Toh JWT and Wilson RB. Pathways of gastric carcinogenesis, helicobacter pylori virulence and interactions with antioxidant systems, vitamin c and phytochemicals. Int J Mol Sci. (2020) 21:6451. doi: 10.3390/ijms21176451
6. Takahashi-Kanemitsu A, Knight CT, and Hatakeyama M. Molecular anatomy and pathogenic actions of helicobacter pylori caga that underpin gastric carcinogenesis. Cell Mol Immunol. (2020) 17:50–63. doi: 10.1038/s41423-019-0339-5
7. Ford AC, Yuan Y, and Moayyedi P. Helicobacter pylori eradication therapy to prevent gastric cancer: Systematic review and meta-analysis. Gut. (2020) 69:2113–21. doi: 10.1136/gutjnl-2020-320839
8. Hu Y, Zhang ZY, Wang F, Zhuang K, Xu X, Liu DS, et al. Effects of amoxicillin dosage on cure rate, gut microbiota, and antibiotic resistome in vonoprazan and amoxicillin dual therapy for helicobacter pylori: A multicentre, open-label, non-inferiority randomised controlled trial. Lancet Microbe. (2025) 6:100975. doi: 10.1016/j.lanmic.2024.100975
9. Joshi SS and Badgwell BD. Current treatment and recent progress in gastric cancer. CA Cancer J Clin. (2021) 71:264–79. doi: 10.3322/caac.21657
10. Shang W, Wang Y, Liang X, Li T, Shao W, Liu F, et al. SETDB1 promotes gastric carcinogenesis and metastasis via upregulation of CCND1 and MMP9 expression. J Pathol. (2021) 253:148–59. doi: 10.1002/path.5568
11. Feng W, Ma C, Rao H, Zhang W, Liu C, Xu Y, et al. Setd2 deficiency promotes gastric tumorigenesis through inhibiting the SIRT1/FOXO pathway. Cancer Lett. (2023) 579:216470. doi: 10.1016/j.canlet.2023.216470
12. Jing R, Falchetti M, Han T, Najia M, Hensch LT, Meader E, et al. Maturation and persistence of CAR t cells derived from human pluripotent stem cells via chemical inhibition of G9a/GLP. Cell Stem Cell. (2025) 32:326–8. doi: 10.1016/j.stem.2024.12.008
13. Tinsley E, Bredin P, Toomey S, Hennessy BT, and Furney SJ. Kmt2c and kmt2d aberrations in breast cancer. Trends Cancer. (2024) 10:519–30. doi: 10.1016/j.trecan.2024.02.003
14. Pruvost M, Park HJ, Habermacher C, Li M, Angulo MC, Liu J, et al. The histone methyltransferases EHMT1 and EHMT2 repress the expression of genes related to excitability and cell death in oligodendrocyte progenitors. Glia. (2025) 73:1420–36. doi: 10.1002/glia.70014
15. Topchu I, Pangeni RP, Bychkov I, Miller SA, Izumchenko E, Yu J, et al. The role of NSD1, NSD2, and NSD3 histone methyltransferases in solid tumors. Cell Mol Life Sci. (2022) 79:285. doi: 10.1007/s00018-022-04321-2
16. Casanova AG, Roth GS, Hausmann S, Lu X, Bischoff LJM, Froeliger EM, et al. Cytoskeleton remodeling induced by SMYD2 methyltransferase drives breast cancer metastasis. Cell Discov. (2024) 10:12. doi: 10.1038/s41421-023-00644-x
17. Li Y, Wei X, Xiao R, Chen Y, Xiong T, Fang ZM, et al. SMYD2-methylated ppargamma facilitates hypoxia-induced pulmonary hypertension by activating mitophagy. Circ Res. (2024) 135:93–109. doi: 10.1161/CIRCRESAHA.124.323698
18. Kim K, Ryu TY, Jung E, Han TS, Lee J, Kim SK, et al. Epigenetic regulation of SMAD3 by histone methyltransferase SMYD2 promotes lung cancer metastasis. Exp Mol Med. (2023) 55:952–64. doi: 10.1038/s12276-023-00987-1
19. Li J, Hong Z, Zhang J, Zheng S, Wan F, Liu Z, et al. Lysine methyltransferase SMYD2 enhances androgen receptor signaling to modulate CRPC cell resistance to enzalutamide. Oncogene. (2024) 43:744–57. doi: 10.1038/s41388-024-02945-1
20. Yi X, Jiang XJ, and Fang ZM. Histone methyltransferase SMYD2: Ubiquitous regulator of disease. Clin Epigenetics. (2019) 11:112. doi: 10.1186/s13148-019-0711-4
21. Ferguson AD, Larsen NA, Howard T, Pollard H, Green I, Grande C, et al. Structural basis of substrate methylation and inhibition of SMYD2. Structure. (2011) 19:1262–73. doi: 10.1016/j.str.2011.06.011
22. Nakakido M, Deng Z, Suzuki T, Dohmae N, Nakamura Y, and Hamamoto R. Dysregulation of AKT pathway by SMYD2-mediated lysine methylation on PTEN. Neoplasia. (2015) 17:367–73. doi: 10.1016/j.neo.2015.03.002
23. Li LX, Zhou JX, Calvet JP, Godwin AK, Jensen RA, and Li X. Lysine methyltransferase SMYD2 promotes triple negative breast cancer progression. Cell Death Dis. (2018) 9:326. doi: 10.1038/s41419-018-0347-x
24. Hamamoto R, Toyokawa G, Nakakido M, Ueda K, and Nakamura Y. SMYD2-dependent HSP90 methylation promotes cancer cell proliferation by regulating the chaperone complex formation. Cancer Lett. (2014) 351:126–33. doi: 10.1016/j.canlet.2014.05.014
25. Reynoird N, Mazur PK, Stellfeld T, Flores NM, Lofgren SM, Carlson SM, et al. Coordination of stress signals by the lysine methyltransferase SMYD2 promotes pancreatic cancer. Genes Dev. (2016) 30:772–85. doi: 10.1101/gad.275529.115
26. Zhong X, Wei X, Xu Y, Zhu X, Huo B, Guo X, et al. The lysine methyltransferase SMYD2 facilitates neointimal hyperplasia by regulating the HDAC3-SRF axis. Acta Pharm Sin B. (2024) 14:712–28. doi: 10.1016/j.apsb.2023.11.012
27. Zhou Y, Sharma S, Sun X, Guan X, Hou Y, Yang Z, et al. SMYD2 regulates vascular smooth muscle cell phenotypic switching and intimal hyperplasia via interaction with myocardin. Cell Mol Life Sci. (2023) 80:264. doi: 10.1007/s00018-023-04883-9
28. Zhang Y, Zhou L, Xu Y, Zhou J, Jiang T, Wang J, et al. Targeting SMYD2 inhibits angiogenesis and increases the efficiency of apatinib by suppressing EGFL7 in colorectal cancer. Angiogenesis. (2023) 26:1–18. doi: 10.1007/s10456-022-09839-4
29. Xu K, Ding J, Zhou L, Li D, Luo J, Wang W, et al. SMYD2 promotes hepatocellular carcinoma progression by reprogramming glutamine metabolism via c-Myc/GLS1 axis. Cells. (2022) 12:25. doi: 10.3390/cells12010025
30. Wu L, Kou F, Ji Z, Li B, Zhang B, Guo Y, et al. SMYD2 promotes tumorigenesis and metastasis of lung adenocarcinoma through RPS7. Cell Death Dis. (2021) 12:439. doi: 10.1038/s41419-021-03720-w
31. Moreira AM, Pereira J, Melo S, Fernandes MS, Carneiro P, Seruca R, et al. The extracellular matrix: An accomplice in gastric cancer development and progression. Cells. (2020) 9:394. doi: 10.3390/cells9020394
32. Yan G, An Y, Xu B, Wang N, Sun X, and Sun M. Potential impact of alkbh5 and ythdf1 on tumor immunity in colon adenocarcinoma. Front Oncol. (2021) 11:670490. doi: 10.3389/fonc.2021.670490
33. Chen Y, Li ZY, Zhou GQ, and Sun Y. An immune-related gene prognostic index for head and neck squamous cell carcinoma. Clin Cancer Res. (2021) 27:330–41. doi: 10.1158/1078-0432.CCR-20-2166
34. Yang Z, Yan G, Zheng L, Gu W, Liu F, Chen W, et al. YKT6, as a potential predictor of prognosis and immunotherapy response for oral squamous cell carcinoma, is related to cell invasion, metastasis, and CD8+ t cell infiltration. Oncoimmunology. (2021) 10:1938890. doi: 10.1080/2162402X.2021.1938890
35. Usui Y, Taniyama Y, Endo M, Koyanagi YN, Kasugai Y, Oze I, et al. Helicobacter pylori, homologous-recombination genes, and gastric cancer. N Engl J Med. (2023) 388:1181–90. doi: 10.1056/NEJMoa2211807
36. Malfertheiner P, Megraud F, Rokkas T, Gisbert JP, Liou JM, Schulz C, et al. Management of helicobacter pylori infection: The maastricht VI/florence consensus report. Gut. (2022), gutjnl-2022-327745. doi: 10.1136/gutjnl-2022-327745
37. Barghout SH, MaChado RAC, and Barsyte-Lovejoy D. Chemical biology and pharmacology of histone lysine methylation inhibitors. Biochim Biophys Acta Gene Regul Mech. (2022) 1865:194840. doi: 10.1016/j.bbagrm.2022.194840
38. Yang C, Zhang J, Ma Y, Wu C, Cui W, and Wang L. Histone methyltransferase and drug resistance in cancers. J Exp Clin Cancer Res. (2020) 39:173. doi: 10.1186/s13046-020-01682-z
39. Marzochi LL, Cuzziol CI, Nascimento Filho C, Dos Santos JA, Castanhole-Nunes MMU, Pavarino EC, et al. Use of histone methyltransferase inhibitors in cancer treatment: A systematic review. Eur J Pharmacol. (2023) 944:175590. doi: 10.1016/j.ejphar.2023.175590
40. Suraweera A, O'Byrne KJ, and Richard DJ. Epigenetic drugs in cancer therapy. Cancer Metastasis Rev. (2025) 44:37. doi: 10.1007/s10555-025-10253-7
41. Wu J, Cheung T, Grande C, Ferguson AD, Zhu X, Theriault K, et al. Biochemical characterization of human set and mynd domain-containing protein 2 methyltransferase. Biochemistry. (2011) 50:6488–97. doi: 10.1021/bi200725p
42. Padilla A, Manganaro JF, Huesgen L, Roess DA, Brown MA, and Crans DC. Targeting epigenetic changes mediated by members of the SMYD family of lysine methyltransferases. Molecules. (2023) 28:2000. doi: 10.3390/molecules28042000
43. Lai Y and Yang Y. SMYD2 facilitates cancer cell Malignancy and xenograft tumor development through ERBB2-mediated FUT4 expression in colon cancer. Mol Cell Biochem. (2022) 477:2149–59. doi: 10.1007/s11010-020-03738-2
44. Li J, Wan F, Zhang J, Zheng S, Yang Y, Hong Z, et al. Targeting SMYD2 inhibits prostate cancer cell growth by regulating c-Myc signaling. Mol Carcinog. (2023) 62:940–50. doi: 10.1002/mc.23536
45. Pires-Luis AS, Vieira-Coimbra M, Vieira FQ, Costa-Pinheiro P, Silva-Santos R, Dias PC, et al. Expression of histone methyltransferases as novel biomarkers for renal cell tumor diagnosis and prognostication. Epigenetics. (2015) 10:1033–43. doi: 10.1080/15592294.2015.1103578
46. Tang M, Chen G, Tu B, Hu Z, Huang Y, DuFort CC, et al. SMYD2 inhibition-mediated hypomethylation of Ku70 contributes to impaired nonhomologous end joining repair and antitumor immunity. Sci Adv. (2023) 9:eade6624. doi: 10.1126/sciadv.ade6624
47. Xu H, Ba Z, Liu C, and Yu X. Long noncoding RNA DLEU1 promotes proliferation and glycolysis of gastric cancer cells via APOC1 upregulation by recruiting SMYD2 to induce trimethylation of H3K4 modification. Transl Oncol. (2023) 36:101731. doi: 10.1016/j.tranon.2023.101731
48. Liu D, Yang X, and Wang X. Neutrophil extracellular traps promote gastric cancer cell metastasis via the NAT10-mediated N4-acetylcytidine modification of SMYD2. Cell Signal. (2024) 116:111014. doi: 10.1016/j.cellsig.2023.111014
49. Shang W, Liang X, Li S, Li T, Zheng L, Shao W, et al. Orphan nuclear receptor Nurr1 promotes helicobacter pylori-associated gastric carcinogenesis by directly enhancing CDK4 expression. EBioMedicine. (2020) 53:102672. doi: 10.1016/j.ebiom.2020.102672
50. Salvatori S, Marafini I, Laudisi F, Monteleone G, and Stolfi C. Helicobacter pylori and gastric cancer: Pathogenetic mechanisms. Int J Mol Sci. (2023) 24:2895. doi: 10.3390/ijms24032895
Keywords: gastric cancer, histone modification enzymes, diagnosis, prognosis, SMYD2
Citation: Wang S, Zhao C, Li D, Liu Q, Mao C, Ding S, Zhang S and Shang W (2025) Identification of SMYD2 as a candidate diagnostic and prognostic biomarker for gastric cancer. Front. Oncol. 15:1617971. doi: 10.3389/fonc.2025.1617971
Received: 25 April 2025; Accepted: 30 June 2025;
Published: 24 July 2025.
Edited by:
Caihong Wang, Peking University People’s Hospital, ChinaReviewed by:
Jingchao Wang, Harvard Medical School, United StatesManjusha Roy Choudhury, Aspira Women’s Health Inc., United States
Copyright © 2025 Wang, Zhao, Li, Liu, Mao, Ding, Zhang and Shang. This is an open-access article distributed under the terms of the Creative Commons Attribution License (CC BY). The use, distribution or reproduction in other forums is permitted, provided the original author(s) and the copyright owner(s) are credited and that the original publication in this journal is cited, in accordance with accepted academic practice. No use, distribution or reproduction is permitted which does not comply with these terms.
*Correspondence: Wenjing Shang, MTc4NjUxMzY2OTNAMTYzLmNvbQ==