 Zhan Liu1†
 Chong Zheng2†Zongxiao Jia3†Chengwei Zhao1Xiangyu Liu2
 Weipeng Shao1Feng Chen1
 Hui Zhu4*Hongbo Guo1*
- 1Department of Lung Surgical Ward II, Shandong Cancer Hospital and Institute, Shandong First Medical University and Shandong Academy of Medical Sciences, Jinan, Shandong, China
- 2Department of Radiology, Shandong Cancer Hospital and Institute, Shandong First Medical University and Shandong Academy of Medical Sciences, Jinan, Shandong, China
- 3Department of Thoracic Surgical, Feicheng Hospital Affiliated to Shandong First Medical University, Taian, Shandong, China
- 4Department of Radiation Oncology, Shandong Cancer Hospital and Institute, Shandong First Medical University and Shandong Academy of Medical Sciences, Jinan, Shandong, China
Objective: To develop and validate a deep learning (DL) radiomics model based on epicardial adipose tissue (EAT) for identifying high-risk lung cancer patients with postoperative atrial fibrillation after lung lobectomy.
Methods: A total of 1,008 patients from two centers were included. Handcrafted and DL radiomics features were extracted from the preoperative contrast-enhanced chest CT images of EAT. Clinical features and handcrafted and DL radiomics signatures were integrated to construct predictive models using the logistic regression algorithm as the baseline model. Twenty DL radiomics models were constructed through various combinations of machine learning algorithms and resampling techniques. The post hoc Nemenyi test was employed to compare the predictive performance in terms of the area under the receiver operating characteristic curve (AUC), G-mean, and F-measure.
Results: Advanced age and male sex were identified as independent risk factors for POAF. The DL radiomics model, integrating clinical features, handcrafted radiomics signature, and DL radiomics signature, outperformed the clinical model, achieving AUC values of 0.890 (95% CI: 0.816–0.963), 0.876 (95% CI: 0.755–0.997), and 0.803 (95% CI: 0.651–0.955) in the training, testing, and validation cohorts, respectively. The results of the post hoc Nemenyi tests indicated that neither machine learning algorithms nor resampling techniques significantly improved model performance, as measured by the AUC, G-mean, or F-measure.
Conclusion: The DL radiomics model based on preoperative EAT images effectively identifies high-risk lung cancer patients with POAF following lung lobectomy and offers a novel tool for risk stratification.
1 Introduction
Lung lobectomy is the most common operation performed for lung cancer patients. Postoperative atrial fibrillation (POAF) is a common complication following lung lobectomy, with incidence rates ranging from 5.2% to 17.6% (1–4). Although POAF is often considered transient and self-limiting, it is significantly associated with prolonged hospital stays, increased risk of stroke, and higher mortality rates (5–7). Studies have shown that perioperative strategies, such as the administration of magnesium sulfate, preferential use of vasopressors over inotropes, avoidance of red cell transfusion, and video-assisted thoracoscopic surgery, may reduce POAF incidence (3, 8). Therefore, accurate preoperative risk stratification and tailored perioperative management are essential for improving outcomes and quality of life in high-risk lung cancer patients.
Several clinical characteristics, including advanced age, male sex, and procedural invasiveness, have been identified as key predictors of POAF (7, 9). Although these risk factors have been incorporated into predictive models, their performance remains suboptimal, with area under the receiver operating characteristic curve (AUC) values typically below 0.80 (3, 4, 10). Consequently, improving the identification of high-risk patients with POAF is warranted. Epicardial adipose tissue (EAT), a unique fat depot located between the myocardium and the visceral layer of the epicardium, has been suggested to play a role in the development and progression of atrial fibrillation (11). West et al. demonstrated that EAT volume could predict both in-hospital and long-term post-cardiac surgery atrial fibrillation (12).
Radiomics, which extracts high-throughput quantitative features from medical images, can provide disease-related information beyond traditional quantitative features such as volume and density (13, 14). Several studies have highlighted the effectiveness of EAT radiomics models in predicting POAF (15–17). The integration of deep learning (DL) radiomics features, particularly 3D DL features, enhances radiomics by capturing intricate structural patterns, thereby improving predictive model performance (18, 19). Therefore, integrating radiomics and DL analysis of EAT on preoperative CT images may offer a novel and robust approach for predicting POAF following lung lobectomy.
In this study, we aimed to develop and validate a DL radiomics model based on EAT to identify high-risk lung cancer patients for POAF following lung lobectomy. Additionally, we systematically evaluated the impact of various machine learning algorithms and resampling techniques on model performance.
2 Materials and methods
2.1 Study cohorts
This study was approved by the Ethics Board of Shandong Cancer Hospital and Institute, Shandong First Medical University and Shandong Academy of Medical Sciences (SDTHEC 202411027), and Feicheng Hospital Affiliated to Shandong First Medical University (2024039). Informed consent was waived due to the retrospective design of the study.
Between 1 May 2023 and 31 October 2023, 890 consecutive lung cancer patients who underwent lung lobectomy at, Shandong First Medical University and Shandong Academy of Medical Sciences (center 1) were enrolled. Additionally, 118 consecutive patients who underwent lung lobectomy for lung cancer at Feicheng Hospital Affiliated to Shandong First Medical University (center 2) between 1 May 2021 and 31 October 2023 were also included. The inclusion criteria were as follows: 1) underwent lung lobectomy for lung cancer and 2) preoperative contrast-enhanced chest CT performed within 1 week before surgery. The exclusion criteria were as follows: 1) prior history of atrial fibrillation or atrial flutter, 2) prior history of open heart surgery, 3) missing or incomplete clinical data, and 4) inadequate CT image quality for analysis. The workflow of this study is shown in Supplementary Figure S1.
Preoperative demographic data, comorbidities, electrocardiogram findings, and hematologic examination results were collected from the electronic medical record system. All patients underwent continuous telemetry monitoring for at least 48 to 72 h postoperatively, with extended monitoring as clinically indicated. POAF was defined as new-onset atrial fibrillation lasting >5 min, detected by continuous telemetry or 12-lead electrocardiogram following lung lobectomy.
2.2 CT examination and image preprocessing
All patients underwent contrast-enhanced chest CT examination using a multidetector CT system within 1 week prior to surgery. The scanning parameters are shown in Supplementary Table S1. Iodinated contrast agent (300 mg/mL) at a dose of 1.5 mL/kg body weight was injected rapidly at a flow rate of 2 mL/s through the patient’s elbow vein using a high-pressure syringe. Arterial phase CT images were retrieved from the Picture Archiving and Communication Systems for further evaluation. Normalization was performed on all images based on the mean and variance.
EAT segmentation was automatically performed using the TIMESlice software (version 4.19.0, https://slice-doc.netlify.app/) (20). First, the pericardium was delineated from the diaphragm to the pulmonary artery bifurcations. Then, a segmentation algorithm based on a Hounsfield unit (HU) threshold (between −190 and −30 HU) was used to identify EAT. After the automatic segmentation of EAT was completed, two experienced radiologists reviewed and adjusted the volume of interest (VOI). EAT images are shown in Supplementary Figure S2.
2.3 Radiomics feature extraction
The Python software (version 3.9.13, https://www.python.org/) and the PyRadiomics package were used to extract handcrafted radiomics features from the VOIs. A fixed bin width of 25 was set for image discretization. Bicubic spline interpolation was used to resample the original images to a voxel size of 1 mm × 1 mm × 1 mm. Finally, a total of 1,130 handcrafted radiomics features were extracted from each VOI of the original images and their corresponding filtered, transformed images. The pretrained 3D ResNet-18 model provided by torchvision, which was originally trained on the Kinetics-400 dataset, was employed to extract 512 DL features. To adapt the model to medical imaging data, the input layer was modified to accept single-channel (grayscale) input instead of the original three-channel (RGB) input. Additionally, the final fully connected layer was removed to adapt the model for use as a feature extractor.
2.4 Statistical analyses
2.4.1 Cohort splitting
Patients from center 1 were grouped by stratified random sampling based on the clinical outcome (with or without POAF) in a ratio of 7:3, with 623 and 267 patients in the training and testing cohorts, respectively. The validation cohort comprised 118 patients from center 2. Different resampling techniques, including random oversampling (ROS), random oversampling examples (ROSE), synthetic minority oversampling technique (SMOTE), and Borderline-SMOTE (bSMOTE), were applied to the training cohort to address the class imbalance distribution between patients with and without POAF.
2.4.2 Radiomics signature construction
Radiomics feature selection and signature construction were performed in the training cohort. First, the handcrafted and DL radiomics features were standardized using z-score normalization to eliminate differences introduced by value scales between radiomics features. The radiomics features in the testing and validation cohorts were normalized based on the mean value and standard deviation derived from the training cohort. The Spearman or Pearson correlation coefficients for each pair of radiomics features were calculated, and redundant features with a correlation coefficient greater than 0.9 were removed. The max-relevance and min-redundancy (mRMR) algorithm was implemented to rank the importance of the radiomics features and select the top 30 most significant features for subsequent analysis. Subsequently, the least absolute shrinkage and selection operator (LASSO) algorithm was applied to identify significant radiomics features with non-zero coefficients. The handcrafted and DL radiomics signatures were constructed using a linear combination of the final selected features and their corresponding coefficients.
2.4.3 Predictive models construction
The differences in the clinical features between patients in different groups or cohorts were compared using the Student’s t-test or Mann–Whitney U test for continuous variables and the chi-squared test for categorical variables, as appropriate. Clinical features potentially associated with POAF (P<0.05) were then included in the multivariate logistic regression analysis to identify the independent risk factors.
The clinical model and combined models, including the clinical + handcrafted model, clinical + DL model, and clinical + handcrafted + DL model, were constructed using the logistic regression (LR) algorithm based on the selected clinical features and handcrafted and DL radiomics signatures in the training cohort. Furthermore, several machine learning algorithms, such as support vector machine (SVM), random forest (RF), and eXtreme Gradient Boosting (XGBoost), were also considered. The optimal hyperparameters of the classifiers were determined through a five-fold cross-validation method.
2.4.4 Predictive models evaluation
The receiver operating characteristic (ROC) curves, AUC, sensitivity, specificity, accuracy, G-mean, and F-measure were used to assess the performance of the predictive models. The optimal classification threshold was determined using the Youden index (sensitivity + specificity − 1). The Delong test was used to compare the AUC values between the combined models and the clinical model. The net reclassification index (NRI) was also calculated to evaluate the incremental value of handcrafted radiomics signatures and DL radiomics signatures for POAF prediction. The post hoc Nemenyi test was adopted to compare the predictive performance of different combinations of resampling techniques and machine learning algorithms, and the results were visualized using critical difference (CD) plots.
The sample size was estimated using the “pmsampsize” package (21). Statistical analyses were conducted using R software (version 4.1.1, https://www.r-project.org/). A P-value <0.05 was considered statistically significant.
3 Results
3.1 Patient characteristics
A total of 1,008 lung cancer patients from one high-volume center (center 1, 890 patients) and one low-volume center (center 2, 118 patients) were included in this study, with 30 (3.4%) and 10 (8.5%) patients developing POAF, respectively. No significant differences were observed between patients in the training and testing cohorts (Supplementary Table S2). Compared to the training cohort, the validation cohort had a significantly higher proportion of POAF patients (8.5% vs. 3.4%, P=0.022) (Supplementary Table S3).
In the training cohort, age (P=0.020), sex (P=0.003), history of coronary heart disease (P=0.028), smoking history (P=0.021), lymphocyte count (P=0.022), and use of calcium channel blockers (P=0.046) were significantly different between patients with and without POAF (Table 1). The multivariate analysis showed that age (OR=1.079, 95% CI: 1.016–1.146, P=0.014) and male sex (OR=3.401, 95% CI: 1.125–10.286, P=0.030) were independent risk factors for POAF. Furthermore, we found that in the three cohorts, CHADS2 score, CHA2DS2-VASc score, and Passman score showed no significant differences between POAF and non-POAF patients (P<0.05). Clinical features between POAF and non-POAF patients in the testing and validation cohorts are described in Supplementary Tables S4 and S5.
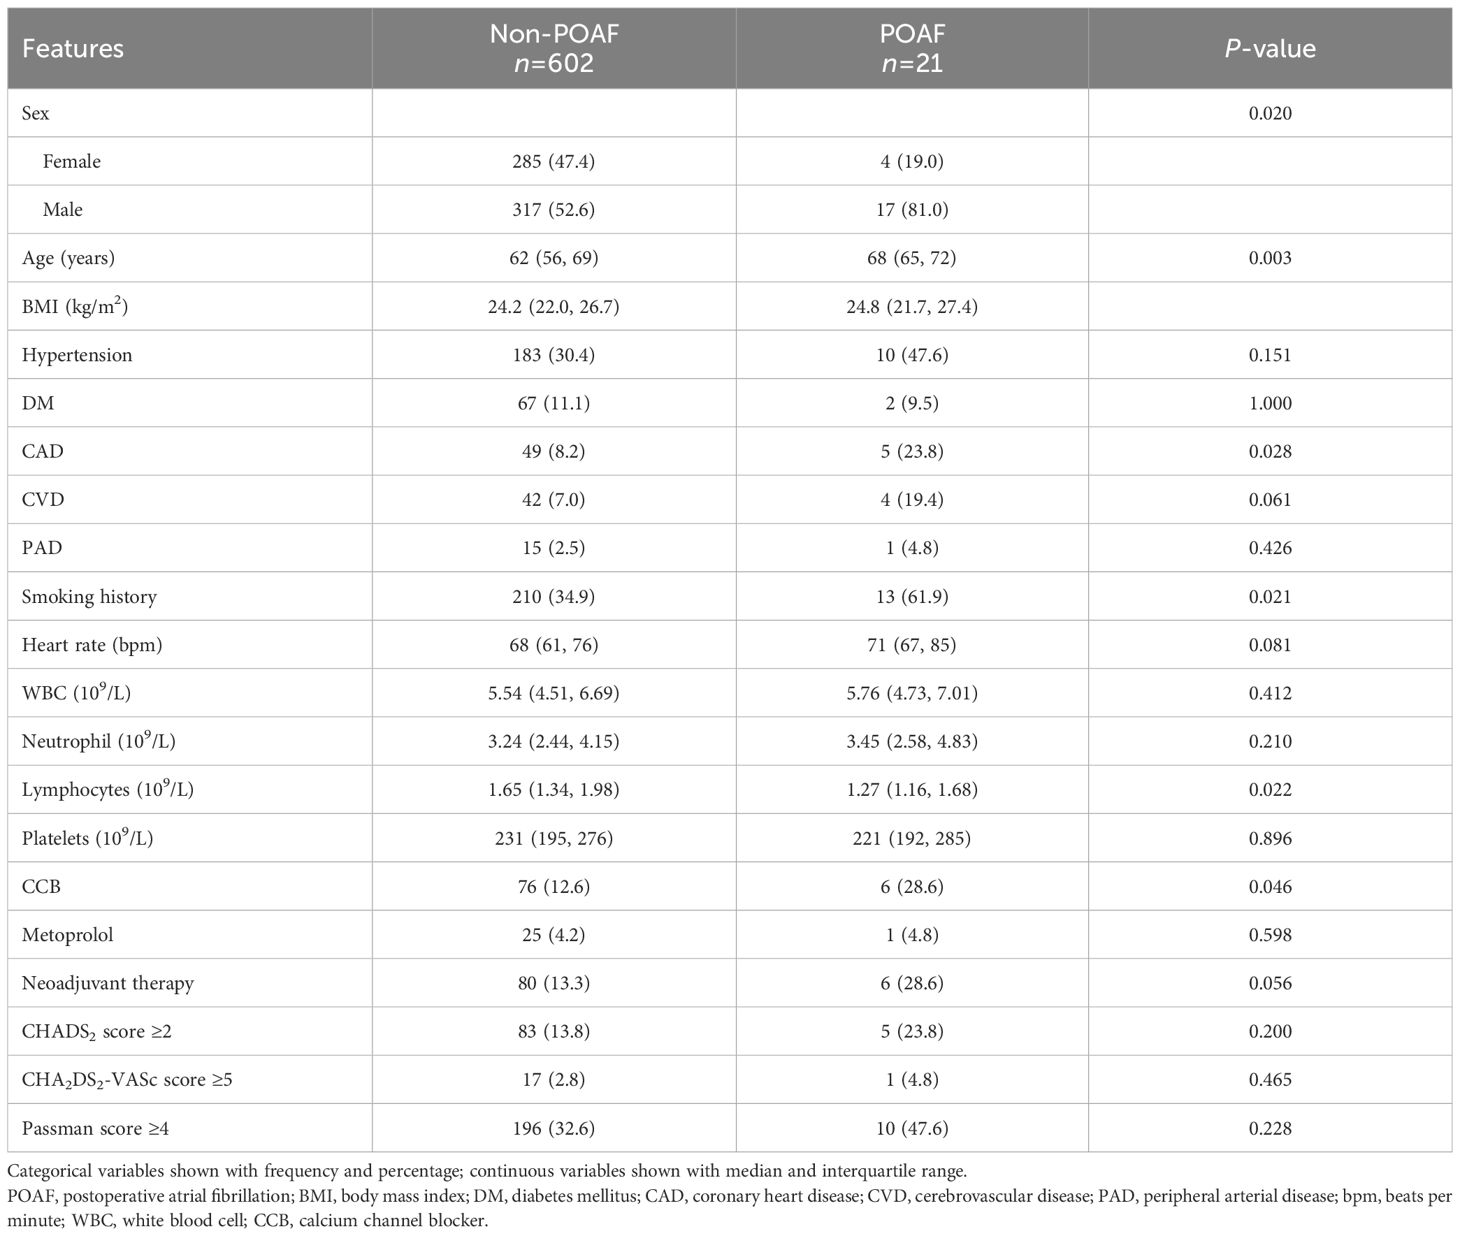
Table 1. Clinical features between patients with and without POAF in the training cohorts.
We also adopted four different resampling techniques on the training cohort to balance the distribution between patients with and without POAF. The distribution of POAF and non-POAF patients before and after applying different resampling techniques is illustrated in Supplementary Figure S3.
3.2 Radiomics signature construction
We selected nine handcrafted radiomics features and five DL radiomics features from the training cohort. The detailed information on the selected features and their coefficients is shown in Figure 1. In the original dataset, testing cohort, and validation cohort, the handcrafted and DL radiomics signatures were significantly elevated in patients with POAF (P<0.05; Figure 1). The distribution of constructed handcrafted and DL radiomics signatures between patients with and without POAF in the other resampling datasets is demonstrated in Supplementary Figure S4.
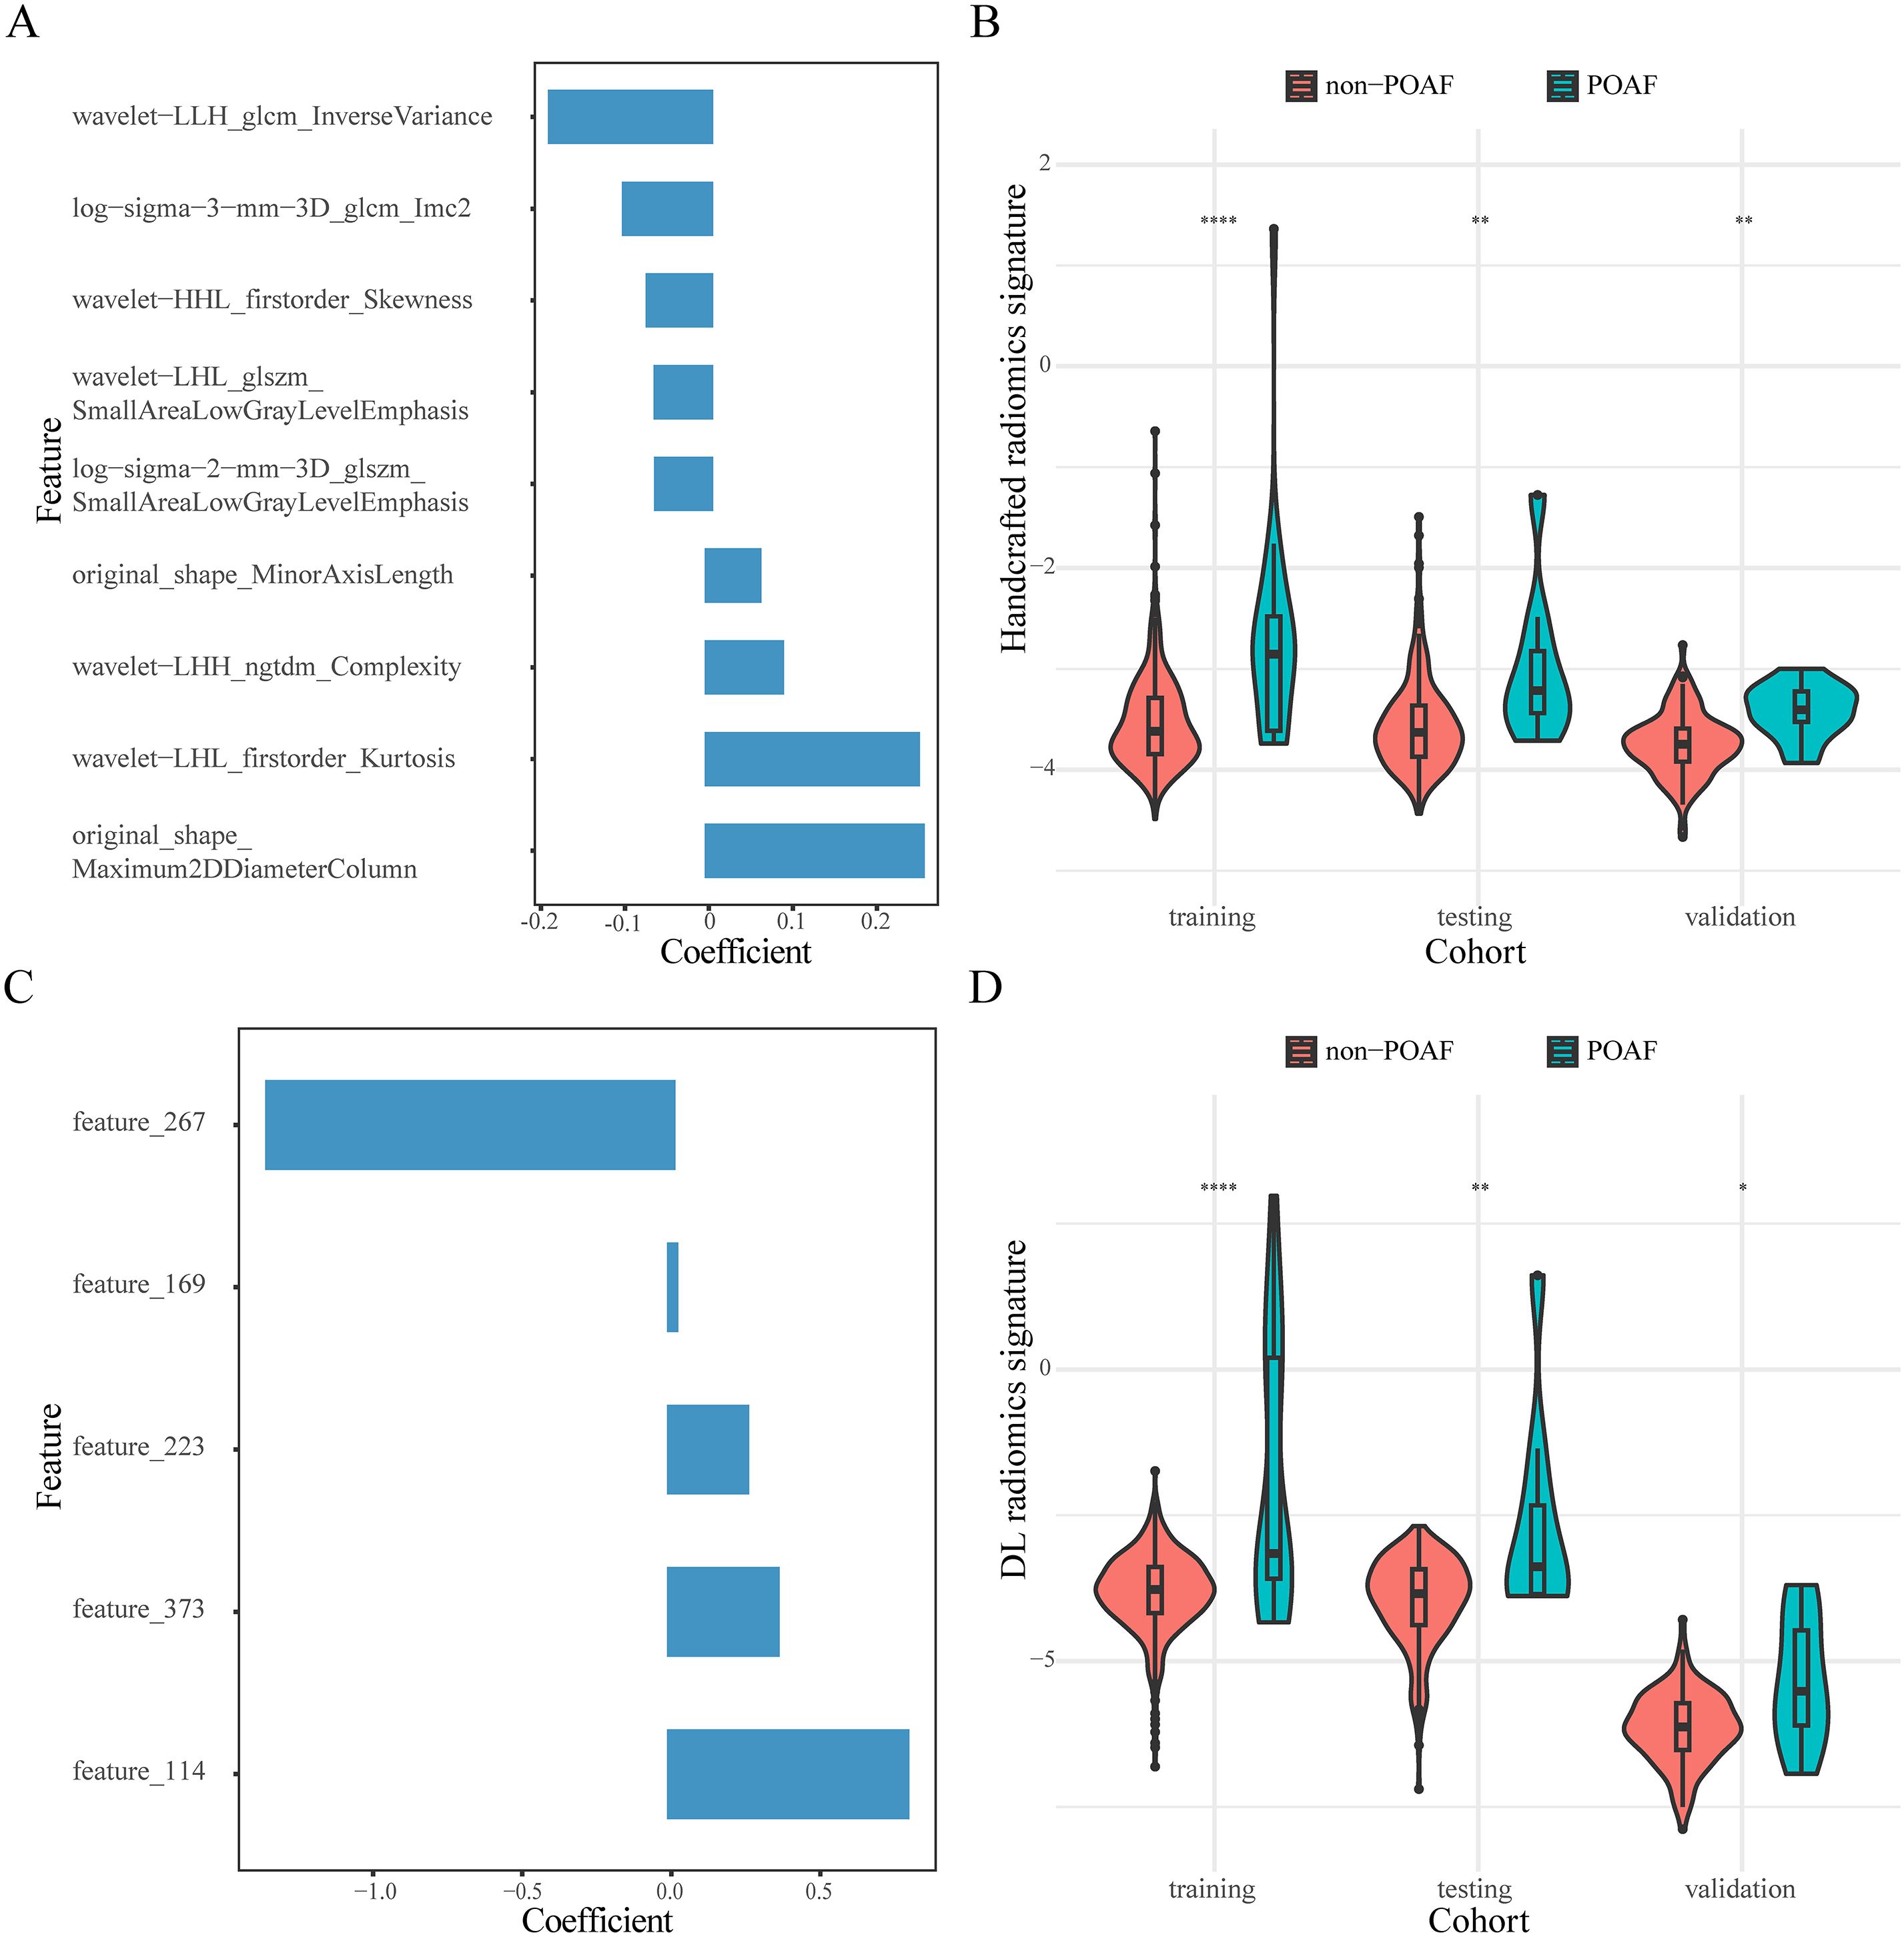
Figure 1. Composition features and distribution of constructed radiomics signatures. The selected handcrafted (A) and DL radiomics features (C). Violin plots of the distribution of handcrafted (B) and DL radiomics signatures (D) in the three cohorts. *, P<0.05; **, P<0.01; ****, P<0.0001.
3.3 Model performance comparison
We constructed four predictive models using the LR algorithm based on the independent clinical features and handcrafted and DL radiomics signatures. As shown in Figure 2 and Table 2, the clinical + handcrafted + DL model, integrating clinical features and handcrafted and DL radiomics signatures, demonstrated superior predictive performance in the training, testing, and validation cohorts, with AUC values of 0.890, 0.876, and 0.803, respectively. Furthermore, the Delong test showed that the AUC of the clinical + handcrafted + DL model was significantly better than that of the clinical model in the training (P=0.016), testing (P=0.043), and validation (P=0.018) cohorts (Table 2). The NRI also indicated that the classification accuracy of POAF prediction improved significantly after integrating handcrafted and DL radiomics signatures compared to the clinical model, with P-values of 0.025, <0.001, and 0.004 in the three cohorts, respectively. Furthermore, the G-mean and F-measure of the clinical + handcrafted + DL model were higher than those of other models in all three cohorts (Table 2).
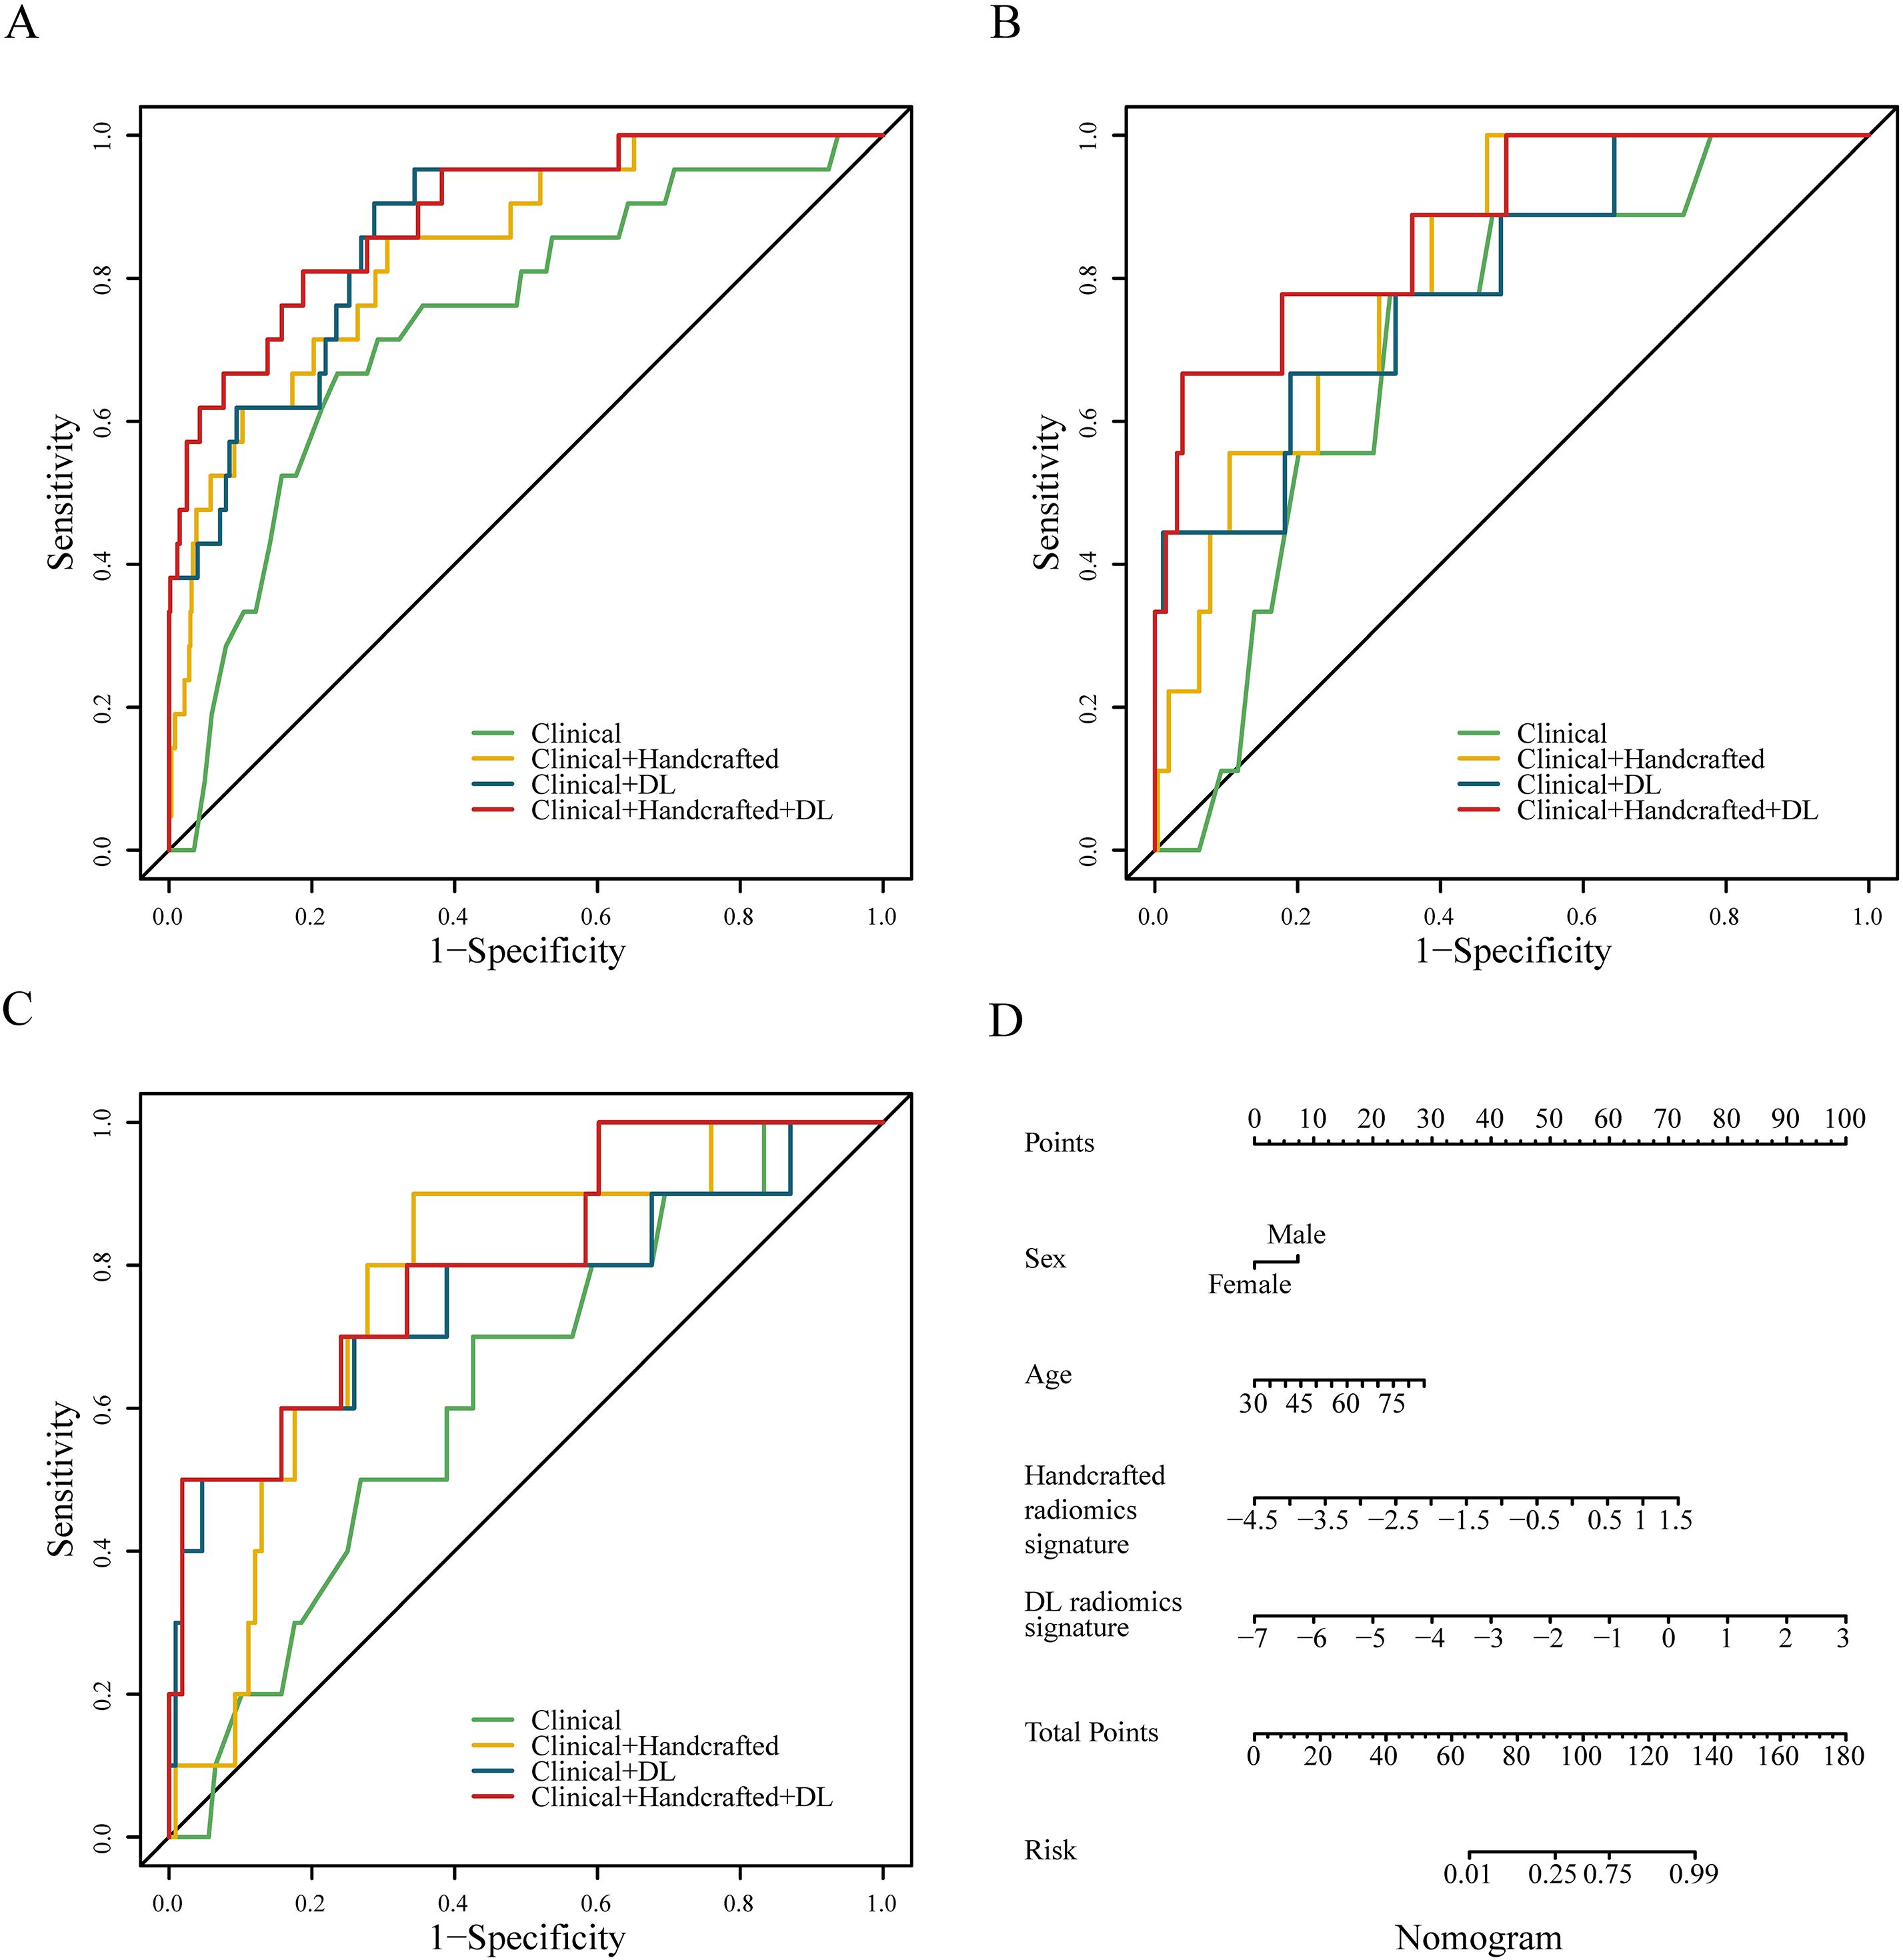
Figure 2. Receiver operating characteristic curves of four different predictive models constructed with no resampling technology and LR algorithm in the training (A), testing (B), and validation (C) cohorts. The nomogram of the clinical + handcrafted + DL model (D).
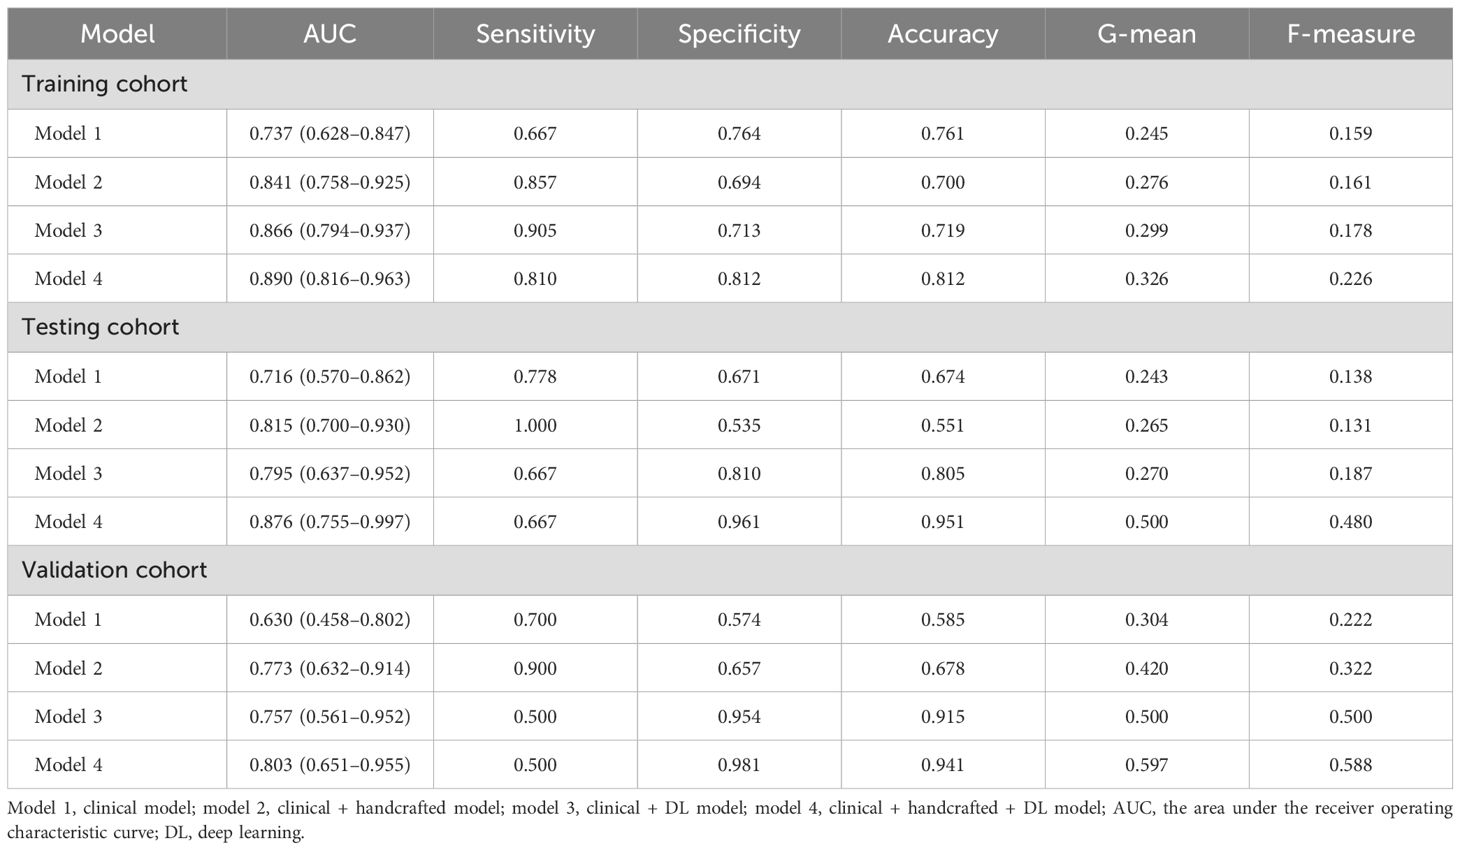
Table 2. Predictive performance of the models constructed with no resampling technology and LR algorithm.
In addition, we constructed 20 different clinical + handcrafted + DL models using various combinations of resampling techniques and machine learning algorithms. The post hoc Nemenyi test was employed to compare the predictive performance of these models. The results showed that in the training cohort, the RF algorithm significantly outperformed the LR algorithm in terms of G-mean and F-measure, but not in terms of AUC. However, improvements in AUC, G-mean, or F-measure resulting from resampling techniques and machine learning algorithms were not statistically significant in either the testing or validation cohorts. CD plots were used to visualize the differences in AUC, G-mean, and F-measure (Figure 3, Supplementary Figure S5, S6).
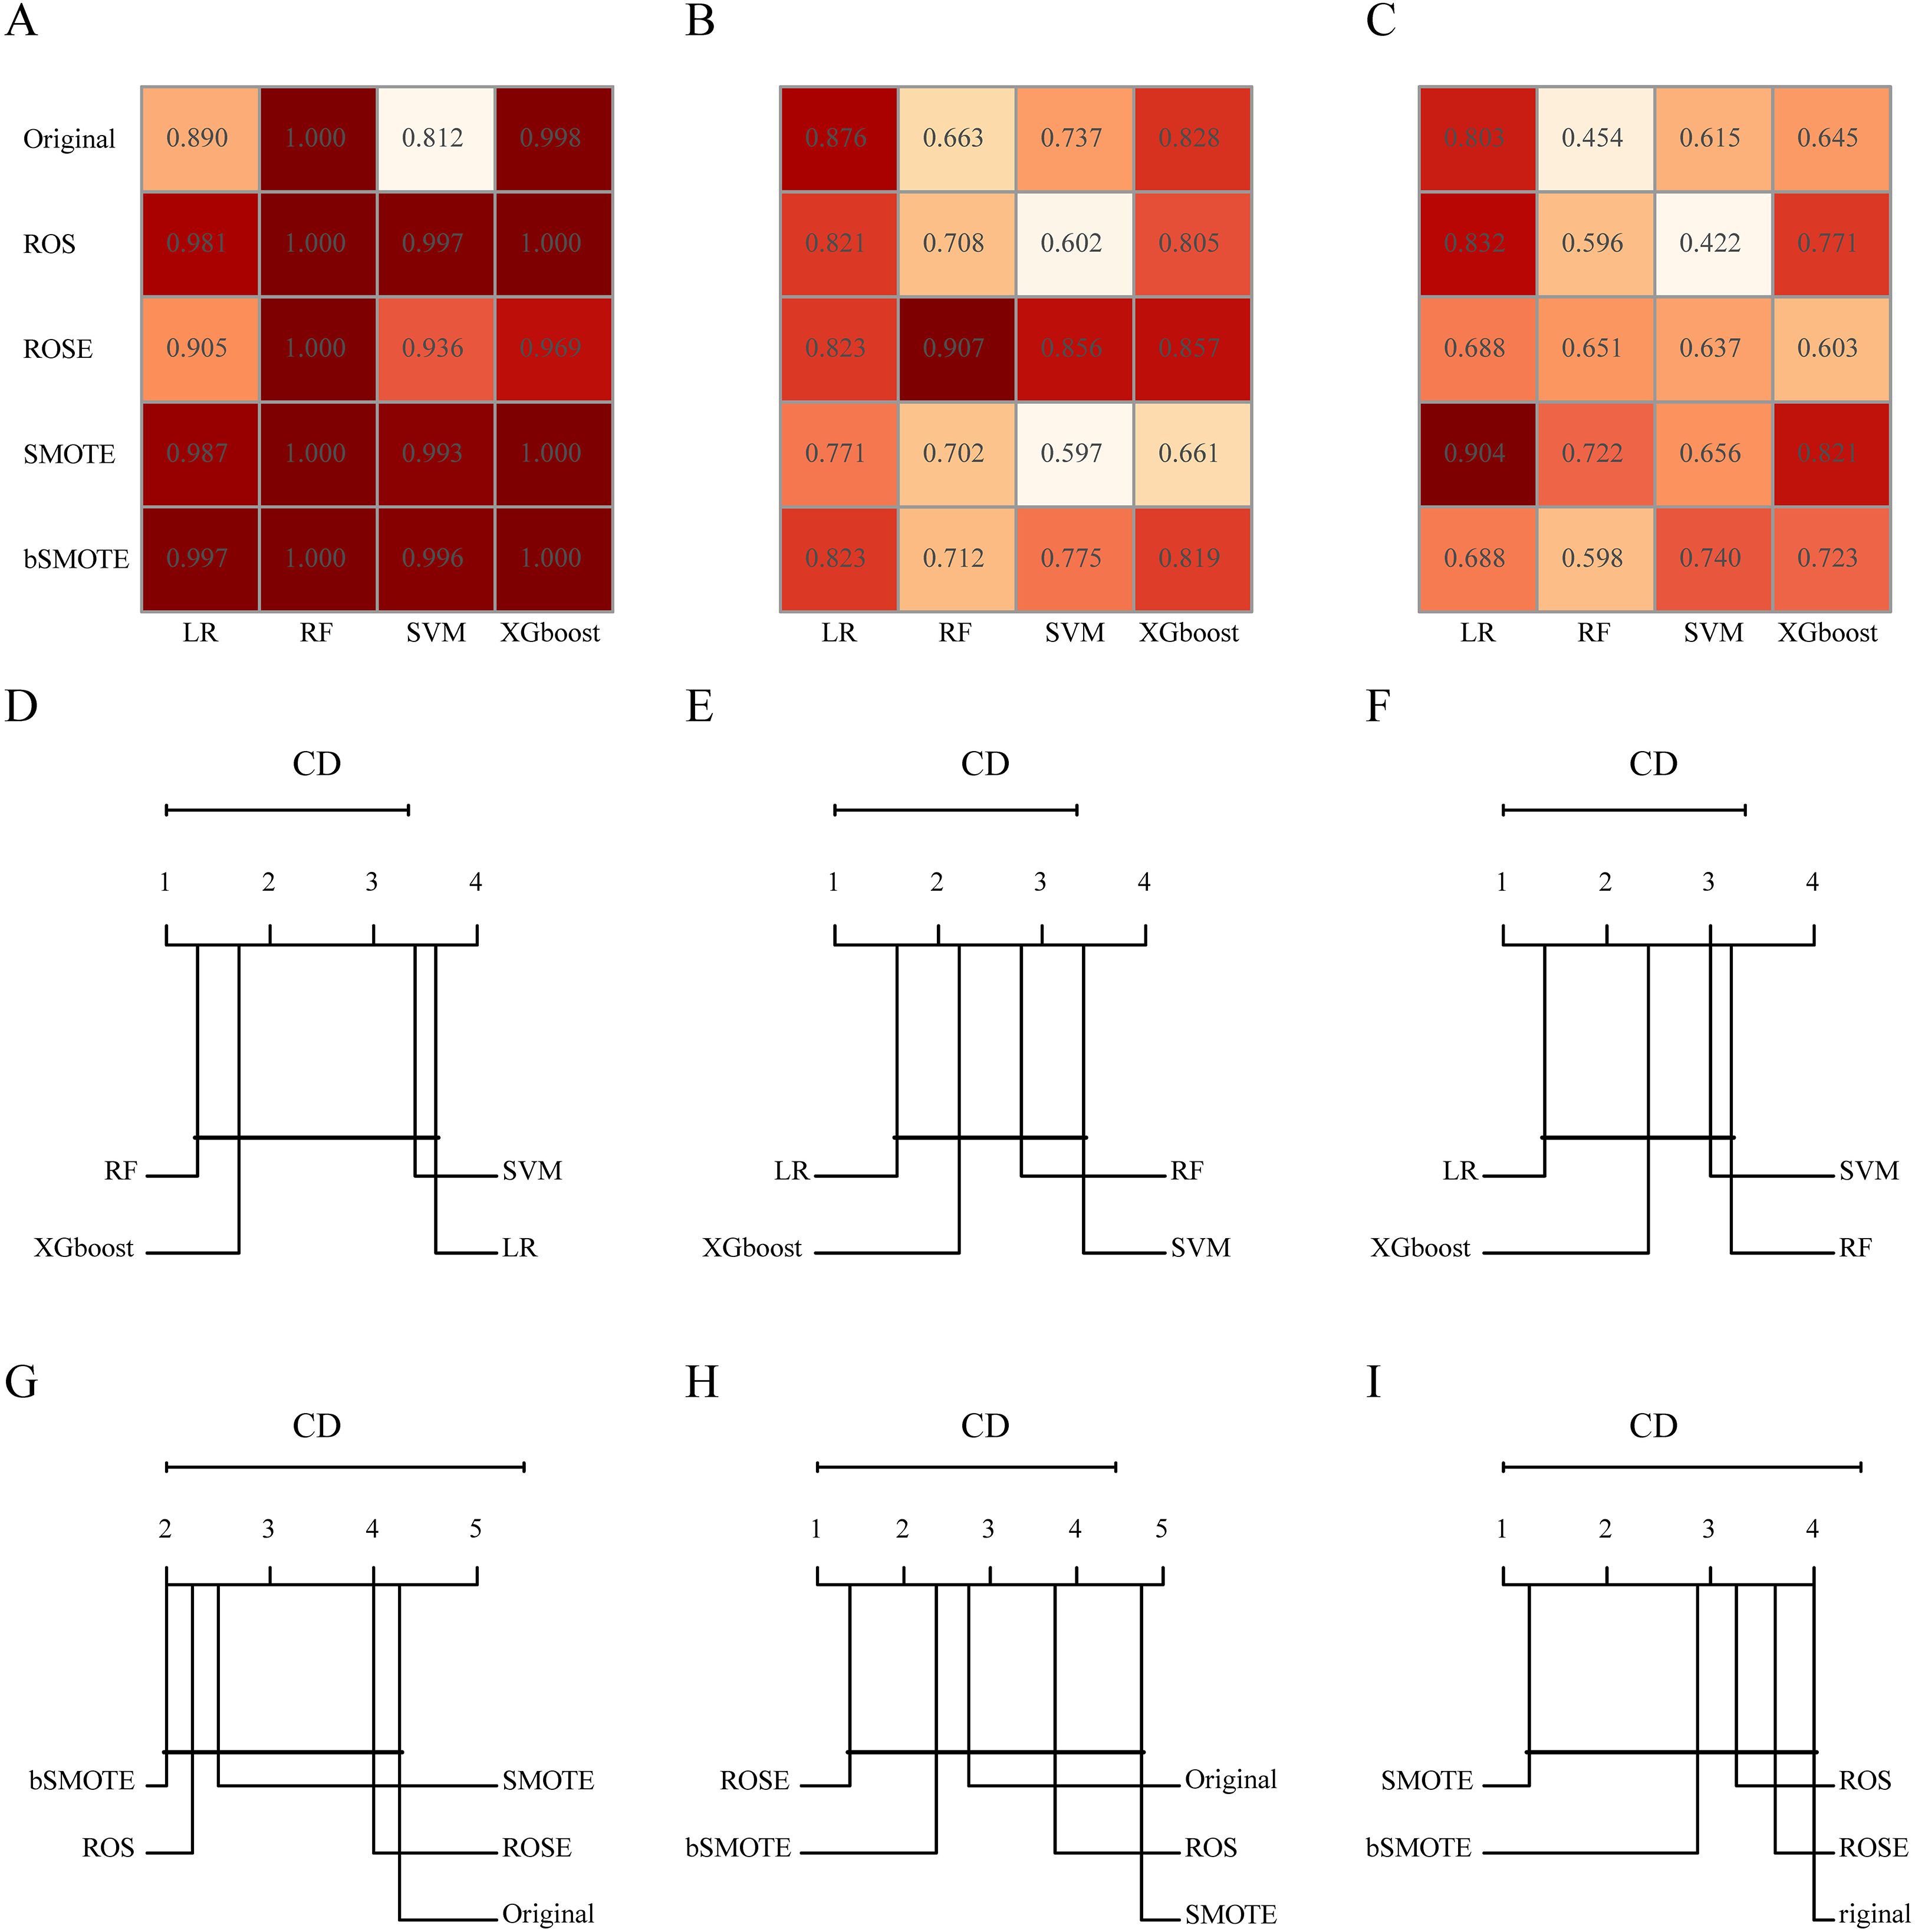
Figure 3. The area under the receiver operating characteristic (AUC) of different combinations of resampling techniques and machine learning algorithms in the training (A), testing (B), and validation (C) cohorts. Critical difference (CD) plots of the performance rankings over different machine learning algorithms by the post hoc Nemenyi test in terms of AUC in the training (D), testing (E), and validation (F) cohorts. CD plots of the performance rankings over different resampling techniques by the post hoc Nemenyi test in terms of AUC in the training (G), testing (H), and validation (I) cohorts. In CD plots, lower ranks correspond to better model performance, and the black bar represents the lack of statistical differences between machine learning algorithms or resampling techniques.
4 Discussion
In this study, we constructed a DL radiomics model through DL and radiomics analysis based on preoperative CT images of EAT and validated its ability to identify high-risk lung cancer patients with POAF following lung lobectomy. Compared to the clinical model, the predictive performance of the DL radiomics model, which integrates clinical features and handcrafted and DL radiomics signatures, was significantly improved. Furthermore, resampling techniques and machine learning algorithms did not significantly improve model performance.
The incidence of POAF in center 1 was 3.4%, lower than that reported in previous studies (1–4), which may be attributed to the implementation of enhanced recovery after surgery protocols (22) and a lower proportion of elderly patients. However, in the low-volume center, the incidence of POAF was 8.5%, significantly higher than that in center 1, demonstrating the good transportability of the DL radiomics model. In this study, we identified advanced age (P=0.014) and male sex (P=0.030) as independent risk factors. In the three cohorts, the AUC values of the clinical model were 0.737, 0.716, and 0.630, respectively, consistent with the results of previous studies (3, 4, 10). Furthermore, the Passman score, CHADS2 score, and CHA2DS2-VASc score have been reported to identify high-risk patients with POAF (23–26). However, no significant differences were observed between patients with and without POAF in the three cohorts.
Artificial intelligence, particularly radiomics and deep learning, has rapidly emerged as a transformative field in translational oncology, serving as a critical bridge between medical imaging and precision medicine (27–29). In the context of lung cancer, radiomics has demonstrated broad application prospects in diagnosis, treatment response evaluation, and prognosis prediction (30–32). In recent years, the region of interest in radiomics has extended beyond the tumor itself. Radiomics features of EAT have been shown to effectively predict atrial fibrillation, mortality in acute pulmonary embolism, and myocardial ischemia (33–35). Our previous studies demonstrated that the handcrafted radiomics signatures of EAT achieved acceptable performance in predicting atrial fibrillation after pulmonary endarterectomy and coronary artery bypass grafting (16, 17). Therefore, radiomics analysis of EAT shows potential in identifying POAF in patients undergoing lung lobectomy.
DL radiomics features, particularly 3D DL features, can improve the performance of predictive models (18, 19). However, no relevant studies have been conducted on the DL radiomics analysis of EAT. In our study, we aimed to investigate the incremental value of handcrafted and DL radiomics signatures in POAF prediction. We extracted 1,130 handcrafted radiomics features and 512 DL radiomics features from each VOI, ultimately constructing handcrafted DL radiomics signatures after feature selection. The results of the Delong test and NRI analysis demonstrated that the DL radiomics model, integrating clinical features and handcrafted and DL radiomics signatures, performed satisfactorily in all cohorts, with significantly better predictive ability than the clinical model. However, the biological interpretation of radiomic features remains largely unclear, which limits a deeper understanding of their predictive mechanism and potential clinical translation. A relevant study by Mancio et al. in patients undergoing aortic valve replacement showed that a radiomics model combining EAT features and volume effectively discriminated preoperative POAF patients from those in sinus rhythm, achieving an AUC of 0.80 (95% CI: 0.68–0.92). Furthermore, proteomic analysis in that study revealed that POAF was associated with upregulation of inflammatory and prothrombotic proteins, along with downregulation of cardioprotective proteins with anti-inflammatory and antilipotoxic functions (15). Unfortunately, due to the retrospective nature of our study, we were unable to perform biologically validated assays (e.g., proteomics or histology) to explore the molecular correlates of the EAT radiomic features identified here. In our previous study, EAT segmentation was performed manually, which was time-consuming and labor-intensive. In this study, we employed the TIMESlice software to automatically segment EAT, significantly reducing the segmentation time and facilitating its clinical application.
Currently, imbalanced data remain a significant challenge for prediction models, often leading to prediction misclassification (36). Previous studies have demonstrated that resampling techniques and machine learning algorithms are effective methods for addressing the imbalance problem (37–39). In this study, we adopted the classical linear classification model constructed by the LR algorithm as the baseline model. Additionally, machine learning algorithms such as RF, SVM, and XGBoost, which have been reported to effectively address imbalance problems, were also selected (38, 40). Furthermore, considering the small number of patients with POAF, we employed four oversampling methods to balance the distribution of patients and ultimately constructed 20 different combination models. Currently, most studies only compare numerical values, lacking comprehensive statistical analysis. In our study, we employed the Friedman test and post hoc Nemenyi test to compare the predictive performance of different combinations of resampling techniques and machine learning algorithms, with results visualized using CD plots. The results indicated that neither machine learning algorithms nor resampling techniques significantly improved model performance in terms of AUC. G-mean and F-measure are useful evaluation metrics for imbalanced datasets. Unfortunately, we did not observe significant improvements in terms of G-mean and F-measure with machine learning algorithms and resampling techniques, contrary to previous studies (37). However, the study by Hubert S. Gabryś et al. found no advantage of resampling techniques in improving model performance (41). Due to the specific clinical challenges and the intrinsic characteristics of the data, there is no consensus on the optimal combination of machine learning algorithms and resampling techniques. Further research is required to comprehensively compare the performance of various resampling methods and machine learning algorithms.
This study has several limitations. First, due to the retrospective study design, some potential clinical features associated with POAF were not included, which may have limited the diagnostic performance. Second, it is important to note that the data for this study were retrospectively collected from two centers within a single healthcare network. While this provided internal consistency in imaging protocols, it may limit the generalizability of the findings. Furthermore, the sample size of the external validation cohort was limited, and future large-scale, multi-institutional prospective studies involving external validation cohorts from independent networks are essential to confirm the broad applicability of our model. Third, the relatively low incidence of POAF in our cohort may constrain the statistical power of the analysis and heighten the risk of model overfitting. While we employed resampling methods applied to alleviate class imbalance, further investigation into advanced feature selection and systematic hyperparameter tuning may offer valuable pathways for enhancing model generalizability and performance. Finally, the biological significance of radiomics features, particularly DL features, requires further investigation to enhance understanding and clinical application. The utilization of gradient-weighted class activation maps and perturbation-based explainable artificial intelligence techniques and the integration of radiomic features with other interpretable omics data, such as tissue metabolomics, all represent promising potential avenues for enhancing model interpretability (42–44).
5 Conclusion
In summary, the DL radiomics model based on preoperative EAT images effectively identified high-risk lung cancer patients with POAF following lung lobectomy and offers a novel tool for risk stratification. Neither machine learning algorithms nor resampling techniques significantly improved model performance in terms of AUC, G-mean, and F-measure.
Data availability statement
The raw data supporting the conclusions of this article will be made available by the authors, without undue reservation.
Ethics statement
The studies involving humans were approved by Shandong Cancer Hospital and Institute, Shandong First Medical University and Shandong Academy of Medical Sciences (SDTHEC 202411027) and Feicheng Hospital Affiliated to Shandong First Medical University (2024039). The studies were conducted in accordance with the local legislation and institutional requirements. The ethics committee/institutional review board waived the requirement of written informed consent for participation from the participants or the participants’ legal guardians/next of kin because Informed consent was waived due to the retrospective design of the study.
Author contributions
ZL: Formal Analysis, Methodology, Writing – original draft, Software, Funding acquisition. CZ: Investigation, Software, Writing – original draft. ZJ: Writing – original draft, Investigation, Validation. CWZ: Investigation, Writing – review & editing. XL: Software, Writing – review & editing, Investigation. WS: Formal Analysis, Data curation, Software, Writing – review & editing. FC: Investigation, Writing – review & editing, Supervision. HZ: Formal Analysis, Writing – review & editing, Methodology, Conceptualization. HG: Conceptualization, Project administration, Writing – review & editing, Supervision.
Funding
The author(s) declare financial support was received for the research and/or publication of this article. This study was supported by the Qingmiao Foundation of Shandong Cancer Hospital and Institute (Grant Nos. 2024-qm04) and Natural Science Foundation of Shandong Province, China (Grant Nos. ZR2024QH419).
Acknowledgments
The authors would like to thank all the clinicians and technicians at the Department of Lung Surgical Ward II at Shandong Cancer Hospital and Institute, Shandong First Medical University and Shandong Academy of Medical Sciences, who provided us with professional advice and guidance.
Conflict of interest
The authors declare that the research was conducted in the absence of any commercial or financial relationships that could be construed as a potential conflict of interest.
Generative AI statement
The author(s) declare that no Generative AI was used in the creation of this manuscript.
Any alternative text (alt text) provided alongside figures in this article has been generated by Frontiers with the support of artificial intelligence and reasonable efforts have been made to ensure accuracy, including review by the authors wherever possible. If you identify any issues, please contact us.
Publisher’s note
All claims expressed in this article are solely those of the authors and do not necessarily represent those of their affiliated organizations, or those of the publisher, the editors and the reviewers. Any product that may be evaluated in this article, or claim that may be made by its manufacturer, is not guaranteed or endorsed by the publisher.
Supplementary material
The Supplementary Material for this article can be found online at: https://www.frontiersin.org/articles/10.3389/fonc.2025.1623248/full#supplementary-material
References
1. Ishibashi H, Wakejima R, Asakawa A, Baba S, Nakashima Y, Seto K, et al. Postoperative atrial fibrillation in lung cancer lobectomy-analysis of risk factors and prognosis. World J Surg. (2020) 44:3952–9. doi: 10.1007/s00268-020-05694-w
2. Hayashi T, Sano Y, Tanaka K, Ishimura T, Ogura F, Kiriyama Y, et al. Predictors of postoperative atrial fibrillation after lung resection. Curr Probl Surg. (2024) 61:101502. doi: 10.1016/j.cpsurg.2024.101502
3. Lee SH, Ahn HJ, Yeon SM, Yang M, Kim JA, Jung DM, et al. Potentially modifiable risk factors for atrial fibrillation following lung resection surgery: a retrospective cohort study. Anaesthesia. (2016) 71:1424–30. doi: 10.1111/anae.13644
4. Amar D, Zhang H, Tan KS, Piening D, Rusch VW, and Jones DR. A brain natriuretic peptide-based prediction model for atrial fibrillation after thoracic surgery: Development and internal validation. J Thorac Cardiovasc Surg. (2019) 157:2493–2499.e1. doi: 10.1016/j.jtcvs.2019.01.075
5. Lin MH, Kamel H, Singer DE, Wu YL, Lee M, and Ovbiagele B. Perioperative/postoperative atrial fibrillation and risk of subsequent stroke and/or mortality. Stroke. (2019) 50:1364–71. doi: 10.1161/STROKEAHA.118.023921
6. Conen D, Alonso-Coello P, Douketis J, Chan MTV, Kurz A, Sigamani A, et al. Risk of stroke and other adverse outcomes in patients with perioperative atrial fibrillation 1 year after non-cardiac surgery. Eur Heart J. (2020) 41:645–51. doi: 10.1093/eurheartj/ehz431
7. Crispi V, Isaac E, Abah U, Shackcloth M, Lopez E, Eadington T, et al. Surgical factors associated with new-onset postoperative atrial fibrillation after lung resection: the EPAFT multicentre study. Postgrad Med J. (2022) 98:177–82. doi: 10.1136/postgradmedj-2020-138904
8. Ghezel-Ahmadi V, Ghezel-Ahmadi D, Beck G, and Bölükbas S. Perioperative systemic magnesium sulfate minimizes the incidence of atrial fibrillation after thoracotomy for lung resection: a prospective observational study. J Thorac Dis. (2023) 15:4648–56. doi: 10.21037/jtd-23-506
9. Diallo EH, Brouillard P, Raymond JM, Liberman M, Duceppe E, and Potter BJ. Predictors and impact of postoperative atrial fibrillation following thoracic surgery: a state-of-the-art review. Anaesthesia. (2023) 78:491–500. doi: 10.1111/anae.15957
10. Oh AR, Park J, Shin SJ, Choi B, Lee JH, Yang K, et al. Prediction model for postoperative atrial fibrillation in non-cardiac surgery using machine learning. Front Med (Lausanne). (2023) 9:983330. doi: 10.3389/fmed.2022.983330
11. Iacobellis G. Epicardial adipose tissue in contemporary cardiology. Nat Rev Cardiol. (2022) 19:593–606. doi: 10.1038/s41569-022-00679-9
12. West HW, Siddique M, Williams MC, Volpe L, Desai R, Lyasheva M, et al. Deep-learning for epicardial adipose tissue assessment with computed tomography: implications for cardiovascular risk prediction. JACC Cardiovasc Imaging. (2023) 16:800–16. doi: 10.1016/j.jcmg.2022.11.018
13. Lambin P, Rios-Velazquez E, Leijenaar R, Carvalho S, van Stiphout RG, Granton P, et al. Radiomics: extracting more information from medical images using advanced feature analysis. Eur J Cancer. (2012) 48:441–6. doi: 10.1016/j.ejca.2011.11.036
14. Lambin P, Leijenaar RTH, Deist TM, Peerlings J, de Jong EEC, van Timmeren J, et al. Radiomics: the bridge between medical imaging and personalized medicine. Nat Rev Clin Oncol. (2017) 14:749–62. doi: 10.1038/nrclinonc.2017.141
15. Mancio J, Sousa-Nunes F, Martins R, Fragao-Marques M, Conceicao G, Pessoa-Amorim G, et al. Decoding the radiomic and proteomic phenotype of epicardial adipose tissue associated with adverse left atrial remodelling and post-operative atrial fibrillation in aortic stenosis. Eur Heart J Cardiovasc Imaging. (2022) 23:1248–59. doi: 10.1093/ehjci/jeac092
16. Liu Z, Deng Y, Wang X, Liu X, Zheng X, Sun G, et al. Radiomics signature of epicardial adipose tissue for predicting postoperative atrial fibrillation after pulmonary endarterectomy. Front Cardiovasc Med. (2023) 9:1046931. doi: 10.3389/fcvm.2022.1046931
17. Deng Y, Liu Z, Wang X, Gao X, Zhang Z, Zhang D, et al. Radiomics signature of epicardial adipose tissue for predicting postoperative atrial fibrillation after off-pump coronary artery bypass surgery. Rev Cardiovasc Med. (2023) 24:327. doi: 10.31083/j.rcm2411327
18. Cui Y, Zhang J, Li Z, Wei K, Lei Y, Ren J, et al. A CT-based deep learning radiomics nomogram for predicting the response to neoadjuvant chemotherapy in patients with locally advanced gastric cancer: A multicenter cohort study. EClinicalMedicine. (2022) 46:101348. doi: 10.1016/j.eclinm.2022.101348
19. Wang W, Liang H, Zhang Z, Xu C, Wei D, Li W, et al. Comparing three-dimensional and two-dimensional deep-learning, radiomics, and fusion models for predicting occult lymph node metastasis in laryngeal squamous cell carcinoma based on CT imaging: a multicentre, retrospective, diagnostic study. EClinicalMedicine. (2024) 67:102385. doi: 10.1016/j.eclinm.2023.102385
20. Li X, Sun Y, Xu L, Greenwald SE, Zhang L, Zhang R, et al. Automatic quantification of epicardial adipose tissue volume. Med Phys. (2021) 48:4279–90. doi: 10.1002/mp.15012
21. Riley RD, Ensor J, Snell KIE, Harrell FE Jr, Martin GP, Reitsma JB, et al. Calculating the sample size required for developing a clinical prediction model. BMJ. (2020) 368:m441. doi: 10.1136/bmj.m441
22. Batchelor TJP, Rasburn NJ, Abdelnour-Berchtold E, Brunelli A, Cerfolio RJ, Gonzalez M, et al. Guidelines for enhanced recovery after lung surgery: recommendations of the Enhanced Recovery After Surgery (ERAS®) Society and the European Society of Thoracic Surgeons (ESTS). Eur J Cardiothorac Surg. (2019) 55:91–115. doi: 10.1093/ejcts/ezy301
23. Passman RS, Gingold DS, Amar D, Lloyd-Jones D, Bennett CL, Zhang H, et al. Prediction rule for atrial fibrillation after major noncardiac thoracic surgery. Ann Thorac Surg. (2005) 79:1698–703. doi: 10.1016/j.athoracsur.2004.10.058
24. Kotova S, Wang M, Lothrop K, Grunkemeier G, Merry HE, and Handy JR. CHADS2 score predicts postoperative atrial fibrillation in patients undergoing elective pulmonary lobectomy. Ann Thorac Surg. (2017) 103:1566–72. doi: 10.1016/j.athoracsur.2016.11.007
25. Lee CT, Strauss DM, Stone LE, Stoltzfus JC, Puc MM, and Burfeind WR. Preoperative CHA2DS2-VASc score predicts postoperative atrial fibrillation after lobectomy. Thorac Cardiovasc Surg. (2019) 67:125–30. doi: 10.1055/s-0038-1675638
26. Smith H, Li H, Brandts-Longtin O, Yeung C, Maziak D, Gilbert S, et al. External validity of a model to predict postoperative atrial fibrillation after thoracic surgery. Eur J Cardiothorac Surg. (2020) 57:874–80. doi: 10.1093/ejcts/ezz341
27. Bera K, Braman N, Gupta A, Velcheti V, and Madabhushi A. Predicting cancer outcomes with radiomics and artificial intelligence in radiology. Nat Rev Clin Oncol. (2022) 19:132–46. doi: 10.1038/s41571-021-00560-7
28. Guiot J, Vaidyanathan A, Deprez L, Zerka F, Danthine D, Frix AN, et al. A review in radiomics: Making personalized medicine a reality via routine imaging. Med Res Rev. (2022) 42:426–40. doi: 10.1002/med.21846
29. Chen M, Copley SJ, Viola P, Lu H, and Aboagye EO. Radiomics and artificial intelligence for precision medicine in lung cancer treatment. Semin Cancer Biol. (2023) 93:97–113. doi: 10.1016/j.semcancer.2023.05.004
30. Yuan X, Xu H, Zhu J, Yang Z, Pan B, Wu L, et al. Systematic review and meta-analysis of artificial intelligence for image-based lung cancer classification and prognostic evaluation. NPJ Precis Oncol. (2025) 9:300. doi: 10.1038/s41698-025-01095-1
31. Guo Y, Gong B, Li Y, Mo P, Chen Y, Fan Q, et al. Non-invasive prediction of NSCLC immunotherapy efficacy and tumor microenvironment through unsupervised machine learning-driven CT Radiomic subtypes: a multi-cohort study. Int J Surg. (2025). doi: 10.1097/JS9.0000000000002839
32. Lin H, Hua J, Wang Y, Chen M, Liang Y, Yan L, et al. Prognostic and predictive values of a multimodal nomogram incorporating tumor and peritumor morphology with immune status in resectable lung adenocarcinoma. J Immunother Cancer. (2025) 13:e010723. doi: 10.1136/jitc-2024-010723
33. Zhang L, Xu Z, Jiang B, Zhang Y, Wang L, de Bock GH, et al. Machine-learning-based radiomics identifies atrial fibrillation on the epicardial fat in contrast-enhanced and non-enhanced chest CT. Br J Radiol. (2022) 95:20211274. doi: 10.1259/bjr.20211274
34. Surov A, Zimmermann S, Hinnerichs M, Meyer HJ, Aghayev A, and Borggrefe J. Radiomics parameters of epicardial adipose tissue predict mortality in acute pulmonary embolism. Respir Res. (2024) 25:356. doi: 10.1186/s12931-024-02977-x
35. Yu L, Yang W, Ling R, Yu Y, Dai X, Sun J, et al. Radiomic phenotype of epicardial adipose tissue derived from coronary artery calcium score predicts myocardial ischemia. Radiol Med. (2025). doi: 10.1007/s11547-025-02063-2
36. Dablain D, Krawczyk B, and Chawla NV. DeepSMOTE: fusing deep learning and SMOTE for imbalanced data. IEEE Trans Neural Netw Learn Syst. (2023) 34:6390–404. doi: 10.1109/TNNLS.2021.3136503
37. Xie C, Du R, Ho JW, Pang HH, Chiu KW, Lee EY, et al. Effect of machine learning re-sampling techniques for imbalanced datasets in 18F-FDG PET-based radiomics model on prognostication performance in cohorts of head and neck cancer patients. Eur J Nucl Med Mol Imaging. (2020) 47:2826–35. doi: 10.1007/s00259-020-04756-4
38. Li W, Li Y, Liu X, Wang L, Chen W, Qian X, et al. Machine learning-based radiomics for predicting BRAF-V600E mutations in ameloblastoma. Front Immunol. (2023) 14:1180908. doi: 10.3389/fimmu.2023.1180908
39. Oka H, Kawahara D, and Murakami Y. Radiomics-based prediction of recurrence for head and neck cancer patients using data imbalanced correction. Comput Biol Med. (2024) 180:108879. doi: 10.1016/j.compbiomed.2024.108879
40. Zheng Y, Zhou D, Liu H, and Wen M. CT-based radiomics analysis of different machine learning models for differentiating benign and Malignant parotid tumors. Eur Radiol. (2022) 32:6953–64. doi: 10.1007/s00330-022-08830-3
41. Gabryś HS, Buettner F, Sterzing F, Hauswald H, and Bangert M. Design and selection of machine learning methods using radiomics and dosiomics for normal tissue complication probability modeling of xerostomia. Front Oncol. (2018) 8:35. doi: 10.3389/fonc.2018.00035
42. Malhotra R, Singh Saini B, and Gupta S. An interpretable feature-learned model for overall survival classification of High-Grade Gliomas. Phys Med. (2023) 10:102591. doi: 10.1016/j.ejmp.2023.102591
43. Gaur L, Bhandari M, Razdan T, Mallik S, and Zhao Z. Explanation-driven deep learning model for prediction of brain tumour status using MRI image data. Front Genet. (2022) 13:822666. doi: 10.3389/fgene.2022.822666
Keywords: postoperative atrial fibrillation, deep learning radiomics, epicardial adipose tissue, lung lobectomy, lung cancer
Citation: Liu Z, Zheng C, Jia Z, Zhao C, Liu X, Shao W, Chen F, Zhu H and Guo H (2025) Deep learning radiomics model of epicardial adipose tissue for predicting postoperative atrial fibrillation after lung lobectomy in lung cancer patients. Front. Oncol. 15:1623248. doi: 10.3389/fonc.2025.1623248
Received: 19 May 2025; Accepted: 26 September 2025;
Published: 13 October 2025.
Edited by:
Arka Bhowmik, Memorial Sloan Kettering Cancer Center, United StatesReviewed by:
Shigao Huang, Air Force Medical University, ChinaMarc Boubnovski Martell, Imperial College, United Kingdom
Copyright © 2025 Liu, Zheng, Jia, Zhao, Liu, Shao, Chen, Zhu and Guo. This is an open-access article distributed under the terms of the Creative Commons Attribution License (CC BY). The use, distribution or reproduction in other forums is permitted, provided the original author(s) and the copyright owner(s) are credited and that the original publication in this journal is cited, in accordance with accepted academic practice. No use, distribution or reproduction is permitted which does not comply with these terms.
*Correspondence: Hongbo Guo, Z3VvbXV0b25nQDEyNi5jb20=; Hui Zhu, ZHJ6aHVoQDEyNi5jb20=
†These authors have contributed equally to this work