In the published article, there was an error in Figure 2 and Figure 5 as published. Due to an oversight in the preparation process of the image, two different parts of the data in each figure were accidentally overlaid, resulting in overlapping visuals. This led to an inaccurate representation of the experimental results. Also, in Figure 2H, the authors accidentally spliced the experimental results of U87 cells in the miR-29a-5p mimics group into the control inhibitor group (red box). The corrected Figure 2 and its caption appears below.
Figure 2
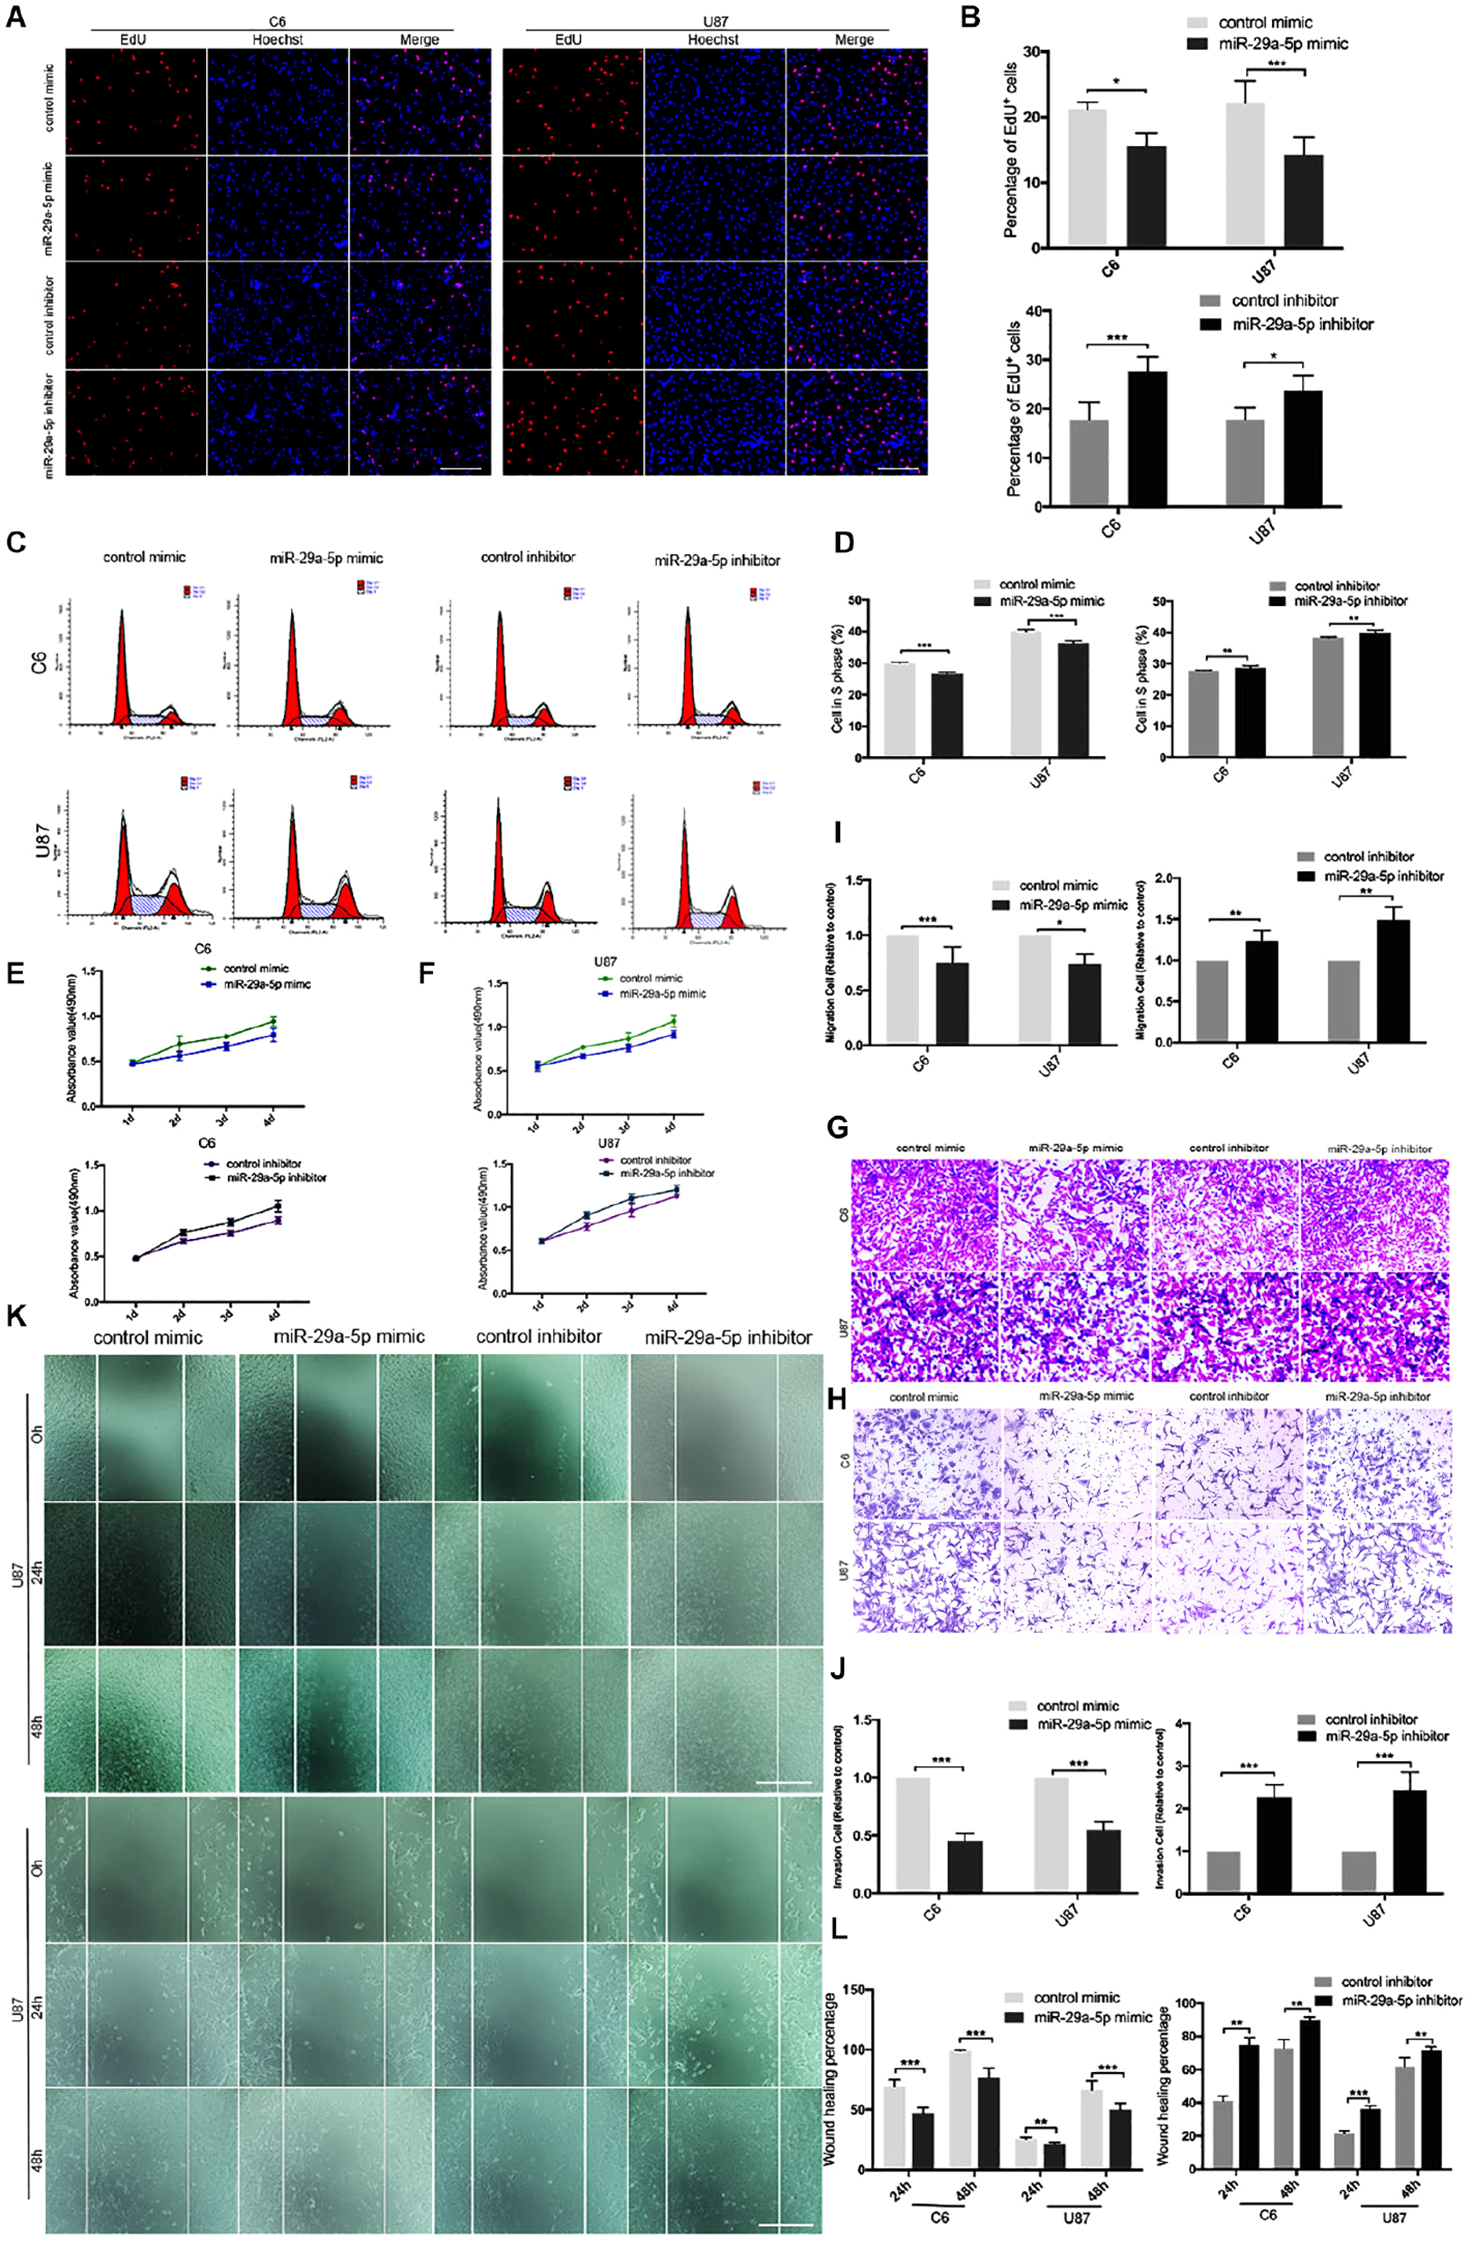
miR-29a-5p overexpression decreases glioma cell proliferation, invasion, and migration. (A, B) Fluorescence micrographs (left panels) and data quantification (right panel) from BrdU proliferation assays used to investigate the effects of miR-29a-5p upregulation and downregulation on BrdU (red) incorporation into nuclei (DAPI, blue) in C6 and U87 cells. Data shown in the right panel are mean ± SEM, *p < 0.05, ***p < 0.001, unpaired t test. Scale, approximately 100 μm. (C, D) Flow cytometry was used to assess the cell cycle distribution of C6 and U87 cells transfected with miR-29a-5p mimics and inhibitor or the control cells for 24 h and stained with PI (left panels). Representative and quantitative results for the S phase are shown (right panel) **p < 0.01, ***p < 0.001. (E, F) Cell proliferation was measured by CCK-8 analysis starting 1 day after transfection with miR-29a-5p mimics and inhibitor or the control cells in C6 and U87 cells every day. (G, I) Transwell assays of the migration in C6 and U87 cells transfected with miR-29a-5p mimics and miR-29a-5p inhibitor or the control cells, Representative and quantitative results for migration are shown. Columns are the averages of three independent experiments, *p < 0.05, **p < 0.01, ***p < 0.001. (H, J) Transwell assays of the invasion in C6 and U87 cells transfected with miR-29a-5p mimics and miR-29a-5p inhibitor or the control cells; invasion of the above cells was quantitatively analyzed. Columns are the averages of three independent experiments, *p < 0.05, **p < 0.01, ***p < 0.001. (K, L) Wound healing assays revealing wound closure with miR-29a-5p mimics and miR-29a-5p inhibitor or the control cells in C6 and U87 cells at 0-, 24-, and 48–h timepoints after transfection. Columns are the averages of three independent experiments, **p < 0.01, ***p < 0.001.
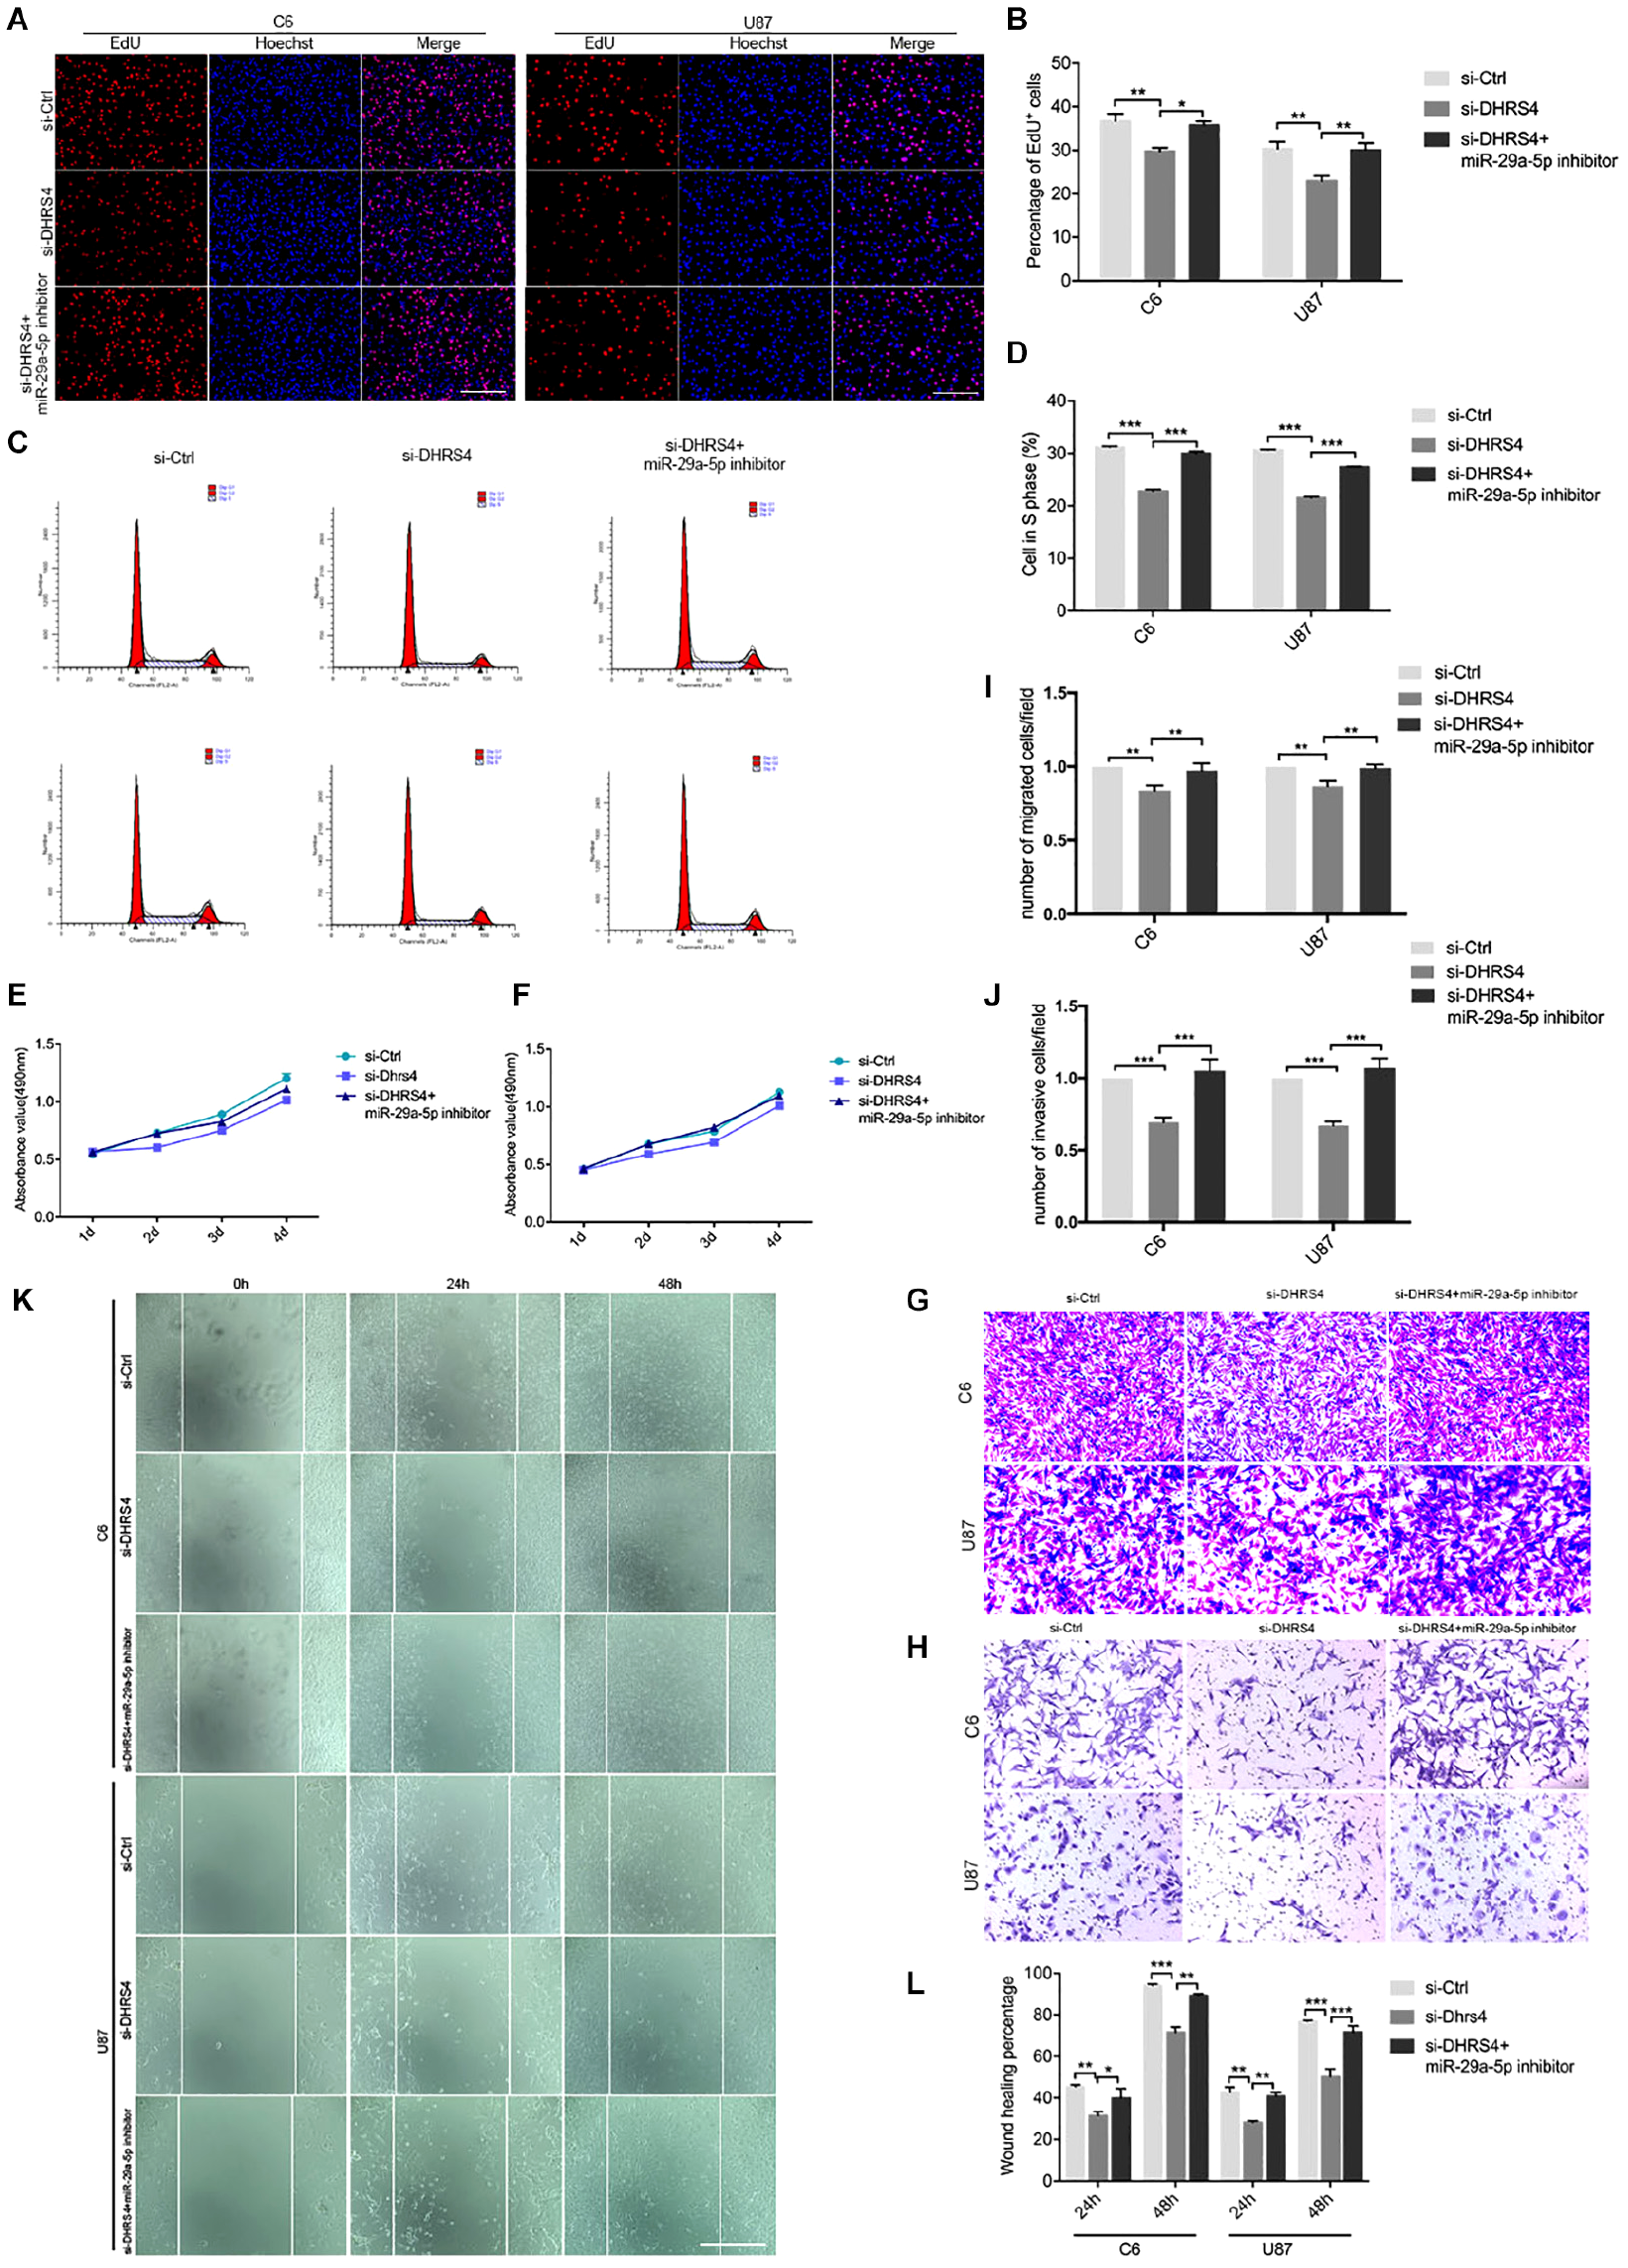
Figure 5
Knockdown of DHRS4 inhibits glioma cell proliferation, invasion, and migration. (A, B) Fluorescence micrographs (left panel) and quantification (right panel) of BrdU proliferation assay data for si-Ctrl, si-DHRS4, or si-DHRS4 plus miR-29-5p in C6 and U87 cells. Data shown in the right panel are mean ± SEM, *p < 0.05, **p < 0.01, unpaired t test. Scale, approximately 100 μm. (C, D) Flow cytometry was used to assess the cell cycle distribution of C6 and U87 cells transfected with si-Ctrl, si-Dhrs4, or si-DHRS4 plus miR-29-5p inhibitor for 24 h and stained with PI (left panels). Representative and quantitative results of S phase are shown (right panel), ***p < 0.001. (E, F) Cell proliferation from the above transfected cells was measured with CCK-8 analysis. (G, I) Transwell assays of the migration in C6 and U87 cells with si-Ctrl, si-DHRS4, or si-DHRS4 plus miR-29-5p inhibitor. Representative and quantitative results for migration are shown. Columns are the averages of three independent experiments, **p < 0.01. (H, J) Transwell assays of the invasion in C6 and U87 cells with si-Ctrl, si-DHRS4, or si-DHRS4 plus miR-29-5p inhibitor. Representative and quantitative results for invasion are shown. Columns are the averages of three independent experiments, ***p < 0.001. (K, L) Wound healing assay results revealed wound closure of C6 and U87 with si-Ctrl, si-DHRS4, or si-DHRS4 plus miR-29-5p inhibitor. Columns are the averages of three independent experiments, *p < 0.05; **p < 0.01, ***p < 0.001.
In the published article, there was an error in Figure 5 as published. Due to an oversight in the preparation process of the image, two different parts of the data in each figure were accidentally overlaid, resulting in overlapping visuals. This led to an inaccurate representation of the experimental results. Also, in Figure 5G, an experimental picture from the si-Ctrl group was mistakenly spliced into the si-DHRS4+miR-29-5p inhibitor group (blue box). The corrected Figure 5 and its caption appears below.
The authors apologize for these errors and state that this does not change the scientific conclusions of the article in any way. The original article has been updated.
Statements
Publisher’s note
All claims expressed in this article are solely those of the authors and do not necessarily represent those of their affiliated organizations, or those of the publisher, the editors and the reviewers. Any product that may be evaluated in this article, or claim that may be made by its manufacturer, is not guaranteed or endorsed by the publisher.
Summary
Keywords
gliomas, miR-29a-5p, DHRS4, proliferation, invasion, migration
Citation
Dai Y, Chen Z, Zhao W, Cai G, Wang Z, Wang X, Hu H and Zhang Y (2025) Correction: miR-29a-5p regulates the proliferation, invasion, and migration of gliomas by targeting DHRS4. Front. Oncol. 15:1643256. doi: 10.3389/fonc.2025.1643256
Received
08 June 2025
Accepted
11 July 2025
Published
24 July 2025
Volume
15 - 2025
Edited and reviewed by
Giorgio Seano, Institut Curie, France
Updates
Copyright
© 2025 Dai, Chen, Zhao, Cai, Wang, Wang, Hu and Zhang.
This is an open-access article distributed under the terms of the Creative Commons Attribution License (CC BY). The use, distribution or reproduction in other forums is permitted, provided the original author(s) and the copyright owner(s) are credited and that the original publication in this journal is cited, in accordance with accepted academic practice. No use, distribution or reproduction is permitted which does not comply with these terms.
*Correspondence: Yi Zhang, zhangyi9285@sina.com
†These authors share first authorship
Disclaimer
All claims expressed in this article are solely those of the authors and do not necessarily represent those of their affiliated organizations, or those of the publisher, the editors and the reviewers. Any product that may be evaluated in this article or claim that may be made by its manufacturer is not guaranteed or endorsed by the publisher.