 Zhendong Shi1,2,3,4*†
 Xiaoxing Bian1,2,3,4†
 Hanyan Zhu1,2,3,4
 Chunyan Li1,2,3,4Jie Meng1,2,3,4Xiaomin Qian5Peng Zhou1,2,3,4
 Jin Zhang1,2,3,4*
- 1The Third Department of Breast Cancer, Tianjin Medical University Cancer Institute and Hospital, National Clinical Research Center for Cancer, Tianjin, China
- 2Key Laboratory of Cancer Prevention and Therapy, Tianjin Medical University Cancer Institute and Hospital, Tianjin, China
- 3Tianjin’s Clinical Research Center for Cancer, Tianjin Medical University Cancer Institute and Hospital, Tianjin, China
- 4Key Laboratory of Breast Cancer Prevention and Therapy, Tianjin Medical University, Ministry of Education, Tianjin, China
- 5Department of Medical Laboratory, School of Medical Technology, Tianjin Medical University, Tianjin, China
Purpose: In this study, we aimed to determine the diagnostic performance of MRI in assessing neoadjuvant therapy (NAT) response, investigate determinants of its accuracy, and develop a nomogram for predicting pathological complete response (pCR) following NAT.
Methods: A retrospective analysis was conducted on 554 female patients who received NAT between January 2019 and December 2022 and underwent MRI scans pre- and post-treatment. Clinicopathological and MRI characteristics were collected. Univariable logistic regression identified predictors of diagnostic accuracy. Patients were then randomly allocated to training (n=388, 70%) and validation (n=166, 30%) cohorts. Using multivariable logistic regression in the training cohort, we identified independent predictors of pCR and constructed a predictive nomogram. Model performance was assessed in both cohorts using receiver operating characteristic (ROC) curves, area under the curve (AUC), and goodness-of-fit tests.
Results: The overall accuracy of breast MRI in evaluating NAT response was 77.44%. Multivariable analysis identified three factors independently associated with reduced MRI accuracy: ER-negative status, absence of ductal carcinoma in situ (DCIS), and coexistence of mass lesions with non-mass enhancement (NME). Independent predictors of pCR included: ER-negative, HER2-positive, without the presence of DCIS, the coexistence of mass lesions and NME on pre-NAT MRI, radiologic complete remission (rCR), smaller tumor size, and increasing/plateau TIC on post-NAT MRI. The predictive nomogram demonstrated robust discrimination, with AUC values of 0.894 (95% CI: 0.857–0.932) in the training cohort and 0.888 (95% CI: 0.841–0.935) in the validation cohort.
Conclusion: Breast MRI accuracy was reduced in ER-negative tumors, those lacking DCIS, and lesions exhibiting coexistent mass and NME. A clinicopathological-MRI integrated nomogram demonstrated robust predictive performance for pCR after NAT completion, potentially aiding in surgical strategy planning.
Introduction
According to the latest global cancer statistics in 2022, breast cancer has become the most common malignant tumor and the leading cause of cancer-related death among women worldwide (1). Neoadjuvant therapy (NAT), which refers to systemic drug treatment before surgery, is increasingly being applied not only to patients with locally advanced disease who are initially inoperable but also to those with early-stage disease. NAT confers several advantages, including enhancing tumor resectability and augmenting the likelihood of breast-conserving surgery. Additionally, NAT response patterns enable personalized adaptation of post-neoadjuvant treatment algorithms (2). Previous research indicated that patients achieved pathological complete response (pCR) after NAT tend to have significantly better long-term outcomes (3). Some patients may even be candidates for de-escalation of treatment (4). However, a subset of patients demonstrates suboptimal response or disease progression during or following NAT, mandating timely treatment strategy adjustment to avoid ineffective therapeutic exposure. Consequently, early and precise assessment of NAT efficacy is critical for implementing individualized precision oncology paradigms.
Although pCR represents the reference standard for post-treatment tumor response assessment, its determination is inherently delayed—requiring completion of neoadjuvant therapy and subsequent surgical resection. Currently, various methods, including physical examination, breast ultrasound (US), mammography (MMG), breast magnetic resonance imaging (MRI), and positron emission tomography-computed tomography (PET-CT), are employed to assess NAT efficacy. However, none of these methods achieve the desired level of accuracy. Among them, breast MRI, particularly dynamic contrast-enhanced MRI (DCE-MRI) and diffusion-weighted MRI (DWI-MRI), demonstrates considerable potential for assessment. DCE-MRI can reflect changes in tumor blood perfusion and vascular permeability, while DWI-MRI provides information on tumor cell structure and membrane integrity, thereby endowing MRI diagnosis with high sensitivity and specificity. Despite reported overall accuracy rates of 76–90% for breast MRI in evaluating neoadjuvant therapy response, persistent diagnostic inaccuracies remain a clinical challenge (5, 6).
Previous studies have explored factors influencing the accuracy of breast MRI in assessing NAT efficacy (7, 8), but these studies were limited by small sample sizes and incomplete inclusion of factors, resulting in restricted conclusions. The present study aims to conduct a comprehensive multifactorial analysis of determinants influencing NAT response and develop a validated prediction model integrating breast MRI features with clinicopathological indicators. The visualized nomogram may provide clinicians with a precision medicine tool for early efficacy assessment and evidence-based therapeutic decision optimization.
Materials and methods
Study population
A total of 554 female patients with breast cancer who received treatment at Tianjin Medical University Cancer Institute and Hospital from January 2019 to December 2022 were ultimately included in this study. All patients had histologically confirmed invasive breast carcinoma via core needle biopsy and received guideline-concordant neoadjuvant therapy followed by definitive surgery. In addition, all patients underwent breast MRI examinations before and after NAT. The exclusion criteria were as follows: (1) incomplete clinicopathological or imaging data; (2) failure to complete NAT and subsequent surgical treatment; (3) bilateral breast cancer; (4) occult breast cancer or accessory breast cancer; (5) partial or complete resection of the primary tumor before NAT; (6) distant metastasis or recurrence at the time of diagnosis; (7) presence of other primary malignant tumors (Figure 1).
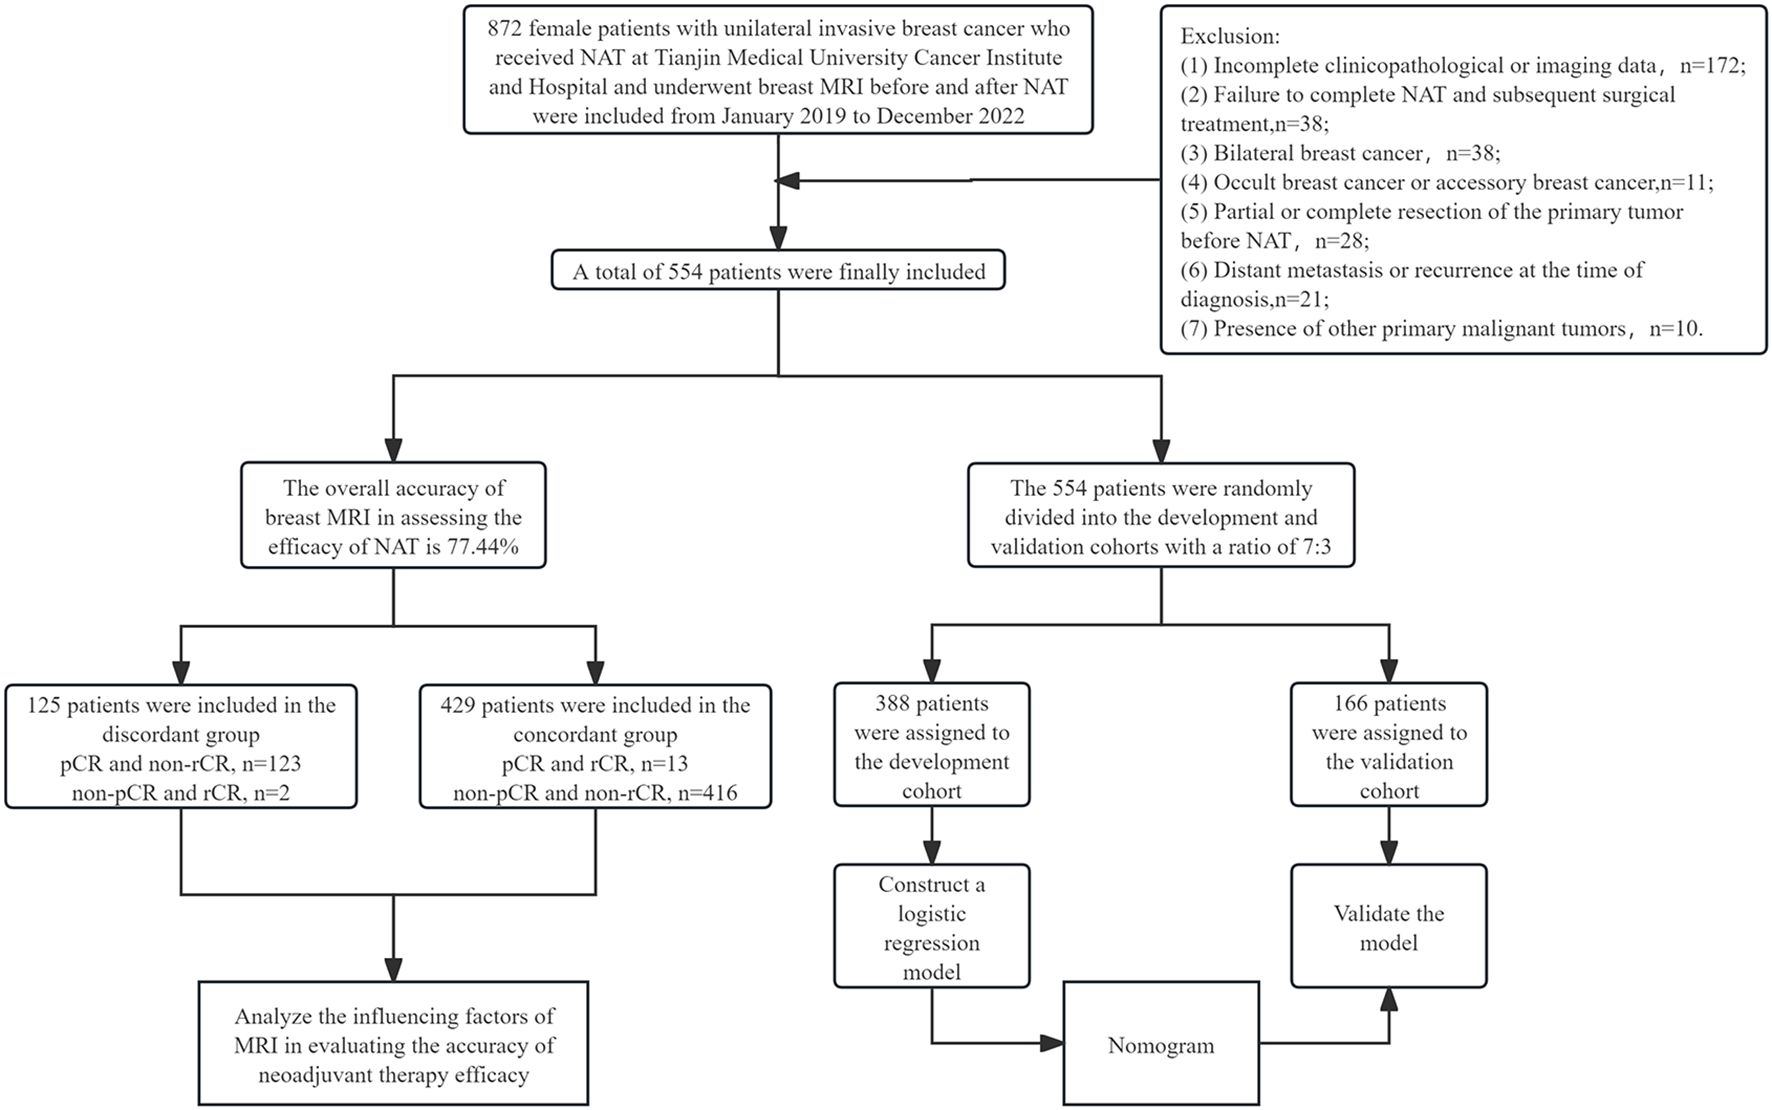
Figure 1. Study flowchart of the patient enrollment.
Clinical characteristics
Clinical data, including age at diagnosis, menopausal status, presence of lymph node metastasis, clinical stage of the tumor, NAT regimen and cycles, and type of breast surgery (mastectomy or breast-conserving surgery), were collected. The clinical stage of the tumor was strictly determined according to the 8th edition of the American Joint Committee on Cancer (AJCC) TNM staging manual for breast cancer. All patients received standard NAT regimen before surgery. Specifically, for patients with human epidermal growth factor receptor 2 (HER2)-positive breast cancer, treatment regimens included trastuzumab monotherapy or dual-target therapy with trastuzumab and pertuzumab. For patients with hormone receptor (HR)-positive or triple-negative breast cancer (TNBC), the majority received neoadjuvant therapy regimens based on anthracycline-based chemotherapy combined with or followed by taxane-based chemotherapy.
Histopathologic analysis
Pathological parameters were evaluated using pretreatment core needle biopsy specimens and definitive surgical resection specimens, including: histological type, presence of DCIS, histological grade, molecular subtype, expression of estrogen receptor (ER), progesterone receptor (PR), HER2, Ki-67, and tumor-infiltrating lymphocytes (TILs). ER/PR expression status: Positive expression was defined when nuclear-stained tumor cells accounted for ≥1% of total tumor cells; otherwise, it was negative1. HER2 expression status: Positive expression was defined as IHC (3+), or IHC (2+) with FISH (+); IHC (2+) with FISH (-), IHC (1+), and IHC (0) were considered negative for HER2 expression. Molecular subtype: Based on the expression of ER, PR, and HER2, breast cancer was categorized into four molecular subtypes: HR+/HER2-, HR+/HER2+, HR-/HER2+, and HR-/HER2- (TNBC). Ki-67 expression was quantified by the percentage of immunoreactive nuclei in invasive carcinoma cells, with high expression defined as ≥20% and low expression as <20% staining. Stromal TIL density was quantified according to the 2014 recommendations of the International Working Group on TILs in Breast Cancer (9), defined as the percentage of tumor stromal area infiltrated by lymphocytes. TIL levels were stratified as low (<10%) or moderate-to-high (≥10%). pCR was defined as the absence of invasive carcinoma in the primary lesion, with or without DCIS allowed, and negative regional lymph nodes (ypT0/is ypN0).
MRI acquisition and evaluations
In the pre-neoadjuvant MRI, the assessment included the amount of fibroglandular tissue (FGT; non-dense, dense), the level of background parenchymal enhancement (BPE; minimal or mild, moderate or marked), the morphological features of each lesion, the type of time-signal intensity curve (TIC; increasing/plateau, washout), the signal intensity on T2-weighted imaging (T2WI), associated features, peritumoral edema, subcutaneous edema, and lymph node status. The morphological features included tumor size (maximum tumor diameter), tumor distribution (single, multifocal, or multicentric), lesion type (mass, non-mass enhancement [NME], mass with NME), distribution of NME, internal enhancement of the mass, as well as the shape and margin of the mass. On pre-NAT MRI, the assessment included: radiologic complete remission (rCR), tumor size and type of TIC. Radiologic complete response (rCR) was defined in strict accordance with RECIST 1.1 criteria: (10) the complete absence of both early and late enhancement, and the short-axis diameter of all pathological lymph nodes (whether target or non-target) must be <10 mm. Because the consequences of undertreatment attributable to undetected residual disease outweigh those of overtreatment, we deliberately adopted a more stringent rCR threshold than has been employed in prior reports. This high specificity definition maximizes the avoidance of false-negative classifications but necessarily lowers MRI sensitivity. Consequently, the observed rCR rate in the present study is expected to be lower than that reported in series using conventional criteria. Finally, by comparing the MRI data before and after neoadjuvant therapy, the indexes of variability were derived, including the tumor size change (Δ tumor size) and TIC type change (Δ TIC), where ΔTIC-negative indicates no change and ΔTIC-positive indicates change. Finally, the time intervals between hollow needle biopsy and MRI examination prior to NAT (days to biopsy), as well as between the last MRI examination after NAT and surgery (days to surgery), were retrospectively collected. Breast MRI examinations before and after NAT were independently interpreted by two radiologists with more than five years of experience in breast imaging diagnosis. In addition, both radiologists were blinded to the pathological results. Discordant cases achieved consensus with re-review of the images and discussion.
Statistical analysis
To evaluate the diagnostic performance of MRI for pCR, rCR was classified as “negative” and non-rCR as “positive.” On this basis, sensitivity, specificity, accuracy, positive predictive value (PPV), and negative predictive value (NPV) were calculated, each with 95% confidence intervals (CIs). The reference definitions were as follows: true negative (TN), MRI indicated rCR and pathology confirmed pCR; true positive (TP), MRI indicated non-rCR and pathology showed non-pCR; false negative (FN), MRI indicated rCR but pathology showed non-pCR; false positive (FP), MRI indicated non-rCR but pathology showed pCR. Patients with FP or FN results were assigned to the imaging–pathology discordant group, whereas those with TP or TN were assigned to the concordant group.
For continuous variables, the Shapiro-Wilk (SW) normality test was first performed. Data meeting the criteria for normal distribution were expressed as mean ± standard deviation (x ± s), and independent samples t-tests or analysis of variance (ANOVA) were used for between-group comparisons; data not following a normal distribution were expressed as the median and interquartile range [M (Q1, Q3)], and the Wilcoxon rank-sum (Mann–Whitney U) tests were used for intergroup comparisons. For categorical data, rates or proportions (%) were used, and Pearson’s chi-square test or Fisher’s exact test was employed for intergroup comparisons. Based on the results of intergroup comparisons, potential influencing factors were preliminarily identified. Further univariate and multivariate logistic regression analyses were conducted to determine independent factors influencing the accuracy of MRI assessment of NAT efficacy. Variables with p<0.05 in univariate logistic regression analysis are included in further multivariate analysis.
Patients were randomly allocated to training (70%) and validation (30%) cohorts. Baseline characteristics were compared to ensure cohort balance. Within the training set, multivariable logistic regression identified independent predictors of pCR using surgical pathology as the reference standard. Bootstrap resampling (1000 iterations) was performed to assess the stability of predictors. Variables with confidence intervals excluding zero and sign consistency >90% across bootstrap samples were considered stable. A predictive nomogram was developed and validated for NAT response assessment. The model’s performance was evaluated using the following metrics: discriminative ability by the area under the receiver operating characteristic curve (AUC), calibration by calibration curves, goodness-of-fit by the Brier score, as well as clinical utility by decision curve analysis.
Cohen’s Kappa coefficient was used to assess the agreement of the interpretations of the two radiologists. Interpretation criteria of agreement were as follows: 0.00– 0.20, poor; 0.21–0.40, fair; 0.41–0.60, moderate; 0.61–0.80, substantial; and 0.81–1.00, almost perfect.
All tests with p<0.05 were considered statistically significant. Statistical analyses were conducted using SPSS for Windows (version 25.0; SPSS, Inc, Chicago, IL, USA) and R software (version 4.4.3).
Results
Clinical and pathological characteristics
A total of 554 patients were enrolled in this study, and the median age at diagnosis was 48 years (interquartile range: 40–57 years). The initial clinical stage was mainly stage I/II (n=354, 63.9%). The molecular subtype distribution: HR+/HER2- 44.9% (n=249), HR-/HER2 + 19.9% (n=110), HR+/HER2 + 19.1% (n=106), and TNBC 16.1% (n=89). All patients received 4–8 cycles NAT. The median interval between the last MRI examination and surgery was 9 days (IQR 3–13 days). Regarding the choice of breast surgery, 86.8% (n=481) underwent mastectomy and 13.2% (n=73) underwent breast-conserving surgery.
Diagnostic accuracy assessment
Pathological results of post-NAT surgical specimens showed that 136 patients (24.5%) achieved pCR; among 418 (75.5%) non-pCR patients, the median size of paraffin pathological residual tumors was 1.6 cm (interquartile spacing: 0.0-2.5 cm), and 15 breasts had no invasive carcinoma residue but axillary lymph node metastases were present. Post-NAT MRI evaluation showed that only 15 cases (2.7%) achieved rCR; among the 539 non-rCR patients, 301 (55.8%) had mass enhancement, 146 (27.1%) had NME, and 92 (17.1%) had the coexistence of mass lesions and NME. The overall accuracy of breast MRI in assessing the efficacy of NAT was 77.44%. Of the 429 (77.4%) pathologies assessed accurately, pCR and rCR accounted for 3.0% (13 cases) and non-pCR and non-rCR accounted for 97.0% (416 cases); and of the 125 (22.6%) cases assessed inaccurately, non-pCR but rCR accounted for 1.6% (2 cases) and pCR but non-rCR accounted for 98.4% (123 cases), as detailed in Table 1.The performance of MRI in diagnosing pCR is as follows: sensitivity 99.5% (95% CI 98.2–99.9%, Wilson method), specificity 9.6% (95% CI 5.6–15.6%, Clopper-Pearson method), PPV 77.2% (95% CI 73.5–80.5%, Wilson method), NPV 86.7% (95% CI 61.1–96.0%, Wilson method).
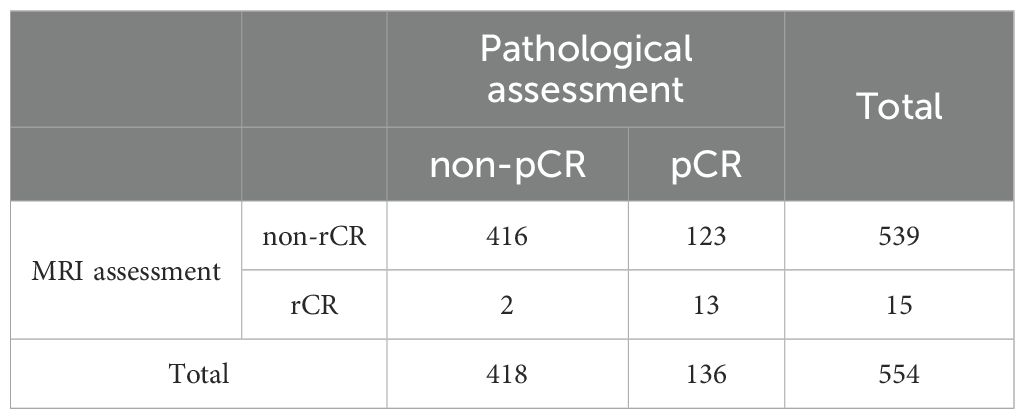
Table 1. Analysis of agreement between MRI and pathological assessment.
Analysis of influencing factors of MRI in evaluating the accuracy of NAT efficacy
Clinicopathological characteristic analysis showed significant differences between the imaging-pathology consistent group and discordance group in neoadjuvant regimen, neoadjuvant treatment cycles, histological grade, expressions of ER, PR, HER2, Ki-67 (p = 0.003), and TILs (p = 0.043), as well as presence of DCIS (p<0.001, Table 2). In the analysis of MRI characteristics, the two groups differed significantly in BPE (p = 0.005) and lesion type (p = 0.013) (Table 3), with no statistical significance found in the remaining indexes (p >0.05).
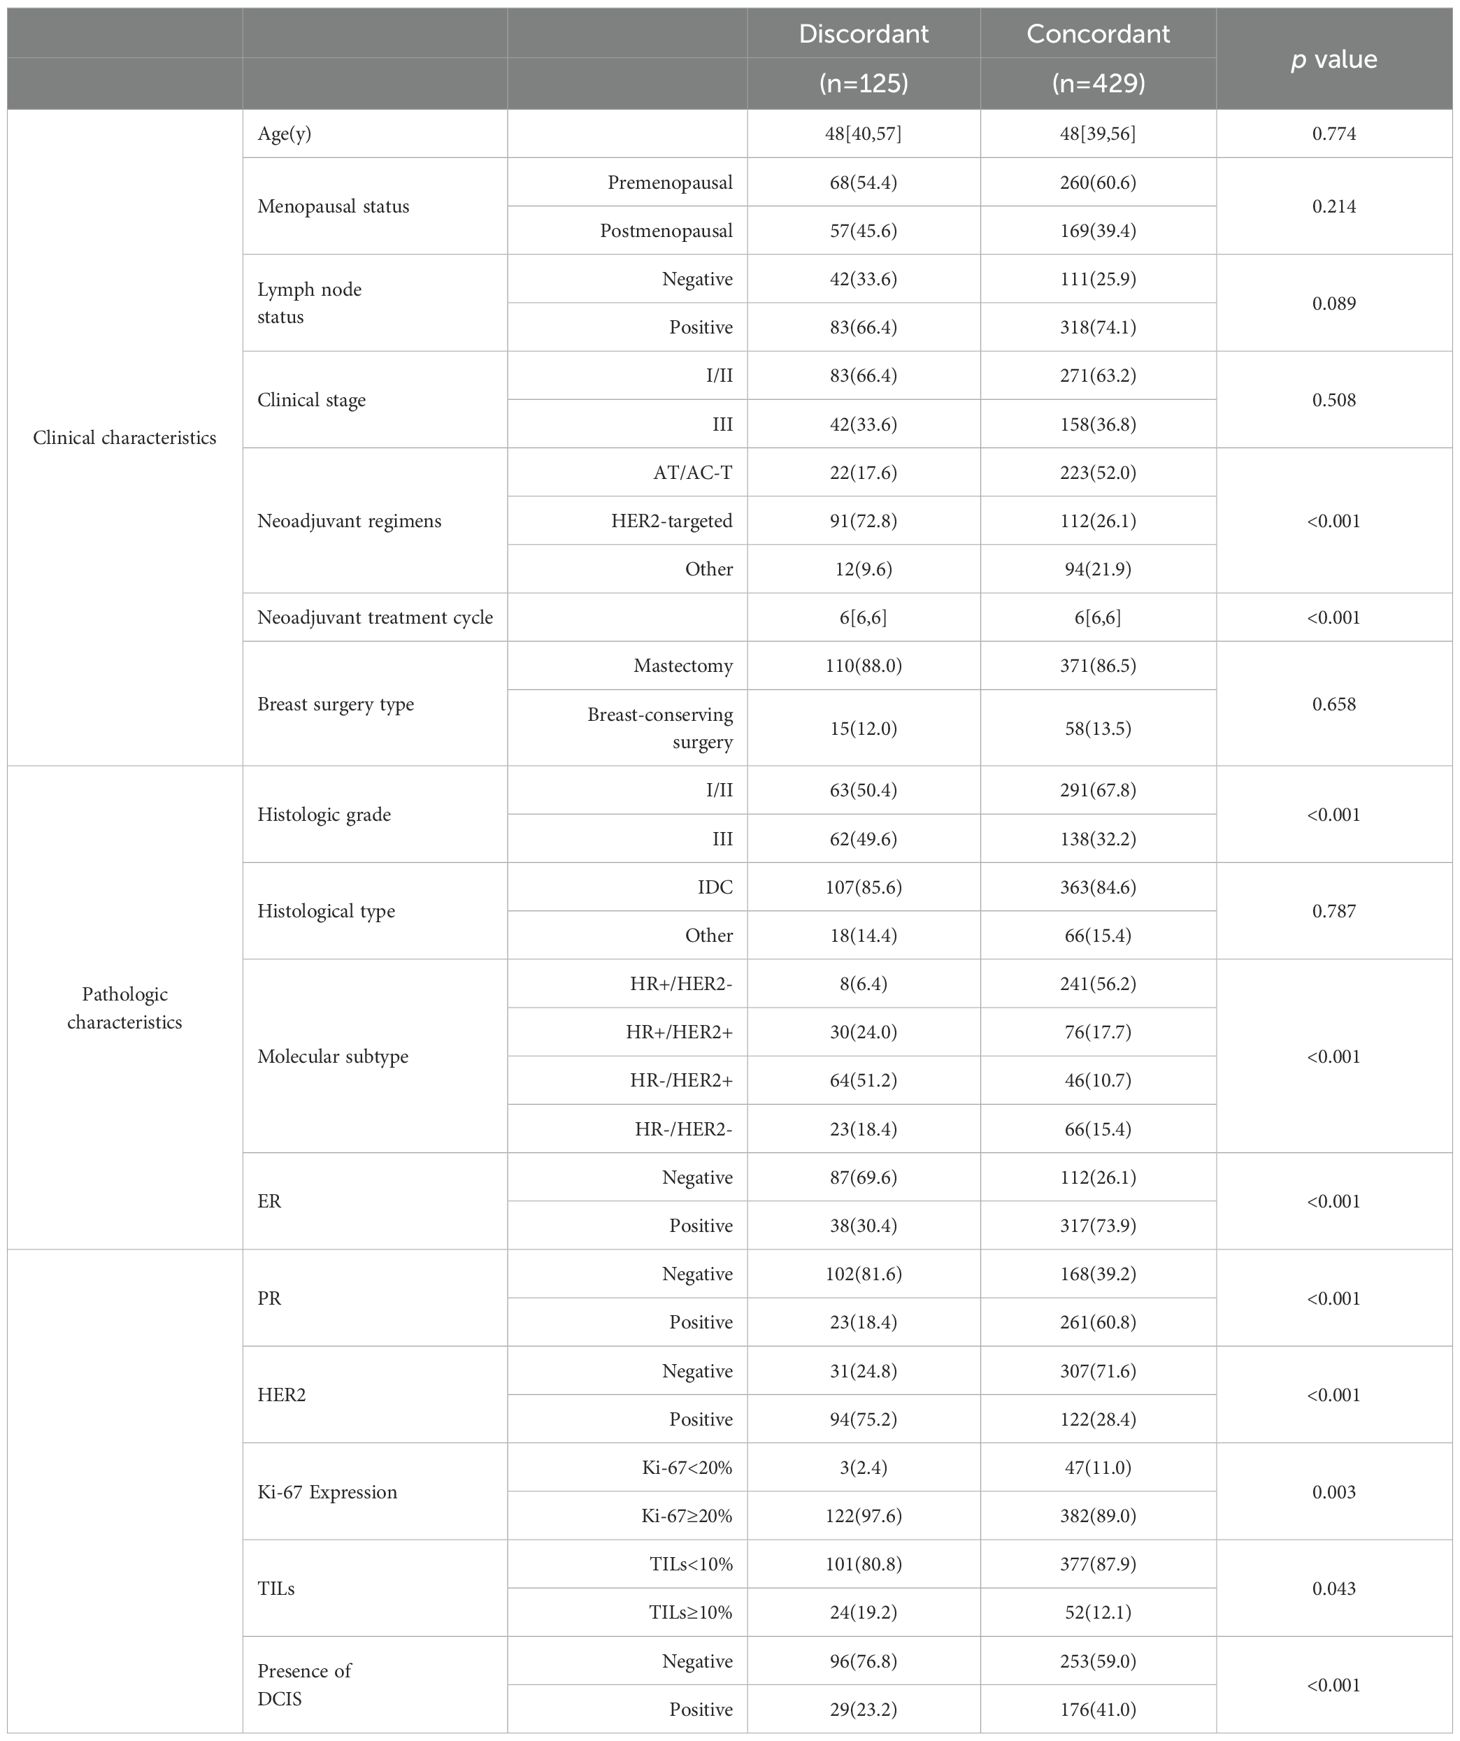
Table 2. Comparison of clinicopathological characteristics between concordant and discordant groups.
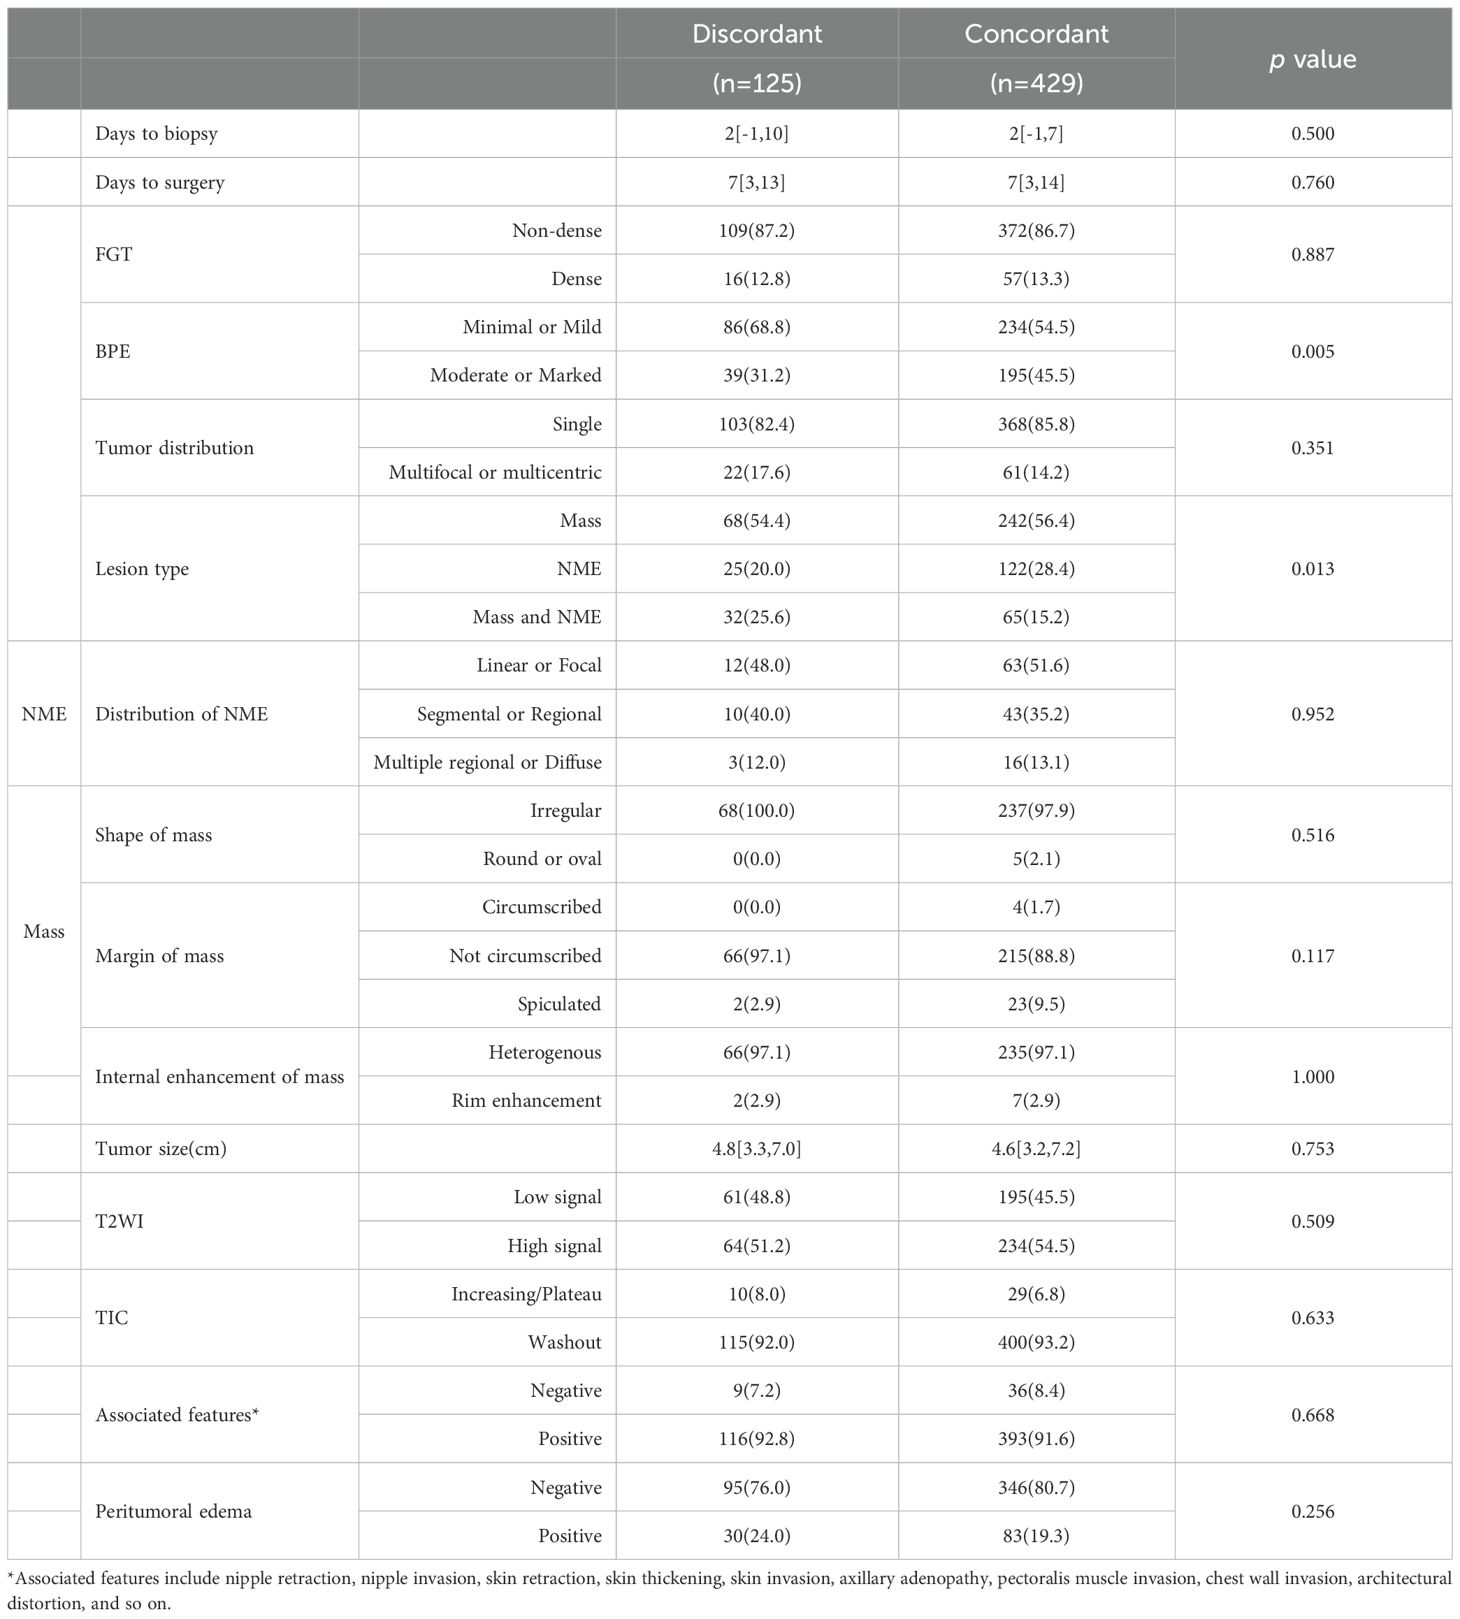
Table 3. Comparison of MRI characteristics between concordant and discordant groups.
Univariate logistic regression analysis showed that neoadjuvant regimen, neoadjuvant treatment cycles, histologic grade, expressions of ER, PR, HER2, Ki-67 and TILs, presence of DCIS, BPE, and lesion type were all significantly correlated with the accuracy of the NAT efficacy as assessed by MRI (p<0.05). Multivariate logistic regression analysis further revealed that ER-negative (OR = 0.300, 95% CI: 0.152-0.592, p = 0.001), absence of DCIS (OR = 0.522, 95% CI: 0.301-0.905, p = 0.021), and the coexistence of mass lesions and NME (OR = 0.469, 95% CI: 0.226-0.974, p = 0.042) were independent influential factors of inaccurate MRI assessment of NAT efficacy (Table 4).
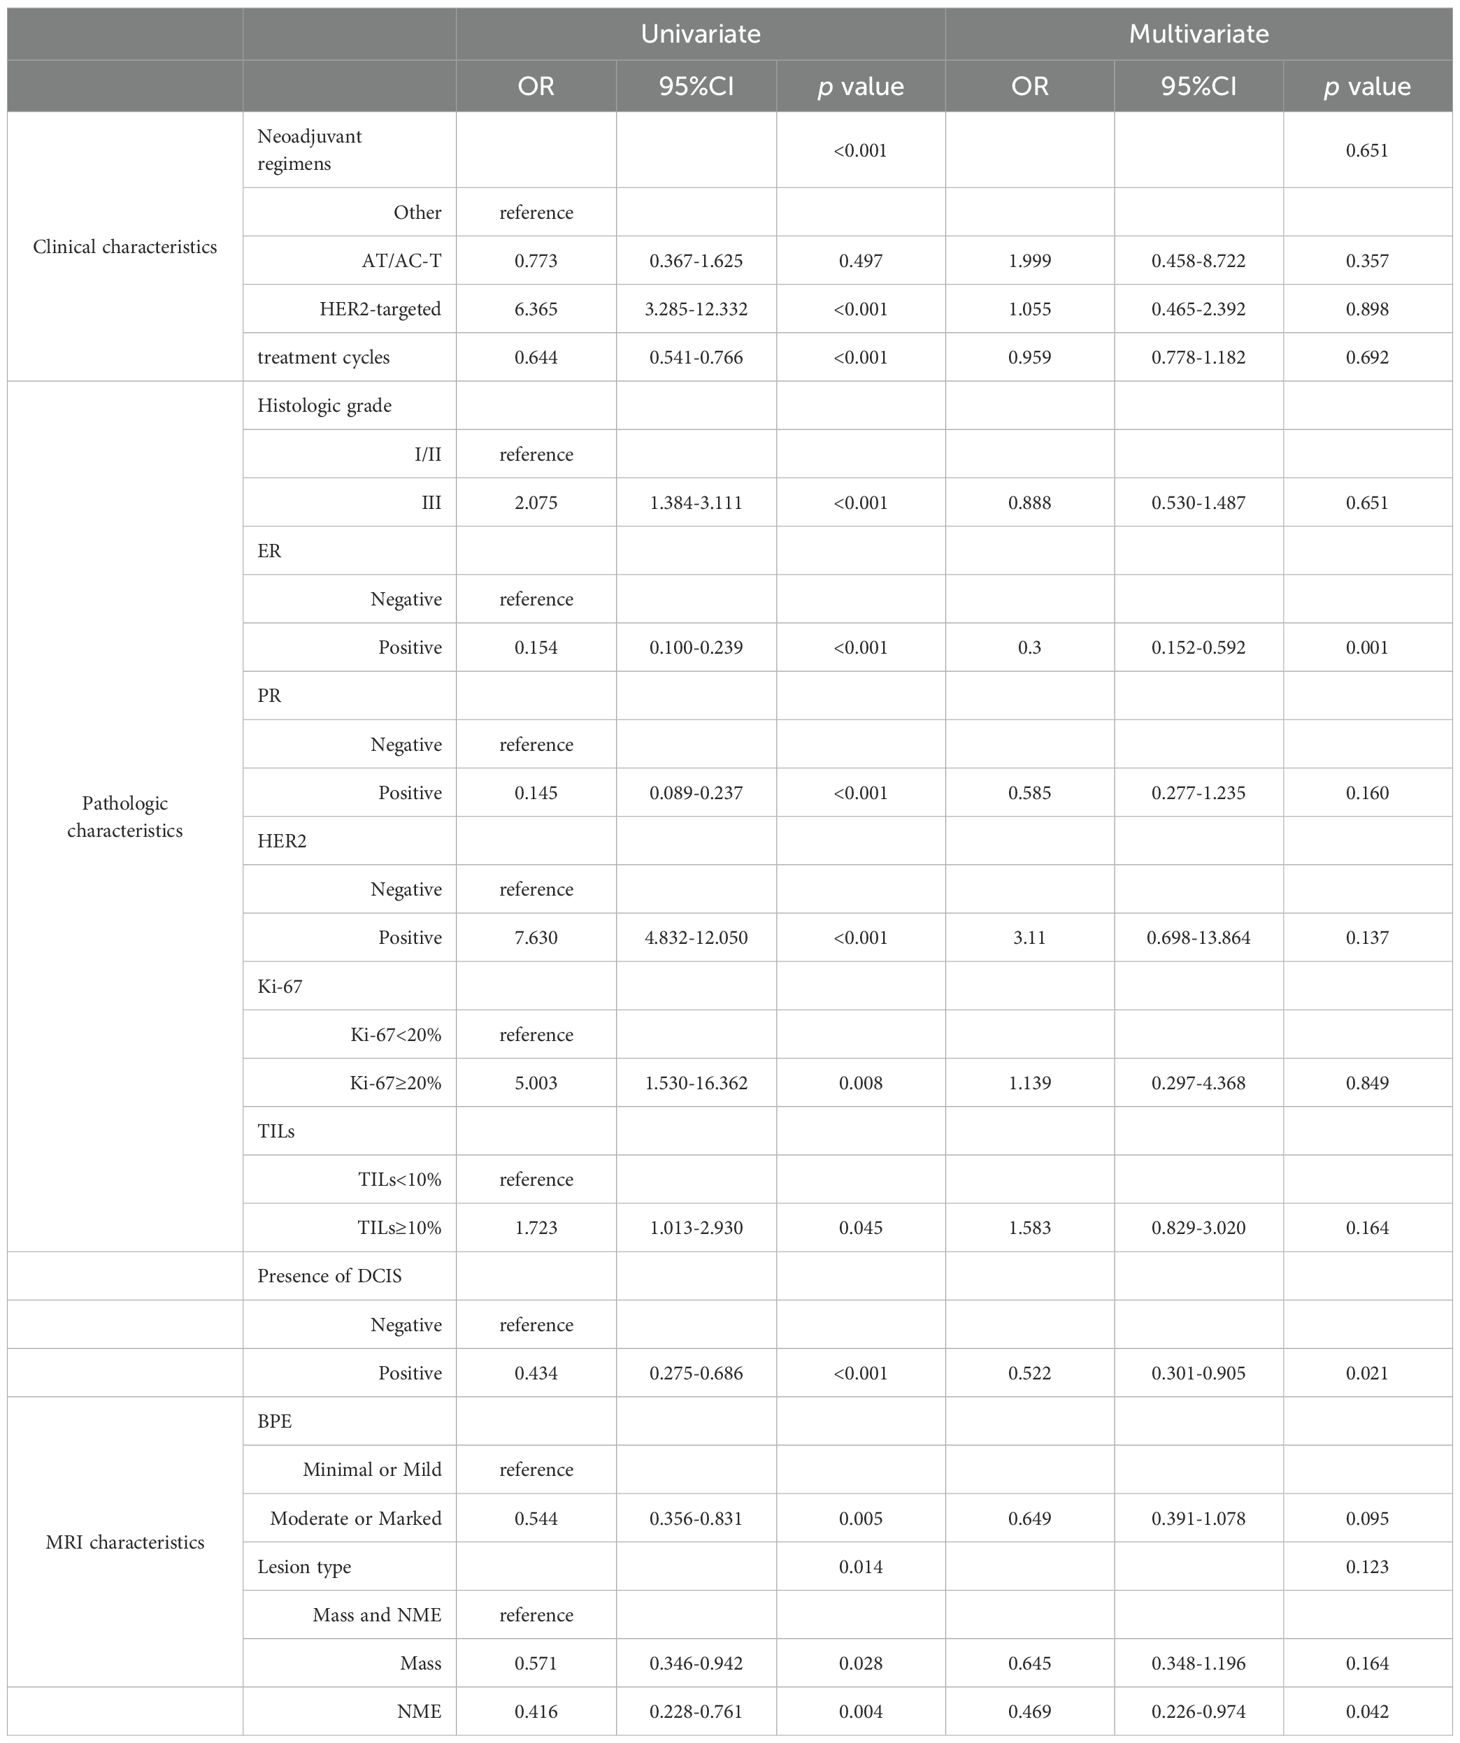
Table 4. Univariate and multivariate analysis for factors associated with discordance between MRI and pathological assessment.
Comparison of baseline characteristics between the training cohort and validation cohort
In this study, 388 patients were included in the training cohort and 166 in the validation cohort, and a comparison of the baseline characteristics was shown in Table 5. The statistics showed that there were significant differences between the training and validation cohorts in terms of the T2WI signal intensity (p = 0.036, φ=0.089), the type of TIC (p = 0.003, φ=0.128), and peritumor edema (p = 0.005, φ=0.119) on pre-NAT breast MRI, while the rest of the characteristics were not statistically significant (p>0.05). After correction by the Bonferroni method (α=0.05/33≈0.0015), these differences were no longer significant. All standardized effect sizes were below 0.3, indicating negligible clinical differences. The baseline characteristics demonstrated satisfactory comparability between cohorts.
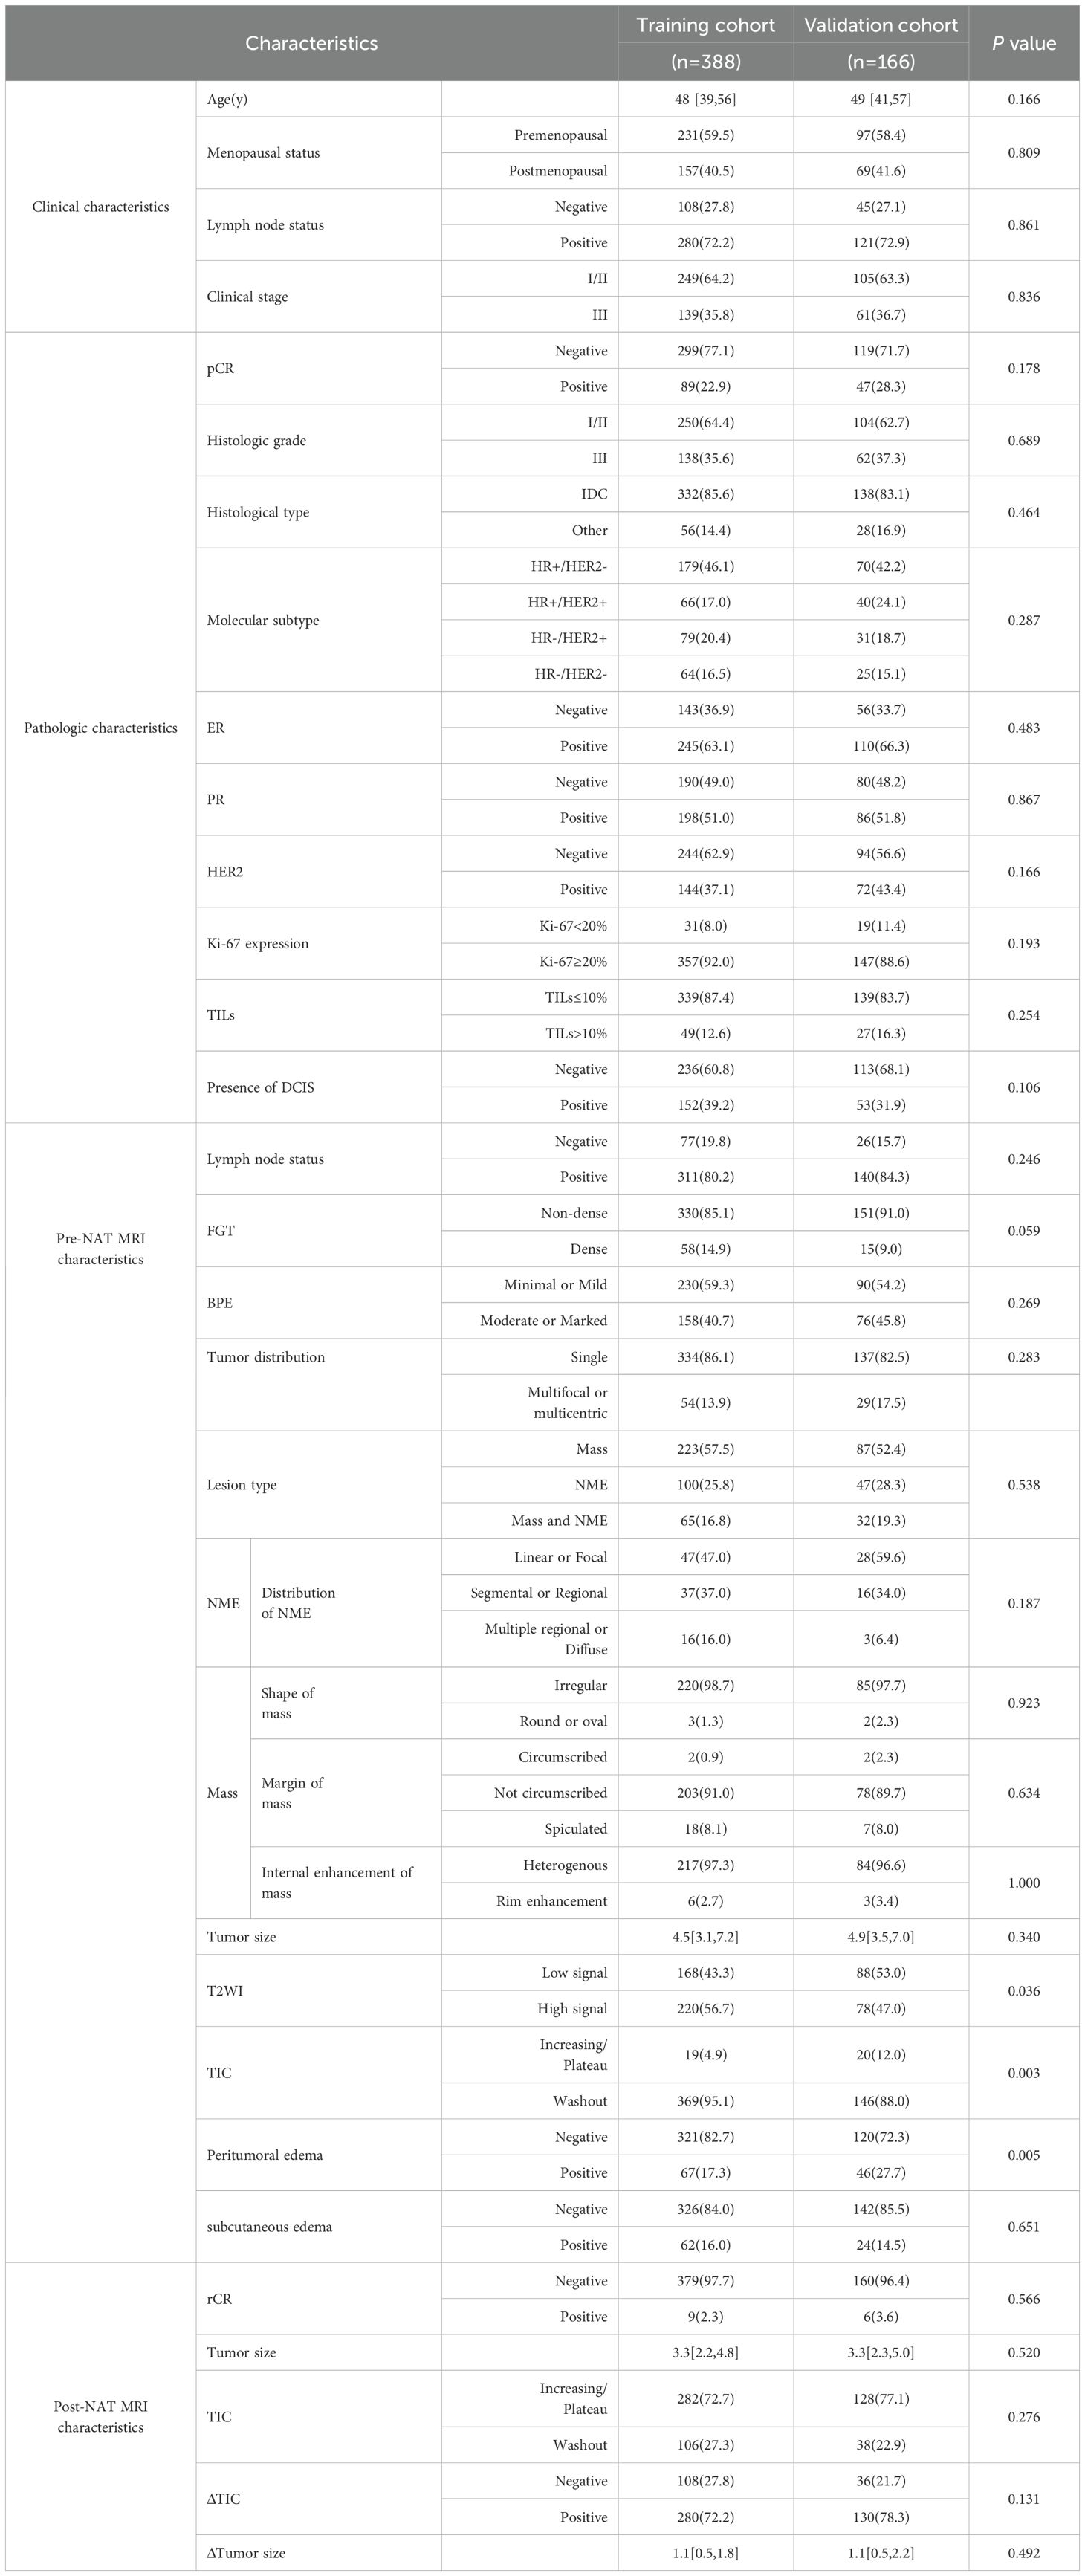
Table 5. Comparison of baseline characteristics between the training and validation cohorts.
Analysis of influencing factors of the efficacy of neoadjuvant therapy
Univariable regression analysis (Table 6) identified several factors associated with pCR (p < 0.05), including lymph node status, histologic grade, expression of ER, PR, HER2, Ki-67, and TILs, presence of DCIS, BPE, lesion type, and peritumoral edema on pre-NAT breast MRI, rCR, tumor size, TIC on post-NAT breast MRI, as well as ΔTumor size and ΔTIC.
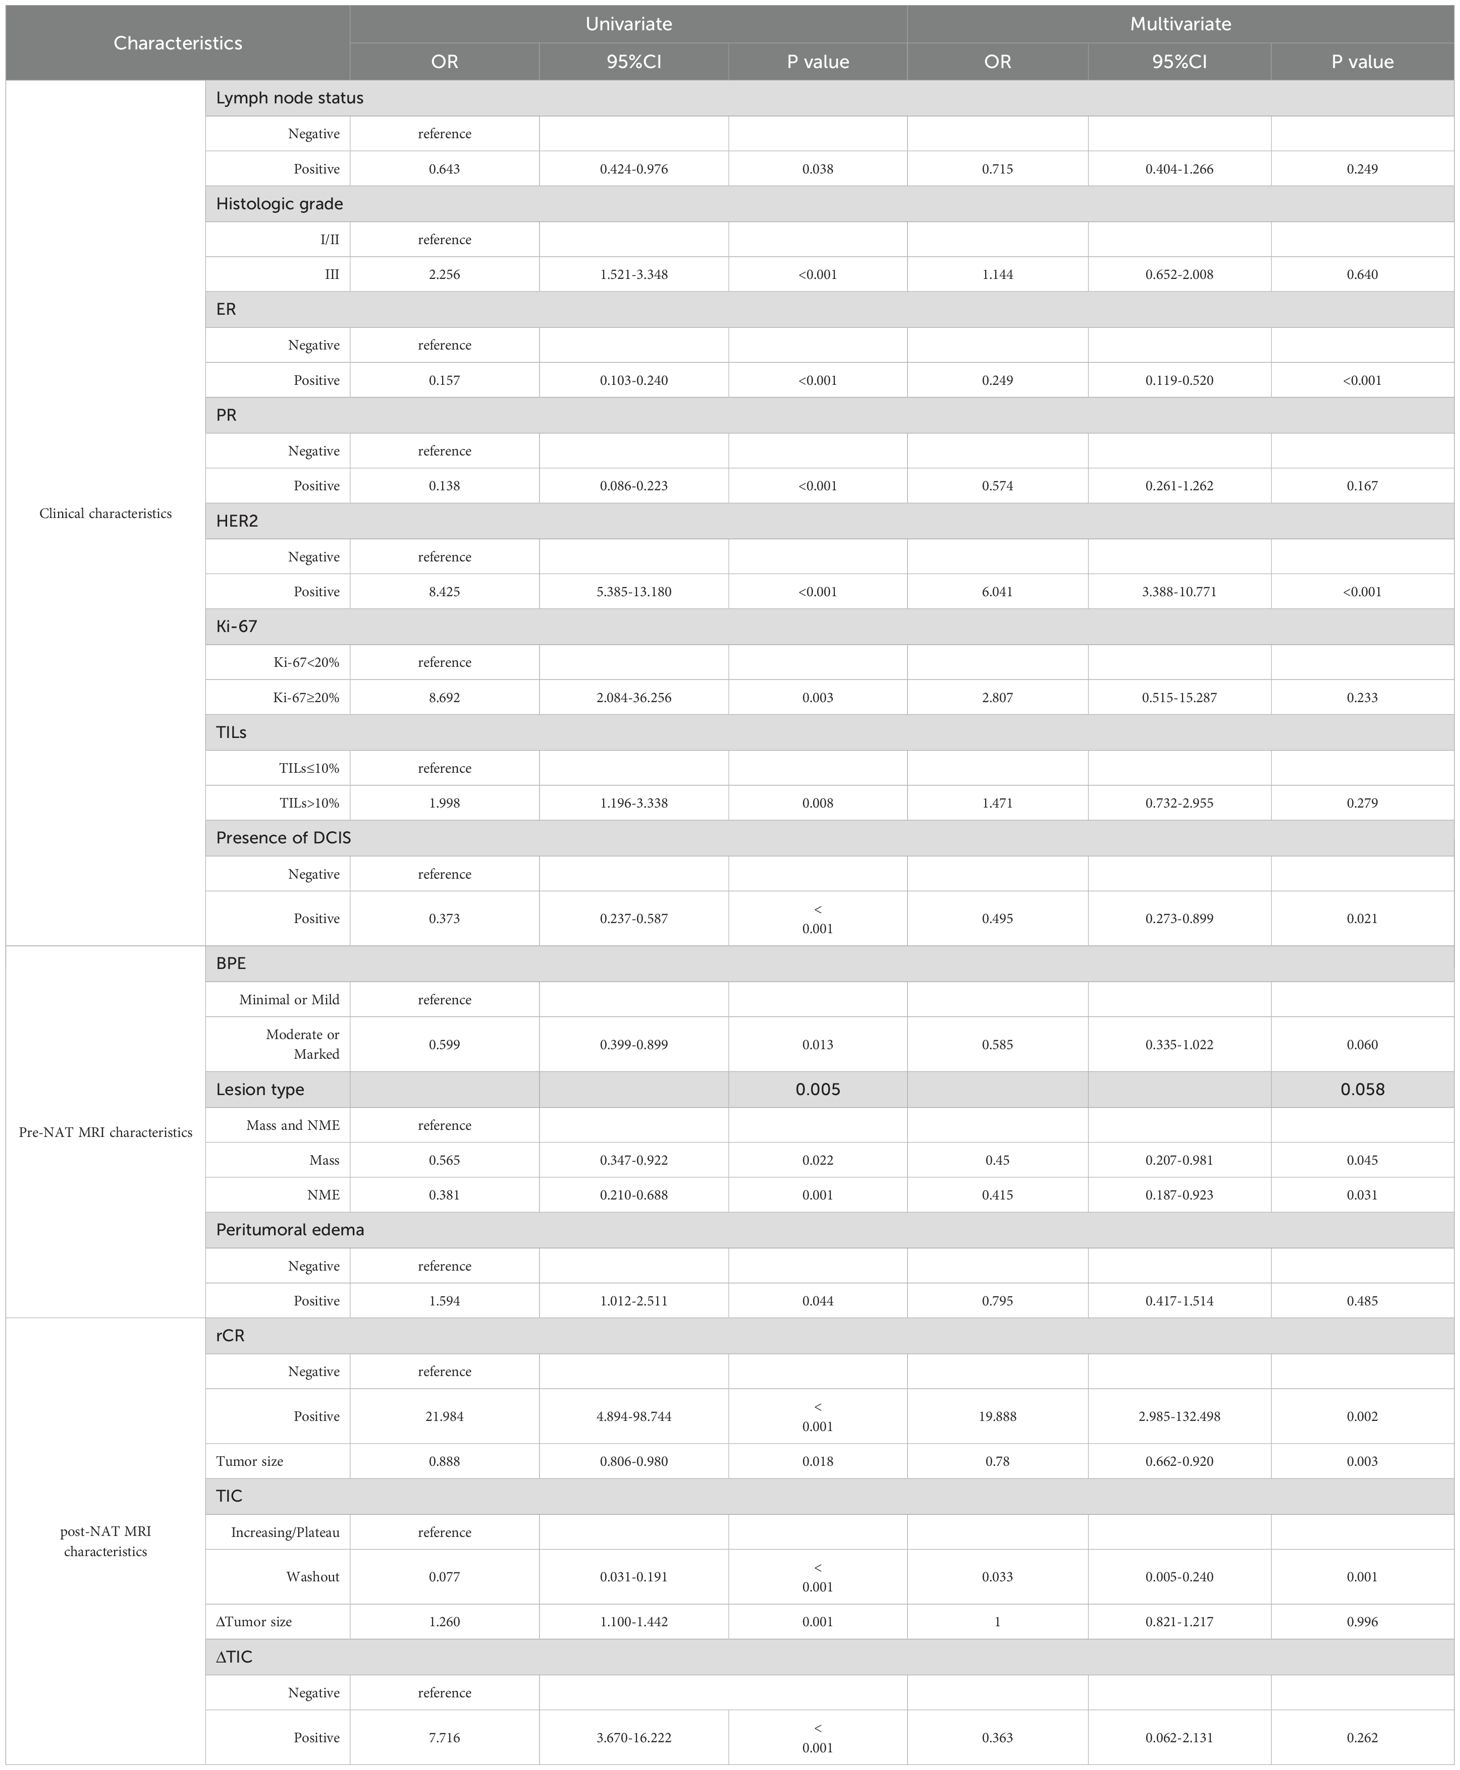
Table 6. Univariate and multivariate analyses of factors associated with pCR.
Multivariable logistic regression analysis revealed that ER-negative status (OR, 0.249 [95% CI: 0.119–0.520]; p<0.001), HER2-positive status (OR, 6.041 [95% CI: 3.388–10.771]; p<0.001), absence of DCIS (OR, 0.495 [95% CI: 0.273–0.899]; p = 0.021), rCR (OR, 19.888 [95% CI: 2.985–132.498]; p = 0.002), smaller tumor size (OR, 0.780 [95% CI: 0.662–0.920]; p = 0.003), and increasing/plateau TIC (OR, 0.033 [95% CI: 0.005–0.240]; p = 0.001) were associated with a higher pCR rate. On pre-NAT MRI, mass lesions (OR = 0.45) and NME (OR = 0.415) were associated with a lower pCR rate compared to Mass and NME mixed lesions.
Meanwhile, we performed an additional 1,000 bootstrap resampling iterations in the training set to evaluate variable stability. As a result, the 95% confidence interval for the coefficient of the lesion type variable included zero, and this variable exhibited low sign consistency (Mass type: 50.2%; NME type: 89.6%; Supplementary Table 7). Consequently, the lesion type variable was excluded from the final model. The final multivariable model incorporated six robust predictor variables (Supplementary Table 8). Subsequent internal validation via bootstrap resampling confirmed excellent stability for all included variables, with 95% confidence intervals excluding zero and sign consistency exceeding 99% for every predictor.
Development and validation of the nomogram
Based on the univariate and multivariate Logistic regression analyses of the development cohort, a nomogram model for predicting pCR was further constructed (Figure 2). The nomogram demonstrated good discrimination ability in both the training cohort (AUC = 0.894, 95% CI: 0.857–0.932) (Figure 3A) and the validation cohort (AUC = 0.888, 95% CI: 0.841–0.935) (Figure 3B). Model calibration was deemed acceptable. In the training cohort, the calibration curve fitted well with the ideal calibration line (Figure 4A), and in the validation cohort, the calibration curve still generally clustered around the ideal calibration line (Figure 4B). The Brier scores for the training and validation cohorts were 0.102 and 0.131, respectively. Finally, the clinical decision curve showed (Figures 5A, B) that the net benefit of the model was better than that of the all-pCR/all-non-pCR diagnostic strategy at most thresholds, and it has clinical application value.
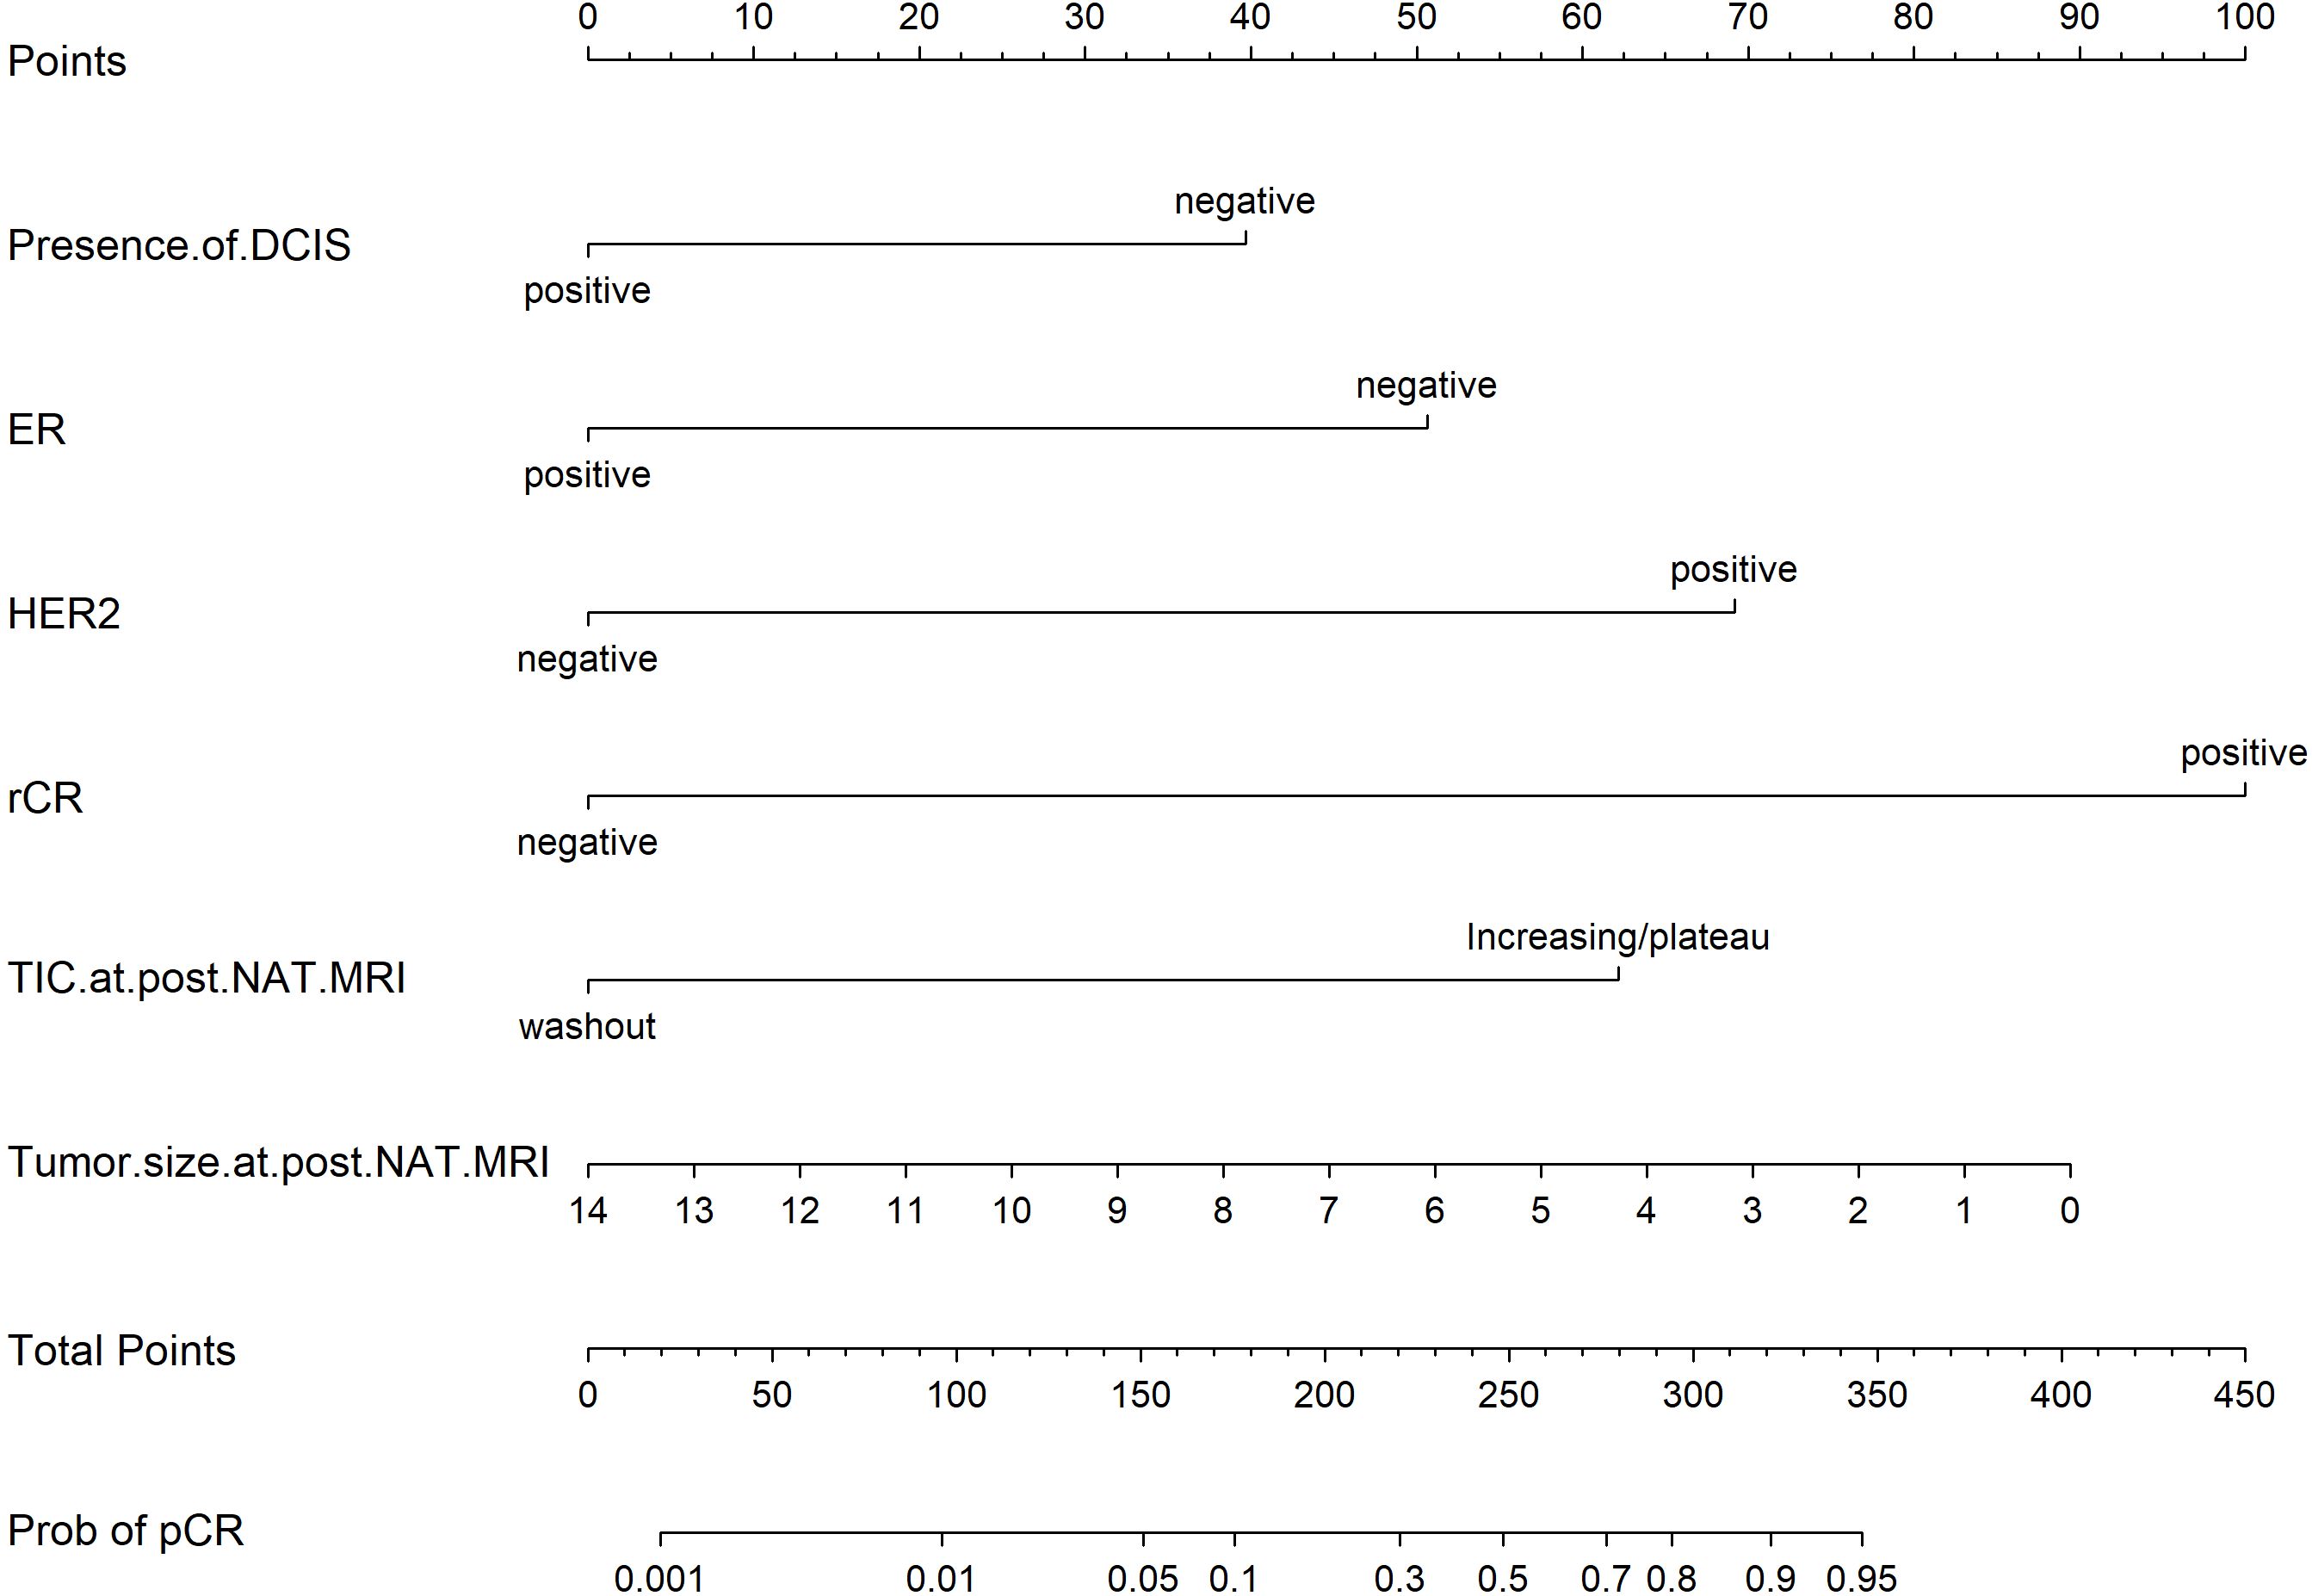
Figure 2. Predictive nomogram for pCR probability.
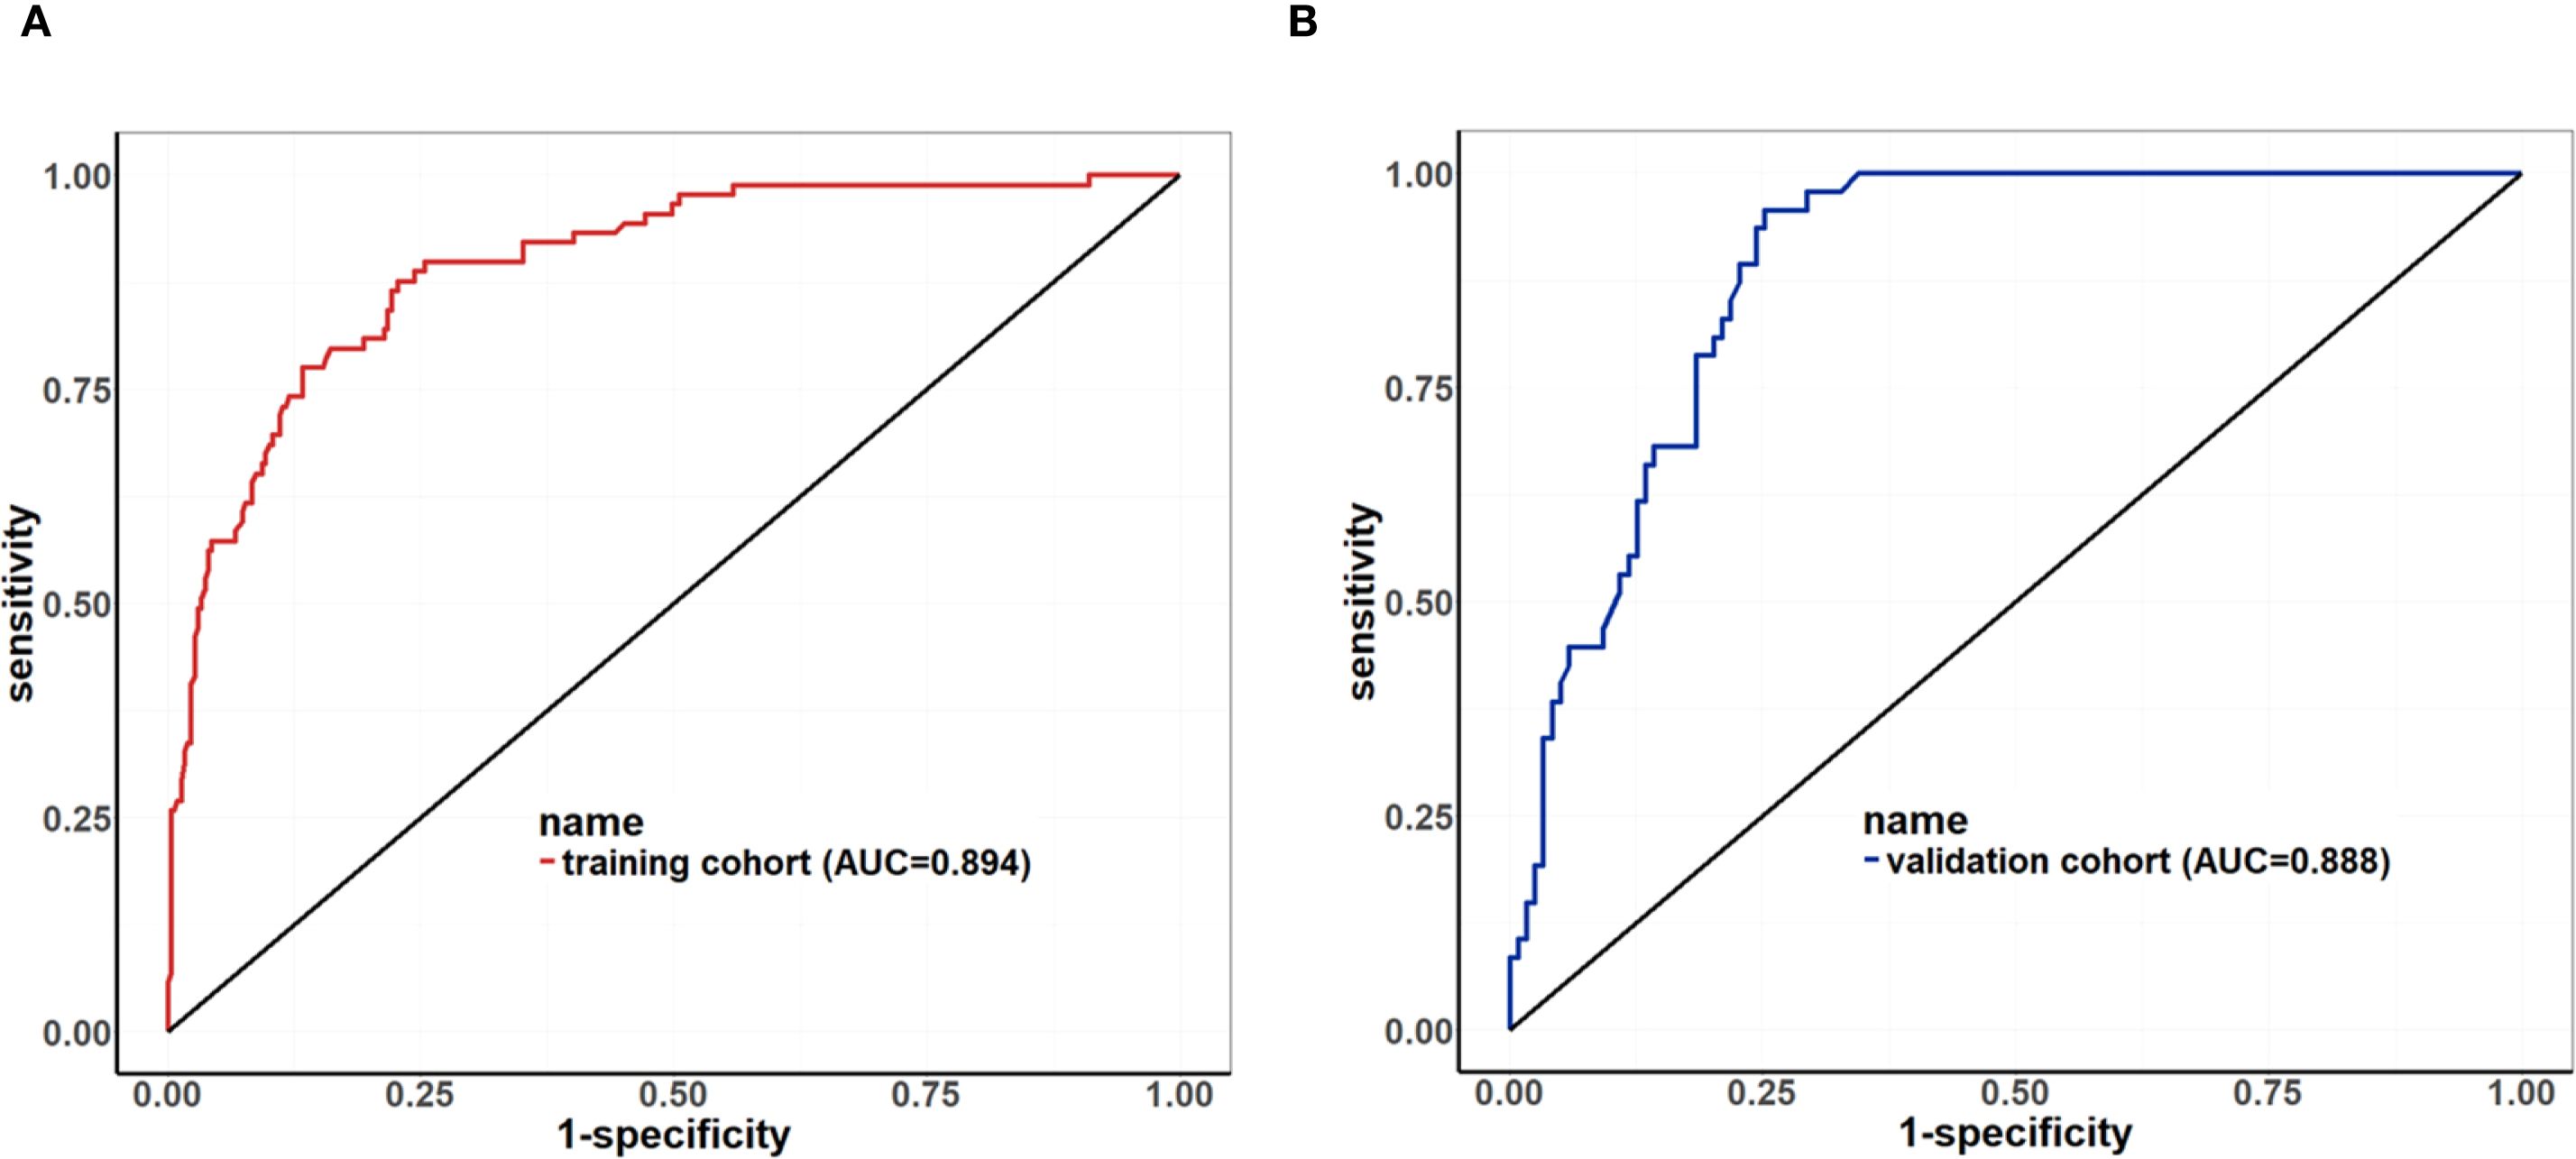
Figure 3. ROC Curve of the nomogram for predicting pCR. (A) ROC of the training cohort (AUC = 0.894, 95% CI: 0.857–0.932); (B) ROC of the validation cohort (AUC = 0.888, 95% CI: 0.841–0.935).
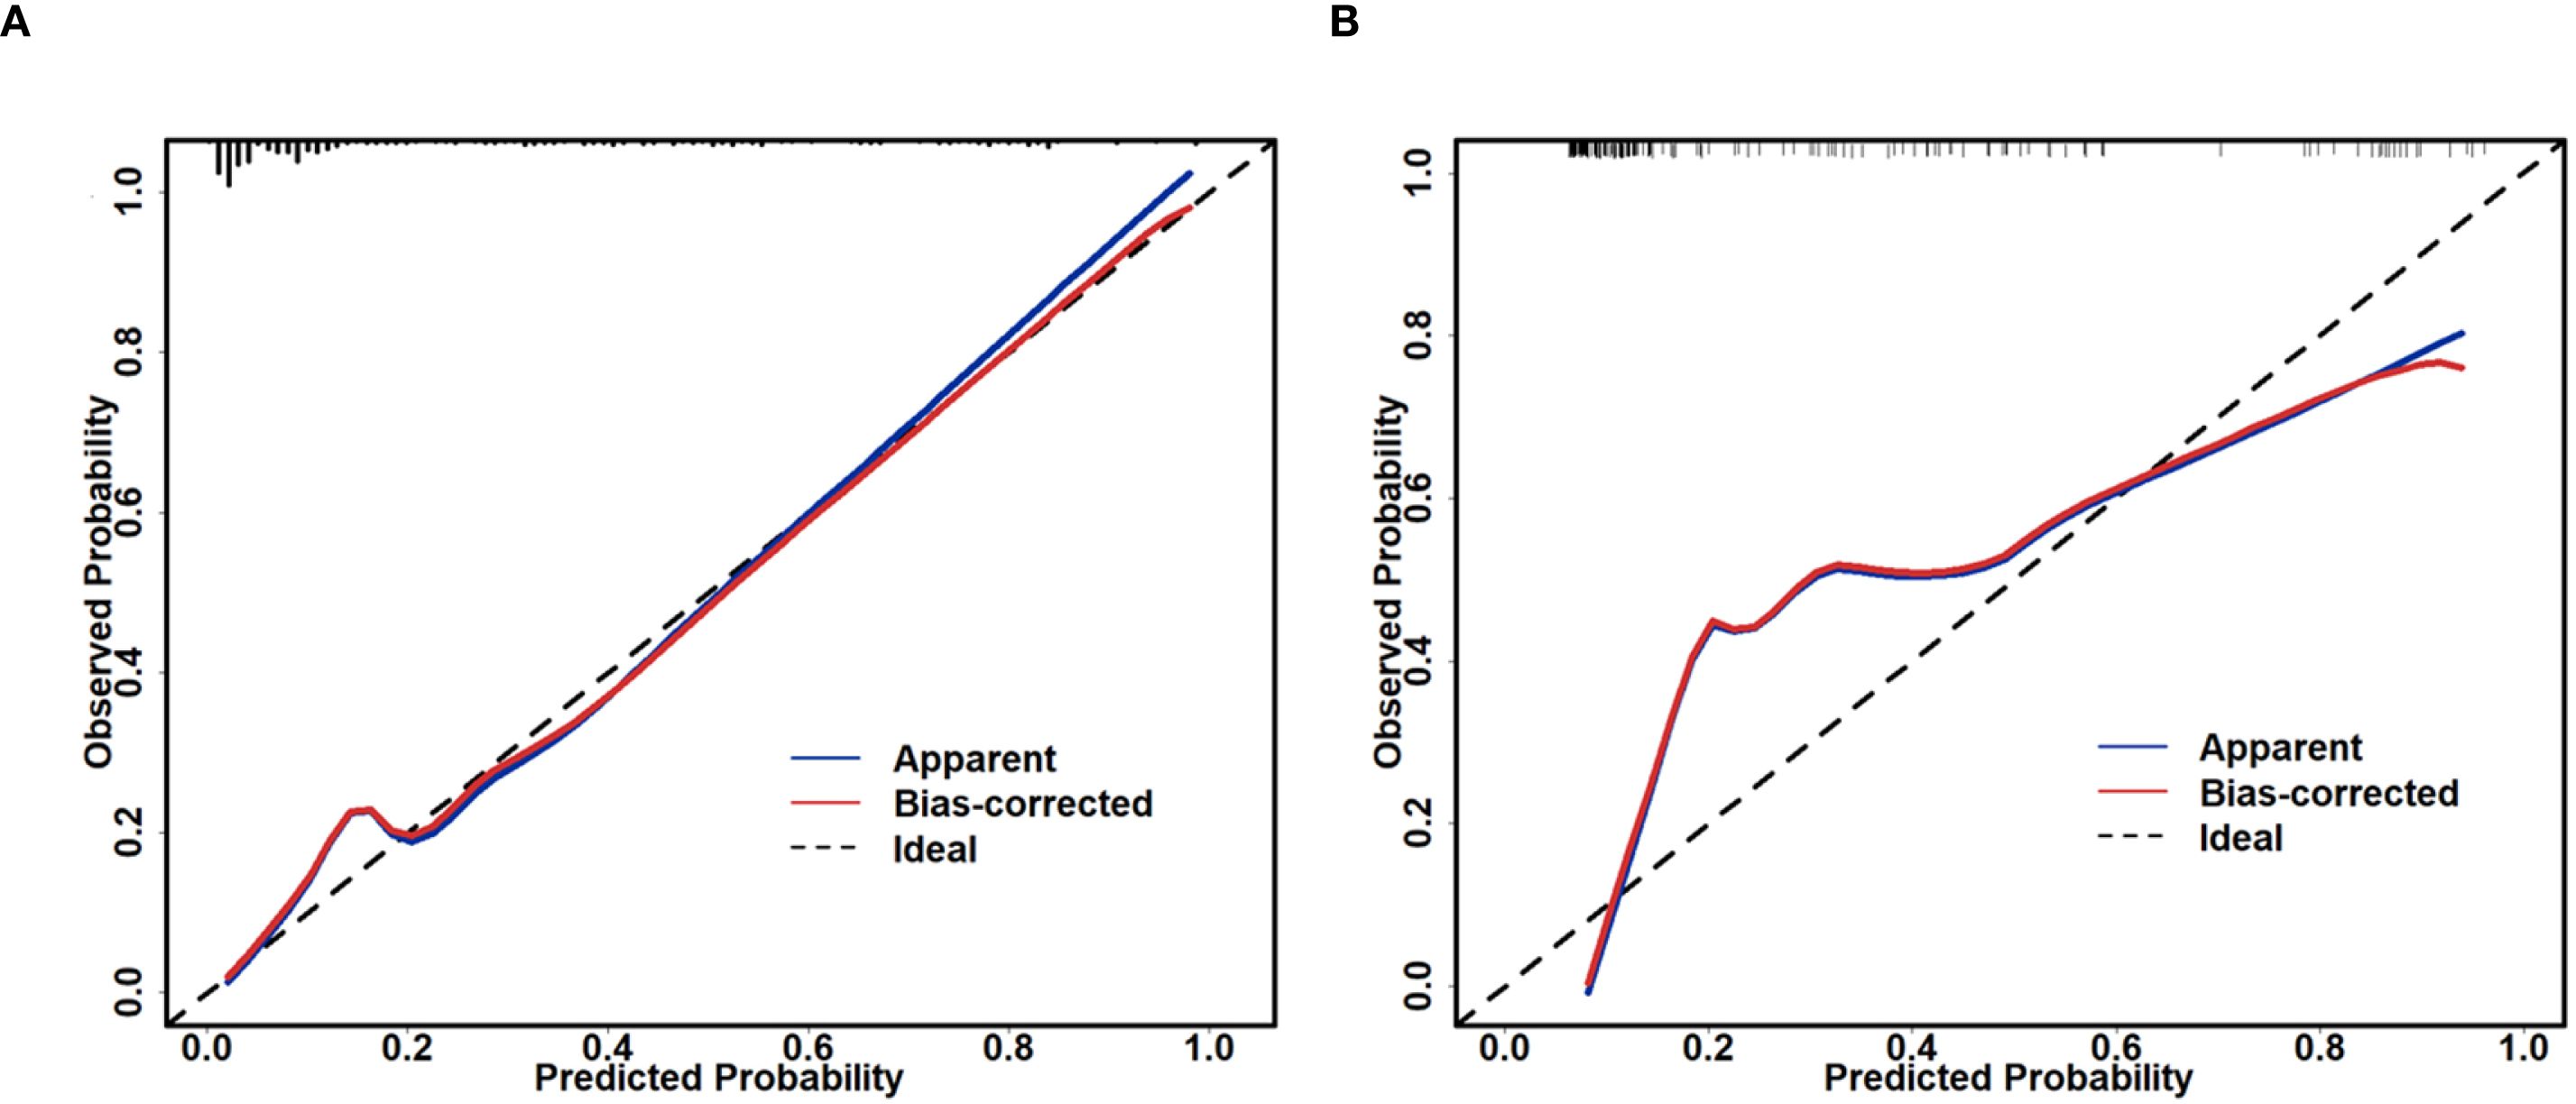
Figure 4. Calibration plot of the nomogram for predicting pCR. (A) calibration plot of the training cohort; (B) calibration plot of the validation cohort.
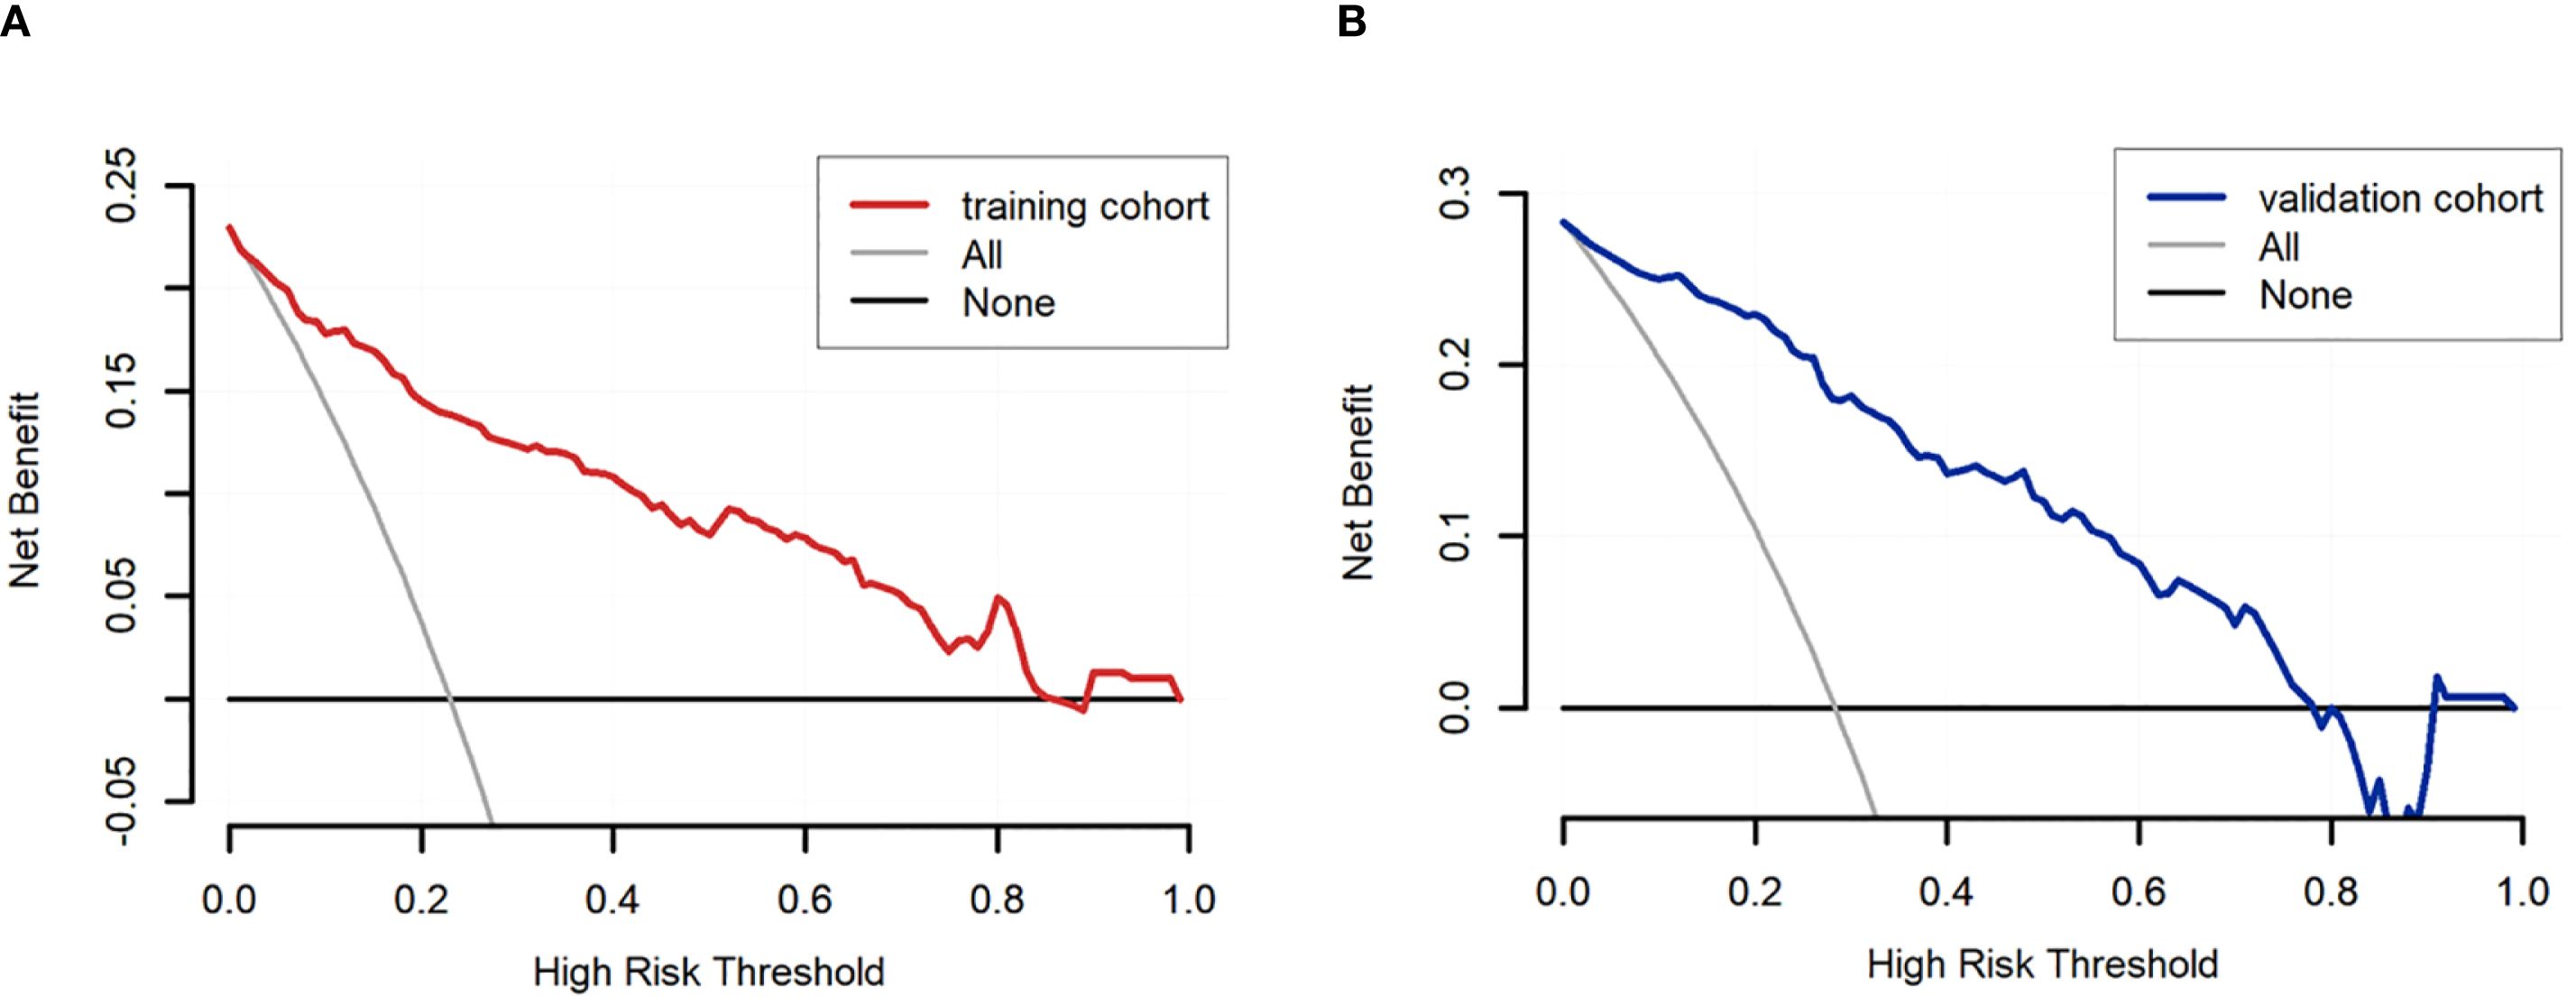
Figure 5. DCA of the nomogram for predicting pCR. (A) DCA curve of the training cohort; (B) DCA curve of the validation cohort.
Discussion
Data from our study indicated an overall accuracy of 77.44% for breast MRI in assessing the response to NAT, consistent with previous research (11). Investigating the factors contributing to radiologic-pathologic discordance will facilitate optimized clinical interpretation of MRI findings in patients with specific clinicopathological or imaging characteristics, thereby providing a basis for enhancing MRI performance.
Current studies on the impact of concomitant DCIS on MRI accuracy predominantly rely on postoperative paraffin-embedded pathology, suggesting reduced MRI assessment accuracy in patients with DCIS—a finding influenced by pCR definitions (12, 13). In contrast, this study focuses on early assessment of NAT response, addressing the inherent time lag of conventional pathological evaluation. Notably, we observed higher MRI inaccuracy in patients without DCIS on core needle biopsy, a finding discordant with conventional understanding. We postulate this discrepancy may stem from sampling limitations of core needle biopsy, wherein multifocal or microscopic DCIS foci could remain undetected (14). In cases diagnosed via core needle biopsy as “without concomitant DCIS,” there may exist diffusely distributed DCIS components that were not sampled during the biopsy procedure. Such occult DCIS tends to be less responsive to NAT and is more likely to persist post-treatment. Its persistent enhancement on MRI may be misinterpreted as residual invasive carcinoma, thereby reducing the specificity and overall accuracy of MRI assessment in this subgroup. In contrast, the classification of cases with biopsy-confirmed “concomitant DCIS” is more reliable. Therefore, in clinical practice, caution should be exercised regarding the risk of false-positive MRI findings due to residual DCIS after NAT in patients initially diagnosed as DCIS-negative on biopsy. These conclusions still require further validation through large-scale prospective studies. Consequently, these results warrant cautious interpretation and further validation. The observation presents dual challenges for breast imaging and pathology. Future research may explore quantitative analysis of multimodal MRI and artificial intelligence imaging recognition techniques, in combination with more precise biopsy strategies (e.g., stereotactic localization, multi-target sampling), to further enhance the accuracy of MRI assessment.
In this study, it was found that the diagnostic efficacy of breast MRI varies among different molecular subtypes of breast cancer. The accuracy rates in each subtype are as follows: HR+/HER2- type (96.79%), HR-/HER2- type (74.16%), HR+/HER2+ type (67.92%), and HR-/HER2+ type (41.82%). These findings are generally consistent with the trends reported in previous literature, which are 94.5% for Luminal A type, 74.4% for Luminal B type, 88.9% for TNBC, and 58.2% for HER2 type (7). The relatively high accuracy of MRI assessment in TNBC may be directly related to its unique cellular and vascular characteristics. TNBC typically exhibits a higher histological grade, accompanied by increased cellular proliferation, higher cellular density, greater structural complexity, and significantly enhanced metabolic activity. Furthermore, it demonstrates increased neovascularization, leading to aberrant tumor vascular structure and function, elevated arteriovenous shunting, and dysregulated blood flow. These features collectively promote greater uptake of contrast agent and enhanced leakage into the extracellular space, ultimately manifesting as more pronounced enhancement on MRI. This likely underlies the higher diagnostic accuracy of MRI for TNBC (15, 16). Conversely, the lower MRI diagnostic accuracy for HER2-positive tumors may be mechanistically explained by several factors. Firstly, HER2 gene amplification is closely linked to neovascularization. Targeted therapies inhibit HER2 signaling transduction, disrupting the balance between pro-angiogenic and anti-angiogenic factors. This suppresses angiogenesis and promotes the normalization of abnormal vasculature, consequently altering MRI imaging characteristics (17). Secondly, the residual effects of angiogenesis may play a role. HER2-positive breast cancers are inherently highly proliferative and often present with a high level of angiogenesis at diagnosis. Even after achieving a pCR following NAT, residual neovasculature may still manifest as a non-rCR on MRI, contributing to reduced diagnostic accuracy (18).
Regarding baseline MRI features, multiple studies have demonstrated their association with MRI-pathology discordance following NAT. Research by Hu et al. indicated that multifocal/multicentric lesions, segmental or regional NME distribution, and enhancing mass margins increase the risk of discordance (7). Negrão et al. reported that NME was the sole significant factor associated with MRI-pathology discordance (19). The reduced accuracy of MRI assessment for NME lesions stems from two primary factors. Firstly, unlike well-defined, homogeneous mass lesions, NME exhibits diffuse, heterogeneous growth patterns and often regresses irregularly after NAT. In contrast, masses typically demonstrate concentric shrinkage. This difference renders MRI size estimation more challenging for NME (20–22). Secondly, focal, regional, or asymmetric background parenchymal enhancement (BPE) can be readily misinterpreted as NME. For instance, Chikarmane et al. found that 20% (77 cases) of lesions previously classified as NME were actually BPE (23). Furthermore, this study revealed that the coexistence of mass and NME components significantly amplifies MRI assessment inaccuracy. This arises from the complex interplay of heterogeneous enhancement patterns, conflicting imaging characteristics, divergent underlying pathology, and variable treatment responses.
The association between the presence of DCIS on core needle biopsy and pCR to NAT remains inconsistent across existing studies. Labrosse et al. found no significant association between concomitant DCIS on biopsy and pCR (14). Conversely, von Minckwitz et al. reported that the absence of DCIS was an independent predictor of pCR in HER2-positive breast cancer (24). Similarly, Helal et al. demonstrated a significant association between the absence of DCIS on biopsy and pCR in TNBC (25). In the present study, we observed comparable results: the absence of DCIS on pre-treatment core biopsy was associated with a higher likelihood of achieving pCR. This observation may be explained by the fact that while DCIS can exhibit some response to NAT and may be completely eradicated in some cases, DCIS cells generally possess lower proliferative and invasive potential compared to invasive carcinoma. Consequently, breast cancers associated with DCIS typically exhibit lower overall response rates to NAT than pure invasive carcinomas, resulting in reduced responsiveness to neoadjuvant treatment (26, 27).
Furthermore, we found that MRI-assessed rCR was significantly correlated with pCR. This aligns with Santamaría et al., who demonstrated that the absence of late-phase enhancement on post-NAT MRI significantly correlated with pCR (28). Similarly, Kim et al. showed that the absence of both early and late enhancement within the tumor bed on post-NAT MRI was independently associated with pCR (29). In our study, rCR was defined as the absence of both early and late enhancement at the primary site on post-treatment MRI, combined with a short-axis diameter of <10 mm for all pathological lymph nodes (targeted or non-targeted). Multivariate regression analysis confirmed rCR as a strong predictor of NAT response. However, due to the limited sample size of rCR cases in this cohort (n=15, 2.7%), future studies with larger cohorts are warranted to validate this finding. Additionally, the post-NAT TIC type was significantly associated with pCR, consistent with previous reports (30). TIC reflects lesion hemodynamics, specifically related to tissue blood flow perfusion and microvascular permeability (31). Patients achieving pCR often exhibit TIC curves characterized as persistent or plateau types. This pattern likely results from tumor vascular remodeling or obliteration, reduced angiogenesis coupled with increased destruction, and decreased vascular wall permeability. Although some literature suggests that changes in TIC pattern between pre- and post-NAT MRI correlate with pCR (32), our multivariate analysis did not reveal a statistically significant association between TIC pattern change and pCR.
Numerous studies have developed predictive models for NAT response based on MRI features (33, 34). Compared to these previous models, the model constructed in this study demonstrated superior performance in terms of discrimination, calibration, and clinical decision applicability. Our present model incorporates only baseline characteristics and MRI parameters on post-NAT breast MRI. Consequently, its primary utility lies in pre-operative risk stratification to inform surgical decision-making. To this end, we systematically evaluated a range of probability thresholds and report the corresponding sensitivities and specificities (Supplementary Table 9). To minimize the risk of long-term survival detriment attributable to under-treatment while maintaining adequate sensitivity, we adopted a probability threshold of 0.70. At this threshold, the model achieves a specificity of 97.7% and a sensitivity of 40.4%, thereby correctly identifying the vast majority of patients with pathologically confirmed pCR. Based on this threshold, when the predicted probability is ≥0.70, breast-conserving surgery (BCS) combined with sentinel lymph node biopsy (SLNB) may be discussed with the patient (One representative application case is depicted in the Supplementary Figure 1), and the feasibility of omitting surgery could be evaluated in future prospective trials. Conversely, if the predicted probability is <0.70, standard modified radical mastectomy or conventional BCS is recommended.
However, this study has several limitations. First, it was a single-center, retrospective analysis. Second, due to the limited sample size, subgroup analyses based on molecular subtypes were not performed. Additionally, the small number of cases achieving MRI-assessed rCR (n=15, 2.7%) compromised the evaluation of diagnostic performance for this outcome. Finally, the training and validation cohorts exhibited minor discrepancies in a few baseline MRI features. Although statistical analyses and model performance metrics suggest these differences had limited impact, they nevertheless represent a limitation. Future work will undertake external validation in a more independent and balanced cohort to further confirm the model’s generalizability.
Conclusions
In summary, our research indicates that breast MRI demonstrates good accuracy in predicting NAT response. However, its accuracy in post-NAT efficacy assessment decreases in tumors that are ER-negative, lack concomitant DCIS, and exhibit both mass and non-mass enhancement lesions. Consequently, when utilizing MRI to evaluate NAT response, a comprehensive analysis integrating baseline clinicopathological characteristics and MRI findings is essential. The MRI feature-based predictive model developed here shows promise in efficacy prediction and may serve as a valuable supplementary tool for clinical decision-making.
Data availability statement
The original contributions presented in the study are included in the article/Supplementary Material. Further inquiries can be directed to the corresponding authors.
Ethics statement
The studies involving humans were approved by Medical Ethics Committee of Tianjin Medical University Cancer Institute and Hospital. The studies were conducted in accordance with the local legislation and institutional requirements. The participants provided their written informed consent to participate in this study.
Author contributions
ZS: Project administration, Writing – original draft, Writing – review & editing. XB: Formal Analysis, Writing – original draft. HZ: Methodology, Writing – review & editing. CL: Formal Analysis, Writing – review & editing. JM: Resources, Writing – review & editing. XQ: Formal Analysis, Writing – review & editing. PZ: Formal Analysis, Writing – review & editing. JZ: Project administration, Writing – original draft.
Funding
The author(s) declare financial support was received for the research and/or publication of this article. This work was supported by grants from the National Natural Science Foundation Cultivation Project of Tianjin Medical University Cancer Institute and Hospital (No. 230210).
Acknowledgments
We thank all the authors listed for their contributions to this study.
Conflict of interest
The authors declare that the research was conducted in the absence of any commercial or financial relationships that could be construed as a potential conflict of interest.
Generative AI statement
The author(s) declare that no Generative AI was used in the creation of this manuscript.
Any alternative text (alt text) provided alongside figures in this article has been generated by Frontiers with the support of artificial intelligence and reasonable efforts have been made to ensure accuracy, including review by the authors wherever possible. If you identify any issues, please contact us.
Publisher’s note
All claims expressed in this article are solely those of the authors and do not necessarily represent those of their affiliated organizations, or those of the publisher, the editors and the reviewers. Any product that may be evaluated in this article, or claim that may be made by its manufacturer, is not guaranteed or endorsed by the publisher.
Supplementary material
The Supplementary Material for this article can be found online at: https://www.frontiersin.org/articles/10.3389/fonc.2025.1669700/full#supplementary-material
Supplementary Figure 1 | A representative case from our retrospective cohort notably demonstrates the potential clinical utility of this strategy. A 65-year-old female patient was diagnosed via core needle biopsy with HR-negative/HER2-positive invasive ductal carcinoma (histologic grade 2). Initial staging indicated a tumor measuring 4.5 cm in maximum diameter with lymph node involvement (cT2N1, stage IIb). Key variables incorporated into the model included: DCIS component, ER negativity, HER2 positivity, post-NAT MRI indicating rCR, TIC showing wash-out pattern, and residual tumor size of 0 cm. The nomogram total score was approximately 310, corresponding to a predicted pCR probability exceeding 0.80. Based on the predefined decision threshold of 0.70, the patient was recommended for and successfully underwent breast-conserving surgery combined with sentinel lymph node biopsy. Final pathological evaluation confirmed pCR. This case supports the feasibility of safely omitting further surgery in patients with a nomogram-predicted pCR probability ≥ 0.70 in future prospective trials.
Abbreviations
NAT, Neoadjuvant therapy; pCR, Pathological complete response; AUC, Area under the curve; ROC, Receiver operating characteristic; DCIS, Ductal carcinoma in situ; NME, Non-mass enhancement; rCR, Radiologic complete remission; TIC, Time-signal intensity curve; MRI, Magnetic resonance imaging; TNBC, Triple-negative breast cancer; TILs, Tumor-infiltrating lymphocytes; BPE, Background parenchymal enhancement; T2WI, T2-weighted imaging; BCS, breast-conserving surgery; SLNB, sentinel lymph node biopsy; PPV, Positive predictive value PPV; NPV, Negative predictive value; CIs, confidence intervals; TN, True negative; TP, True positive; FN, False negative; FP, False positive.
References
1. Bray F, Laversanne M, Sung H, Ferlay J, Siegel RL, Soerjomataram I, et al. Global cancer statistics 2022: GLOBOCAN estimates of incidence and mortality worldwide for 36 cancers in 185 countries. CA Cancer J Clin. (2024) 74:229–63. doi: 10.3322/caac.21834
2. Korde LA, Somerfield MR, Carey LA, Crews JR, Denduluri N, Hwang ES, et al. Perez A et al: Neoadjuvant Chemotherapy, Endocrine Therapy, and Targeted Therapy for Breast Cancer: ASCO Guideline. J Clin Oncol. (2021) 39:1485–505. doi: 10.1200/JCO.20.03399
3. Cortazar P, Zhang L, Untch M, Mehta K, Costantino JP, Wolmark N, et al. Valagussa P et al: Pathological complete response and long-term clinical benefit in breast cancer: the CTNeoBC pooled analysis. Lancet. (2014) 384:164–72. doi: 10.1016/S0140-6736(13)62422-8
4. Johnson HM, Valero V, Yang WT, Smith BD, Krishnamurthy S, Shen Y, et al. Eliminating breast surgery for invasive cancer with exceptional response to neoadjuvant systemic therapy: prospective multicenter clinical trial planned initial feasibility endpoint. J Am Coll Surg. (2023) 237:101–8. doi: 10.1097/XCS.0000000000000670
5. Romeo V, Accardo G, Perillo T, Basso L, Garbino N, Nicolai E, et al. Assessment and prediction of response to neoadjuvant chemotherapy in breast cancer: A comparison of imaging modalities and future perspectives. Cancers (Basel). (2021) 13:3521. doi: 10.3390/cancers13143521
6. Wu LM, Hu JN, Gu HY, Hua J, Chen J, and Xu JR. Can diffusion-weighted MR imaging and contrast-enhanced MR imaging precisely evaluate and predict pathological response to neoadjuvant chemotherapy in patients with breast cancer? Breast Cancer Res Treat. (2012) 135:17–28. doi: 10.1007/s10549-012-2033-5
7. Hu Q, Hu Y, Ai H, Xia L, Liu R, and Ai T. Pre-operative MRI in evaluating pathologic complete response to neoadjuvant chemotherapy in patients with breast cancer: a study focused on influencing factors of baseline clinical-pathological and imaging features. Front Oncol. (2024) 14:1366613. doi: 10.3389/fonc.2024.1366613
8. Eun NL, Gweon HM, Son EJ, Youk JH, and Kim JA. Pretreatment MRI features associated with diagnostic accuracy of post-treatment MRI after neoadjuvant chemotherapy. Clin Radiol. (2018) 73:676.e679–676.e614. doi: 10.1016/j.crad.2018.02.008
9. Salgado R, Denkert C, Demaria S, Sirtaine N, Klauschen F, Pruneri G, et al. Penault-Llorca F et al: The evaluation of tumor-infiltrating lymphocytes (TILs) in breast cancer: recommendations by an International TILs Working Group 2014. Ann Oncol. (2015) 26:259–71. doi: 10.1093/annonc/mdu450
10. Eisenhauer EA, Therasse P, Bogaerts J, Schwartz LH, Sargent D, Ford R, et al. New response evaluation criteria in solid tumours: revised RECIST guideline (version 1.1). Eur J Cancer. (2009) 45:228–47. doi: 10.1016/j.ejca.2008.10.026
11. Kuzmova M, Cullinane C, Rutherford C, McCartan D, Rothwell J, Evoy D, et al. The accuracy of MRI in detecting pathological complete response following neoadjuvant chemotherapy in different breast cancer subtypes. Surg Oncol. (2023) 51:102011. doi: 10.1016/j.suronc.2023.102011
12. Marinovich ML, Houssami N, Macaskill P, Sardanelli F, Irwig L, Mamounas EP, et al. Meta-analysis of magnetic resonance imaging in detecting residual breast cancer after neoadjuvant therapy. J Natl Cancer Inst. (2013) 105:321–33. doi: 10.1093/jnci/djs528
13. Ploumen RAW, de Mooij CM, Gommers S, Keymeulen K, Smidt ML, and van Nijnatten TJA. Imaging findings for response evaluation of ductal carcinoma in situ in breast cancer patients treated with neoadjuvant systemic therapy: a systematic review and meta-analysis. Eur Radiol. (2023) 33:5423–35. doi: 10.1007/s00330-023-09547-7
14. Labrosse J, Morel C, Lam T, Laas E, Feron JG, Coussy F, et al. The presence of an in situ component on pre-treatment biopsy is not associated with response to neoadjuvant chemotherapy for breast cancer. Cancers (Basel). (2021) 13:235. doi: 10.3390/cancers13020235
15. Li SP, Padhani AR, Taylor NJ, Beresford MJ, Ah-See ML, Stirling JJ, et al. Vascular characterisation of triple negative breast carcinomas using dynamic MRI. Eur Radiol. (2011) 21:1364–73. doi: 10.1007/s00330-011-2061-2
16. Xiao J, Rahbar H, Hippe DS, Rendi MH, Parker EU, Shekar N, et al. Dynamic contrast-enhanced breast MRI features correlate with invasive breast cancer angiogenesis. NPJ Breast Cancer. (2021) 7:42. doi: 10.1038/s41523-021-00247-3
17. Wen XF, Yang G, Mao W, Thornton A, Liu J, Bast RC Jr., et al. HER2 signaling modulates the equilibrium between pro- and antiangiogenic factors via distinct pathways: implications for HER2-targeted antibody therapy. Oncogene. (2006) 25:6986–96. doi: 10.1038/sj.onc.1209685
18. Kwon MR, Chu J, Kook SH, and Kim EY. Factors associated with radiologic-pathologic discordance in magnetic resonance imaging after neoadjuvant chemotherapy for breast cancer. Clin Imaging. (2022) 89:1–9. doi: 10.1016/j.clinimag.2022.05.002
19. Negrao EMS, Souza JA, Marques EF, and Bitencourt AGV. Breast cancer phenotype influences MRI response evaluation after neoadjuvant chemotherapy. Eur J Radiol. (2019) 120:108701. doi: 10.1016/j.ejrad.2019.108701
20. Yin L, Wei X, Zhang Q, Xiang L, Zhang Y, Wang D, et al. Multimodal ultrasound assessment of mass and non-mass enhancements by MRI: Diagnostic accuracy in idiopathic granulomatous mastitis and breast cancer. Breast. (2024) 78:103797. doi: 10.1016/j.breast.2024.103797
21. Akashi-Tanaka S, Fukutomi T, Sato N, Iwamoto E, Watanabe T, Katsumata N, et al. The use of contrast-enhanced computed tomography before neoadjuvant chemotherapy to identify patients likely to be treated safely with breast-conserving surgery. Ann Surg. (2004) 239:238–43. doi: 10.1097/01.sla.0000109157.15687.d9
22. Bahri S, Chen JH, Mehta RS, Carpenter PM, Nie K, Kwon SY, et al. Residual breast cancer diagnosed by MRI in patients receiving neoadjuvant chemotherapy with and without bevacizumab. Ann Surg Oncol. (2009) 16:1619–28. doi: 10.1245/s10434-009-0441-5
23. Chikarmane SA, Michaels AY, and Giess CS. Revisiting nonmass enhancement in breast MRI: analysis of outcomes and follow-up using the updated BI-RADS atlas. AJR Am J Roentgenol. (2017) 209:1178–84. doi: 10.2214/AJR.17.18086
24. von Minckwitz G, Darb-Esfahani S, Loibl S, Huober J, Tesch H, Solbach C, et al. Responsiveness of adjacent ductal carcinoma in situ and changes in HER2 status after neoadjuvant chemotherapy/trastuzumab treatment in early breast cancer–results from the GeparQuattro study (GBG 40). Breast Cancer Res Treat. (2012) 132:863–70. doi: 10.1007/s10549-011-1621-0
25. Helal C, Djerroudi L, Ramtohul T, Laas E, Vincent-Salomon A, Jin M, et al. Bidard FC et al: Clinico-pathological factors predicting pathological response in early triple-negative breast cancer. NPJ Breast Cancer. (2025) 11:15. doi: 10.1038/s41523-025-00729-8
26. Wazir U, Patani N, Balalaa N, and Mokbel K. Pathologic response of associated ductal carcinoma in situ to neoadjuvant systemic therapy: A systematic review. Cancers (Basel). (2022) 15:13. doi: 10.3390/cancers15010013
27. Schettini F, Braso-Maristany F, Pascual T, Lorman-Carbo N, Nucera S, Bergamino M, et al. Identifying predictors of treatment response and molecular changes induced by neoadjuvant chemotherapy and endocrine therapy in hormone receptor-positive/HER2-negative breast cancer: the NEOENDO translational study. ESMO Open. (2024) 9:103989. doi: 10.1016/j.esmoop.2024.103989
28. Santamaria G, Bargallo X, Fernandez PL, Farrus B, Caparros X, and Velasco M. Neoadjuvant systemic therapy in breast cancer: association of contrast-enhanced MR imaging findings, diffusion-weighted imaging findings, and tumor subtype with tumor response. Radiology. (2017) 283:663–72. doi: 10.1148/radiol.2016160176
29. Kim SY, Cho N, Choi Y, Lee SH, Ha SM, Kim ES, et al. Factors affecting pathologic complete response following neoadjuvant chemotherapy in breast cancer: development and validation of a predictive nomogram. Radiology. (2021) 299:290–300. doi: 10.1148/radiol.2021203871
30. Chen S, Zheng B, Tang W, Ding S, Sui Y, Yu X, et al. The longitudinal changes in multiparametric MRI during neoadjuvant chemotherapy can predict treatment response early in patients with HER2-positive breast cancer. Eur J Radiol. (2024) 178:111656. doi: 10.1016/j.ejrad.2024.111656
31. Cheng Z, Wu Z, Shi G, Yi Z, Xie M, Zeng W, et al. Discrimination between benign and Malignant breast lesions using volumetric quantitative dynamic contrast-enhanced MR imaging. Eur Radiol. (2018) 28:982–91. doi: 10.1007/s00330-017-5050-2
32. Petrillo A, Fusco R, Petrillo M, Granata V, Bianco F, Di Marzo M, et al. DCE-MRI time-intensity curve visual inspection to assess pathological response after neoadjuvant therapy in locally advanced rectal cancer. Jpn J Radiol. (2018) 36:611–21. doi: 10.1007/s11604-018-0760-1
33. Yang W, Yang Y, Zhang C, Yin Q, and Zhang N. A clinicopathological-imaging nomogram for the prediction of pathological complete response in breast cancer cases administered neoadjuvant therapy. Magn Reson Imaging. (2024) 111:120–30. doi: 10.1016/j.mri.2024.05.002
34. Chen P, Wang C, Lu R, Pan R, Zhu L, Zhou D, et al. Multivariable models based on baseline imaging features and clinicopathological characteristics to predict breast pathologic response after neoadjuvant chemotherapy in patients with breast cancer. Breast Care (Basel). (2022) 17:306–15. doi: 10.1159/000521638
Keywords: breast cancer, neoadjuvant therapy, pathological complete response, magnetic resonance imaging, nomogram
Citation: Shi Z, Bian X, Zhu H, Li C, Meng J, Qian X, Zhou P and Zhang J (2025) Personalized prediction of pathological complete response in breast cancer neoadjuvant therapy: a nomogram combining quantitative MRI biomarkers and molecular subtypes. Front. Oncol. 15:1669700. doi: 10.3389/fonc.2025.1669700
Received: 20 July 2025; Accepted: 04 September 2025;
Published: 25 September 2025.
Edited by:
Dirk Geerts, Amsterdam University Medical Center, NetherlandsReviewed by:
Kinan Mokbel, University of Exeter, United KingdomZheng Ye, Guangzhou University, China
Copyright © 2025 Shi, Bian, Zhu, Li, Meng, Qian, Zhou and Zhang. This is an open-access article distributed under the terms of the Creative Commons Attribution License (CC BY). The use, distribution or reproduction in other forums is permitted, provided the original author(s) and the copyright owner(s) are credited and that the original publication in this journal is cited, in accordance with accepted academic practice. No use, distribution or reproduction is permitted which does not comply with these terms.
*Correspondence: Zhendong Shi, c2hpemhlbmRvbmczNTg4QHNpbmEuY29t; Jin Zhang, emhhbmdqaW50am11Y2gxQDE2My5jb20=
†These authors have contributed equally to this work