 Metin Cetiner
 Felix Schiepek
 Ilja Finkelberg
 Raphael Hirtz
 Anja K. Büscher
- Children's Hospital, Pediatrics II, University of Essen, Essen, Germany
Introduction: The number of children with acute and chronic liver disease is rising. Moreover, liver involvement may be limited to subtle changes in organ texture especially in early childhood and some syndromic conditions, such as ciliopathies. Attenuation imaging coefficient (ATI), shear wave elastography (SWE), and dispersion (SWD) are emerging ultrasound technologies providing data about attenuation, elasticity, and viscosity of liver tissue. This additional and qualitative information has been correlated with certain liver pathologies. However, limited data are available for healthy controls and have mainly been raised in adults.
Methods: This prospective monocentric study was conducted at a university hospital with a specialization in pediatric liver disease and transplantation. Between February and July 2021, 129 children aged 0-17.92 years were recruited. Study participants attended outpatient clinics due to minor illnesses excluding liver or cardiac diseases, acute (febrile) infections or other conditions affecting liver tissue and function. ATI, SWE, and SWD measurements were performed on an Aplio i800 (Canon Medical Systems) with an i8CX1 curved transducer by two different investigators with long-standing experience in pediatric ultrasound according to a standardized protocol.
Results: Considering multiple potential covariates, we derived percentile charts for all 3 devices relying on the Lambda-Mu-Sigma (LMS) approach. 112 children were considered for further analysis, excluding those with abnormal liver function and under-/overweight (BMI SDS<-1.96/> 1.96, respectively). Age range was 0-17.92 years (mean 6.89±0.50SD), 58% were male. The mean duration of the ultrasound examination (basic ultrasound plus SWE, SWD, and ATI) was 6.67±0.22 minutes and it was well tolerated in 83% (n=92) of cases. While ATI was related to age, SWD was found to depend on BMI SDS, and SWE on abdominal wall thickness and sex. ATI correlated with neither SWE nor SWD, but SWE was correlated with SWD.
Conclusions: Our study provides norm values and reference charts for ATI, SWE, and SWD considering important covariates including age, sex and, BMI. This may help to implement these promising tools into imaging diagnostics of liver disease and to improve the diagnostic relevance of liver ultrasound. In addition, these noninvasive techniques proved to be time-effective and highly reliable, which make them ideal for application in children.
Introduction
The number of children with acute and chronic liver disease is rising. The prevalence of non-alcoholic fatty liver disease (NAFLD) in children even approximates the numbers known in adults, with 7.6% in the general population and even >30% in the case of obesity (1). NAFLD not only accounts for liver-related morbidity but is also associated with an increased risk of developing metabolic syndrome with type 2 diabetes, cardiovascular disease, and mortality at adult age (2, 3), representing an enormous economic burden. In contrast to obesity-associated liver disease, which is common in industrialized countries and increases over the lifespan, genetic diseases like ciliopathies are characterized by liver involvement already in early childhood (4, 5). Both disease entities require highly accurate screening tools to detect subtle changes in liver tissue at an early stage to allow early diagnosis and—if possible—start of treatment.
Currently, the evaluation of liver tissue is mainly based on ultrasonography, an established, non-invasive technology that is highly applicable in children due to high image resolution given their body composition. However, the informative value of standard ultrasound examinations is limited to organ structure, size, and perfusion. Detailed analysis and quantitative staging of liver fibrosis and steatosis still require invasive liver biopsy and/or MRI examinations which require anesthesia in small children. New emerging ultrasound technologies such as shear wave elastography (SWE), shear wave dispersion (SWD), and attenuation imaging coefficient (ATI) provide imaging quality even surpassing MRI and CT scans with regard to parenchyma and (micro)perfusion of solid organs.
SWE utilizes the speed of the shear wave, which is the lateral tissue displacement by the power-focused ultrasound pulse. It is the most established among these new quantitative ultrasound technologies and reflects parenchymal elasticity. Clinical application has demonstrated the power of SWE in detecting and grading liver fibrosis not only in adults (6) but also in pediatric populations (7). User-friendly SWE is superior and more operational in difficult clinical circumstances compared to the older transient elastography technique (8–14). Some studies have aimed to establish SWE normal values of liver parenchyma in healthy children (15, 16) with contradicting results and have partially neglected important variables.
SWD displays the frequency dependency of shear wave speed, which is affected by parenchymal viscosity. First data indicate that it might be superior compared to SWE in evaluating liver allograft damage (17) and hepatic lobular inflammation in general (18) and discriminating grades of inflammation (19). Its performance in detecting focal liver lesions is under investigation (20).
ATI calculates the percentage of returned ultrasound energy not absorbed by liver tissue to determine the attenuation by organ tissue. Studies on ATI measurements of liver parenchyma in adults indicate its ability to detect and quantify steatosis and to differentiate between mild, moderate, and severe grades (21–27). Furthermore, ATI correlates with the results of MRI-PDFF (magnetic resonance imaging proton density fat fraction) and histopathology representing the gold standard for fat measurement in liver parenchyma (22, 26, 28, 29) and with grayscale grading (30). In this respect, it also surpasses CAP (controlled attenuation parameter) based on FibroScan® systems (30–32).
These high-end ultrasound techniques, especially if combined, may offer an opportunity to evaluate liver parenchyma quantitatively and qualitatively with the highest possible accuracy in one single examination. However, published data are limited to small study cohorts, mainly addressing adult patients, and/or neglecting important variables, such as BMI and age (15, 16).
The aim of our study was to establish normal values for these promising, non-invasive technologies (SWE, SWD, and ATI) in healthy children considering potential influencing factors to provide of a reliable basis for the advanced evaluation of liver parenchyma in pediatric patients with liver disease.
Material and methods
Patient recruitment and data collection
Between February and July 2021, 9,297 patients attended the outpatient clinics of the Children`s Hospital of the University Duisburg-Essen. We consecutively recruited 129/9,297 children (as described in the flowchart, Figure 1) according to the following inclusion criteria: age between 0 and 18 years, examination availability, absence of a medical history or clinical signs of liver, heart, systemic disease, and/or acute illness, including fever. Correspondingly, exclusion criteria were defined as followed: children with any clinical signs of acute illness or with known or suspected liver, cardiac, hemato-oncological diseases or any other systemic diseases with the risk of liver involvement. Non-fasting before the examination was no exclusion criterion. Written informed consent of parents/legal guardians and—if possible—participants was given prior to examination. Clinical (129/129) and laboratory (47/129) data were collected from digital patient records. The study was approved by the local ethics committee (23-11152-BO).
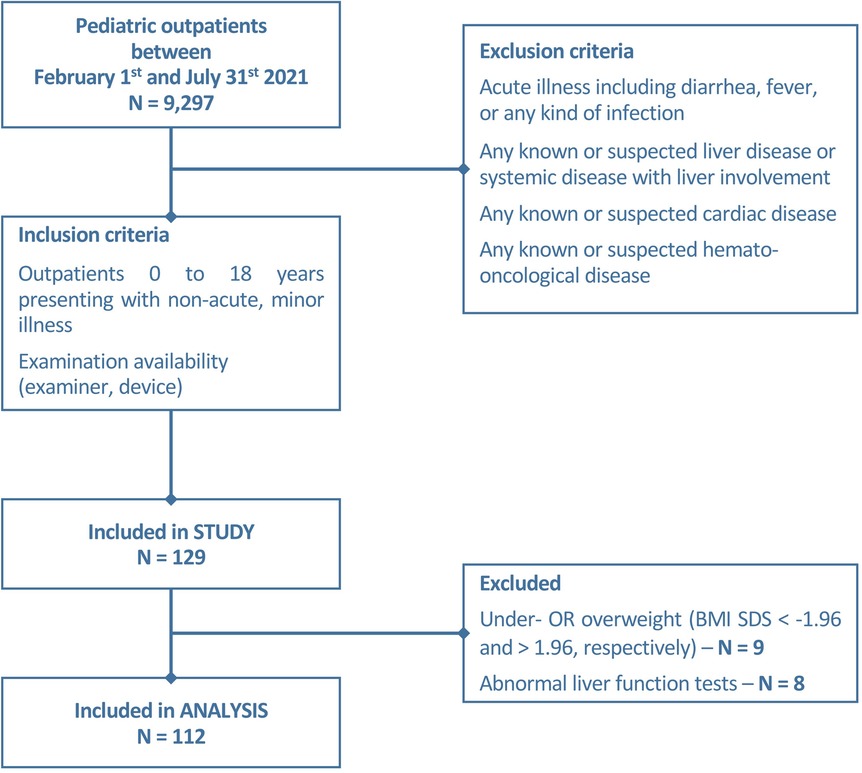
Figure 1. Flowchart describing the recruitment of study patients.
Standard ultrasound examination
Ultrasound examinations were performed using an Aplio i800 (Canon Medical Systems) with an i8CX1 transducer (PVI-475BT, single curved, 1.8–6.2 MHz). Two pediatricians specialized in pediatric ultrasonography (certified by the German Ultrasound association, DEGUM) and long-standing experience with pediatric liver disease and transplantation performed upon availability and jointly reviewed all examinations.
Examinations were carried out according to a defined protocol: children lay supine with both arms next to the body and were encouraged to breathe calmly (if possible regarding age). The duration of examination, patient cooperation, and last food intake were documented. Standard ultrasound and Doppler examinations included abdominal wall thickness (measured from cutis to peritoneal layer adjacent to liver capsule according to elastography measurement), organ size and shape (liver and spleen), echogenicity and parenchymal texture, including focal or diffuse lesions, dilation of the biliary tract, gallbladder abnormalities, and diameter, velocity and flow profiles of hepatic and splenic arteries and veins. The liver size was measured in the sternal, midclavicular, and anterior axillary line and determined by the mean of all three measurements. The dimension of the spleen was determined below the left costal margin. The results are given as the percentage of age- and height-related normal values (33).
Shear wave elastography and dispersion of liver tissue
Shear wave speed was measured using an intercostal acoustic window (10 distinct measurements, liver segments V-VIII as recommended (34, 35). Regions of interest (ROI, diameter 1 cm) were placed at 5 cm skin depth (at least 1 cm distance to the liver capsule, avoiding vessels and artifact areas). Mean and standard deviation values are given in kPa and m/s (elastography) and [m/s/kHz] (dispersion).
Attenuation imaging
Five distinct liver attenuation imaging measurements were performed for every patient (trapezoidal ROI avoiding areas too close to the liver capsule, larger vessels, and artifacts). A quality measure of the liver ATI coefficient that correlates the attenuation with the depth (goodness of fit—R2) was provided. The R2 values were categorized into poor (R2 < 0.80), good (0.80 ≤ R2 < 0.90) and excellent (R2 > 0.90), and only excellent values with R2 > 0.90 were accepted. The mean and standard deviation of the attenuation coefficient in [dB/cm/MHz] are reported.
Statistical analyses
Methods
Data handling and statistical analyses were performed with SPSS 25.0 (Armonk, NY: IBM Corp.) and R (version 4.0.3, R Core team, 2020) as well as the R-package FWDselect [version 2.1.0 (36)]. Power analyses were conducted with GPower [3.1, HHU Düsseldorf (37)]. Effect size regarding the employed correlation measures (r) was interpreted according to Cohen et al. (38): small 0.1 ≤ r < 0.3, medium 0.3 ≤ r < 0.5, large r ≥ 0.5.
Correlation analysis
Prior to analysis, data was semi-winsorized, a procedure by which outliers were replaced by predefined values (39). Following recent recommendations (40), outliers were defined as ATI, SWE (ms and kPa), and SWD measurements exceeding ± 2.5 the median absolute difference (MAD) regarding the respective sonography parameter and replaced by values corresponding to ±2.5 times the respective MAD.
Correlation analyses (Pearson correlation r, point-biserial correlation rpb, Kendall τ) were performed considering the scale of measure and the presence of outliers. Linearity between continuous variables was assessed by visual inspection of bivariate scatter plots. The analysis of bivariate correlations was deemed significant at p < .05 and exploratory.
Covariate subset selection
Considering the large number of potential covariates (age, sex, BMI SDS, height-SDS, abdominal wall thickness, liver size (%), spleen size (%), fasting duration, cooperation as well as SWD depth in case of construction of SWD charts) we used a two-step procedure as implemented in the FWRselect R-package to identify the most appropriate subset of covariates for reference chart construction within a linear regression framework. First, a greedy forward selection algorithm was employed, changing one variable at a time until no further improvement in model fit assessed by the Akaike information criterion (AIC) is attained. This also includes a cross-validation step when comparing subsets of different covariate sizes. Second, a bootstrap-based procedure evaluating the number of significant covariates as a trade-off between model size and model fit is performed at a significance level of p < .05 (36).
Construction of reference charts and curves
Considering covariates identified by the previous step of analysis, RefCurv was used for the construction of reference charts and curves based on the LMS method. The LMS method assumes that a distribution of data can be normalized by Box-Cox transformation (41). The three parameters L (λ, skewness of distribution), M (μ, median), and S (σ, coefficient of variation) for Box-Cox transformation were selected by choosing the subset of hyperparameters providing the lowest Bayesian information criterion (BIC) after grid search considering 5 degrees of freedom (DFs) for each hyperparameter (42) Model verification was performed by RefCurv's cross-validation facilities.
Results
Anthropometric data of the study patients
One hundred and twelve of 129 children (aged 0–17.92 years, mean 6.89 ± 5.32 years, median 6 years) were included in this prospective monocentric study. The distribution of sex was near-balanced with 58% (n = 65) male patients. Anthropometric data are presented in Table 1. Eight (8/129) patients were excluded from the analysis due to elevated liver enzymes (ALP (alkaline phosphatase), ALT (alanine transaminase), AST (aspartate aminotransferase), and/or gamma-glutamyl transferase (GGT) another nine children (9/129) due to under-/ or overweight (BMI SDS < −1.96 and >1.96, respectively).
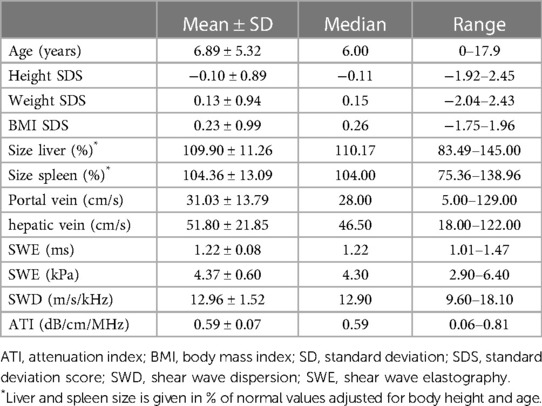
Table 1. Descriptives including anthropometric data, organ size, liver perfusion, and new techniques of the study cohort (n = 112).
Reasons for presentation of the study patients were unilateral kidney anomalies without impairment of kidney function (n = 36), urinary tract disorders without acute infection (n = 32), voiding disorders (n = 19), non-glomerular hematuria (n = 11), nephrolithiasis or nephrocalcinosis (n = 7), exclusion of precocious puberty (n = 3), and each (n = 1) with cutaneous hemangioma, dilated intestinal loops, foreign body ingestion, and with prior adrenal hyperplasia.
Technical characteristics of ultrasound examination
The mean duration of ultrasound examination of the liver (basic ultrasound + SWE, SWD, and ATI) was 6.67 ± 2.31 min (median 6 min, range 3–21 min). In 17% (n = 20) of cases, the examination was tolerated with intermittent restless episodes, not prolonging the study or compromising data acquisition and quality. The remaining 83% (n = 92) of cases laid quietly during the examination. The mean time to last food intake amounted to 2.84 ± 1.42 h (median 3, range 1–5 h). Fifty-nine percent of patients achieved a fasting period of >2 h at the time of examination, 41% of ≤2 h. The mean abdominal wall thickness was 10.01 ± 3.11 mm (median 9.00, range 5.00 to 23.00).
Liver size and perfusion
The size of the liver (and spleen) was normalized to age- and height-related values (%), and organ perfusion was measured in cm/s (Table 1). According to the high percentage of patients with a fasting period >2 h, the filling state of the gall bladder was moderate (n = 47) or high (n = 53) in the majority of patients (89.3%).
Results of SWE, SWD, and ATI
Regarding SWE, ROIs were placed at a mean of 2.84 ± 0.54 cm below the skin (median 2.80, range 1.70 to 4.00 cm). Absolute numbers of measurements are given in Table 1.
Correlation analysis
Regarding ATI, SWE (ms and kPa), and SWD, 4/112 (3.5%), 3/112 (2.7%), and 4/98 (4.1%) of measurements were winsorized, respectively. This is well below a recommended threshold of 5% (37). Moreover, the pattern of significance regarding the results of the correlation analysis did not change when using either winsorized or the original data.
Considering a power of 80% to detect a correlation of ≥0.3 regarding the analysis of ATI and SWE data, we found a significant correlation between ATI and age [r(110) = −0.52, p < .001], liver size [%; r(110) = 0.30, p = .001], abdominal wall thickness [r(110) = −0.28, p = .003], fasting duration [r(110) = −0.32, p = .001], and cooperation [r(110) = −0.34, p = .001] as well as between SWE (ms) and age [r(110) = 0.31, p < .001], liver size [%; r(110) = 0.22, p = .02], abdominal wall thickness [r(110) = 0.32, p < .001], sex [r (110) = −0.22, p = .02], and cooperation [r(110) = 0.28, p = .003—the same pattern of results was found for SWE in kPa—Table 2]. Regarding SWD, there was a significant bivariate correlation with BMI SDS [r(96) = −0.22, p = .03] but with no other covariate, despite sufficient power to detect a correlation of small to medium size (power 80% for r ≥ 0.33).
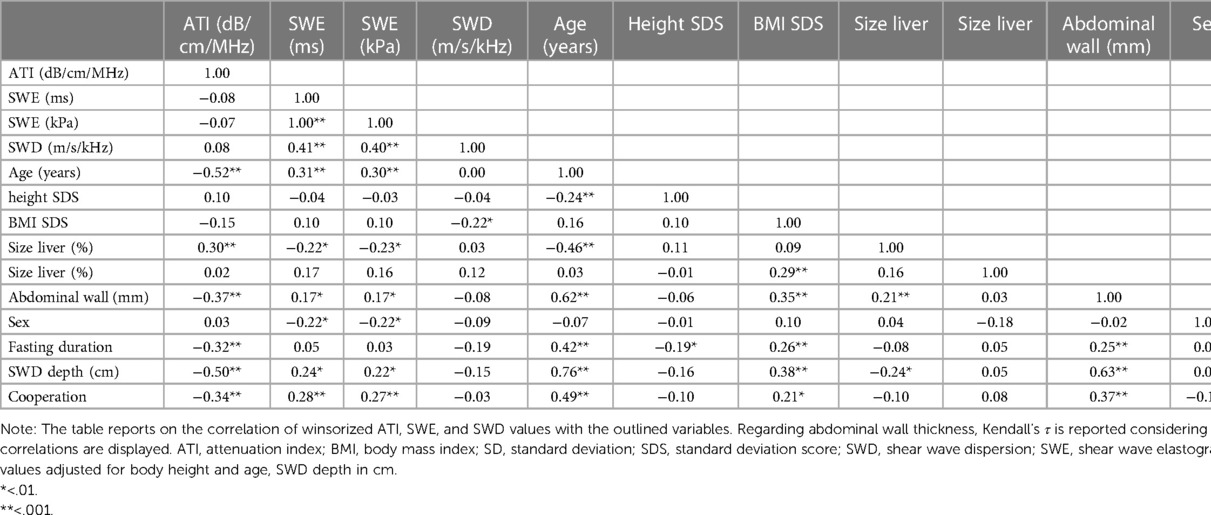
Table 2. Bivariate correlations of the new ultrasound techniques ATI, SWE, and SWD and potential influencing variables.
While ATI was correlated with neither SWE (ms: r(110) = −0.08, p = .43; kPa: r(110) = −0.72, p = .45) nor SWD [r(96) = 0.08, p = .45], SWE was correlated with SWD (ms: r(96) = 0.41, p < .001; kPa: r(96) = 0.40, p < .001).
Reference charts and curves
SWE reference curves were fitted considering abdominal wall thickness and sex, using polynomials with 1 DF for µ and λ 2DFs for σ for both sexes (Figure 2, Supplementary Tables S6–S9).
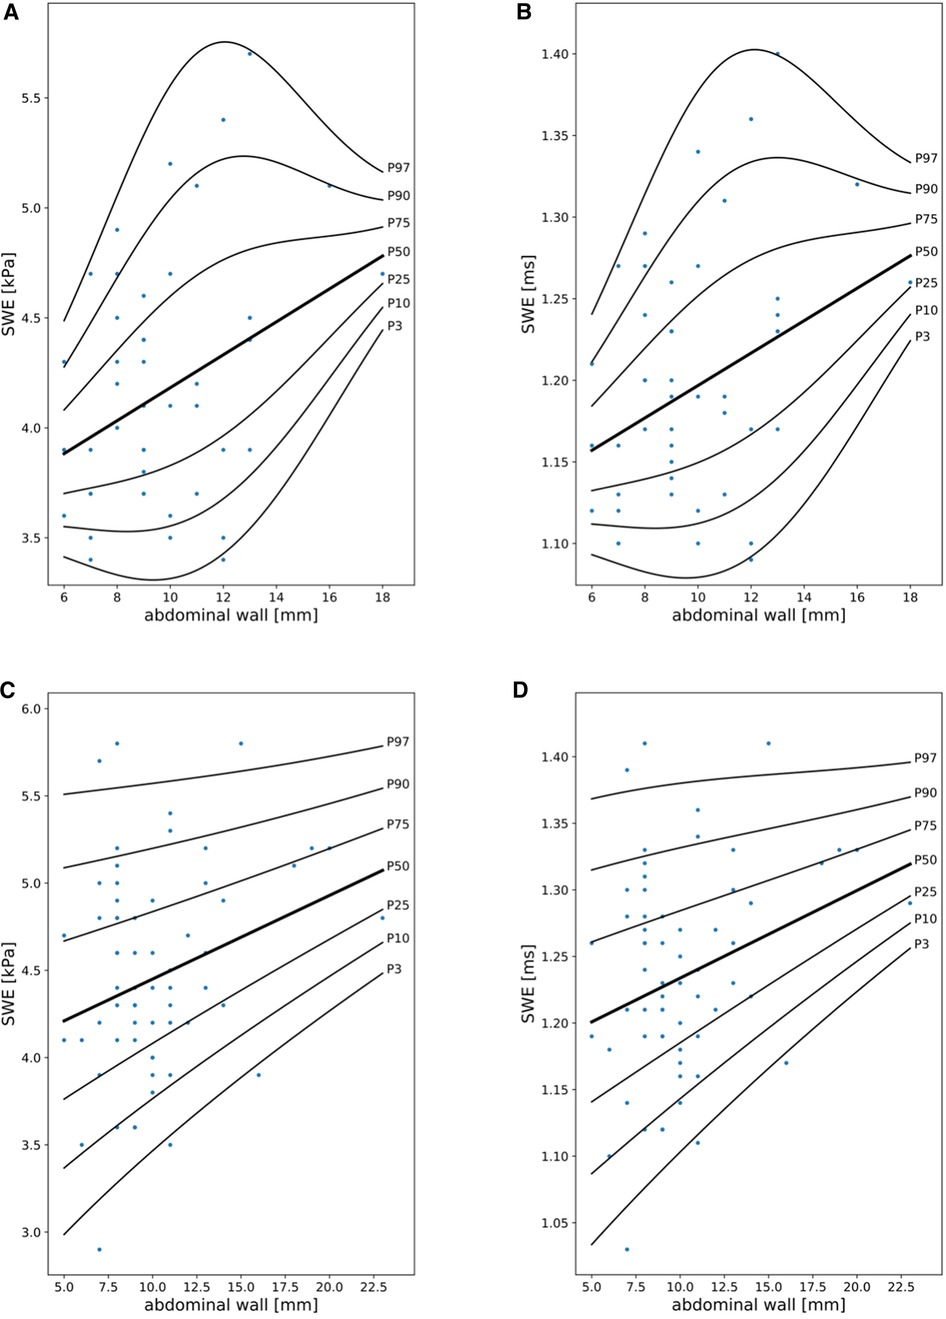
Figure 2. Shear wave elastography (SWE) reference curves in girls (A,B) and boys (C,D) in kPa and ms in relationship to abdominal wall thickness (mm).
Considering the results of the multivariable covariate selection process, SWD measurements were dependent on BMI SDS, with a decrease in SWD along with an increase in BMI SDS (best model fit considering overfitting: 0 DFs for λ, μ, and σ, Figure 3, Supplementary Table S5).
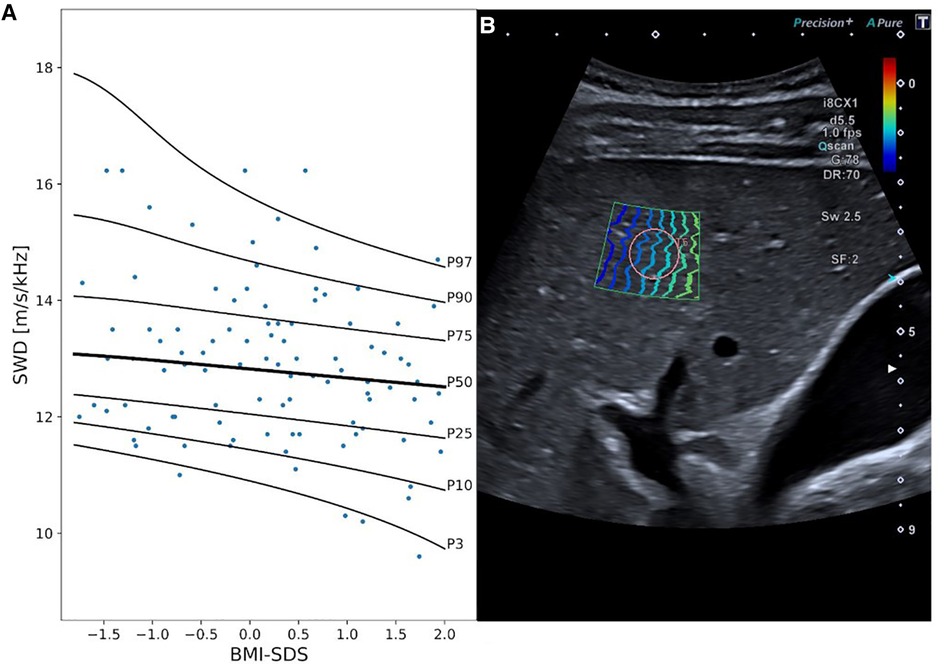
Figure 3. Shear wave dispersion (SWD) reference curves and exemplary 2D ultrasound SWD image. Panel A displays SWD percentile curves values in [m/s/kHz] in relationship to BMI SDS. Panel B exemplary represents an SWD measurement in a 15-year-old boy. MI, mechanical index; i8CX1, canon aplio i8CX1 transducer; d, differential tissue harmonics; fps, frames per second; Qscan, quick scan; G, gain; DR, dynamic range; Sw, shear wave frequency; SF, spatial filter.
Age was the only covariate identified by FWDselect to significantly explain the variance in ATI measurements (Figure 4, Supplementary Tables S1–S3). The best model fit (weighted against overfitting) was provided by 2DFs for the penalized splines of µ and λ as well as 0 DFs for the penalized splines of σ. As can be seen from the reference curve displayed in Figure 1, there was a decrease in ATI levels with increasing age (Supplementary Table S4).
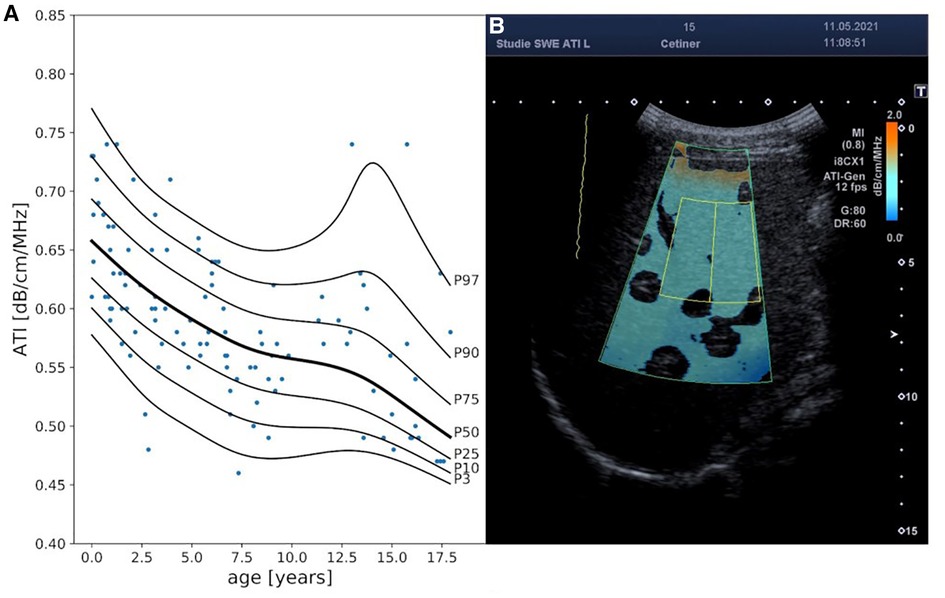
Figure 4. Attenuation index (ATI) reference curves and exemplary 2D ultrasound ATI image. Panel A displays ATI percentile curves values in [db/cm/MHz] in relationship to age (years). Panel B exemplary represents an ATI measurement in a 15-year-old boy. MI, mechanical index; i8CX1, canon aplio i8CX1 transducer; fps, frames per second; G, gain; DR, dynamic range.
The results from the covariate selection process were consistent when using either winsorized or the original data.
Discussion
We aimed to establish normal values for SWE, SWD, and ATI in children and adolescents without known or suspected liver disease to improve and broaden the diagnostic options for liver evaluation by these emerging, non-invasive ultrasound tools.
Shear wave elastography
While shear wave elastography (SWE) values were related to age, liver size (%), cooperation, sex, and abdominal wall thickness, further statistical analyses revealed that SWE values were primarily influenced by sex (higher values in boys than in girls) and abdominal wall thickness (higher values with increasing diameter). These findings support the work published in 2014 by Huang et al. (43) and in 2012 by Eiler et al. (8). A total of 509 healthy adults underwent SWE to determine liver stiffness in the study by Huang et al. (43). Whereas age and BMI had no significant effects on liver elasticity, male sex and detection depth showed a significant positive correlation. Eiler determined normal values for liver elastography (using acoustic radiation force impulse technique; ARFI) in 132 children with lower values in females without age dependency. Accordingly, we established separate percentiles for male and female patients adjusted for abdominal wall thickness. The association with sex is also supported by Galina et al. (44), but but was not confirmed by Trout et al. (16) and Bailey et al. (45). The latter studies demonstrated age-related differences in SWE, which we could confirm only by bivariate correlation, but have to negate considering multiple covariates. The absolute SWE values in our cohort (mean 4.37 ± 0.60 kPa) are comparable to already published data in children (16, 44–47) but lower than the mean values in other studies (48–50), possibly due to the usage of different ultrasound devices. Fasting duration did not significantly influence SWE in our study, as suggested by Simkin et al. (51). However, there are conflicting data from adult studies (52, 53). Anthropometric data, height-matched liver size, and liver perfusion had no significant impact on SWE.
Shear wave dispersion
In our study, shear wave dispersion (SWD) was independent of age. Mean values [12.96 (m/s)/kHz] were slightly higher than those reported in the study of Trout et al. (16), which included 128 healthy children [mean 11.43 ± 1.75(m/s/kHz)]. However, and in contrast to SWE analysis, SWD values correlated with patients BMI SDS. Interestingly, we found a negative correlation with lower BMI scores being associated with higher dispersion values. As the prevalence of obesity is lower in children than in adults, this may explain the tendency toward lower dispersion levels in the adult population compared to children. However, data on healthy adults are limited as most studies included patients with liver pathologies (19, 20, 54). Lee et al. (55) recently published data on a small cohort including 20 healthy individuals. SWD values were comparable [12.38 (m/s/kHz)] but slightly lower than observed in our cohort.
Attenuation imaging
Despite multiple correlations between ATI values and covariates, including age, liver size (%), fasting duration, abdominal wall thickness, and cooperation, further analyses indicate that ATI values are mainly dependent on age, with the highest coefficients in infants [mean values approximately 0.66 (dB/cm/MHz)] and a continuous decrease throughout childhood. During adolescence, we observed a broad inter-individual variation in ATI values. In late adolescence, mean values of 0.49 [dB/cm/Mhz] were observed corresponding to published data from adult cohorts (0.485–0.60 [dB/cm/Mhz] (16, 21–23, 25, 27, 30, 56);.
Cailloce et al. (15) analyzed ATI and SWE measurements in 77 children aged 0–15 years. Overall, ATI values were slightly higher [0.65 ± 0.07(dB/cm/MHz)] than those reported for adults. It was hypothesized that differences in liver architecture with a doubled layer of hepatocytes in young children compared to adolescents and adults were causative, but their data could not prove a correlation with age. However, the number of children within this young age group was limited. Another reason for the age dependency of ATI values might be the physiologically higher liver fat content in infants and pre-school children (57) and differences in liver fat content in school children in relation to prenatal weight gain and nutrition in infancy (58–60). The correlation of ATI values with age has implications for the interpretation of suspected fatty liver disease in children and should be considered before establishing and grading therapy-relevant cutoff values not only for ultrasound-based techniques but also for diagnostics with MRI (61).
The significant variance in ATI normal values in adolescence might be explained by a change in body composition during puberty and a high variation in pubertal onset (62, 63). In addition, we analyzed ATI values considering fasting duration before the examination. We could demonstrate higher attenuation coefficients in the case of shorter fasting periods prior to the examination. This is compatible with published data about daily liver fat changes (64).
Implications for feasibility and examination conditions
Several studies discuss the feasibility of these new ultrasound techniques, especially regarding the costs of technical equipment and time-consuming examinations as well as the requirement of expert knowledge of the investigators. Carried out by only two different pediatricians experienced in ultrasound and with a standardized study protocol, the median duration of the examination (including documentation of liver size, texture, and perfusion) was 6 min and, therefore, not significantly prolonged compared to a standard liver ultrasound procedure. Examinations succeeded in all patients, with the majority (>80%) of children not showing any signs of discomfort.
We did not compel breath-hold conditions, as this is not feasible in infants and young children. Instead, the children were requested to breathe calmly. This approach is supported by data of Jung et al. (65), who did not find significant differences between examinations undertaken under breath-hold and free-breathing conditions.
The study design willfully included children with different lengths of the fasting period to analyze its influence on the study results. Moreover, a longer fasting state might have a negative impact on patients` cooperation, at least in infants, impeding the success of the examinations. Multivariable analysis negated a significant relationship between SWE, SWD and ATI results and the length of the fasting period, indicating that fasting duration is of minor importance for the analyzed parameters.
Limitations
Limitations of our study include a limited sample size implying a lack of statistical power regarding the analyses of the importance of covariates on ATI, SWE, and SWD values. However, we had sufficient power to detect medium effect sizes. Moreover, the sample size of the present study also implies a limited coverage in terms of the range of covariate values considering the studied ultrasound parameters. This especially applies regarding SWE values in late adolescent girls (Figures 1A,B).
Even though participants were selected thoroughly and checked for conditions impairing liver parenchyma and function, some participants suffered from—albeit minor—illnesses that might influence the study results.
Conclusion
We aimed to establish normal values (percentiles) for the new quantitative ultrasound techniques SWE, SWD, and ATI. Age, BMI, sex, and abdominal wall thickness, respectively, were demonstrated to influence at least some of these techniques and were included in the analyses. Liver size and perfusion still constitute the basis of liver diagnostics in children and they do not demonstrate an association with SWE, SWD, or ATI. The development of percentiles for the pediatric population enables the evaluation of these promising techniques regarding their potential to improve diagnostics, especially in the early stages of liver disease. Children with inborn and acquired primary and secondary liver pathologies may benefit from these emerging tools as the detection of already slight alterations is of utmost importance for early diagnosis and therapy.
Data availability statement
The original contributions presented in the study are included in the article/Supplementary Material, further inquiries can be directed to the corresponding author/s.
Ethics statement
The studies involving human participants were reviewed and approved by Ethics Comittee, University Hospital of Essen. Written informed consent to participate in this study was provided by the participants’ legal guardian/next of kin.
Author contributions
MC: Study design, data collection and analysis, statistical analysis, manuscript writing; FS: study design, data collection and analysis; IF: study design and data collection; RH: study design, statistical analysis, data analysis, preparation manuscript, AKB: study design, data and statistical analysis, writing of the manuscript. All authors contributed to the article and approved the submitted version.
Funding
This study was funded by the German Federal Ministry of Education and Research (BMBF); grant number 01GM1903E.
Conflict of interest
The authors declare that the research was conducted in the absence of any commercial or financial relationships that could be construed as a potential conflict of interest.
Publisher's note
All claims expressed in this article are solely those of the authors and do not necessarily represent those of their affiliated organizations, or those of the publisher, the editors and the reviewers. Any product that may be evaluated in this article, or claim that may be made by its manufacturer, is not guaranteed or endorsed by the publisher.
Supplementary material
The Supplementary Material for this article can be found online at: https://www.frontiersin.org/articles/10.3389/fped.2023.1020690/full#supplementary-material.
References
1. Anderson EL, Howe LD, Jones HE, Higgins JP, Lawlor DA, Fraser A. The prevalence of non-alcoholic fatty liver disease in children and adolescents: a systematic review and meta-analysis. PLoS One. (2015) 10(10):e0140908. doi: 10.1371/journal.pone.014090
2. Younossi ZM, Tampi R, Priyadarshini M, Nader F, Younossi IM, Racila A. Burden of illness and economic model for patients with nonalcoholic steatohepatitis in the United States. Hepatology. (2019) 69(2):564–72. doi: 10.1002/hep.30254
3. Associazione Italiana per lo Studio del Fegato (AISF), Società Italiana di Diabetologia (SID) and Società Italiana dell’Obesità (SIO). Non-alcoholic fatty liver disease in adults 2021: a clinical practice guideline of the Italian association for the study of the liver (AISF), the Italian society of diabetology (SID) and the Italian society of obesity (SIO). Eat Weight Disord. (2022) 27(5):1603–19. doi: 10.1007/s40519-021-01287-1
4. Burgmaier K, Kilian S, Bammens B, Benzing T, Billing H, Büscher A, et al. Clinical courses and complications of young adults with autosomal recessive polycystic kidney disease (ARPKD). Sci Rep. (2019) 9(1):7919. Published 2019 May 28. doi: 10.1038/s41598-019-43488-w
5. Gunay-Aygun M. Liver and kidney disease in ciliopathies. Am J Med Genet C Semin Med Genet. (2009) 151C(4):296–306. doi: 10.1002/ajmg.c.30225
6. Ferraioli G, Maiocchi L, Dellafiore C, Tinelli C, Above E, Filice C. Performance and cutoffs for liver fibrosis staging of a two-dimensional shear wave elastography technique. Eur J Gastroenterol Hepatol. (2021) 33(1):89–95. doi: 10.1097/MEG.0000000000001702
7. Akyuz M, Gurcan Kaya N, Esendagli G, Dalgic B, OzhanOktar S. The evaluation of the use of 2D shear-wave ultrasound elastography in differentiation of clinically insignificant and significant liver fibrosis in pediatric age group. AbdomRadiol. (2021) 46(5):1941–6. doi: 10.1007/s00261-020-02844-5
8. Eiler J, Kleinholdermann U, Albers D, Dahms J, Hermann F, Behrens C, et al. Standard value of ultrasound elastography using acoustic radiation force impulse imaging (ARFI) in healthy liver tissue of children and adolescents. Ultraschall Med. (2012) 33(5):474–9. doi: 10.1055/s-0032-1313145
9. Behrens CB, Langholz JH, Eiler J, Jenewein R, Naehrlich L, Fuchs K, et al. A pilot study of the characterization of hepatic tissue strain in children with cystic-fibrosis-associated liver disease (CFLD) by acoustic radiation force impulse imaging. Pediatr Radiol. (2013) 43(5):552–7. doi: 10.1007/s00247-012-2560-6
10. ÓHara S, Hodson S, Hernaman C, Wambeek N, Olynyk J. Concordance of transient elastography and shear wave elastography for measurement of liver stiffness. Sonography. (2017) 4(4):141–5. doi: 10.1002/sono.12122
11. Osman AM, El Shimy A, Abd El Aziz MM. 2D Shear wave elastography (SWE) performance versus vibration-controlled transient elastography (VCTE/fibroscan) in the assessment of liver stiffness in chronic hepatitis. Insights Imaging. (2020) 11(1):38. doi: 10.1186/s13244-020-0839-y
12. Herrmann E, de Lédinghen V, Cassinotto C, Chu WC, Leung VY, Ferraioli G, et al. Assessment of biopsy-proven liver fibrosis by two-dimensional shear wave elastography: an individual patient data-based meta-analysis. Hepatology. (2018) 67(1):260–72. doi: 10.1002/hep.29179
13. Wu T, Wang P, Zhang T, Zheng J, Li S, Zeng J, et al. Comparison of two-dimensional shear wave elastography and real-time tissue elastography for assessing liver fibrosis in chronic hepatitis B. Dig Dis. (2016) 34(6):640–9. doi: 10.1159/000448825
14. Paul SB, Das P, Mahanta M, Sreenivas V, Kedia S, Kalra N, et al. Assessment of liver fibrosis in chronic hepatitis: comparison of shear wave elastography and transient elastography. Abdom Radiol. (2017) 42(12):2864–73. doi: 10.1007/s00261-017-1213-5
15. Cailloce R, Tavernier E, Brunereau L, Fievet A, Falip C, Dujardin F, et al. Liver shear wave elastography and attenuation imaging coefficient measures: prospective evaluation in healthy children. AbdomRadiol. (2021) 46(10):4629–36. doi: 10.1007/s00261-021-02960-w
16. Trout AT, Xanthakos SA, Bennett PS, Dillman JR. Liver shear wave speed and other quantitative ultrasound measures of liver parenchyma: prospective evaluation in healthy children and adults. Am J Roentgenol. (2020) 214(3):557–65. doi: 10.2214/AJR.19.21796
17. Lee DH, Lee JY, Bae JS, Yi NJ, Lee KW, Suh KS, et al. Shear-wave dispersion slope from US shear-wave elastography: detection of allograft damage after liver transplantation. Radiology. (2019) 293(2):327–33. doi: 10.1148/radiol.2019190064
18. Lee DH, Cho EJ, Bae JS, Lee JY, Yu SJ, Kim H, et al. Accuracy of two-dimensional shear wave elastography and attenuation imaging for evaluation of patients with nonalcoholic steatohepatitis. Clin Gastroenterol Hepatol. (2021) 19(4):797–805.e7. doi: 10.1016/j.cgh.2020.05.034
19. Sugimoto K, Moriyasu F, Oshiro H, Takeuchi H, Abe M, Yoshimasu Y, et al. The role of multiparametric US of the liver for the evaluation of nonalcoholic steatohepatitis. Radiology. (2020) 296(3):532–40. doi: 10.1148/radiol.2020192665
20. Dong Y, Qiu Y, Zhang Q, Yang D, Yu L, Wang WP, et al. Preliminary clinical experience with shear wave dispersion imaging for liver viscosity in preoperative diagnosis of focal liver lesions. Z Gastroenterol. (2020) 58(9):847–54, (in English). doi: 10.1055/a-1217-7465
21. Ferraioli G, Maiocchi L, Raciti MV, Tinelli C, De Silvestri A, Nichetti M, et al. Detection of liver steatosis with a novel ultrasound-based technique: a pilot study using MRI-derived proton density fat fraction as the gold standard. Clin Transl Gastroenterol. (2019) 10(10):e00081. doi: 10.14309/ctg.0000000000000081
22. Burgio D, Ronot M, Reizine M, Rautou E, Castera PE, Paradis L, et al. Quantification of hepatic steatosis with ultrasound: promising role of attenuation imaging coefficient in a biopsy-proven cohort. EurRadiol. (2020) 30(4):2293–301. doi: 10.1007/s00330-019-06480-6
23. Jang JK, Kim SY, Yoo IW, Cho YB, Kang HJ, Lee DH. Diagnostic performance of ultrasound attenuation imaging for assessing low-grade hepatic steatosis. EurRadiol. (2022) 32(3):2070–7. doi: 10.1007/s00330-021-08269-y
24. Hsu PK, Wu LS, Su WW, Su PY, Chen YY, Hsu YC, et al. Comparing the controlled attenuation parameter using FibroScan and attenuation imaging with ultrasound as a novel measurement for liver steatosis. PLoS One. (2021) 16(10):e0254892. doi: 10.1371/journal.pone.0254892
25. Kwon EY, Kim YR, Kang DM, Yoon KH, Lee YH. Usefulness of US attenuation imaging for the detection and severity grading of hepatic steatosis in routine abdominal ultrasonography. Clin Imaging. (2021) 76:53–9. doi: 10.1016/j.clinimag.2021.01.034
26. Welman CJ, Saunders J, Zelesco M, Abbott S, Boardman G, Ayonrinde OT. Hepatic steatosis: ultrasound assessment using attenuation imaging (ATI) with liver biopsy correlation. J Med Imaging Radiat Oncol. (2023) 67:45–53. doi: 10.1111/1754-9485.13412
27. Tada T, Kumada T, Toyoda H, Nakamura S, Shibata Y, Yasuda S, et al. Attenuation imaging based on ultrasound technology for assessment of hepatic steatosis: a comparison with magnetic resonance imaging-determined proton density fat fraction. Hepatol Res. (2020) 50(12):1319–27. doi: 10.1111/hepr.13563
28. Sporea I, Bâldea V, Lupușoru R, Bende F, Mare R, Lazăr A, et al. Quantification of steatosis and fibrosis using a new system implemented in an ultrasound machine. Med Ultrason. (2020) 22(3):265–71. doi: 10.11152/mu-2495
29. Jeon SK, Lee JM, Joo I, Yoon JH, Lee DH, Lee JY, et al. Prospective evaluation of hepatic steatosis using ultrasound attenuation imaging in patients with chronic liver disease with magnetic resonance imaging proton density fat fraction as the reference standard. Ultrasound Med Biol. (2019) 45(6):1407–16. doi: 10.1016/j.ultrasmedbio.2019.02.008
30. Rehman A, Darira J, Hamid K, Ahmed MS, Shazlee MK, Amirali A. Relationship between greyscale ultrasound grading of hepatic steatosis and attenuation imaging. Cureus. (2022) 14(3):e23435. doi: 10.7759/cureus.23435
31. Ferraioli G, Soares Monteiro LB. Ultrasound-based techniques for the diagnosis of liver steatosis. World J Gastroenterol. (2019) 25(40):6053–62. doi: 10.3748/wjg.v25.i40.6053
32. Kuroda H, Fujiwara Y, Abe T, Nagasawa T, Oguri T, Noguchi S, et al. Two-dimensional shear wave elastography and ultrasound-guided attenuation parameter for progressive non-alcoholic steatohepatitis. PLoS One. (2021) 16(4):e0249493. doi: 10.1371/journal.pone.0249493
33. Deeg K, Hofmann V, Hoyer PF. Ultraschalldiagnostik in Pädiatrie und Kinderchirurgie: Lehrbuch und Atlas (2018) (5. Aufl.). Thieme. S. 594 Tabelle 7.3.
34. Samir AE, Dhyani M, Vij A, Bhan AK, Halpern EF, Méndez-Navarro J, et al. Shear-wave elastography for the estimation of liver fibrosis in chronic liver disease: determining accuracy and ideal site for measurement. Radiology. (2015) 274(3):888–96. doi: 10.1148/radiol.14140839
35. Yokoo T, Kanefuji T, Suda T, Nagayama I, Hoshi T, Abe S, et al. Rational arrangement of measuring shear wave speed in the liver. World J Gastroenterol. (2019) 25(20):2503–13. doi: 10.3748/wjg.v25.i20.2503
36. Sestelo M, Villanueva NM, Meira-Machado L, Roca-Pardiñas J. FWDselect: an R package for Variable selection in regression models. R J. (2016) 8(1):132. doi: 10.32614/RJ-2016-009
37. Faul F, Erdfelder E, Buchner A, Lang A-G. Statistical power analyses using G* power 3.1: tests for correlation and regression analyses. Behav Res Methods. (2009) 41(4):1149–60. doi: 10.3758/BRM.41.4.1149
40. Leys C, Ley C, Klein O, Bernard P, Licata L. Detecting outliers: do not use standard deviation around the mean, use absolute deviation around the median. J Exp Soc Psychol. (2013) 49(4):764–6. doi: 10.1016/j.jesp.2013.03.013
41. Cole TJ. The LMS method for constructing normalized growth standards. Eur J Clin Nutr. (1990) 44(1):45–60. PMID: 2354692.2354692
42. Winkler C, Linden K, Mayr A, Schultz T, Welchowski T, Breuer J, et al. Refcurv: a software for the construction of pediatric reference curves. Software Impacts. (2020) 6:100040. doi: 10.1016/j.simpa.2020.100040
43. Huang Z, Zheng J, Zeng J, Wang X, Wu T, Zheng R. Normal liver stiffness in healthy adults assessed by real-time shear wave elastography and factors that influence this method. Ultrasound Med Biol. (2014) 40(11):2549–55. doi: 10.1016/j.ultrasmedbio.2014.05.008
44. Galina P, Alexopoulou E, Zellos A, Grigoraki V, Siahanidou T, Kelekis NL, et al. Performance of two–dimensional ultrasound shear wave elastography: reference values of normal liver stiffness in children. PediatrRadiol. (2019) 49(1):91–8. doi: 10.1007/s00247-018-4244-3
45. Bailey SS, Youssfi M, Patel M, Hu HH, Shaibi GQ, Towbin RB. Shear-wave ultrasound elastography of the liver in normal-weight and obese children. Acta Radiol. (2017) 58(12):1511–8. doi: 10.1177/0284185117695668
46. Farmakis SG, Buchanan PM, Guzman MA, Hardy AK, Jain AK, Teckman JH. Shear wave elastography correlates with liver fibrosis scores in pediatric patients with liver disease. PediatrRadiol. (2019) 49(13):1742–53. doi: 10.1007/s00247-019-04493-3
47. Mjelle AB, Mulabecirovic A, Havre RF, Rosendahl K, Juliusson PB, Olafsdottir E, et al. Normal liver stiffness values in children: a comparison of three different elastography methods. J Pediatr Gastroenterol Nutr. (2019) 68(5):706–12. doi: 10.1097/MPG.0000000000002320
48. Yang H, Sun Y, Tang Y, Lu Y, Hu B, Ying T. Shear-wave elastography of the liver in a healthy pediatric population. J Clin Ultrasound. (2020) 48(3):139–44. doi: 10.1002/jcu.22794
49. Dardanelli EP, Orozco ME, Lostra J, Laprida C, Lulkin S, Bosaleh AP, et al. Bidimensional shear-wave elastography for assessing liver fibrosis in children: a proposal of reference values that correlate with the histopathological knodell-ishak score. PediatrRadiol. (2020) 50(6):817–26. doi: 10.1007/s00247-020-04632-1
50. Palabiyik FB, Inci E, Turkay R, Bas D. Evaluation of liver, kidney, and spleen elasticity in healthy newborns and infants using shear wave elastography. J Ultrasound Med. (2017) 36(10):2039–45. doi: 10.1002/jum.14202
51. Simkin P, Rattansingh A, Liu K, Hudson JM, Atri M, Jang HJ, et al. Reproducibility of 2 liver 2-dimensional shear wave elastographic techniques in the fasting and postprandial states. J Ultrasound Med. (2019) 38(7):1739–45. doi: 10.1002/jum.14862
52. Lim Z, Whitaker T, DeColle K, Barrett K, Harlton C, Paskar L, et al. Interobserver and intraobserver reliability of hepatic shear wave elastography and the influence of fasted versus nonfasted states in healthy volunteers. J Ultrasound Med. (2021) 40(2):259–67. doi: 10.1002/jum.15395
53. Petzold G, Porsche M, Ellenrieder V, Kunsch S, Neesse A. Impact of food intake on liver stiffness determined by 2-D shear wave elastography: prospective interventional study in 100 healthy patients. Ultrasound Med Biol. (2019) 45(2):402–10. doi: 10.1016/j.ultrasmedbio.2018.09.021
54. Su PY, Su WW, Wu LS, Hsu PK, Huang SP, Hsu YC. Reduction of shear wave elastography but not shear wave dispersion after successful hepatitis C treatment with direct-acting antiviral agents. J Ultrasound Med. (2021) 40(9):1919–26. doi: 10.1002/jum.15576
55. Lee J, Lee R, Erpelding T, Siddoway RL, Gao J. The effect of water intake on ultrasound tissue characteristics and hemodynamics of adult livers. Clin Exp Hepatol. (2021) 7(2):223–30. doi: 10.5114/ceh.2021.107068
56. Fujiwara Y, Kuroda H, Abe T, Ishida K, Oguri T, Noguchi S, et al. The B-mode image-guided ultrasound attenuation parameter accurately detects hepatic steatosis in chronic liver disease. Ultrasound Med Biol. (2018) 44(11):2223–32. doi: 10.1016/j.ultrasmedbio.2018.06.017
57. Hári P. Chemie verschiedener organe, organfunktionen, gewebe und sekrete (den harn ausgenommen). In: D A, editors. Kurzes lehrbuch der physiologischen chemie. Berlin, Heidelberg: Springer (1928). p. 220. doi: 10.1007/978-3-642-99427-2_8
58. Vogelezang S, Santos S, van der Beek EM, Abrahamse-Berkeveld M, Duijts L, van der Lugt A, et al. Infant breastfeeding and childhood general, visceral, liver, and pericardial fat measures assessed by magnetic resonance imaging. Am J Clin Nutr. (2018) 108(4):722–9. doi: 10.1093/ajcn/nqy137
59. Giannì ML, Roggero P, Morlacchi L, Garavaglia E, Piemontese P, Mosca F. Formula-fed infants have significantly higher fat-free mass content in their bodies than breastfed babies. Acta Paediatr. (2014) 103(7):e277–81. doi: 10.1111/apa.12643
60. Vogelezang S, Santos S, Toemen L, Oei EHG, Felix JF, Jaddoe VWV. Associations of fetal and infant weight change with general, visceral, and organ adiposity at school age. JAMA Netw Open. (2019) 2(4):e192843. doi: 10.1001/jamanetworkopen.2019.2843
61. D'Hondt A, Rubesova E, Xie H, Shamdasani V, Barth RA. Liver fat quantification by ultrasound in children: a prospective study. AJR Am J Roentgenol. (2021) 217(4):996–1006. doi: 10.2214/AJR.20.24874
62. Suzuki A, Abdelmalek MF, Schwimmer JB, Lavine JE, Scheimann AO, Unalp-Arida A, et al. Nonalcoholic steatohepatitis clinical research network. Association between puberty and features of nonalcoholic fatty liver disease. Clin Gastroenterol Hepatol. (2012) 10(7):786–94. doi: 10.1016/j.cgh.2012.01.020
63. Akcam M, Boyaci A, Pirgon O, Koroglu M, Dundar BN. Importance of the liver ultrasound scores in pubertal obese children with nonalcoholic fatty liver disease. Clin Imaging. (2013) 37(3):504–8. doi: 10.1016/j.clinimag.2012.07.011
64. Hakkarainen A, Lundbom J, Tuominen EK, Taskinen MR, Pietiläinen KH, Lundbom N. Measuring short-term liver metabolism non-invasively: postprandial and post-exercise ¹H and ³¹P MR spectroscopy. MAGMA. (2015) 28(1):57–66. doi: 10.1007/s10334-014-0450-7
Keywords: shear wave elastography, attenuation imaging coefficient, shear wave dispersion, liver tissue, children, non-invasive technique, normal value
Citation: Cetiner M, Schiepek F, Finkelberg I, Hirtz R and Büscher AK (2023) Validation of attenuation imaging coefficient, shear wave elastography, and dispersion as emerging tools for non-invasive evaluation of liver tissue in children. Front. Pediatr. 11:1020690. doi: 10.3389/fped.2023.1020690
Received: 16 August 2022; Accepted: 28 March 2023;
Published: 17 April 2023.
Edited by:
Simona Sestito, University "Magna Graecia", ItalyReviewed by:
Maria Oana Sasaran, George Emil Palade University of Medicine, Pharmacy, Sciences and Technology of Târgu Mureş, RomaniaPatrick Gerner, The Graduate School of Offenburg University of Applied Sciences, Germany
© 2023 Cetiner, Schiepek, Finkelberg, Hirtz and Büscher. This is an open-access article distributed under the terms of the Creative Commons Attribution License (CC BY). The use, distribution or reproduction in other forums is permitted, provided the original author(s) and the copyright owner(s) are credited and that the original publication in this journal is cited, in accordance with accepted academic practice. No use, distribution or reproduction is permitted which does not comply with these terms.
*Correspondence: Metin Cetiner bWV0aW4uY2V0aW5lckB1ay1lc3Nlbi5kZQ== Anja K. Büscher YW5qYS5idWVzY2hlckB1ay1lc3Nlbi5kZQ==
†These authors have contributed equally to this work
Specialty Section: This article was submitted to Pediatric Gastroenterology, Hepatology and Nutrition, a section of the journal Frontiers in Pediatrics