 Jing Sheng†
 Ting-Ting Li†
 Huan-Huan Zhang
 Hua-Feng Xu
 Xue-Mei Cai
 Rong Xu
 Qiong-Qiong Ji
 Yu-Meng Wu
 Ting Huang
 Xiu-Jun Yang*
- Department of Radiology, Shanghai Children's Hospital, School of Medicine, Shanghai Jiao Tong University, Shanghai, China
Objective: To assess the computed tomography (CT) and magnetic resonance (MR) imaging characteristics of soft tissue rhabdoid tumors (RT) and compare them with those of rhabdomyosarcoma (RMS).
Methods: We conducted a retrospective analysis of 49 pediatric patients from 2011 to 2022, comprising 16 patients with soft tissue RT and 33 patients with RMS who underwent CT or MRI scans. Key imaging features, as well as clinical and pathological data, were compared between the two groups. The multivariate logistic regression analysis was used to determine independent differential factors for distinguishing soft tissue RT from RMS, and the model was established. The final prediction model was visualized by nomograms and verified internally by using a bootstrapped resample 1,000 times. The diagnostic accuracy of the combined model was assessed in terms of discrimination, calibration, and clinical utility.
Results: Age, sex, number of lesions, and primary locations were similar in both groups. The imaging characteristics, including margin, calcification, surrounding blood vessels, and rim enhancement, were associated with the two groups of soft tissue tumors, as determined by univariate analysis (all p < 0.05). On multivariate logistic regression analysis, the presence of unclear margin (p-value, adjusted odds ratio [95% confidence interval]: 0.03, 7.96 [1.23, 51.67]) and calcification (0.012, 30.37 [2.09, 440.70]) were independent differential factors for predicting soft tissue RT over RMS. The presence of rim enhancement (0.007, 0.05 [0.01, 0.43]) was an independent differential factor for predicting RMS over soft tissue RT. The comprehensive model established by logistic regression analysis showed an AUC of 0.872 with 81.8% specificity and 81.3% sensitivity. The decision curve analysis (DCA) curve displayed that the model achieved a better net clinical benefit.
Conclusion: Our study revealed that the image features of calcification, indistinct margins, and a lack of rim enhancement on CT and MRI might be reliable to distinguish soft tissue RT from RMS.
1. Introduction
Rhabdoid tumor (RT) is a rare, highly aggressive, and fast-progressing type of sarcoma with a high mortality rate. It is histologically characterized by rhabdoid cells and genetically characterized by the loss of function of the chromatin remodeling complex SWI/SNF induced by gene deficiency of SMARCB1 (also known as hSNF5, INI1, and BAF47) on chromosome 22q11.23 or SMARCA4 (also known as BRG1 and Hsnf2b) on chromosome 19p13.2 (1, 2). RT was initially described by Beckwith et al. in 1978 in young children with primary renal tumors, but it can occur in various locations and at any age (3). The most common sites are the central nervous system (also known as the atypical teratoid/rhabdoid tumor, AT/RT) and the kidneys (4). Unlike previous studies, the rhabdomyosarcoma (RMS) and soft tissue RT mentioned in this article exclude those that originate in internal organs or the central nervous system.
The annual incidence of soft tissue RT in children older than one year is less than 0.1% per million (5). It is frequently mistaken with more common soft tissue sarcomas, such as RMS, which likewise primarily affects young children. In the United States, around 4.5 per million children and adolescents under the age of 20 are diagnosed with RMS every year (6). RMS and soft tissue RT may be difficult to differentiate since patients with these disease entities typically present with nonspecific clinical symptoms, such as pain or a palpable lump, and rhabdoid differentiation with distinctive nuclear pleomorphism and atypia histologically (7). Despite these similarities, soft tissue RT and RMS have widely differing prognoses. According to a study by the International Society of Pediatric Oncology (SIOP), the 5-year overall survival (OS) rate for RMS can approach 74% (8). However, soft tissue RT has a poor prognosis (9). Madigan et al. reported a 37.5% 2-year OS and 5-month median survival for 8 patients with soft tissue RT (10). A median survival of less than one year for soft tissue RT was also discovered in another study (4). Thus, it is essential to differentiate early soft tissue RT from RMS.
Imaging as a noninvasive method plays a vital role in the initial diagnosis. Unfortunately, the imaging characteristics of soft tissue RT is yet to determined (11). To the best of our knowledge, this is the largest retrospective single institutional imaging study primarily focused on comparing soft tissue rhabdoid tumors to rhabdomyosarcomas. In this study, we analyzed the clinicopathologic and imaging characteristics of 16 patients diagnosed with RT by surgical pathology between January 2011 and December 2022 in order to improve early CT and MRI diagnostic accuracy and reduce the rate of misdiagnosis of this aggressive tumor, and compared with RMS.
2. Materials and methods
2.1. Patients
This case-control study was approved by the Ethical Committee of Children's Hospital of Shanghai/Shanghai Children's Hospital, Shanghai Jiao Tong University (Approval number: 2022R160-E01), and informed consent was waived due to the retrospective nature of the analyses and the use of anonymized medical records.
From January 2011 to December 2022, 89 individuals with soft tissue RT or RMS were identified after a search of the medical files and the picture archiving and communication systems (PACS) at our institution (Figure 1). The inclusion criteria for this study were as follows: (a) confirmation of soft tissue RT or RMS by surgical pathology; (b) multidetector CT and/or MRI examination was performed within 6 months before surgery and chemotherapy. Exclusion criteria were as follows: (a) lesions located in the internal organs or central nervous system; (b) patients did not undergo CT or MRI examination before locoregional treatment; (c) image quality did not meet the diagnostic needs. Ultimately, 49 patients with soft tissue tumors, comprising 33 patients with RMS and 16 patients with soft tissue RT, were enrolled in this study. Data were collected on patient demographics, clinical symptoms, and immunohistochemistry.
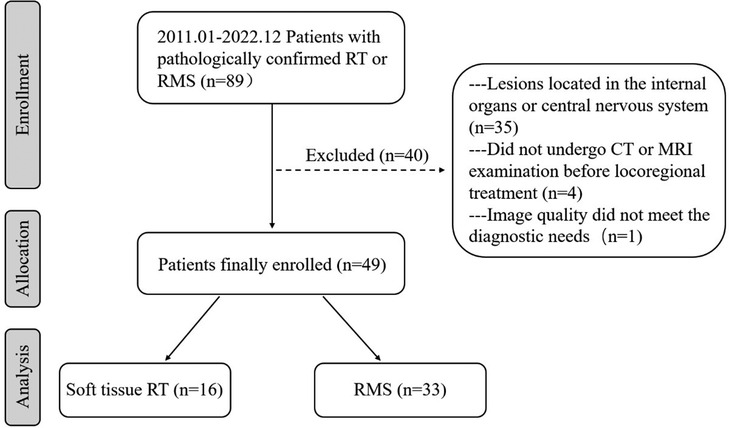
Figure 1. Flow chart visualizing the patient selection process for the study.
2.2. Imaging protocols for CT and MRI
Among the 49 patients, 45 underwent multi-slice spiral CT scans, 19 underwent MRI scans, and 15 underwent both CT and MRI scans. All of the patients fasted for four hours to before the scan, and those who couldn't cooperate with the CT or MRI tests were given 10% chloral hydrate (0.5 ml/kg) orally for sedation prior to the test.
The CT examinations were performed using 64-multidetector CT scans (Lightspeed Ultra 64, GE Medical Systems, USA or Aquilion Ultra 64, TOSHIB, Japan), with the following parameters: a layer thickness of 0.625 mm, interval of 2.5 mm, pitch of 0.984, tube voltage of 100 kV, and tube current of 240 mA. Coronal and transverse multiplanar reconstruction CT images were reconstructed with 3 mm section thickness. After the acquisition of unenhanced CT, 2 ml/kg of Iohexol (350 mg/ml, Schering, Germany) was administered intravenously at a rate of 1.8–2.5 ml/s using an automatic power injector (OptiVantage DH; Mallinckrodt, St. Louis, Mo) into a 22- or 24-gauge intravenous cannula, without normal saline bolus administration. Trip-phase enhanced images were obtained at 15–20 s, 40–50 s, and 120–180 s after intravenous contrast injection.
All patients used a 3.0 T scanner (Ingenia, Philips Medical Systems, Best, the Netherlands). To achieve optimal resolution, coils were selected according to the respective body region examined. Scanning methods: conventional axial, coronal, and sagittal scans, including T1-weighted images (T1WI), T2-weighted images (T2WI) and fat-suppressed T2-weighted images (Fs-T2WI), with a slice thickness of 5 mm and an interval of 4 mm. A single-shot echo sequence was used to generate diffusion-weighted images (DWIs). The diffusion gradients were applied in three orthogonal directions (x, y, and z). After 0.2 ml/kg Gd-DTPA (3 ml/s) was injected intravenously, sagittal, axial, and coronal T1WI pictures were acquired. Detailed scan parameters are shown in Table 1.
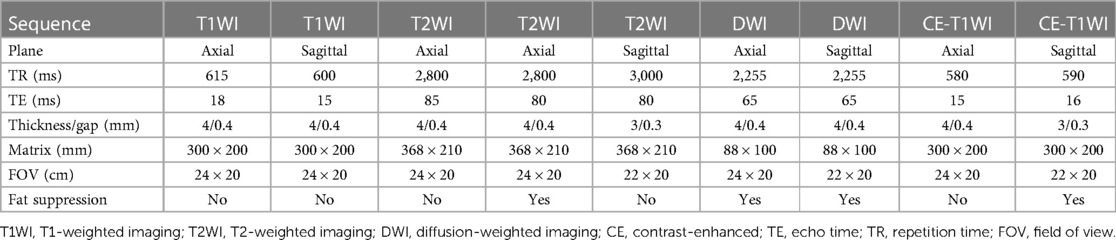
Table 1. MRI sequences and parameters.
2.3. Imaging analysis
The CT and MRI pictures were assessed by two radiologists with more than ten years of expertise who were blinded to the ultimate diagnosis. Individual interpretation differences were settled through consensus. The following imaging characteristics were noted and documented: (a) number (single or multiple); (b) location (head and neck/trunk/extremities); (c) size (maximum tumor diameter); (d) morphology (multilobulated/round/others); (e) margin (clear or unclear); (f) density/signal intensity (lower or higher than normal muscle/cystic necrosis/calcification/hemorrhage/fat); (g) peripheral cyst (present or absent); (h) surrounding blood vessels (present or absent); (i) rim enhancement (present or absent). Other radiologic features, such as adjacent bone destruction and metastatic sites, were also evaluated. The largest tumor diameter was measured in any axial, coronal, or sagittal plane on both CT and MRI. An unclear margin was defined as lacking clear borders between the tumor and surrounding structures on unenhanced images.
2.4. ADC histogram analysis
DWI examinations were performed on three cases of soft tissue RT and thirteen cases of RMS. The ADC maps were automatically created for the obtained images with the software built into the MR unit using b values of 0 and 1,000 s/mm2. All MRI data were then transferred to an offline workstation in DCM format. Two experienced pediatric radiologists, with 10 and 20 years of MRI experience, independently assessed the MRI images and identified the regions of interest (ROI), which included the entire tumor, for histogram analysis using MaZda software (version 4.6, The Technical University of Lodz, Institute of Electronics, http://www.eletel.p.lodz.pl/mazda/). The software automatically extracted nine histogram parameters, such as the mean, variance, skewness, and kurtosis, as well as the 1st (ADCp1), 10th (ADCp10), 50th (ADCp50), 90th (ADCp90), and 99th (ADCp99) percentiles of ADC.
2.5. Statistics analysis
Statistical analyses were conducted using SPSS Statistics version 25 (IBM) and R version 4.2.2 (http://www.r-project.org) statistical software. The Shapiro-Wilk test was used to determine data normality, and Levene's test was used for homogeneity of variance. The mean and standard deviation (SD) were used to describe continuous variables with a normal distribution, and compared with the student t-test. The median and interquartile ranges (IQRs) were used to describe continuous variables with a non-normal distribution, and compared with the Mann-Whitney U-test. The chi-square or Fisher's exact test was used to compare categorical variables, and the results are expressed as numbers and percentages of patients. The variables of imaging with p < 0.05 in univariate analysis were included in the multivariate logistic regression analysis (forward LR) to determine the independent factors for distinguishing soft tissue RT and RMS. For each risk factor, odds ratios (OR) were calculated as relative risk estimates with 95% confidence intervals (CI). Additionally, Cohen's kappa was used to calculate the inter-observer agreement between the two radiologists. A two-tailed p < 0.05 was considered to be statistically significant.
2.6. Model development and validation, and evaluation
Combining independent predictors identified by multivariate logistic regression (forward LR) to form a model for discriminating between soft tissue RT and RMS. To verify the accuracy of the model, bootstrapping resampling was performed 1,000 times, and the results were visualized using nomograms. The sensitivity, specificity, and area under the receiver operating characteristic (ROC) curve (AUC) were used to evaluate the model's discrimination. Calibration curve analysis was used to assess the consistency between the tumor types identified by the model and the actual tumor types. Additionally, decision curve analysis (DCA) was conducted to determine the clinical utility of the model by assessing the net benefits at various threshold probabilities. Kaplan–Meier (K–M) survival curves with the log-rank test were generated to evaluate the differences in survival rate between the two groups.
3. Results
3.1. Clinical and immunohistochemical findings
The clinical and immunohistochemical findings of soft tissue RT (n = 16) and RMS (n = 33) are presented in Table 2. There was no statistical difference in age (p = 0.518) or sex (p = 0.08) between the two groups. The incidence of limited motion of extremities in the soft tissue RT group was significantly higher than the RMS group (25% vs. 0%, p = 0.015). Immunohistochemically, the CK and EMA expression rates were significantly higher in soft tissue RT compared to RMS (93.3% vs. 13.8%, 92.9% vs. 15.0%, respectively, all p < 0.001). Of note, INI was expressed by all patients with RMS but not by those with soft tissue RT (100% vs. 0%, p < 0.001). Also, immunohistochemistry markers like MyoG, MyoD1, and DES were more often found to be positive in RMS patients than in soft tissue RT patients (all p < 0.001). The Ki-67 levels of soft tissue RT and RMS were 45.1 ± 28.7 and 57.8 ± 20.9, respectively (p = 0.095).
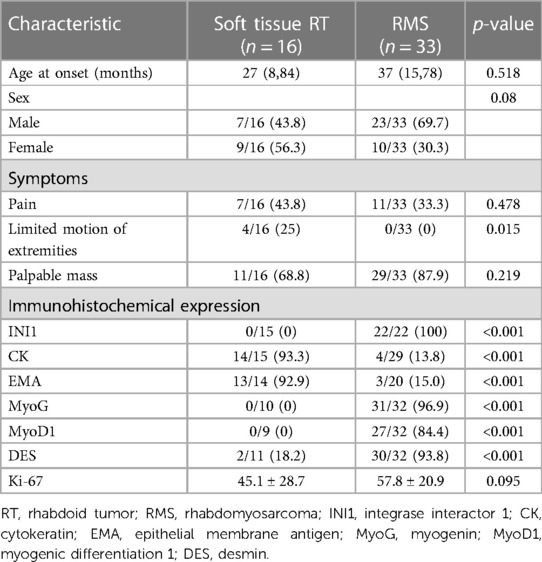
Table 2. Clinical and immunohistochemical characteristics of two groups.
3.2. Imaging features and ADC histogram parameters
There were no statistically significant differences in terms of tumor number, location, size, or shape between the two groups. The peripheral cyst (50% vs. 24.2%, p = 0.071), hemorrhage (12.5% vs. 12.1%, p > 0.999), and fatty degeneration (0% vs. 6.1%, p > 0.999) also did not differ between the soft tissue RT and RMS. Unclear margin and calcifications were more commonly found in the soft tissue RT group than in the RMS group (87.5% vs. 57.6%, 43.8% vs. 12.1%, respectively, all p < 0.05). Surrounding blood vessels and rim enhancement were more frequently observed in patients with RMS compared with soft tissue RT (51.5% vs. 18.8%, 63.6% vs. 18.8%, respectively, all p < 0.05). As shown in Table 3.
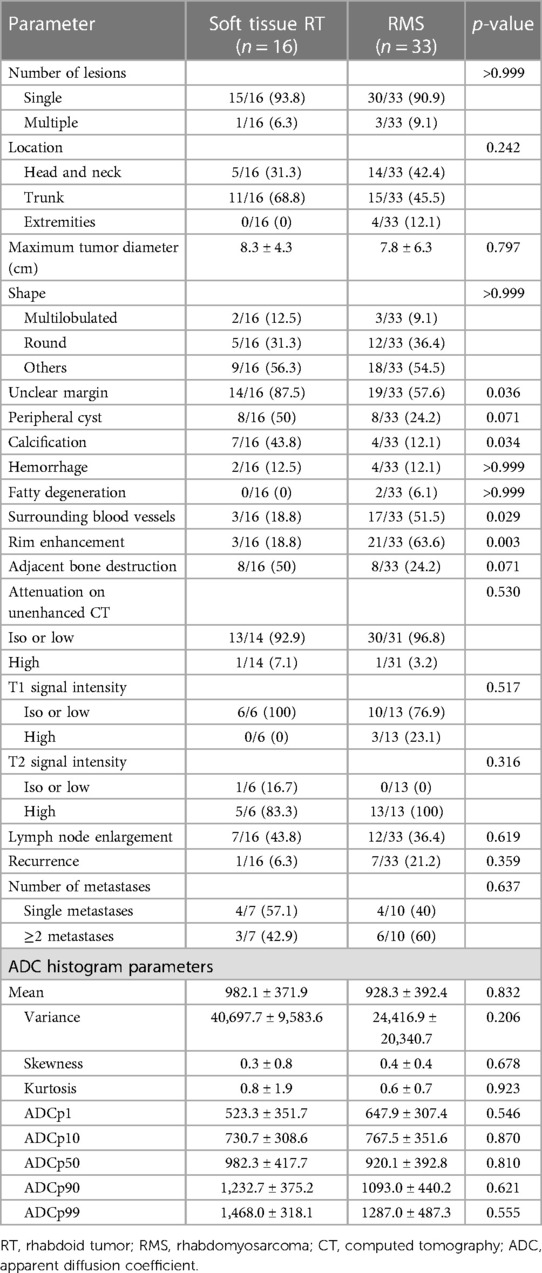
Table 3. Comparison of imaging and ADC histogram parameters of two groups.
On unenhanced CT images, thirteen patients with soft tissue RT exhibited iso- or hypodense relative to adjacent muscles (Figure 2), and only one exhibited hyperdense, which was not significantly different compared with RMS (Figure 3) (all p > 0.05). According to MRI characteristics, most cases in the two groups demonstrated Iso- or hypointense signal on T1-weighted MR images, and hyperintense signal on T2-weighted MR images (Figures 4, 5). Furthermore, none of ADC histogram parameters were statistically significant (all p > 0.05). Two radiologists evaluated subjective image indicators with an excellent degree of agreement (kappa values: 0.81–1).
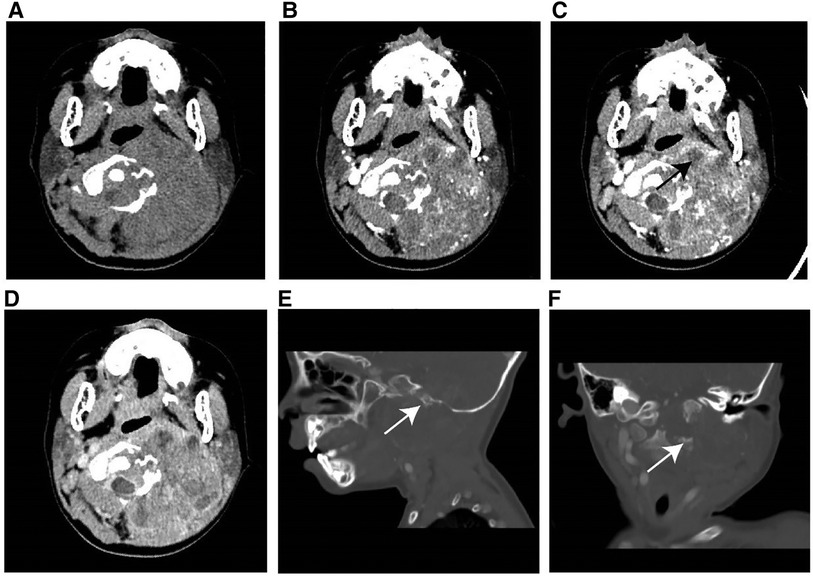
Figure 2. Typical instance of soft tissue RT in a female infant of 36 months (clinical manifestations: left neck swelling and pain for a month). (A) Non-enhanced CT scans revealed a moderately hypodense mass. (B–D) On multi-phase enhancement, the density of the tumor was higher than that of the adjacent muscle layer, with CT values for each period being around 56HU, 64HU, and 82HU, respectively. It showed heterogeneous enhancement and peripheral cyst (arrow). (E,F) Sagittal and coronal images revealed bone destruction in the adjacent skull base and multiple cervical vertebrae (arrow).
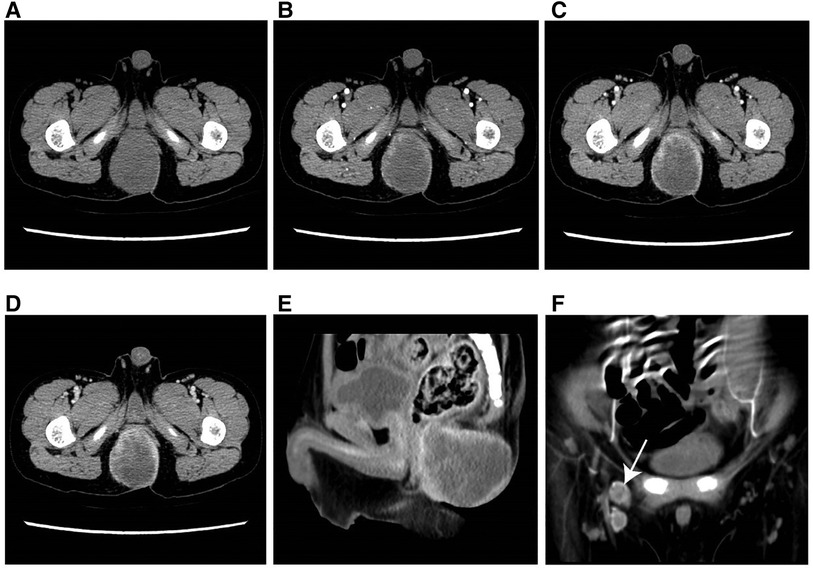
Figure 3. Typical example of RMS in a male infant aged 49 months (clinical manifestations: growing soft tisssue mass for 3 months). (A) The axial CT image revealed a well-defined, hypodense parenchymal mass measuring 47 mm in diameter. (B–D) On multi-phase enhancement, the CT values for each period were around 39 HU, 40 HU, and 60 HU, respectively, and displayed rim enhancement. (E) The sagittal CT image showed an indistinct boundary between the lesion and anterior rectum. (F) The coronal CT image presented enlarged lymph nodes in the right groin area (arrow).
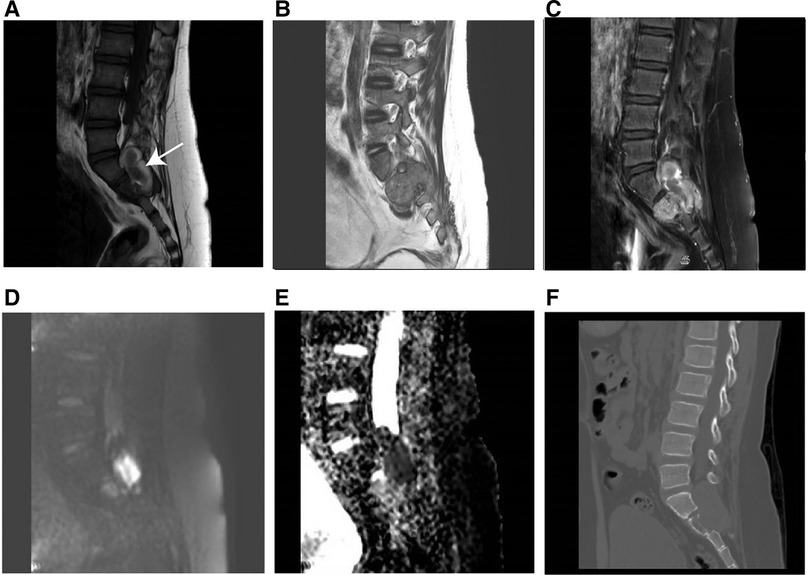
Figure 4. MR imaging results of soft tissue RT in a male of 90 months (clinical manifestations: sacrococcygeal paroxysmal pain for 1.5 years, gradually aggravated). (A) T1-weighted MR imaging indicated a moderately hypointense mass with hemorrhage (arrow). (B) T2weighted MR imaging showed a moderately hyperintense mass extending from the intervertebral foramen to the posterior right pelvic wall. (C) T1-weighted enhanced MR imaging revealed heterogeneous enhancement. (D) Hyperintensity on the DWI image. (E) The mean apparent diffusion coefficient (ADC) value of the mass was 0.722 × 10⁻³ mm2/s. (F) The sagittal CT image revealed vertebral bone destruction.
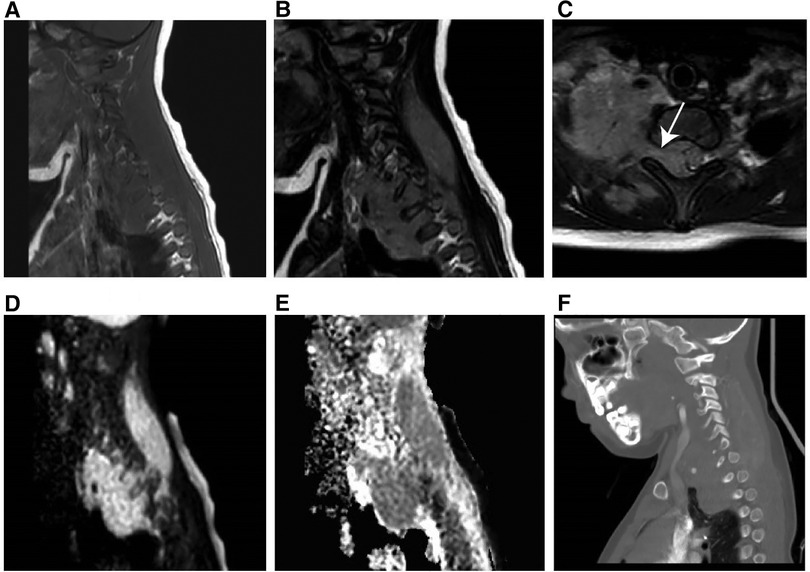
Figure 5. MR imaging results of a 60-month-old girl with RMS (clinical manifestations: unintentionally found a mass in the right neck for 20 days, accompanied by pain in the right upper limb for 15 days). (A) T1-weighted MR imaging revealed an isointense soft tissue mass. (B) T2-weighted MR imaging revealed a hyperintense mass. (C) Axial T2-weighted MR imaging revealed that the mass had expanded into the cone through the intervertebral foramen. (D) Hyperintensity on the DWI image. (E) The mean apparent diffusion coefficient value of the mass was 1.441 × 10⁻³ mm2/s. (F) The sagittal CT image revealed no obvious bone destruction.
3.3. Predictive value of imaging characteristics
In univariate analysis, four imaging features were significantly different between the two groups at a test level of p < 0.05 (Table 4). Based on multivariate logistic regression analysis (forward LR), an unclear margin (p-value, adjusted odds ratio [95% confidence interval]: 0.03, 7.96 [1.23, 51.67]), calcification (0.012, 30.37 [2.09, 440.70]) were independent differential factors for predicting soft tissue RT over RMS; rim enhancement (0.007, 0.05 [0.01, 0.43]) were independent differential factors for predicting RMS over soft tissue RT.
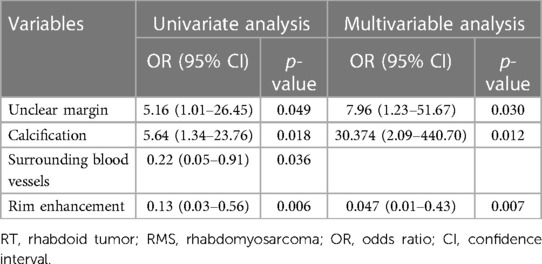
Table 4. Results of binary logistic regression analyses for differentiating soft tissue RT from RMS.
3.4. Model development, evaluation and visualization
The nomogram was developed using the significant variables to make predictions about the occurrence of soft tissue RTs (Figure 6A). The results of further ROC curve analysis revealed that the area under the curve (AUC) was 0.872 with 81.8% specificity and 81.3% sensitivity, indicating excellent diagnostic performance (Figure 6B). Calibration curves (Figure 6C) demonstrated that the nomogram accurately estimated the agreement between observed outcome frequencies and predicted probabilities. Additionally, the DCA curve (Figure 6D) showed a high clinical net benefit over the “treat-all” or “treat-none” strategies and was of clinical application.
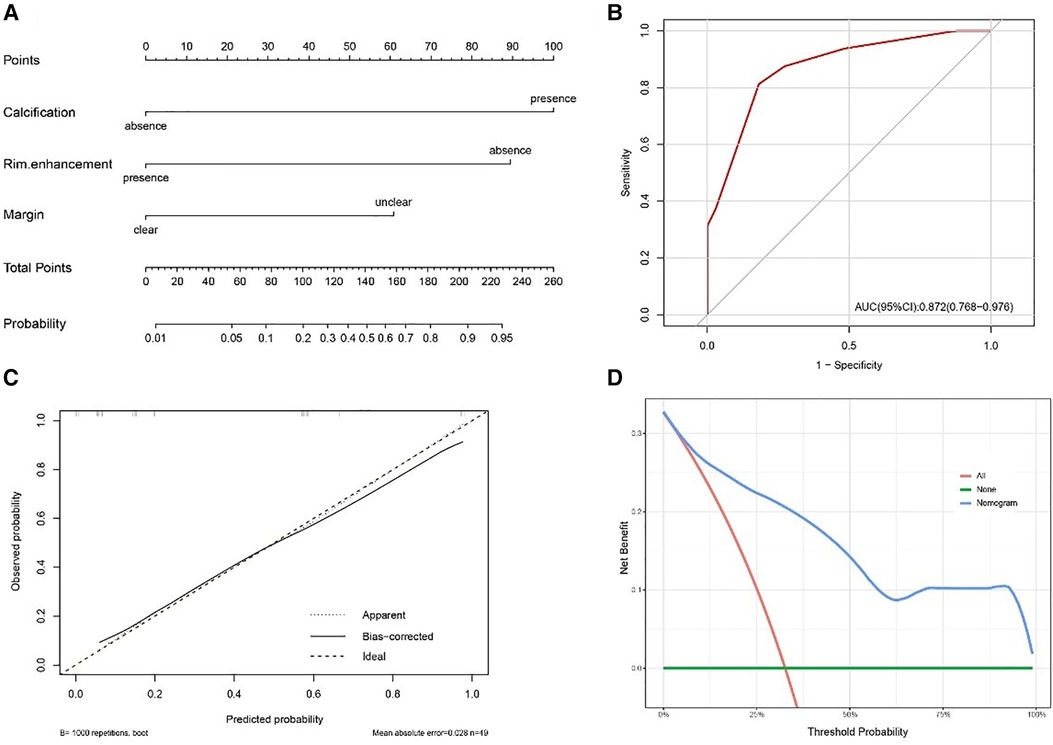
Figure 6. (A) Nomogram for distinguishing soft tissue RT from RMS. (B) The receiver operating characteristic curve (ROC) for the model. (C) The calibration plot for the model. (D) The decision curve analysis (DCA) for the model.
3.5. Follow-up
The final follow-up date was December 2022, with a median follow-up time of 53 months. Clinical assessment and follow-up imaging revealed that recurrences occurred in 6.3% (1/16) of soft tissue RT patients and 21.2% (7/33) of RMS patients, with a mean time to recurrence of 19 vs. 16 months after diagnosis. Among the 43.8% (7/16) patients in the soft tissue RT group who had metastasis, 57.1% (4/7) had lung metastasis and 42.9% (3/7) had other metastatic locations, such as bone, lymph nodes, the omentum, etc. However, the bone (3/10) is the most common metastatic site for RMS patients, followed by the lung, lymph nodes, central nervous system, etc. The 3-year OS rate of the patients with RT were significantly lower than those of the patients with RMS (22.6% vs. 90.8%, p < 0.01). Furthermore, the median survival time for RT patients is only 14 months (Figure 7).
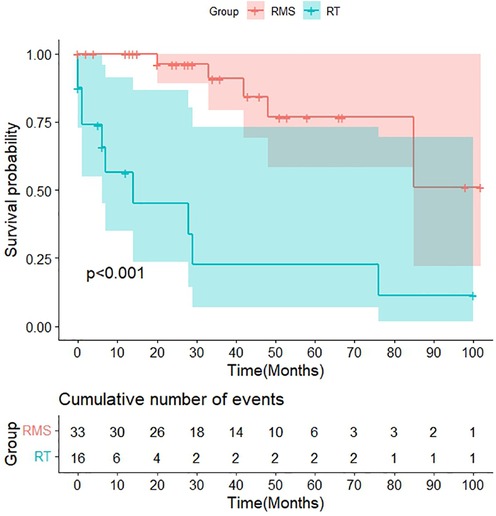
Figure 7. Survival curves of soft tissue RT and RMS.
4. Discussion
Differentiating soft tissue RT from RMS is crucial for clinicians but difficult because there are many similar features between the two types. CT and MRI examinations, as noninvasive methods, have been widely used for preoperative diagnoses and evaluation of soft tissue tumors. Therefore, the present study aimed to identify reliable imaging factors that can best distinguish soft tissue RT from RMS through statistical analysis. The results of our study indicated that margin, calcification, and rim enhancement contributed significantly and independently to differential diagnosis between the two groups. Based on the three identified independent predictors, a multivariate logistic regression model was established, which showed high sensitivity (0.813) and specificity (0.818), indicating that these imaging features could achieve an excellent differential diagnostic performance for distinguishing soft tissue RT from RMS.
Univariate analysis showed the median age of patients with soft tissue RT was 27 months, and 56.3% (9/16) of patients were female, with the main clinical symptoms as palpable soft tissue masses (68.8%), which were consistent with previous reports (7, 12). Individuals with soft tissue RT are more likely than RMS patients to occur limited motion of extremities, possibly since soft tissue RT occurs frequently in deep axial locations, putting pressure on the spinal cord (13, 14). Our study found that 87.5% of RT tumors were in deep axial locations, while only 21.2% of RMS tumors were. Typically, RT cells were positive for epithelial markers and negative for muscle-derived markers, which is the exact opposite of the tumor of RMS (13, 15). Notably, the absence of the INI1 protein expression often used by pathologists to diagnose malignant rhabdoid tumors (16, 17). The WHO did not recommend using INI1 or a rare Brahma-related gene-1 (BRG1) mutation to diagnose AT/RT until 2016, and other types of RT are still waiting for clear regulations to adopt this method of diagnosis (18). Our pathological findings revealed that INI1 expression was absent in all patients except for one who was not tested, possibly because his symptoms appeared as early as 2011 when the INI1 gene was not seen as significant.
Owing to their rarity, radiological descriptions of soft tissue RTs in the current literature are few and non-specific, making identification challenging, despite several common imaging characteristics have been reported. Soft tissue RT mainly manifests as a large, heterogeneous, low-density mass that was hypo- to isointense to muscle on T1WI and hyperintense to muscle on T2WI, often with areas of necrosis (6, 19, 20). Cheng et al. reported that the median maximal diameter in 21 soft tissue RT patients was 7.4 cm (IQR: 4.8–11.8) (21). In our study, the median maximum diameters of the soft tissue RT group were 7.7 cm (IQR: 5.0–10.5), and more than 90% of patients showed iso- to hypodensity on unenhanced CT. Large or rapidly growing tumors are susceptible to tumor necrosis due to inadequate perfusion and oxygenation (22, 23). According to the results of our investigation, cystic necrosis was ineffective in distinguishing between soft tissue RT and RMS, probably because both had large tumor sizes that were not statistically different. Six soft tissue RT patients received MRI examinations, and the T1WI and T2WI signals were comparable to those previously reported.
Compared to RMS, soft tissue RT more frequently showed unclear margin in the study. It is likely due to the fact that RMS originates from skeletal muscle cells, which have a highly ordered arrangement forming a bundle-like structure with clear boundaries (24). However, soft tissue RT is a tumor of undetermined differentiation and invasive growth in the surrounding area (25). Furthermore, the study demonstrated that calcification was more prevalent in soft tissue RT than in RMS. Several studies reported that RT was associated with hypercalcemia, which may be due to RT secreting parathyroid hormone-related peptide (PTH-rP) and easily involving bones (26, 27). In addition, the rapid growth and metabolism of malignant RT cells, as well as the excessive proliferation of blood vessels in the tumor, make calcium salt deposition possible (28). Most studies agree with us that calcification and hemorrhage are uncommon in children with RMS (29, 30). As shown in the study, 63.6% (21/33) of RMSs and 18.8% (3/16) of soft tissue RTs displayed rim enhancement, which contributed significantly to the differential diagnosis between the two groups, and functioned as an independent predictor. RMS contains abundant fibrous tissue, and the contrast agent slowly permeates into the tumor center over time, resulting in noticeable rim enhancement during the initial stages of enhancement (31). Another reason may be that surrounding blood vessels are more common in RMS than RT.
Both RMS and soft tissue RT patients exhibit high DWI signals and low ADC values due to their high malignancy, rapid proliferation, and high cell density, which restrict the diffusion of water molecules. The present study found that the average ADC value for soft tissue RT and RMS was 0.98 × 10⁻³ mm2/s vs. 0.93 × 10⁻³ mm2/s, which is consistent with some studies reporting the RMS ADC value of (0.78–1.21) × 10−3 mm2/s (32, 33). We extracted nine distinguishing factors from the ADC graph using the gray histogram analysis method. The mean value reflects the average intensity of the image; the variance reflects the discrete degree of the grayscale distribution of the image; Skewness reflects the skew direction and degree of image gray distribution; The 1st, 10th, 50th, 90th, and 99th percentiles are used to describe values of observations below a given percentile, reflecting small variations within the image (34). However, no ADC value parameter was statistically significant between the two groups.
Our study has several limitations. First, the design of a single-center retrospective study might make selection bias inevitable. Second, the small sample size limited the statistical power of our results, even though this is the largest imaging study to date on soft tissue RT. As RMS and soft tissue RT are uncommon disorders in children, future multi-center research with sizable sample sizes will be required to confirm these findings.
5. Conclusion
The rarity of soft tissue RT frequently poses a diagnostic dilemma for radiologists.
Specifically, soft tissue RT is difficult to identify preoperatively from RMS. Compared to RMS, soft tissue RT had an ill-defined margin, calcification, and no rim enhancement, as determined by our study's radiological findings. The combination of above imaging characteristics could offer clinicians with additional preoperative imaging diagnoses and allow them to select the most effective treatment.
Data availability statement
The raw data supporting the conclusions of this article will be made available by the authors, without undue reservation.
Ethics statement
This study was approved by Approval Letter of Ethics Review Committee, Children’s Hospital of Shanghai/Shanghai Children’s Hospital, Shanghai Jiao Tong University (Approval No: 2022R160-E01). Written informed consent for participation was not required for this study in accordance with the national legislation and the institutional requirements.
Author contributions
X-JY: study idea and design. JS, T-TL, H-FX, X-MC, Y-MW, and TH: data acquisition. JS, H-HZ, Q-QJ, and RX: analysis and data interpretation. JS: drafting of the manuscript. X-JY, T-TL, and H-HZ: critical revision. All authors contributed to the article and approved the submitted version.
Funding
This study was supported by the Special Key Project of Shanghai Children's Hospital (no. 2021YLYM03).
Conflict of interest
The authors declare that the research was conducted in the absence of any commercial or financial relationships that could be construed as a potential conflict of interest.
Publisher's note
All claims expressed in this article are solely those of the authors and do not necessarily represent those of their affiliated organizations, or those of the publisher, the editors and the reviewers. Any product that may be evaluated in this article, or claim that may be made by its manufacturer, is not guaranteed or endorsed by the publisher.
References
1. Finetti MA, Grabovska Y, Bailey S, Williamson D. Translational genomics of malignant rhabdoid tumours: current impact and future possibilities. Semin Cancer Biol. (2020) 61:30–41. doi: 10.1016/j.semcancer.2019.1
2. Geller JI, Roth JJ, Biegel JA. Biology and treatment of rhabdoid tumor. Crit Rev Oncog. (2015) 20(3–4):199–216. doi: 10.1615/critrevoncog.2015013566
3. Bourdeaut F, Freneaux P, Thuille B, Bergeron C, Laurence V, Brugieres L, et al. Extra-renal non-cerebral rhabdoid tumours. Pediatr Blood Cancer. (2008) 51(3):363–8. doi: 10.1002/pbc.21632
4. Cai W, Liu X, Ge W, Wu D, Xu J, Bai R, et al. Factors affecting the outcomes of patients with malignant rhabdoid tumors: a population-based study. Int J Med Sci. (2021) 18(4):911–20. doi: 10.7150/ijms.51186
5. Kubota Y, Arakawa Y, Sekiguchi M, Watanabe K, Hiwatari M, Kishimoto H, et al. A case of malignant rhabdoid tumor mimicking yolk sac tumor. Pediatr Blood Cancer. (2019) 66(8):e27784. doi: 10.1002/pbc.27784
6. Inarejos Clemente EJ, Navallas M, Barber Martinez de la Torre I, Sunol M, Munuera Del Cerro J, Torner F, et al. MRI Of rhabdomyosarcoma and other soft-tissue sarcomas in children. Radiographics. (2020) 40(3):791–814. doi: 10.1148/rg.2020190119
7. Xie S, Yang J, Ma Y, Li K, Dong K, Yao W. Analysis on diagnosis and treatments of 16 cases of extracranial malignant rhabdoid tumor in children. Transl Cancer Res. (2022) 11(4):629–38. doi: 10.21037/tcr-21-2548
8. Vaarwerk B, van der Lee JH, Breunis WB, Orbach D, Chisholm JC, Cozic N, et al. Prognostic relevance of early radiologic response to induction chemotherapy in pediatric rhabdomyosarcoma: a report from the international society of pediatric oncology malignant mesenchymal tumor 95 study. Cancer. (2018) 124(5):1016–24. doi: 10.1002/cncr.31157
9. Nemes K, Bens S, Kachanov D, Teleshova M, Hauser P, Simon T, et al. Clinical and genetic risk factors define two risk groups of extracranial malignant rhabdoid tumours (eMRT/RTK). Eur J Cancer. (2021) 142:112–22. doi: 10.1016/j.ejca.2020.10.004
10. Madigan CE, Armenian SH, Malogolowkin MH, Mascarenhas L. Extracranial malignant rhabdoid tumors in childhood: the childrens hospital Los Angeles experience. Cancer. (2007) 110(9):2061–6. doi: 10.1002/cncr.23020
11. Hazarika M, Rahman T, Sarma A, Krishnatreya M. Malignant rhabdoid tumor of the tongue: a rare occurrence. J Oral Maxillofac Pathol. (2014) 18(2):312–4. doi: 10.4103/0973-029X.140921
12. Oda Y, Tsuneyoshi M. Extrarenal rhabdoid tumors of soft tissue: clinicopathological and molecular genetic review and distinction from other soft-tissue sarcomas with rhabdoid features. Pathol Int. (2006) 56(6):287–95. doi: 10.1111/j.1440-1827.2006.01962.x
13. Nishimoto T, Nomura S, Fukano R, Kimura T, Ikeda E, Suzuki M. A primary extradural malignant rhabdoid tumor at the craniovertebral junction in a 3-year-old boy. Childs Nerv Syst. (2018) 34(2):367–71. doi: 10.1007/s00381-017-3631-7
14. Ye H, Liu Z, Zhang Y. Malignant rhabdoid tumor of the liver in a middle-aged woman: a case report and literature review. BMC Gastroenterol. (2022) 22(1):28. doi: 10.1186/s12876-022-02102-6
15. Lo WL, Huang WH, Yeh CF. Clinicopathological features and prognostic factors of sinonasal rhabdomyosarcoma. In Vivo. (2022) 36(6):2965–72. doi: 10.21873/invivo.13040
16. Custers L, Khabirova E, Coorens THH, Oliver TRW, Calandrini C, Young MD, et al. Somatic mutations and single-cell transcriptomes reveal the root of malignant rhabdoid tumours. Nat Commun. (2021) 12(1):1407. doi: 10.1038/s41467-021-21675-6
17. Ho KC, Lee JJ, Lin CH, Leung CH, Cheng SP. Loss of integrase interactor 1 (INI1) expression in a subset of differentiated thyroid cancer. Diagnostics (Basel). (2020) 10(5):280. doi: 10.3390/diagnostics10050280
18. Ma XJ, Li D, Wang L, Hao SY, Zhang LW, Zhang JT, et al. Overall survival of primary intracranial atypical teratoid rhabdoid tumor following multimodal treatment: a pooled analysis of individual patient data. Neurosurg Rev. (2020) 43(1):281–92. doi: 10.1007/s10143-018-1055-9
19. Chung CT, Liu YL, Cheng CJ, Hsieh KL, Tsai ML, Wong TT. Extrarenal rhabdoid tumor presented with an immobile arm in a one-year-old boy. Brain Dev. (2017) 39(8):717–21. doi: 10.1016/j.braindev.2017.04.001
20. Ginat DT, Cipriani NA, Purakal A, Fitzpatrick C, Paral K, Krausz T, et al. Disseminated malignant rhabdoid tumor of the head and neck. Head Neck Pathol. (2017) 11(2):224–7. doi: 10.1007/s12105-016-0754-1
21. Cheng H, Yang S, Cai S, Ma X, Qin H, Zhang W, et al. Clinical and prognostic characteristics of 53 cases of extracranial malignant rhabdoid tumor in children. A single-institute experience from 2007 to 2017. Oncologist. (2019) 24(7):e551–8. doi: 10.1634/theoncologist.2018-0416
22. Hou J, Zhao R, Xia W, Chang CW, You Y, Hsu JM, et al. PD-L1-mediated gasdermin C expression switches apoptosis to pyroptosis in cancer cells and facilitates tumour necrosis. Nat Cell Biol. (2020) 22(10):1264–75. doi: 10.1038/s41556-020-0575-z
23. Hou J, Hsu JM, Hung MC. Molecular mechanisms and functions of pyroptosis in inflammation and antitumor immunity. Mol Cell. (2021) 81(22):4579–90. doi: 10.1016/j.molcel.2021.09.003
24. Xu C, Hong Y. Rational design of biodegradable thermoplastic polyurethanes for tissue repair. Bioact Mater. (2022) 15:250–71. doi: 10.1016/j.bioactmat.2021.11.029
25. Murphey MD, Kransdorf MJ. Staging and classification of primary musculoskeletal bone and soft-tissue tumors according to the 2020 WHO update, from the AJR special series on cancer staging. AJR Am J Roentgenol. (2021) 217(5):1038–52. doi: 10.2214/AJR.21.25658
26. Callegaro-Filho D, Gershenson DM, Nick AM, Munsell MF, Ramirez PT, Eifel PJ, et al. Small cell carcinoma of the ovary-hypercalcemic type (SCCOHT): a review of 47 cases. Gynecol Oncol. (2016) 140(1):53–7. doi: 10.1016/j.ygyno.2015.11.004
27. Mastrandrea LD, Albini CH. Bisphosphonate treatment of tumor-induced hypercalcemia in a toddler: case report and review of related literature. Endocr Pract. (2006) 12(6):670–5. doi: 10.4158/EP.12.6.670
28. Zhu J, Li X, Wei X, Yang X, Zhao J, Zhang S, et al. The application value of modified thyroid imaging report and data system in diagnosing medullary thyroid carcinoma. Cancer Med. (2019) 8(7):3389–400. doi: 10.1002/cam4.2217
29. Tian L, Li X, Zheng H, Wang L, Qin Y, Cai J. Fisher discriminant model based on LASSO logistic regression for computed tomography imaging diagnosis of pelvic rhabdomyosarcoma in children. Sci Rep. (2022) 12(1):15631. doi: 10.1038/s41598-022-20051-8
30. Huang W, Zhang Y, Gao G, Li L, Yang Q, Qiu Y, et al. Multimodality imaging evaluation of nasal sinus alveolar rhabdomyosarcoma: two case reports. Front Med (Lausanne). (2022) 9:1047464. doi: 10.3389/fmed.2022.1047464
31. Iannella G, De Vincentiis M, Corsi A, Greco A, Magliulo G. A rare case of embryonal rhabdomyosarcoma of the parapharyngeal space. Acta Otorhinolaryngol Ital. (2017) 37(4):346–9. doi: 10.14639/0392-100X-1450
32. Parlak S, Gumeler E, Bulut E. Pediatric head and neck rhabdomyosarcoma; the role of MRI in differentiation from other common pediatric malignant head and neck tumors. Turk J Pediatr. (2022) 64(3):519–30. doi: 10.24953/turkjped.2021.4600
33. Norman G, Fayter D, Lewis-Light K, McHugh K, Levine D, Phillips B. Mind the gap: extent of use of diffusion-weighted MRI in children with rhabdomyosarcoma. Pediatr Radiol. (2015) 45(5):778–81. doi: 10.1007/s00247-014-3120-z
Keywords: computed tomography scan (CT scan), magnetic resonance imaging, rhabdoid tumor, rhabdomyosarcoma, differential diagnosis
Citation: Sheng J, Li T-T, Zhang H-H, Xu H-F, Cai X-M, Xu R, Ji Q-Q, Wu Y-M, Huang T and Yang X-J (2023) CT and MR imaging features of soft tissue rhabdoid tumor: compared with rhabdomyosarcoma in children. Front. Pediatr. 11:1199444. doi: 10.3389/fped.2023.1199444
Received: 3 April 2023; Accepted: 10 July 2023;
Published: 21 July 2023.
Edited by:
Yi Ji, Sichuan University, ChinaReviewed by:
Alessandro Inserra, Bambino Gesù Children's Hospital (IRCCS), ItalyMichael Vincent Ortiz, Memorial Sloan Kettering Cancer Center, United States
© 2023 Sheng, Li, Zhang, Xu, Cai, Xu, Ji, Wu, Huang and Yang. This is an open-access article distributed under the terms of the Creative Commons Attribution License (CC BY). The use, distribution or reproduction in other forums is permitted, provided the original author(s) and the copyright owner(s) are credited and that the original publication in this journal is cited, in accordance with accepted academic practice. No use, distribution or reproduction is permitted which does not comply with these terms.
*Correspondence: Xiu-Jun Yang d29vdGhpbmd5YW5nMjAwOEAxMjYuY29t
†These authors have contributed equally to this work and share first authorship