 Xiaolong Wu1†
 Jianpeng Liu2†Yue Duan1
 Shiyu Gao2Yao Lü2
 Xiaoheng Li2Qiqi Zhu2Xianwu Chen2Jing Lin2
 Leping Ye3*
 Ren-Shan Ge1,2*
- 1Department of Anesthesiology, The Second Affiliated Hospital and Yuying Children’s Hospital of Wenzhou Medical University, Wenzhou, China
- 2Center of Scientific Research, The Second Affiliated Hospital and Yuying Children’s Hospital of Wenzhou Medical University, Wenzhou, China
- 3Department of Pediatric Pulmonology, The Second Affiliated Hospital and Yuying Children’s Hospital of Wenzhou Medical University, Wenzhou, China
Background: Tributyltin (TBT) is widely used as an antifouling agent that may cause reproductive toxicity. The mechanism of TBT on Leydig cell development is still unknown. The objective of the present study was to investigate whether a brief exposure to low doses of TBT permanently affects Leydig cell development and to clarify the underlying mechanism.
Methods: Adult male Sprague Dawley rats were randomly assigned into four groups and gavaged normal saline (control), 0.1, 1.0, or 10.0 mg/kg/day TBT for a consecutive 10 days, respectively. At the end of TBT treatment, all rats received a single intraperitoneal injection of 75 mg/kg ethane dimethane sulfonate (EDS) to eliminate all of adult Leydig cells. Leydig cells began a developmental regeneration process on post-EDS day 35. The Leydig cell regeneration was evaluated by measuring serum testosterone, luteinizing hormone, and follicle-stimulating hormone levels on post-EDS day 7, 35, and 56, the expression levels of Leydig cell genes, Leydig cell morphology and number and proliferation on post-EDS day 56.
Results: TBT significantly reduced serum testosterone levels on post-EDS day 35 and 56 and increased serum luteinizing hormone and follicle-stimulating hormone levels on post-EDS day 56 at ≥1 mg/kg/day. Immunohistochemical staining showed that there were fewer regenerated Leydig cells in the TBT-treated testis on post-EDS day 56. Further study demonstrated that the mRNA or protein levels of Leydig (Lhcgr, Cyp11a1, Hsd3b1, Cyp17a1, and Hsd17b3) and Sertoli cells (Fshr, Dhh, and Sox9) were significantly down-regulated in the TBT-treated testes when compared to the control. Immunofluorescent staining showed that TBT inhibited Leydig cell proliferation as judged by the reduced number of proliferating cyclin nuclear antigen-positive Leydig cells on post-EDS day 35.
Conclusion: The present study demonstrated that a short-term TBT exposure blocked Leydig cell developmental regeneration process via down-regulating steroidogenesis-related proteins and inhibiting the proliferation of Leydig cells.
Introduction
Tributyltin chloride (TBT) has been extensively used in a variety of industrial products, as a wood preservative, biocide, and plastic stabilizer (Shawky and Emons, 1998). A widespread environmental contamination of TBT remains to date (Fent, 1996; Mitra et al., 2014). Human beings are exposed to TBT through the food ingestion (Mitra et al., 2014), dermal contact, and inhalation (Aluoch et al., 2007). TBT has been reported to cause the damage of many organs, including the testis. In the testis, the Leydig cell is also the target of TBT. In the isolated pig Leydig cells, TBT directly inhibited the last-step androgen biosynthetic enzyme, 17β-hydroxysteroid dehydrogenase 3 (HSD17B3, encoded by Hsd17b3) with the half maximal inhibitory concentration (IC50) of 114 nM (Ohno et al., 2005). TBT at 100 nM in vitro down-regulated the expression levels of cytochrome P450 17α-hydroxylase/20-lyase (CYP17A1, encoded by Cyp17a1) without affecting the expression levels of other steroidogenic enzymes such as cytochrome P450 cholesterol side chain cleavage enzyme (CYP11A1, encoded by Cyp11a1), 3β-hydroxysteroid dehydrogenase 1 (HSD3B1, encoded by Hsd3b1), and Hsd17b3 as well as the cholesterol-transporting protein, the steroidogenic acute regulatory protein (StAR, encoded by Star) (Nakajima et al., 2005). Immature male mice after a single oral exposure to 25, 50, or 100 mg/kg TBT had the lower expression levels of Cyp11a1, Hsd3b1, Cyp17a1, and Hsd17b3 in the testes at 50 and 100 mg/kg doses (Kim et al., 2008).
Leydig cells existing in the interstitial compartment of the testis are unique endocrine cells, primarily producing 95–99% of circulatory testosterone (Teerds et al., 2007). In the mature testis, a stable number of adult Leydig cells is maintained by a slow turn-over of Leydig cells via commitment of stem Leydig cells and their subsequent differentiation (Stanley et al., 2012). Interestingly, a rapid turn-over was achieved by a complete elimination after a single treatment of a chemical called ethane dimethane sulfonate (EDS) (Rommerts et al., 1988; Teerds et al., 1988; Vreeburg et al., 1988; Hu et al., 2010). Seven days after intraperitoneal injection of 75 mg/kg EDS to the adult rat, all of Leydig cells were eliminated, a developmental regeneration process began on post-EDS day 21 and completed on post-EDS day 56 to recover all of adult Leydig cells (Rommerts et al., 1988; Teerds et al., 1988; Vreeburg et al., 1988; Hu et al., 2010; Guo et al., 2013). Apparently, the developmental regeneration of Leydig cells was similar to the pubertal Leydig cell development with the appearance of progenitor Leydig cells on post-EDS day 21, differentiation into immature Leydig cells on post-EDS day 35, and maturation into adult Leydig cells on post-EDS day 56 (Guo et al., 2013; Zhang et al., 2015). This developmental regeneration process started from stem Leydig cells (Davidoff et al., 2004; Stanley et al., 2012). Therefore, it is a good model to study the effects of toxicants on the developmental process of Leydig cells in the adult testis. In the present study, we briefly exposed adult male rats to TBT for 10 days and then observed the impairment of Leydig cell developmental regeneration process later. The Leydig cell regeneration was evaluated by measuring serum testosterone, luteinizing hormone (LH), and follicle-stimulating hormone (FSH) levels on post-EDS day 7, 35, and 56, the expression levels of Leydig cell genes, Leydig cell morphology and number and proliferation on post-EDS day 56. We found that a short-term TBT exposure blocked Leydig cell developmental regeneration process via down-regulating steroidogenesis-related proteins and inhibiting the proliferation of Leydig cells, thus reducing testosterone levels.
Materials and Methods
Chemicals
TBT was obtained from Sigma-Aldrich (St. Louis, MO). SYBR Green qPCR Kit and BCA Protein Assay Kit was purchased from Takara (Otsu, Japan). Trizol was purchased from Invitrogen (Carlsbad, CA, United States). EDS was purchased from Pterosaur Biotech (Hangzhou, China). Immulite2000 Total Testosterone Kit was purchased from Sinopharm Group Medical Supply Chain Services Co., Ltd. (Hangzhou, Zhejiang, China). Radio immunoprecipitation assay (RIPA) buffer was obtained from Bocai Biotechnology (Shanghai, China).
Animal Administration
Fifty-four 51-day-old male Sprague-Dawley rats (Laboratory Animal Center of Wenzhou Medical University, Wenzhou, China) were raised in a 12 h dark/light cycle temperature at 23 ± 2°C and relative humidity of 45–55%. Water and food were provided ad libitum. Rats were adjusted to the new environment after their shipping for a week before they were randomly divided into four groups (18 animals per group). The rats were housed in IVC cages (three rats per cage) on soft chip bedding and provided pellet chow (Shanghai Laboratory Animal Center). TBT dissolved in normal saline was gavaged to rats. Rats in group 1 orally received normal saline as the control, while rats in group 2, 3, and 4 orally received low doses of 0.1, 1.0, or 10.0 mg/kg/day TBT, respectively. The treatments were consecutively conducted for 10 days.
EDS was dissolved in a mixture of dimethyl sulfoxide and deionized sterile water (1:3, v/v). At the end of TBT treatment, all rats received a single intraperitoneal injection of 75 mg/kg EDS to eliminate all Leydig cells. Rats (six animals each group) were sacrificed on post-EDS day 7, 35, and 56 by asphyxiation with CO2. Trunk blood was collected, placed in a gel glass tube, and centrifuged at 1500 × g for 10 min to collect serum samples. Serum samples were labeled and stored at -80°C until hormone [testosterone, luteinizing hormone (LH), and follicle-stimulating hormone (FSH)] analysis. Furthermore, each pair of testes was separated and weighted. One testis each animal was frozen in the liquid nitrogen and stored at -80°C for subsequent gene and protein expression level analysis. The contralateral testis was punched three holes using a G27 needle and then fixed in Bouin’s solution for immunohistochemical analysis. All studies were approved by the Wenzhou Medical University’s Animal Care and Use Committee.
RNA Isolation and Real-Time PCR (qPCR)
Total RNAs were purified from the testes using the Trizol Kit according to the manufacturer’s instructions, and the concentration of RNA was measured by reading OD value at 260 nm. The first strand (cDNA) was reversely transcribed and used as the template for qPCR analysis as previously described (Ge et al., 2005). The expression levels of Leydig (Lhcgr, Scarb1, Star, Cyp11a1, Hsd3b1, Cyp17a1, and Hsd17b3) and Sertoli cells (Fshr, Amh, Dhh, and Sox9) were measured using a SYBR Green qPCR Kit. The qPCR reaction mixture had 10 μl SYBR Green mix, 1.6 μl forward and reverse primer mix, 1 μg diluted cDNA sample, and 5–8 μl RNase-free water. The reaction was processed by the following program: 95°C for 5 min, followed by 40 cycles of 95°C for 10 s, and 60°C for 30 s. The Ct value was read and the expression level of a target gene was calculated using a standard curve method as previously described (Ge et al., 2005). The relative expression of testicular genes was normalized to β-Actin (Actb). The melting curve was examined for the quality of PCR amplification for each sample. The primers were listed in Supplementary Table S1.
Immunohistochemical Staining and Cell Counting
We used HSD3B1 as the biomarker of all Leydig cells and 11β-hydroxysteroid dehydrogenase 1 (HSD11B1) as the Leydig cells at the advanced stage (Guo et al., 2013), and SOX9 as the biomarker of Sertoli cells (Koopman, 1999). To enumerate number of HSD3B1-positive Leydig cells and SOX9-positive Sertoli cells, sampling of the testis was performed according to a fractionator technique as previously described (Mendis-Handagama et al., 1989). Briefly, six testes per group collected at each time point were randomly selected. Each testis was cut in eight parts as disks and two parts were randomly selected. Then, the two parts were cut into four pieces and one piece was randomly selected from total 8 pieces. The piece per testis was embedded in paraffin in a tissue array. Paraffin block was sectioned in 6-μm-thick sections. Approximately, ten sections were randomly selected from each testis per rat. Sections were used for immunohistochemical staining. Avidin-biotin immunohistochemical staining was performed according to the manufacturer’s instructions (Vector, Burlingame, CA, United States). Microwave heating in a citrate buffer (10 mM, pH 6.0) for 10 min was used for the antigen retrieval. The endogenous peroxidase was blocked with 0.5% of H2O2 in methanol for 30 min. Sections were incubated with an HSD3B1, HSD11B1 or SOX9 antibody (1:1000 dilution, v/v) for 1 h at room temperature. The antibody-antigen complexes were visualized with diaminobenzidine as the brown cytoplasmic staining for positively labeled Leydig cells and the brown nuclear staining for positively labeled Sertoli cells. The sections were counterstained with Mayer hematoxylin, dehydrated in graded concentrations of ethanol and cover-slipped with resin. Images were taken and total microscopic fields per section were counted. The total number of Leydig cells was calculated by multiplying the number of Leydig or Sertoli cells counted in a known fraction of the testis by the inverse of the sampling probability.
Computer-Assisted Image Analysis of Cell Size and Nuclear Size
Leydig cells were identified by staining HSD3B1 as above. The Leydig cell size, nuclear size, and cytoplasmic size were calculated as previously described (Liu et al., 2016). Five randomly selected fields in each of three non-adjacent sections per testis were captured using a BX53 Olympus microscope (Tokyo, Japan) equipped with digital camera interfaced to a computer. The images that were displayed on the monitor represented partial area of a testis. Cell size and nuclear size were estimated using the image analysis software (Image-Pro Plus; Media Cybernetics, Silver Spring, MD, United States). More than 50 Leydig cells were evaluated in each testis. The cell size and nuclear size and cytoplasmic size were calculated.
Semi-Quantitative Immunohistochemical Measurement of HSD11B1 and SOX9
HSD3B1 is a protein in Leydig cells (Ge and Hardy, 1998). SOX9 is a transcription factor in Sertoli cells for its function (Koopman, 1999). Immunohistochemical staining of HSD3B1 and SOX9 was performed as stated above. Target protein density and background area density were measured using the image analysis software (Image-Pro Plus; Media Cybernetics, Silver Spring, MD, United States) according to the manufacturer’s instruction. More than 50 Leydig or Sertoli cells were evaluated in each testis and the density of each sample was averaged.
Calculation of Leydig Cell Proliferation
The Leydig cell proliferation was judged by immunofluorescent staining of PCNA after the dual staining of PCNA (for proliferating cell) and HSD11B1 (the Leydig cells) in testis collected on post-EDS day 35, when the regenerated Leydig cells were at the stage of immature Leydig cell, with proliferating capacity (Guo et al., 2013). The sections in the tissue array assembled above were used. Sections were sequentially incubated with the primary antibodies of HSD11B1 and PCNA for 60 min. Then, the fluorescent secondary antibody (Alexa-conjugated anti-rabbit or anti-mouse IgG, 1:500) was used to label Leydig cells (HSD11B1, cytoplasmic staining in green color) and proliferating cells (PCNA, nuclear staining in red color). Images were taken with a fluorescent microscopy.
Western Blot
Testes were homogenized in the ice-cold PBS and then the homogenates were lysed with RIPA buffer to obtain proteins. The protein concentrations of samples were measured using BCA Protein Assay Kit in a plate reader. An aliquot of 30 μg protein each sample was electrophoresed in 10% polyacrylamide gels containing sodium dodecyl sulfate and then the separated proteins were electrically transferred onto the nitrocellulose membranes. The membranes were blocked with 5% non-fat milk in Tris-buffered saline Tween-20 buffer for 1 h. Then, the membranes were incubated with primary antibodies against LHCGR, SCARB1, CYP11A1, HSD3B1, CYP17A1, HSD11B1, FSHR, AMH, DHH, SOX9, and ACTB (listed in Supplementary Table S2) overnight at 4°C. The membranes were then washed and incubated with HRP-conjugated anti-rabbit or anti-goat IgG secondary antibody (1:5000, Bioword, United States) for 1 h at room temperature and washed three times. The immunoreactive bands were visualized by chemiluminescence using an ECL kit (Amersham, Arlington Heights, IL, United States). The intensity of band was analyzed with Image Lab software.
Statistical Analysis
All data are presented as the mean ± standard errors (SEM). Statistical significance was analyzed using one-way ANOVA followed by ad hoc Turkey’s multiple comparisons to the control. Statistical analysis was performed using GraphPad Prism (version 6, GraphPad Software Inc., San Diego, CA, United States). A p < 0.05 was considered statistically significant.
Results
General Parameters of TBT Toxicity
To analyze the general parameters of TBT toxicity, body weights were recorded before or at the end of TBT treatment as well as on post-EDS day 7, 35, and 56 (Table 1). Testis weights were recorded on post-EDS day 7, 35, and 56. TBT did not affect body and testis weights before post-EDS day 56 (Table 1). Interestingly, the body weight in 10 mg/kg TBT group was significantly lower than that of the control on post-EDS day 56. No mortalities and abnormal activities were observed in rats of any groups.
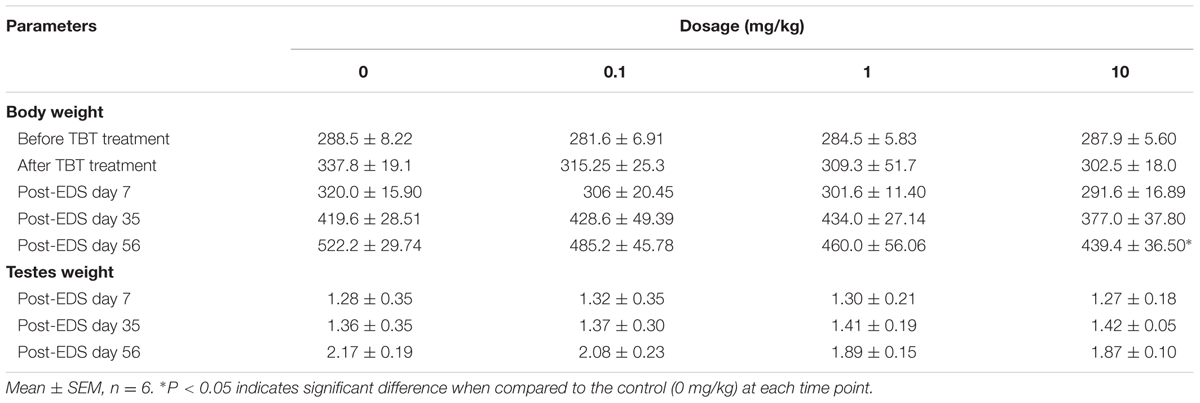
TABLE 1. General parameters of toxicology after treatment of tributyltin.
TBT Lowers Testosterone Levels
Sera were collected on post-EDS day 7, 35, and 56 for hormone (testosterone, LH, FSH) analysis (Figure 1). Serum testosterone levels in all groups were undetectable on post-EDS day 7, confirming that all Leydig cells were completely killed by EDS (Guo et al., 2013). Testosterone levels in all groups were gradually elevated on post-EDS day 35, confirming that Leydig cell developmental regeneration process progressed (Guo et al., 2013). TBT dose-dependently decreased testosterone levels with significant difference being observed at ≥1 mg/kg on post-EDS day 35 and at ≥0.1 mg/kg on post-EDS day 56 (Figure 1B). The results suggest that TBT delays Leydig cell developmental regeneration. Further analysis showed that TBT significantly increased serum LH and FSH levels at ≥1 mg/kg on post-EDS day 56 (Figures 1C,D), indicating that both Leydig cell function and spermatogenesis are damaged.
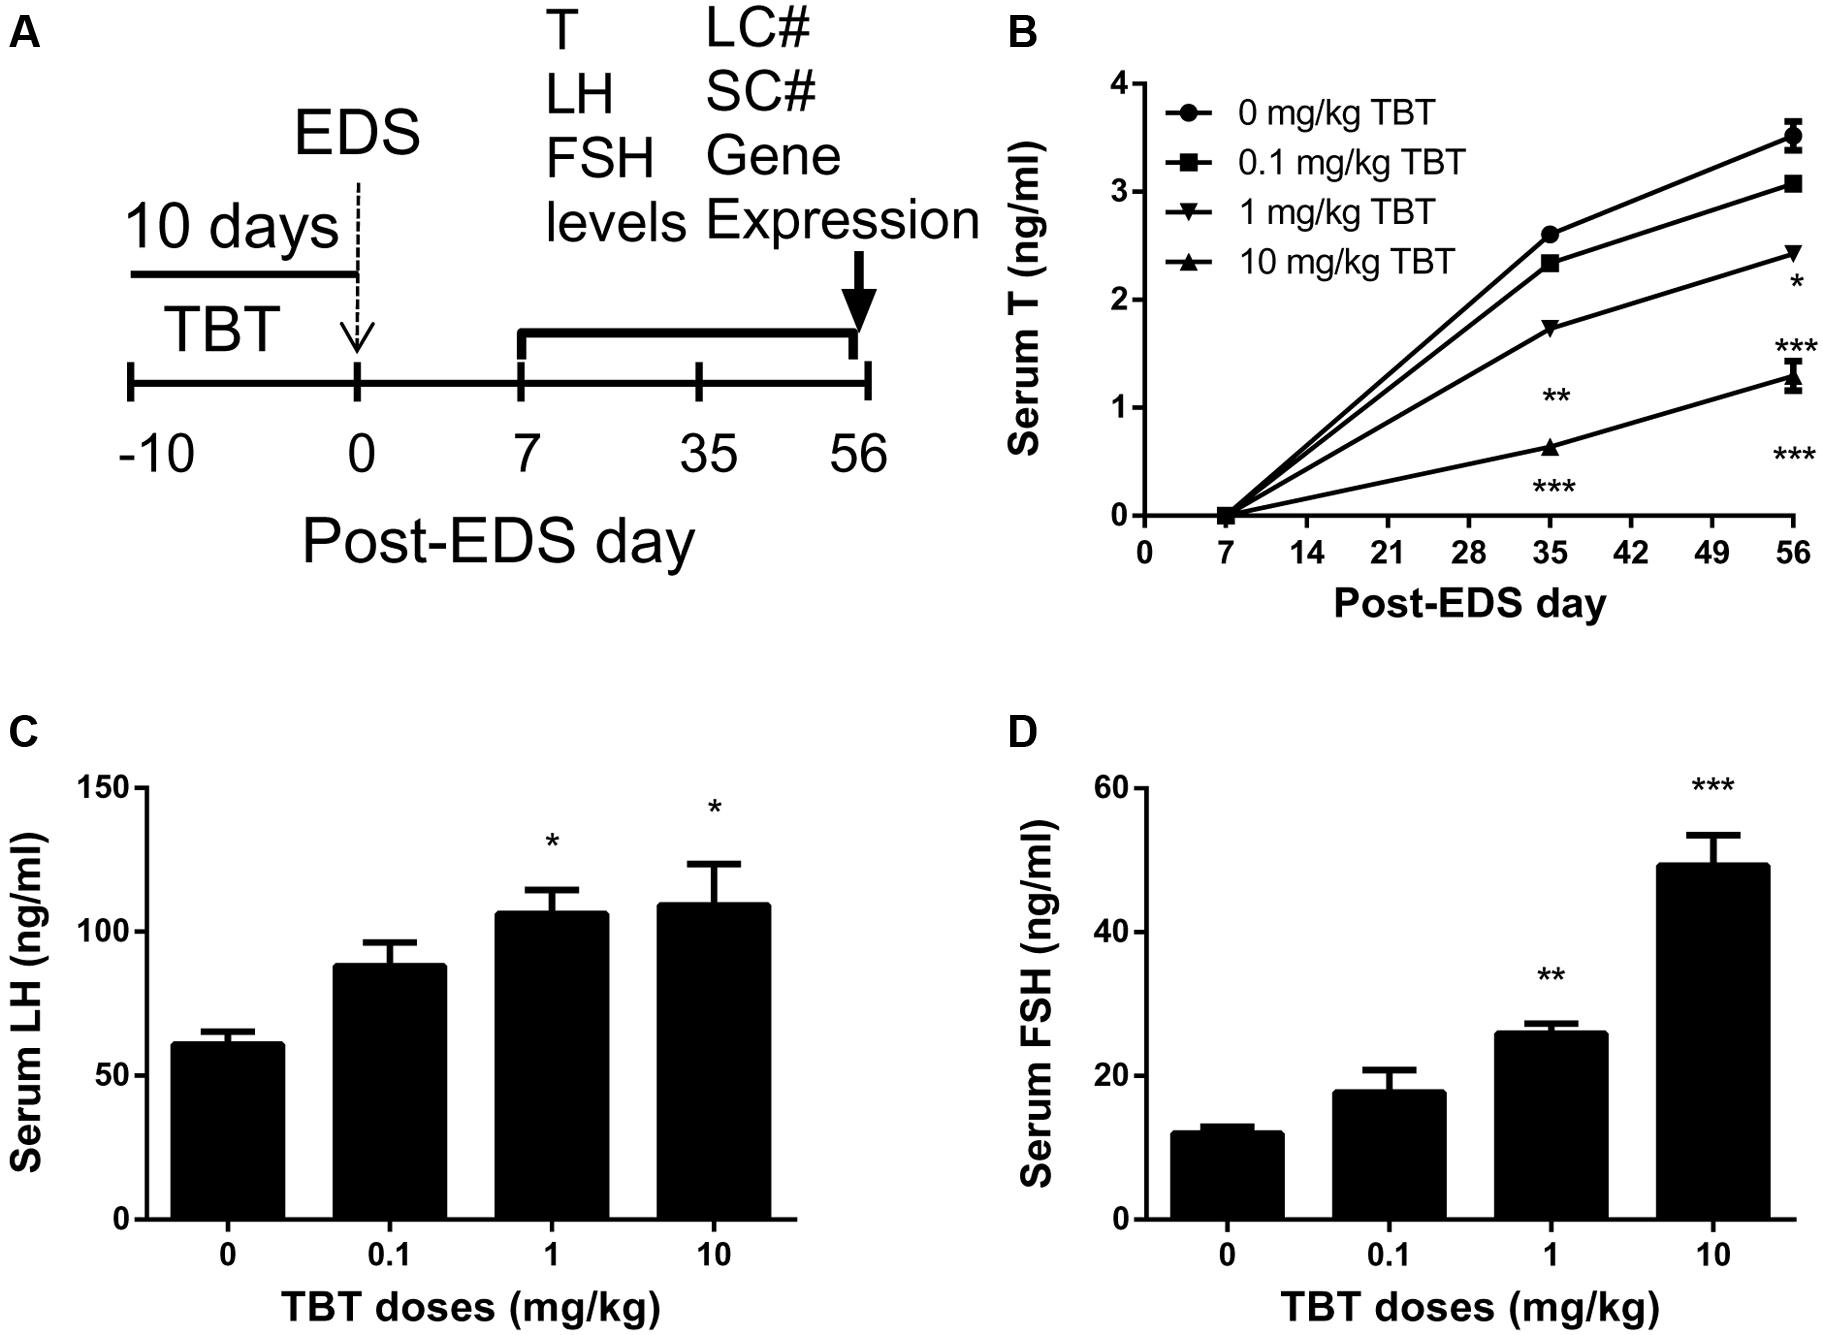
FIGURE 1. Serum levels of testosterone (T), luteinizing hormone (LH), and follicle-stimulating hormone (FSH) after tributyltin (TBT) exposure. (A) Experimental plan; (B) Serum T levels on post-EDS (ethane dimethane sulfonate) day 7, 35, and 56; (C) Serum LH levels on post-EDS day 56; (D) Serum FSH levels on post-EDS day 56. Mean ± SEM, n = 6. ∗, ∗∗, ∗∗∗ indicate significant difference when compared to the control (CON) at p < 0.05, 0.01, and 0.001, respectively.
TBT Reduces Leydig Cell Number
Leydig cells were stained by the biomarker, HSD3B1, on post-EDS day 56. Sertoli cells were stained by the biomarker, SOX9. When compared to the control, TBT dose-dependently decreased Leydig cell number (Figures 2A–C). However, Sertoli cell number did not change (Figures 2D–F). This indicates that TBT delays Leydig cell developmental regeneration process.
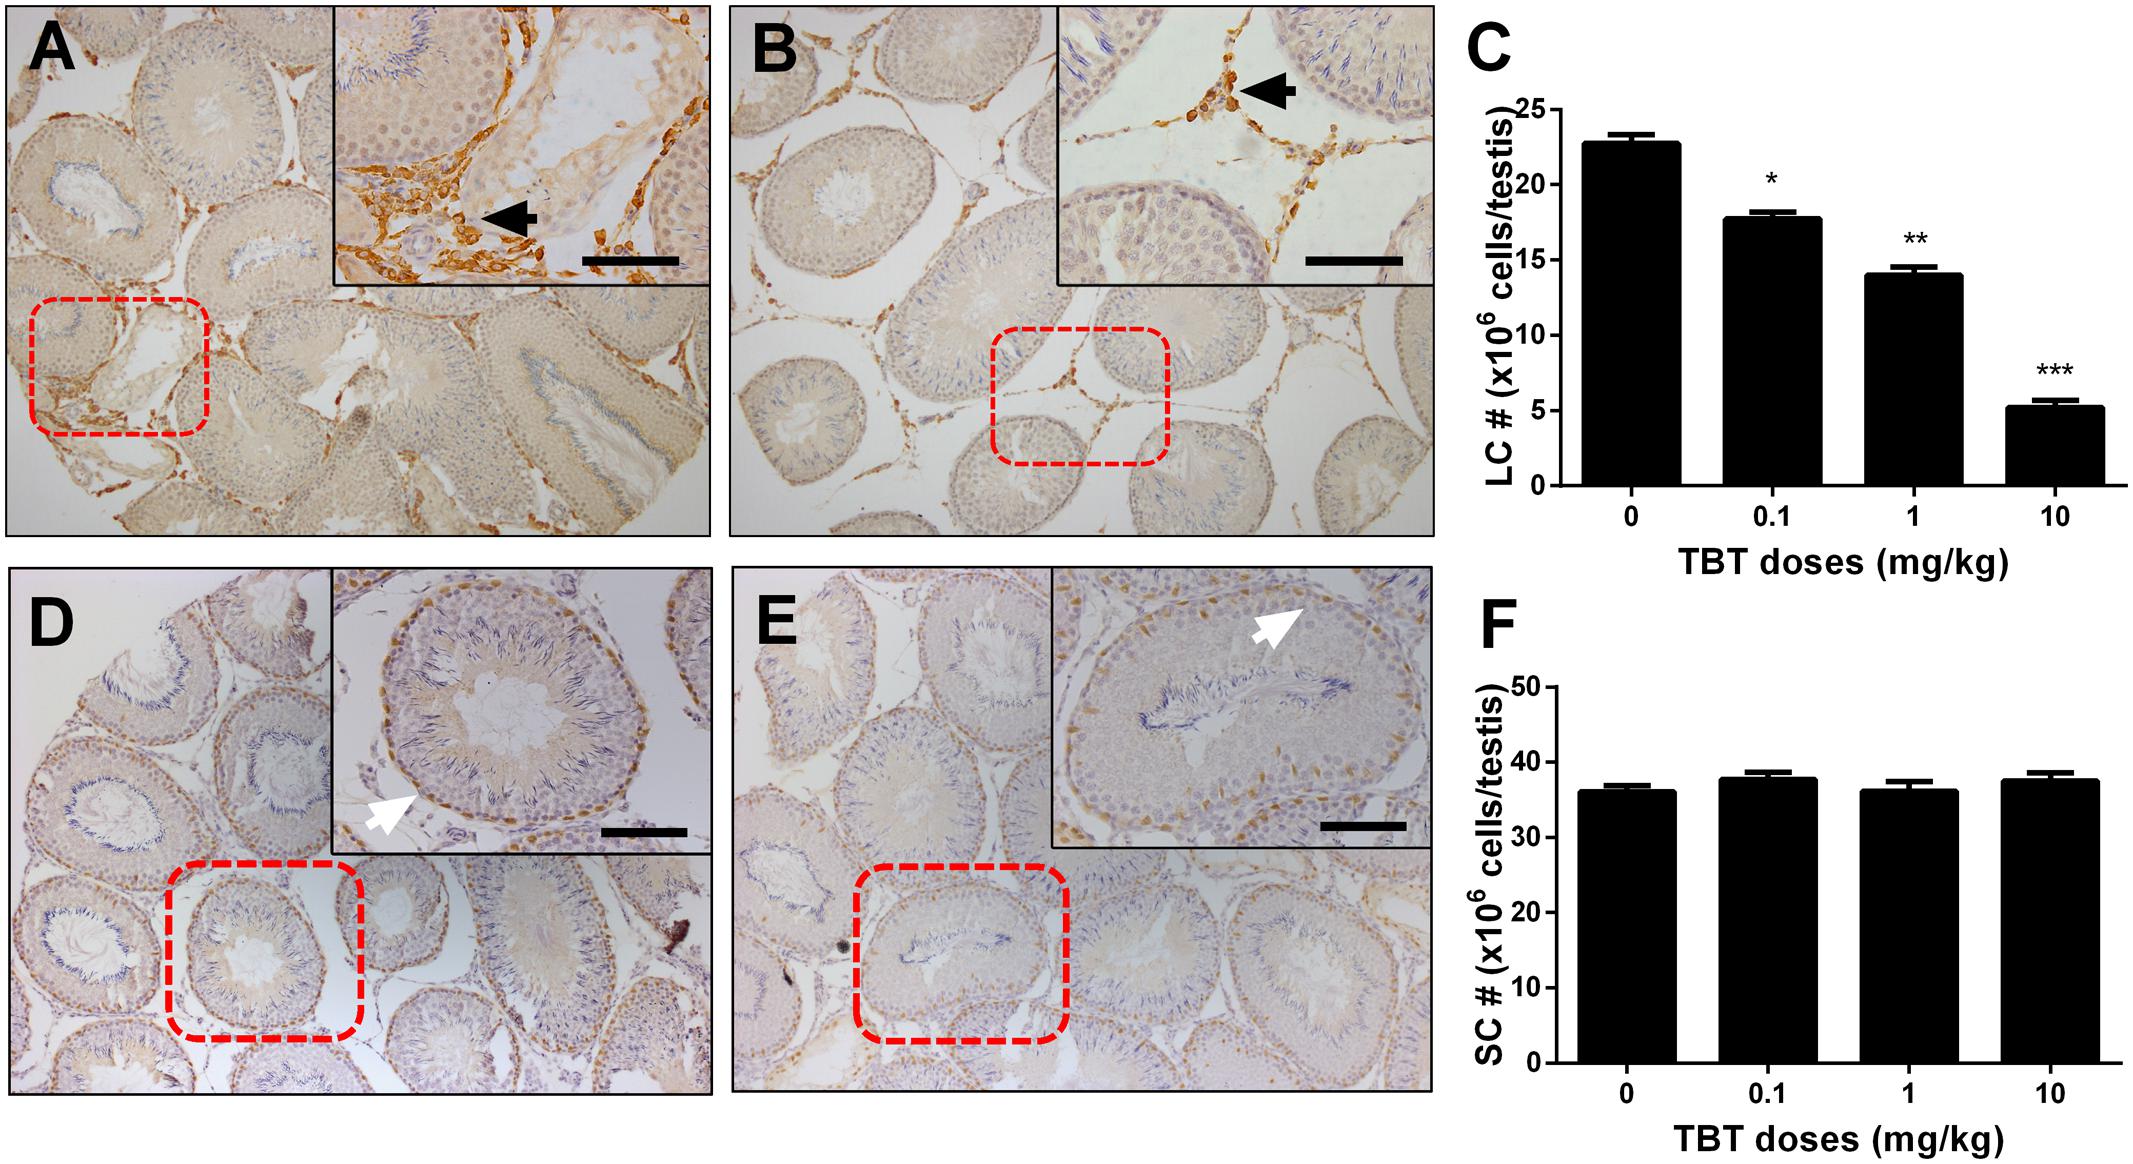
FIGURE 2. The effects of tributyltin (TBT) on Leydig cell (LC) and Sertoli cell (SC) number. Leydig cells were identified by immunohistochemical staining of 3β-hydroxysteroid dehydrogenase 1 (HSD3B1) and Sertoli cells were identified by staining of SOX9 in rat testis sections from post-EDS day 56 and enumerated by the stereological method. Images of HSD3B1 staining (with inserts): (A) control; (B) TBT 10.0 mg/kg dose. Bar = 50 μm. Black arrow points to Leydig cells. (C): quantification of Leydig cell (LC) number (#). Images of SOX9 staining (with inserts): (D) control; (E) TBT 10.0 mg/kg dose. Bar = 50 μm. White arrow points to Sertoli cells. (F): quantification of Sertoli cell (SC) number (#). Mean ± SEM, n = 6. ∗, ∗∗, ∗∗∗ indicate significant difference when compared to the control (TBT 0 mg/kg) at p < 0.05, 0.01, and 0.001, respectively.
TBT Down-Regulates Leydig and Sertoli Cell Gene Expressions
We measured the expression levels of Leydig (Lhcgr, Scarb1, Star, Cyp11a1, Hsd3b1, Cyp17a1, and Hsd17b3) and Sertoli (Fshr, Amh, Dhh, and Sox9) cell genes on post-EDS day 56. TBT dose-dependently down-regulated the expression levels of Leydig cell genes, including Lhcgr, Cyp11a1, Hsd3b1, and Hsd17b3 at ≥0.1 mg/kg and Cyp17a1 at ≥1 mg/kg without affecting the levels of Scarb1 and Star (Figure 3). TBT at 10 mg/kg also down-regulated Fshr, Dhh, and Sox9 gene expression levels in Sertoli cells while lower doses (0.1 and 1 mg/kg) of TBT did not affect the expression levels of these genes (Figure 3). These results suggest that both Leydig and Sertoli cells are affected by TBT and Leydig cells are more sensitive to TBT insult.
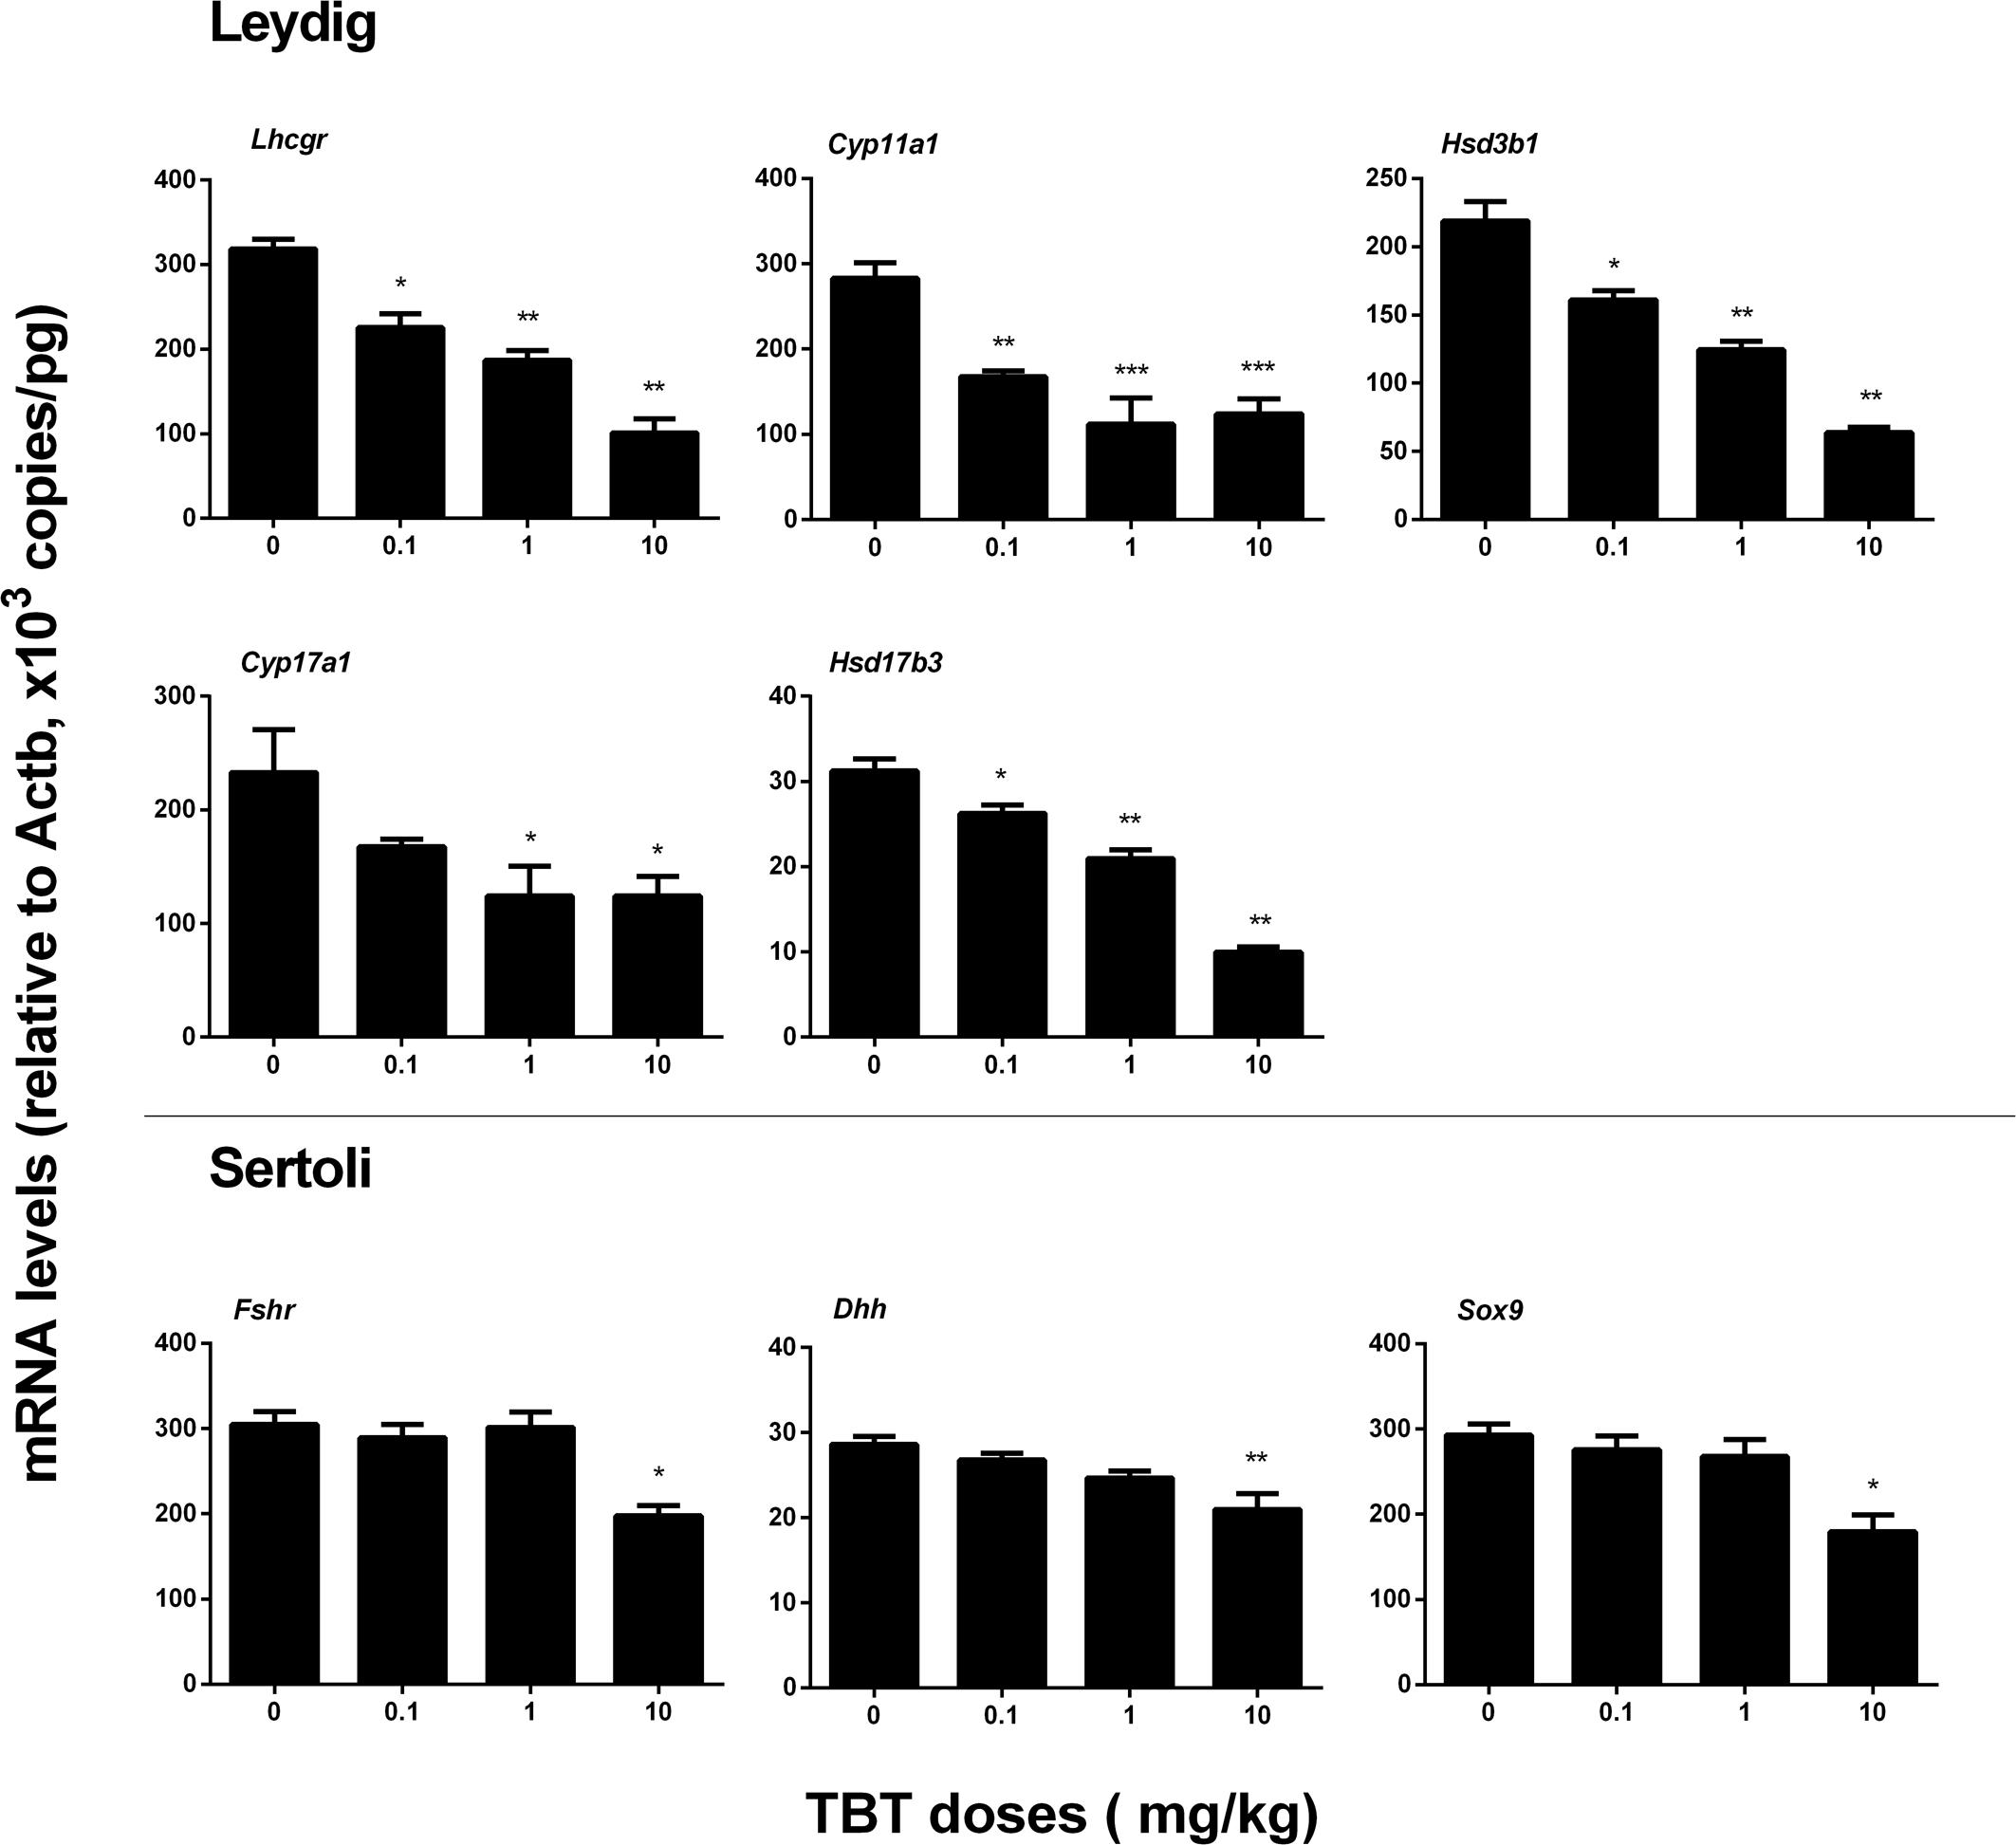
FIGURE 3. Expression levels of Leydig and Sertoli cell genes in the tributyltin (TBT)-treated testis on the post-EDS day 56. Leydig cell genes: Lhcgr, Cyp11a1, Hsd3b1, Cyp17a1, and Hsd17b3. Sertoli cell genes: Fshr, Dhh, and Sox9. Mean ± SEM, n = 6. ∗, ∗∗, ∗∗∗ indicate significant difference when compared to the control (TBT 0 mg/kg) at p < 0.05, 0.01, and 0.001, respectively.
TBT Reduces Protein Expression Levels in Leydig and Sertoli Cells
We measured the expression levels of Leydig (LHCGR, SCARB1, CYP11A1, HSD3B1, CYP17A1, and HSD11B1) and Sertoli (FSHR, AMH, DHH, and SOX9) cell proteins on post-EDS day 56. TBT lowered these protein levels in parallel with their mRNA expression levels (Figure 4). We further used a semi-quantitative analysis of HSD3B1 (Leydig cell biomarker) and SOX9 (Sertoli cell biomarker) densities in the individual cell and found that TBT lowered HSD3B1 level at ≥1 mg/kg and SOX9 level at 10 mg/kg (Figure 5). These results suggest that TBT impaired Leydig functions at both low and high doses but Sertoli cell functions only at high dose.
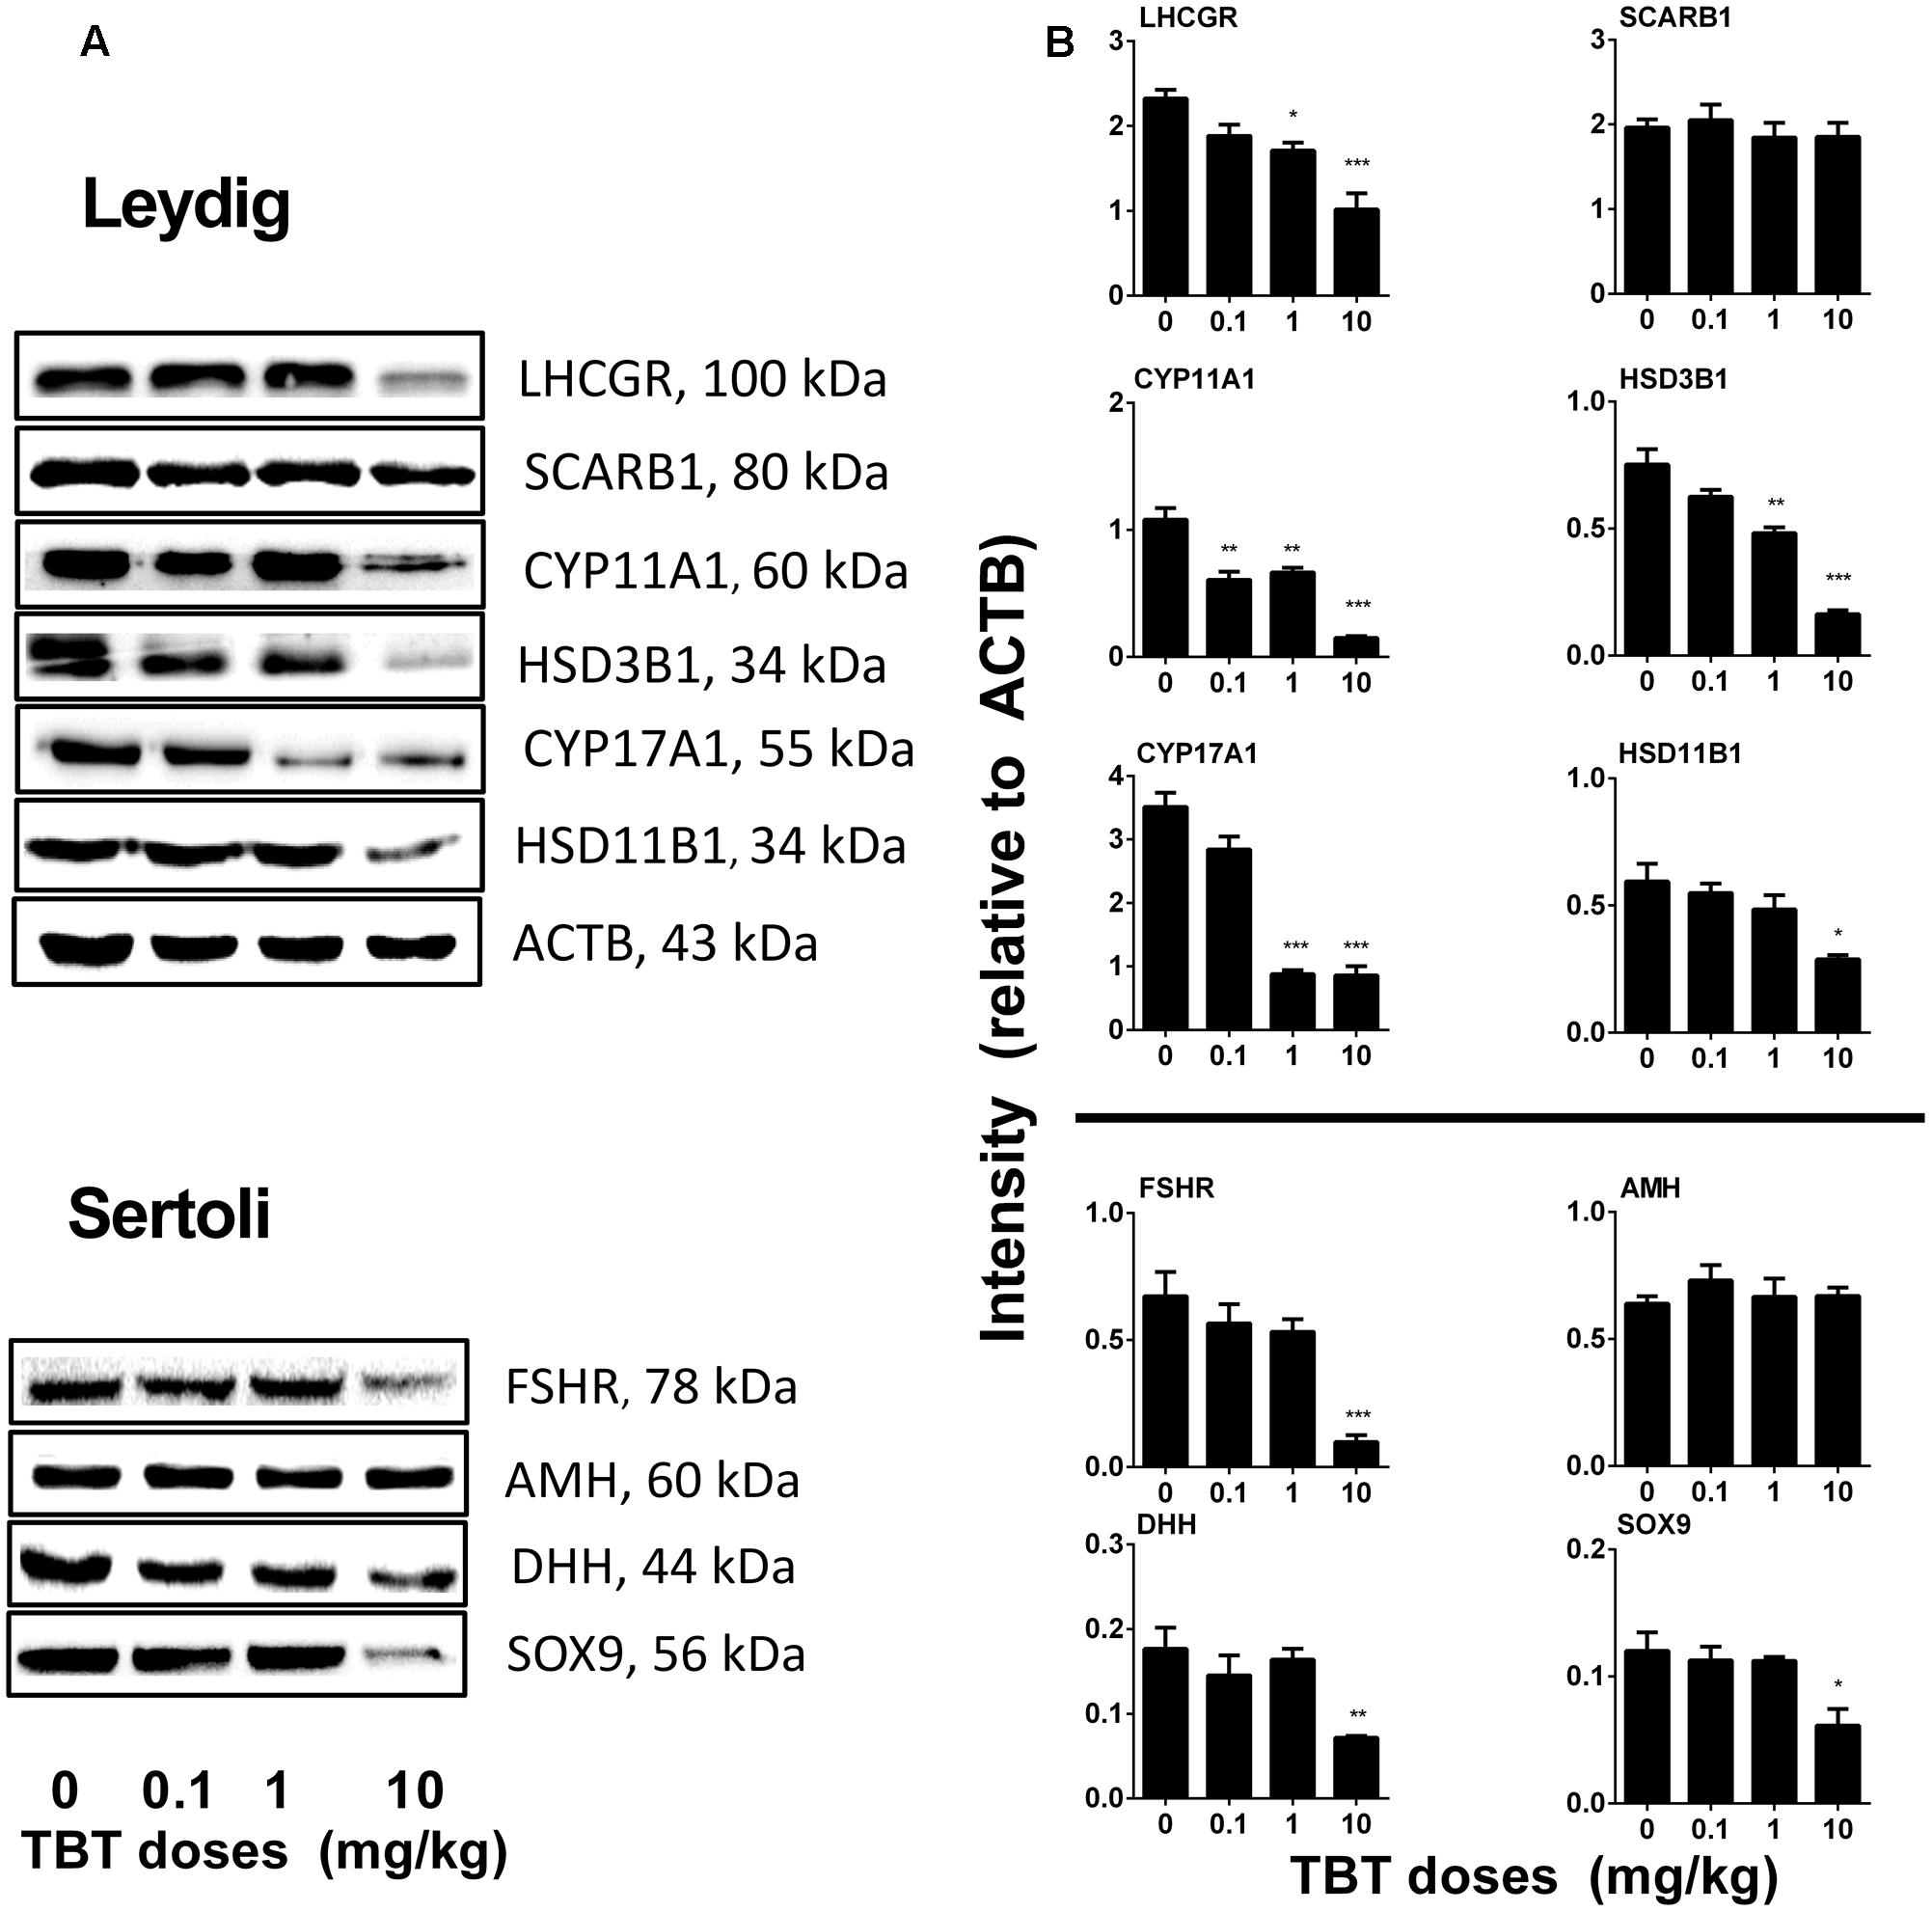
FIGURE 4. Expression levels of Leydig and Sertoli cell gene products in the tributyltin (TBT)-treated testis on the post-EDS day 56. (A):Gel images; (B): quantitative result. Leydig cell proteins: LHCGR, SCARB1, CYP11A1, HSD3B1, CYP17A1, and HSD11B1. Sertoli cell proteins: FSHR, AMH, DHH, and SOX9. Mean ± SEM, n = 3. ∗, ∗∗, ∗∗∗ indicate significant difference when compared to the control (TBT 0 mg/kg) at p < 0.05, 0.01, and 0.001, respectively.
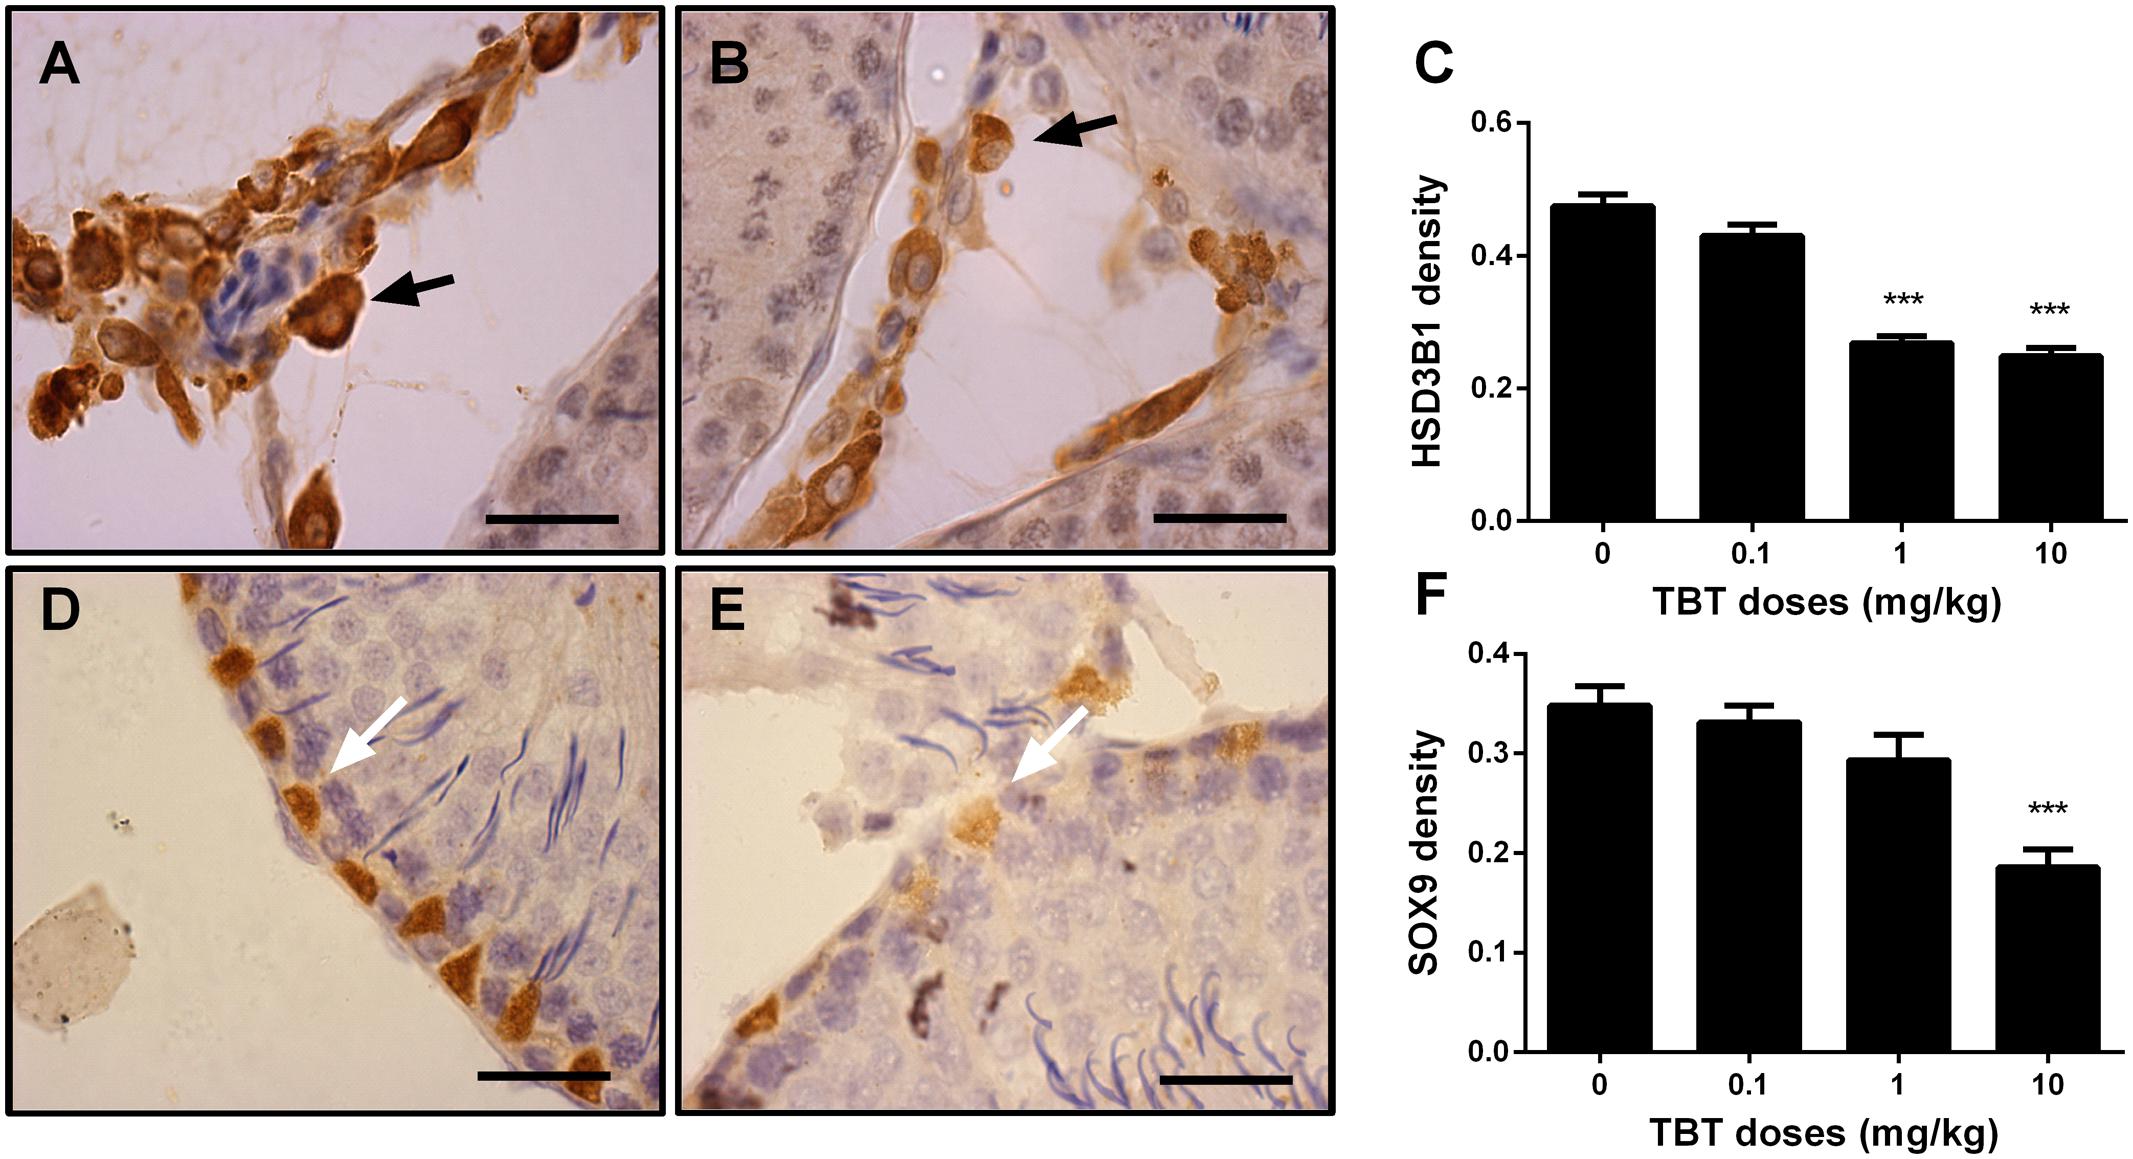
FIGURE 5. The semi-quantitative assay of 3β-hydroxysteroid dehydrogenase 1 (HSD3B1) and SOX9 in rat testis sections from post-EDS day 56. Images of HSD3B1 staining: (A) control; (B) TBT 10.0 mg/kg dose. Images of SOX staining: (D) control; (E) TBT 10.0 mg/kg dose. Black arrow points to HSD3B1 staining (cytoplasm); and white arrow points to SOX9 staining (nucleus). (C,F): quantification of density of HSD3B1 and SOX9, respectively. Mean ± SEM, n = 6. ∗, ∗∗, ∗∗∗ indicate significant difference when compared to the control (TBT 0 mg/kg) at p < 0.05, 0.01, and 0.001, respectively.
TBT Reduces Leydig Cell Size and Cytoplasmic Size
We measured cell size and cytoplasmic size of Leydig cells in the testis on post-EDS day 56 (Figure 6). TBT reduced Leydig cell size and cytoplasmic size at ≥0.1 mg/kg although it also reduced the nuclear size of Leydig cells at 10 mg/kg, indicating that Leydig cells after exposure to TBT are less mature than those in the control.
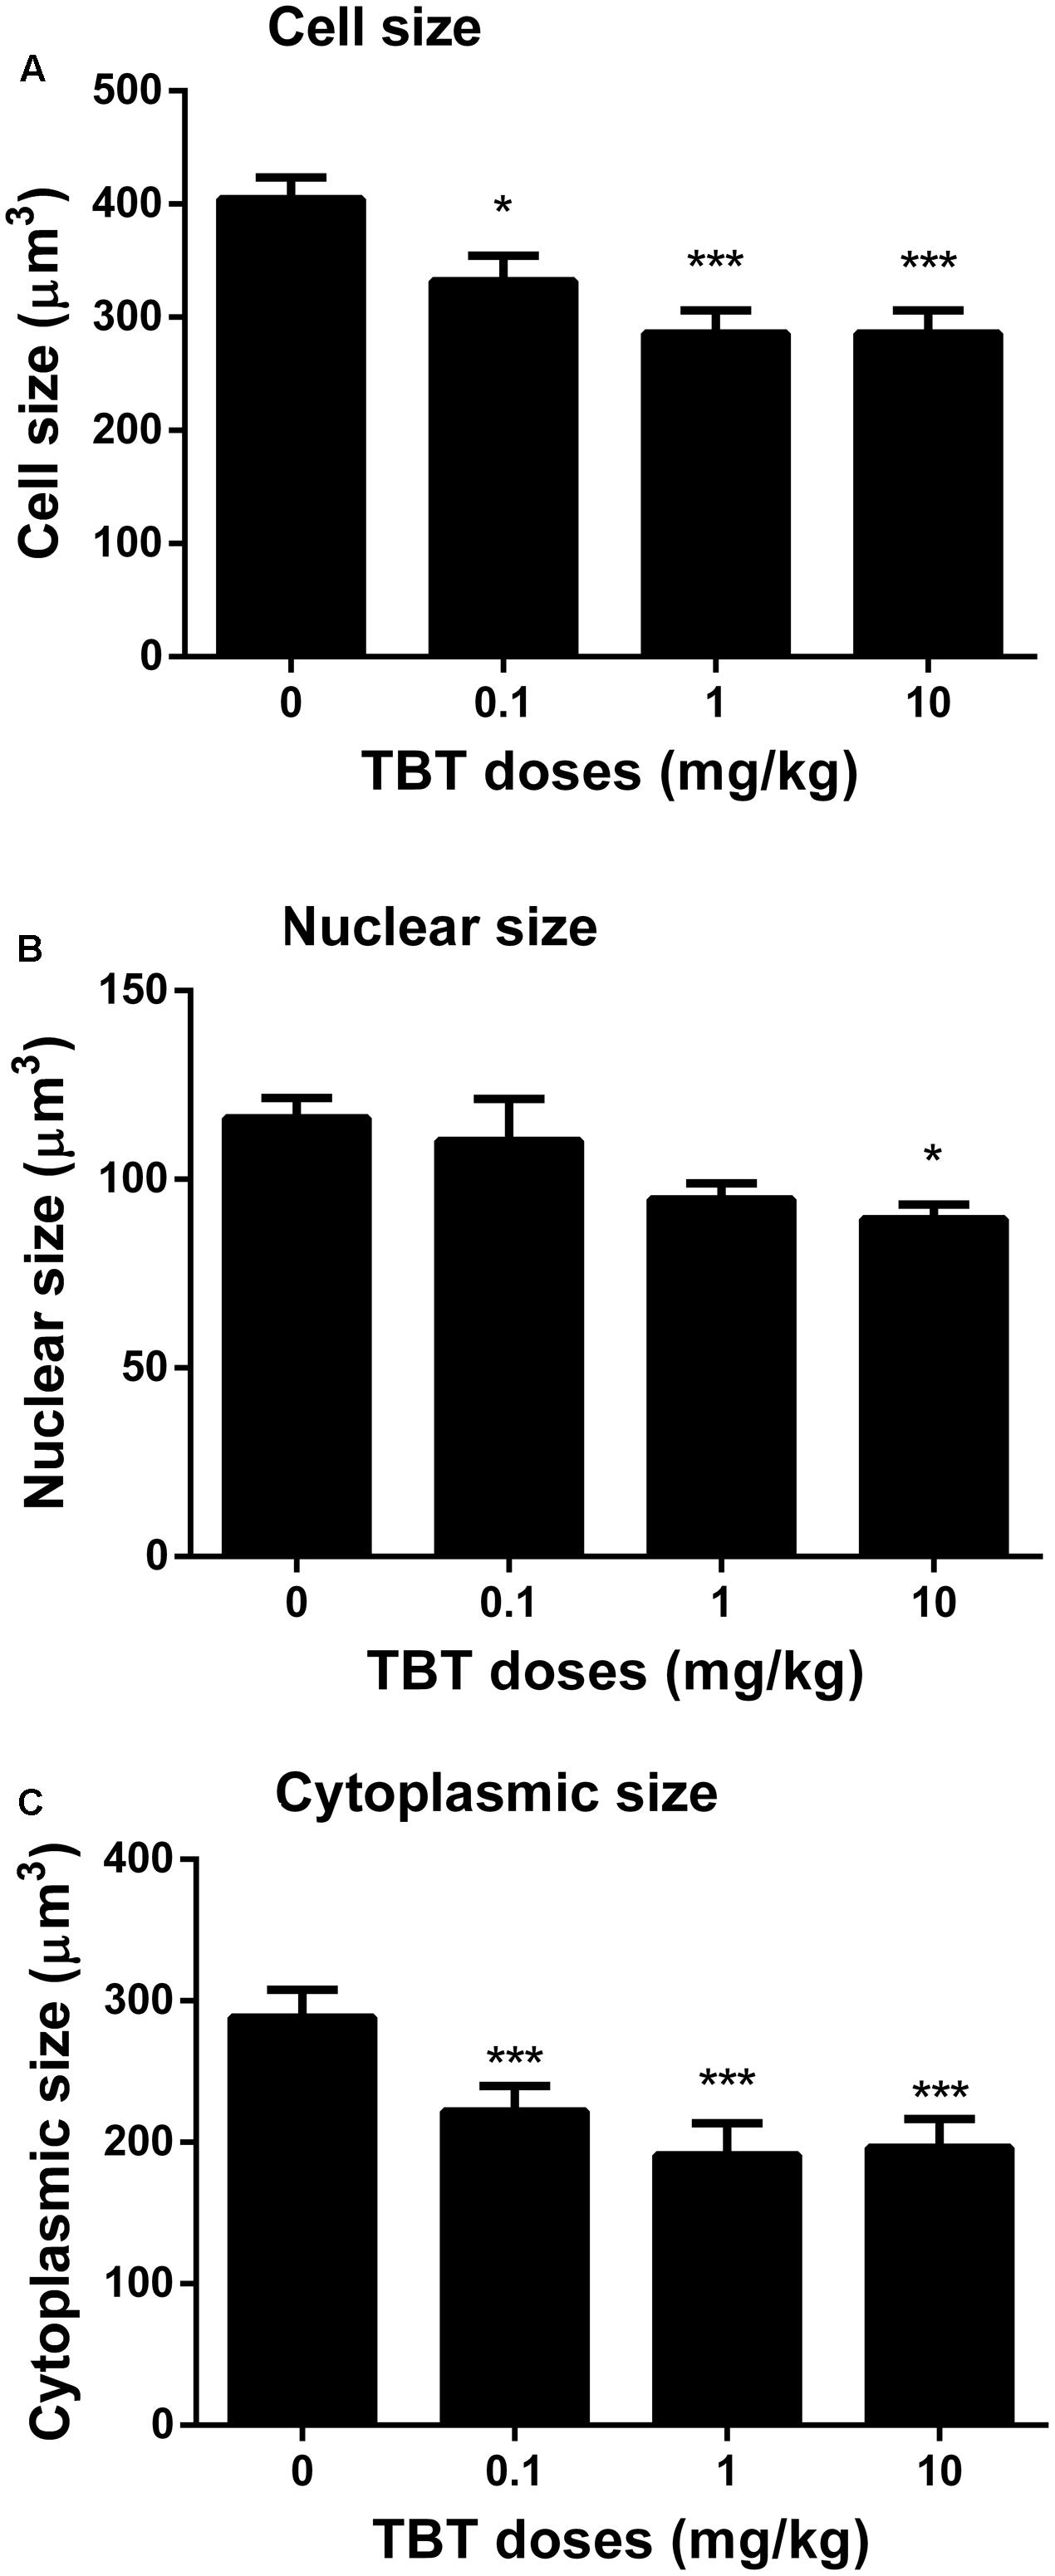
FIGURE 6. The Leydig cell size, nuclear size, and cytoplasmic size in rat testis sections from post-EDS day 56. (A) Leydig cell size; (B) Leydig cell nuclear size; (C) Leydig cell cytoplasmic size. Mean ± SEM, n = 6. ∗, ∗∗, ∗∗∗ indicate significant difference when compared to the control (TBT 0 mg/kg) at p < 0.05, 0.01, and 0.001, respectively.
TBT Lowers Proliferation of Immature Leydig Cells
Immature Leydig cells on post-EDS day 35 have the capacity of proliferation (Guo et al., 2013). PCNA is a well-known nuclear matrix protein for cell proliferation. We stained Leydig cells using HSD11B1 and the proliferating cell using PCNA. There were fewer PCNA-positive immature Leydig cells in TBT-treated testis sections at ≥1 mg/kg TBT groups when compared to the control (Figure 7), indicating that TBT inhibits immature Leydig cell proliferation.
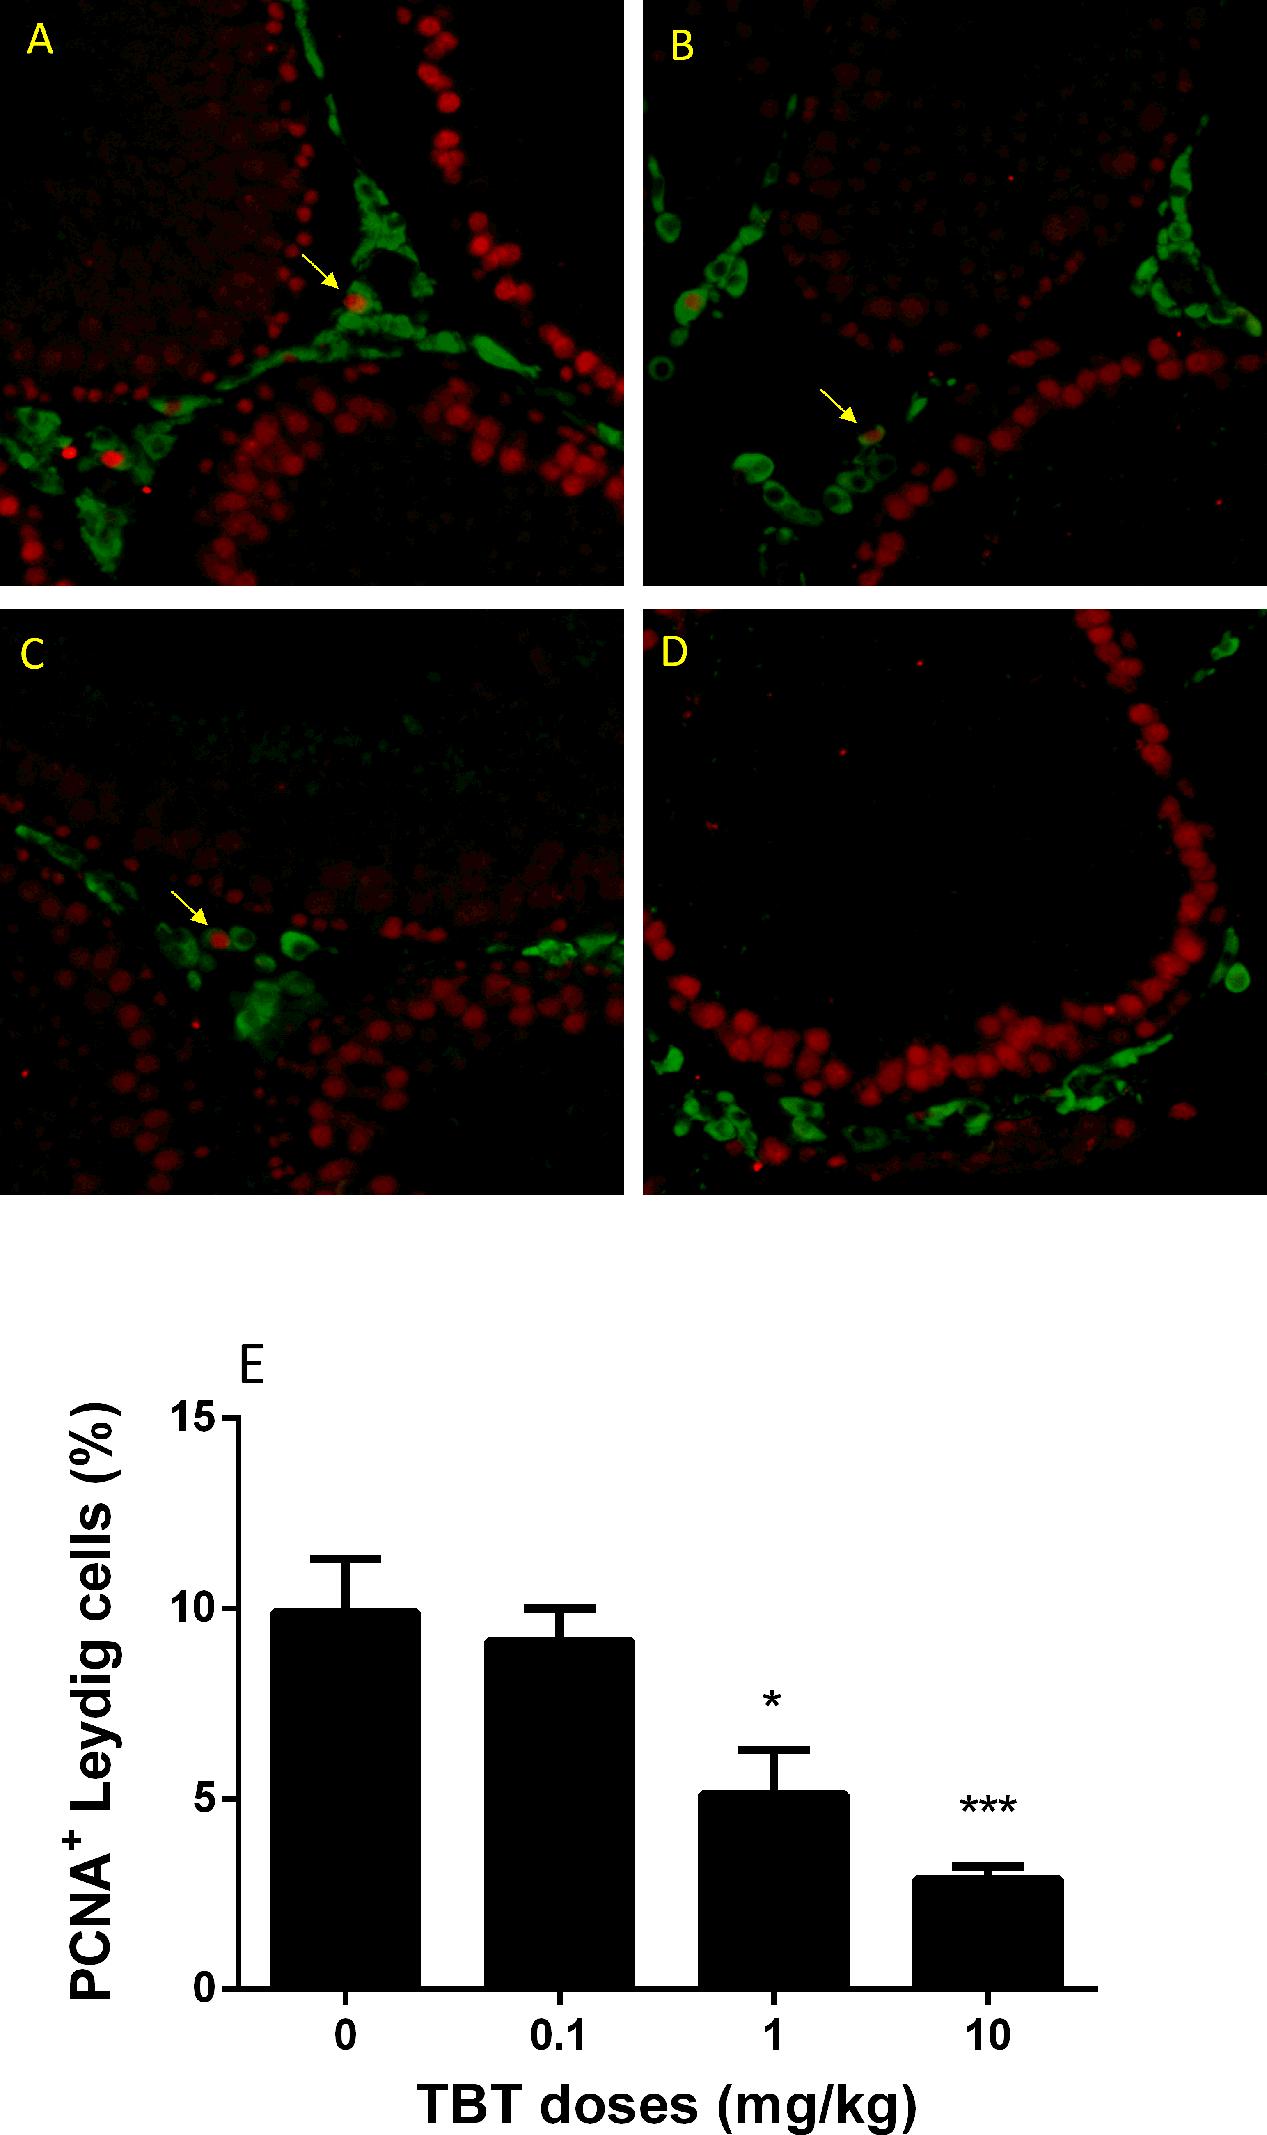
FIGURE 7. The percentage of PCNA (proliferating)-positive and 11β-hydroxysteroid dehydrogenase 1 (HSD11B1, Leydig cell)-positive cells in rat testis sections from post-EDS day 56. Images: (A) control; (B) TBT 0.1 mg/kg dose; (C) TBT 1 mg/kg dose; (D) TBT 10 mg/kg dose. PCNA = red color in the nucleus; HSD11B1 = green color in the cytoplasm. (E) Quantification of data for the percentage of PCNA+-HSD11B1+ cells in all HSD11B1+ cells. Mean ± SEM, n = 6. ∗, ∗∗, ∗∗∗ indicate significant difference when compared to the control (TBT 0 mg/kg) at p < 0.05, 0.01, and 0.001, respectively.
Discussion
In the present study, we used an EDS-induced rat Leydig cell regeneration model, which is very unique to study the developmental process of Leydig cells in the adult rat testis. Adult Leydig cells in rat testis are depleted by i.p. 75 mg/kg EDS (Teerds, 1996). The elimination of Leydig cells caused the increased secretion of LH and production of local growth factors and cytokines, which induced the Leydig cell developmental regeneration process (Kerr and Sharpe, 1985; Teerds, 1996). Like the developmental process of Leydig cells during the puberty, the developmental regeneration process in adult rat testis undergoes three distinct stages: the commitment of stem into progenitor Leydig cells by post-EDS day 21, and then the differentiation into immature Leydig cells by post-EDS day 28, and final maturation into adult Leydig cells by day 56 (Guo et al., 2013). Herein, we adopted this model to test whether TBT disrupted Leydig cell developmental process.
After oral administration, TBT can be readily absorbed and distributed in many tissues and it is also metabolized to dibutyltin and monobutyltin. Pregnant dams were gavaged TBT (10 mg/kg) from GD 8 to postnatal day 12, and TBT levels in dam’s serum, placenta, liver, and brain could reach about 150 ng/ml, 750 ng/g, 1500 ng/ml, and 1750 ng/ml on GD20, respectively (Cooke et al., 2008). This suggests that TBT can enter many tissues.
A short-term period (10 days) of the TBT exposure appeared to disrupt Leydig cell developmental process permanently. Firstly, TBT exposure lowered serum testosterone levels following the treatment of EDS even at as low as 0.1 mg/kg. Secondly, the mRNA levels of Leydig cell steroidogenesis-related genes and their protein products were down-regulated in TBT-exposed animals. These mRNAs include Lhcgr, Cyp11a1, Hsd3b1, Cyp17a1, and Hsd17b3. Thirdly, TBT significantly decreased HSD3B1-positive Leydig cell number regenerated after EDS treatment.
Although the exact time-point for TBT action on cell proliferation is still unknown, the decreased proliferating capacity of immature Leydig cells on post-EDS 35 was observed, as judged by the lower number of PCNA-positive immature Leydig cells. The reduction of Leydig cell numbers accounted for the reductions in both the serum testosterone levels and the expressions of the critical steroidogenic enzymes. However, the quality of Leydig cells (the capability of secreting testosterone per se) seemed also affected after TBT. In this regard, the reduction of Leydig cell size and cytoplasmic size and decrease in the HSD3B1 density per Leydig cell were observed, indicating that these regenerated Leydig cells are less mature.
A short-term period (10 days) of TBT exposure may disrupt Leydig cell developmental process by different mechanisms: directly acting on precursor or developing Leydig cell themselves, or indirectly by affecting the niche that regulates Leydig cell development. The evidence obtained herein indicates that the Leydig cell lineage was the primary target and that the late (via Sertoli cells) may play a role at the higher doses. A brief period (10 days) of TBT at the dose of 10 mg/kg seemed permanently disrupted Sertoli cell function, as judged by the reduced expressions of FSHR, DHH, and SOX9. SOX9 is the critical transcription factor for Sertoli cell development and maturation (Foster, 1996; Barrionuevo et al., 2006). The impairment of Sertoli cell functions was reflected by the elevation of FSH level via the negative feed-back mechanism.
Several studies regarding the effects of TBT on male reproductive functions have been conducted. When male Wistar rats orally received 0.5 or 15 mg TBT from postnatal day 23–53, 15 mg/kg TBT delayed the completion of preputial separation, lowered testosterone and LH levels (Grote et al., 2004). Male mice were gavaged a single dose of 25, 50, or 100 mg/kg of TBT lowered serum testosterone levels and down-regulated expression levels of Cyp11a1, Cyp17a1, Hsd3b, and Hsd17b3, although these doses were much higher than those used in the present study. However, the present study we used a completely different administration regimen of TBT, during which the regenerated cells in the Leydig cell lineage may be not exposed and only the stem Leydig cell and its niche was exposed to TBT. In the regard, the direct effect of TBT on LH secretion (lower LH levels) in the present study was not observed as in the previous study (Grote et al., 2004). On the contrary, LH levels on post-EDS day 56 were dose-dependently increased after TBT treatment, possibly via a negative feed-back action.
Conclusion
A short-term exposure to low dose of TBT can significantly disrupt Leydig cell developmental process in adult animals. Its effect seems most like through directly disrupting stem and precursor Leydig cells. At the higher dose, the Sertoli cell function was also damaged, thus indirectly affecting Leydig cell development.
Author Contributions
XW, LY, and R-SG have conceptualized the study design; XW, JpL, YD, SG, YL, XL, QZ, and XC have performed the experiments and collected the data; XW, JiL and R-SG have analyzed the data; XW, LY, and R-SG have written the manuscript.
Funding
This research was funded by National Natural Science Foundation of China (81373032, 81771635, and 31171425), Health and Family Planning Commission of Zhejiang Province (11-CX29 and 2013ZDA017, 2015103197, 2015KYA237, 2016KYB199), and Zhejiang Provincial NSF (LQ16H040005).
Conflict of Interest Statement
The authors declare that the research was conducted in the absence of any commercial or financial relationships that could be construed as a potential conflict of interest.
Acknowledgments
The authors would like to thank Xiaofeng Chen for collecting the hormone data. The technical support of Ying Wu is acknowledged.
Supplementary Material
The Supplementary Material for this article can be found online at: https://www.frontiersin.org/articles/10.3389/fphar.2017.00704/full#supplementary-material
References
Aluoch, A. O., Odman-Ghazi, S. O., and Whalen, M. M. (2007). Pattern of MAP kinases p44/42 and JNK activation by non-lethal doses of tributyltin in human natural killer cells. Arch. Toxicol. 81, 271–277. doi: 10.1007/s00204-006-0155-4
Barrionuevo, F., Bagheri-Fam, S., Klattig, J., Kist, R., Taketo, M. M., Englert, C., et al. (2006). Homozygous inactivation of Sox9 causes complete XY sex reversal in mice. Biol. Reprod. 74, 195–201. doi: 10.1095/biolreprod.105.045930
Cooke, G. M., Forsyth, D. S., Bondy, G. S., Tachon, R., Tague, B., and Coady, L. (2008). Organotin speciation and tissue distribution in rat dams, fetuses, and neonates following oral administration of tributyltin chloride. J. Toxicol. Environ. Health A 71, 384–395. doi: 10.1080/15287390701801653
Davidoff, M. S., Middendorff, R., Enikolopov, G., Riethmacher, D., Holstein, A. F., and Muller, D. (2004). Progenitor cells of the testosterone-producing Leydig cells revealed. J. Cell Biol. 167, 935–944. doi: 10.1083/jcb.200409107
Fent, K. (1996). Ecotoxicology of organotin compounds. Crit. Rev. Toxicol. 26, 1–117. doi: 10.3109/10408449609089891
Foster, J. W. (1996). Mutations in SOX9 cause both autosomal sex reversal and campomelic dysplasia. 26. Acta Paediatr. Jpn. 38, 405–411. doi: 10.1111/j.1442-200X.1996.tb03515.x
Ge, R. S., Dong, Q., Niu, E. M., Sottas, C. M., Hardy, D. O., Catterall, J. F., et al. (2005). 11{beta}-Hydroxysteroid dehydrogenase 2 in rat leydig cells: its role in blunting glucocorticoid action at physiological levels of substrate. Endocrinology 146, 2657–2664. doi: 10.1210/en.2005-0046
Ge, R. S., and Hardy, M. P. (1998). Variation in the end products of androgen biosynthesis and metabolism during postnatal differentiation of rat Leydig cells. Endocrinology 139, 3787–3795. doi: 10.1210/endo.139.9.6183
Grote, K., Stahlschmidt, B., Talsness, C. E., Gericke, C., Appel, K. E., and Chahoud, I. (2004). Effects of organotin compounds on pubertal male rats. Toxicology 202, 145–158. doi: 10.1016/j.tox.2004.05.003
Guo, J., Zhou, H., Su, Z., Chen, B., Wang, G., Wang, C. Q., et al. (2013). Comparison of cell types in the rat Leydig cell lineage after ethane dimethanesulfonate treatment. Reproduction 145, 371–380. doi: 10.1530/REP-12-0465
Hu, G. X., Lian, Q. Q., Chen, B. B., Prasad, P. V., Kumar, N., Zheng, Z. Q., et al. (2010). 7alpha-hydroxytestosterone affects 11beta-hydroxysteroid dehydrogenase 1 direction in rat Leydig cells. Endocrinology 151, 748–754. doi: 10.1210/en.2009-0917
Kerr, J. B., and Sharpe, R. M. (1985). Stimulatory effect of follicle-stimulating hormone on rat Leydig cells. A morphometric and ultrastructural study. Cell Tissue Res. 239, 405–415. doi: 10.1007/BF00218021
Kim, S. K., Kim, J. H., Han, J. H., and Yoon, Y. D. (2008). Inhibitory effect of tributyltin on expression of steroidogenic enzymes in mouse testis. Int. J. Toxicol. 27, 175–182. doi: 10.1080/10915810801977906
Koopman, P. (1999). Sry and Sox9: mammalian testis-determining genes. Cell Mol. Life. Sci. 55, 839–856. doi: 10.1007/PL00013200
Liu, S., Li, C., Wang, Y., Hong, T., Song, T., Li, L., et al. (2016). In utero methoxychlor exposure increases rat fetal Leydig cell number but inhibits its function. Toxicology 370, 31–40. doi: 10.1016/j.tox.2016.09.009
Mendis-Handagama, S. M., Keeney, D. S., Hardy, M. P., and Ewing, L. L. (1989). Application of the disector method to enumerate cells in the testis. Ann. N. Y. Acad. Sci. 564, 86–98. doi: 10.1111/j.1749-6632.1989.tb25890.x
Mitra, S., Srivastava, A., Khanna, S., and Khandelwal, S. (2014). Consequences of tributyltin chloride induced stress in Leydig cells: an ex-vivo approach. Environ. Toxicol. Pharmacol. 37, 850–860. doi: 10.1016/j.etap.2014.02.018
Nakajima, Y., Sato, G., Ohno, S., and Nakajin, S. (2005). Tributyltin chloride suppresses the P450cl7 transcription involved in testosterone production induced by gonadotropin stimulation in cultured pig Leydig cells. Environ. Toxicol. Pharmacol. 20, 11–17. doi: 10.1016/j.etap.2004.09.010
Ohno, S., Nakajima, Y., and Nakajin, S. (2005). Triphenyltin and Tributyltin inhibit pig testicular 17beta-hydroxysteroid dehydrogenase activity and suppress testicular testosterone biosynthesis. Steroids 70, 645–651. doi: 10.1016/j.steroids.2005.03.005
Rommerts, F. F., Teerds, K. J., and Hoogerbrugge, J. W. (1988). In vitro effects of ethylene-dimethane sulfonate (EDS) on Leydig cells: inhibition of steroid production and cytotoxic effects are dependent on species and age of rat. Mol. Cell Endocrinol. 55, 87–94. doi: 10.1016/0303-7207(88)90094-9
Shawky, S., and Emons, H. (1998). Distribution pattern of organotin compounds at different trophic levels of aquatic ecosystems. Chemosphere 36, 523–535. doi: 10.1016/S0045-6535(97)10011-X
Stanley, E., Lin, C. Y., Jin, S., Liu, J., Sottas, C. M., Ge, R., et al. (2012). Identification, proliferation, and differentiation of adult Leydig stem cells. Endocrinology 153, 5002–5010. doi: 10.1210/en.2012-1417
Teerds, K. J. (1996). “Regeneration of leydig cells after depletion by EDS: A model for postnatal leydig cell renewal,” in The Leydig Cell, eds A. H. Payne, M. P. Hardy, and L. D. Russell (Vienna, IL: Cache River Press), 203–220.
Teerds, K. J., De Rooij, D. G., Rommerts, F. F., and Wensing, C. J. (1988). The regulation of the proliferation and differentiation of rat Leydig cell precursor cells after EDS administration or daily HCG treatment. J. Androl. 9, 343–351. doi: 10.1002/j.1939-4640.1988.tb01061.x
Teerds, K. J., Rijntjes, E., Veldhuizen-Tsoerkan, M. B., Rommerts, F. F., and De Boer-Brouwer, M. (2007). The development of rat Leydig cell progenitors in vitro: how essential is luteinising hormone? J. Endocrinol. 194, 579–593. doi: 10.1677/JOE-06-0084
Vreeburg, J. T., Ooms, M. P., Rommerts, F. F., and Teerds, K. J. (1988). Functional properties of developing rat Leydig cells after treatment with ethylene dimethanesulphonate (EDS). J. Reprod. Fertil. 84, 63–69. doi: 10.1530/jrf.0.0840063
Keywords: tributyltin, ethane dimethane sulfonate, Leydig cell, regeneration
Citation: Wu X, Liu J, Duan Y, Gao S, Lü Y, Li X, Zhu Q, Chen X, Lin J, Ye L and Ge R-S (2017) A Short-Term Exposure to Tributyltin Blocks Leydig Cell Regeneration in the Adult Rat Testis. Front. Pharmacol. 8:704. doi: 10.3389/fphar.2017.00704
Received: 05 August 2017; Accepted: 21 September 2017;
Published: 12 October 2017.
Edited by:
T. John Wu, Uniformed Services University of the Health Sciences, United StatesReviewed by:
Chad D. Foradori, Auburn University, United StatesJay Manoj Bhatt, University of Texas at El Paso, United States
Copyright © 2017 Wu, Liu, Duan, Gao, Lü, Li, Zhu, Chen, Lin, Ye and Ge. This is an open-access article distributed under the terms of the Creative Commons Attribution License (CC BY). The use, distribution or reproduction in other forums is permitted, provided the original author(s) or licensor are credited and that the original publication in this journal is cited, in accordance with accepted academic practice. No use, distribution or reproduction is permitted which does not comply with these terms.
*Correspondence: Ren-Shan Ge, cl9nZUB5YWhvby5jb20= Leping Ye, eWVsZXBpbmdAMTYzLmNvbQ==
†These authors have contributed equally to this work.