 Shahar Bano
 Arif-ullah Khan
 Faiza Asghar
 Muhammad Usman
 Amin Badshah
 Saqib Ali2
- 1Riphah Institute of Pharmaceutical Sciences, Riphah International University, Islamabad, Pakistan
- 2Department of Chemistry, Quaid-e-Azam University, Islamabad, Pakistan
- 3Department of Chemistry, University of Wah, Wah, Pakistan
We investigated possible anti-diabetic effect of ferrocene-based acyl ureas: 4-ferrocenyl aniline (PFA), 1-(4-chlorobenzoyl)-3-(4-ferrocenylphenyl) urea (DPC1), 1-(3-chlorobenzoyl)-3-(4-ferrocenylphenyl) urea (DMC1), 1-(2-chlorobenzoyl)-3-(4-ferrocenylphenyl) urea (DOC1) and homoleptic cadmium carboxylates: bis (diphenylacetato) cadmium (II) (DPAA), bis (4-chlorophenylacetato) cadmium (II) (CPAA), using in silico and in vivo techniques. PFA, DPC1, DMC1, DOC1, DPAA and CPAA exhibited high binding affinities (ACE ≥ −350 Kcal/mol) against targets: aldose reductase, peroxisome proliferator-activated receptor γ, 11β-hydroxysteroid dehydrogenase-1, C-alpha glucosidase and glucokinase, while showed moderate affinities (ACE ≥ −250 Kcal/mol) against N-alpha glucosidase, dipeptidyl peptidase-IV, phosphorylated-Akt, glycogen synthase kinase-3β, fructose-1,6-bisphosphatase and phosphoenolpyruvate carboxykinase, whereas revealed lower affinities (ACE < −250 Kcal/mol) vs. alpha amylase, protein tyrosine phosphatases 1B, glycogen phosphorylase and phosphatidylinositol 3 kinase. In alloxan (300 mg/Kg)-induced diabetic mice, DPAA and DPC1 (1–10 mg/Kg) at day 1, 5, 10, 15, and 20th decreased blood glucose levels, compared to diabetic control group and improved the treated animals body weight. DPAA (10 mg/Kg) and DPC1 (5 mg/Kg) in time-dependent manner (30–120 min.) enhanced tolerance of oral glucose overload in mice. DPAA and DPCI dose-dependently at 1, 5, and 10 mg/Kg decreased glycosylated hemoglobin levels in diabetic animals, as caused by metformin. These results indicate that aforementioned derivatives of ferrocene and cadmium possess anti-diabetic potential.
Introduction
Diabetes mellitus (DM) is foremost health disorder, growing frequently in developing countries. Factors responsible for DM include increased deskbound lifestyle, nutrition changeover and rapid urbanization leading to widespread, parallel to rise in obesity (Hu, 2011). According to WHO, the 7th chief cause of deaths in 2030 will be DM (Mathers and Loncar, 2006). DM is mainly characterized by high blood glucose levels, i.e., hyperglycemia with altered metabolism of carbohydrates, proteins and fats due to reduced insulin secretions or/and insulin action. Type I diabetes is associated with deficiency of insulin due to autoimmune-mediated β cells damage (Tuomi, 2005). Hyperglycemic condition in type I diabetes is controlled by administering exogenous insulin via subcutaneous route. However, type II diabetes is associated with relatively reduced levels or/and reduced sensitivity of hepatic, cardiac and fat cell toward insulin action. Thus, patients with type II diabetes rely on synthetic anti-diabetic therapy (Nathan et al., 2009).
Until now, many of the metals have been reported to possess anti-diabetic potential, such as vanadium (Heyliger et al., 1985), chromium (Anderson et al., 1997), cobalt (Ybarra et al., 1997), molybdenum (Ozcelikay et al., 1996), tungsten (Barberà et al., 2001), cadmium (Gümüşlü et al., 1997), iron, and copper (Siva and Kumar, 2013). Ferrocene derivatives containing iron moiety have been reported for good binding affinity to DNA, having cytotoxic, anticancer, antimalarial, antibiotic and antiviral activities (Lal et al., 2011; Asghar et al., 2017). Acyl urea group possesses anticancer, anticonvulsant, antimicrobial and antioxidant activities. Acyl urea derivatives have also been reported for anti-diabetic effect by inhibition of human liver glycogen phosphorylase (Klabunde et al., 2005). High levels of selenium in serum are associated with DM prevalence (Bleys et al., 2007). Cadmium is responsible for decrease in plasma selenium levels in alloxane treated diabetic rats (Gümüşlü et al., 1997). Carboxylate complexes with tin have been reported for α-glucosidase inhibition (Roy et al., 2015).
In present study, we made an effort to explore anti-diabetic potential of ferrocene and cadmium selected derivatives including 4-ferrocenyl aniline (PFA), 1-(4-chlorobenzoyl)-3-(4-ferrocenylphenyl) urea (DPC1), 1-(3-chlorobenzoyl)-3-(4-ferrocenylphenyl) urea (DMC1), 1-(2-chlorobenzoyl)-3-(4-ferrocenylphenyl) urea (DOC1), bis (diphenylacetato) cadmium (II) (DPAA), and bis (4-chlorophenylacetato) cadmium (II) (CPAA), through molecular docking and in vivo animals experimentation models. The chemical structures of test compounds were drawn via Chem. Sketch 2015 2.5 (Figure 1).
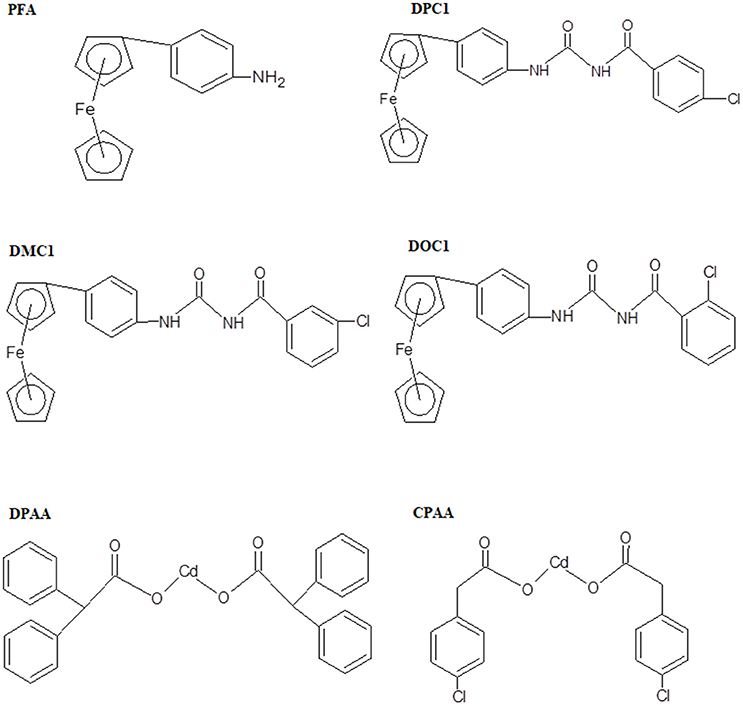
Figure 1. Chemical structures of ferrocene incorporated acyl ureas and homoleptic cadmium carboxylates: 4-ferrocenyl aniline (PFA), 1-(4-chlorobenzoyl)-3-(4-ferrocenylphenyl) urea (DPC1), 1-(3-chlorobenzoyl)-3-(4-ferrocenylphenyl) urea (DMC1), 1-(2-chlorobenzoyl)-3-(4-ferrocenylphenyl) urea (DOC1), bis (diphenylacetato) cadmium (II) (DPAA), and bis (4-chlorophenylacetato) cadmium (II) (CPAA), drawn through Chem. Sketch 2015 2.5 software.
Materials and Methods
Chemicals
Alloxan monohydrate and dimethyl sulphoxide (DMSO) were purchased from Sigma-Aldrich Co. LLC, U.S.A. Metformin HCL was obtained from Caraway Pharmaceuticals, National Industrial Zone Rawat, Islamabad, Pakistan. Ferrocene incorporated acyl ureas and homoleptic cadmium carboxylates were gifted by the Department of Chemistry, Quaid-e-Azam University. All chemicals were of analytical grade.
Animals
Adult Balb-C mice of either sex were kept under controlled temperature (22–25°C) at the animal house of Riphah Institute of Pharmaceutical Sciences, Islamabad, Pakistan. Animals were given free access to standard diet and water ad libitum. Experiments performed complied with rulings of Institute of Laboratory Animal Resources, Commission on Life Sciences University, National Research Council (1996), approved by Ethical Committee, Riphah Institute of Pharmaceutical Sciences (Ref. No.: REC/RIPS/2016/0013).
Docking Studies
3D-structures of the test compounds (PFA, DPC1, DMC1, DOC1, DPAA, and CPAA) were formed through Gauss View 5.0 software (Figure 2). 3D-structures of standard drug were obtained by converting 2D-structures through Biovia Discovery Studio Visualizer (DSV) 2016 (Figure 3). Polar hydrogen atoms (H-atoms) were added through same software, followed by saving into PDB format. Standard drugs were: miglitol, metformin, carbenoxolone, thiadiazolidinone-8 (TDZD-8), rosiglitazone, sitagliptin and ertiprotafib. 3D-structures of human protein targets involved in DM were retrieved from online data bank, RCSB PDB (https://www.rcsb.org/pdb/), as shown in Figure 4, according to their PDB IDs (Sussman et al., 1998). Target proteins were: alpha amylase (AA, PDB ID: 2QMK), C-alpha glucosidase (C-AG, PDB ID: 3TON), N-alpha glucosidase (N-AG, PDB ID: 2QMJ), aldose reductase (AR, PDB ID: 1US0), glucokinase (GK, PDB ID: IV4S), glycogen phosphorylase (GP, PDB ID: 1L7X), fructose-1,6-bisphosphatase (FBP1, PDB ID: 2JJK), phosphoenolpyruvate carboxykinase (PEPCK, PDB ID: 1KHB), 11β-hydroxysteroid dehydrogenase-1 (11β-HSD1, PDB ID: 2BEL), glycogen synthase kinase-3β (GSK-3β, PDB ID: 1Q4L), peroxisome proliferator-activated receptor γ (PPAR-γ, PDB ID: 2PRG), phosphatidylinositol 3 kinase (PI3K, PDB ID: 1E7U), phosphorylated-Akt (p-Akt, PDB ID: 3O96), dipeptidyl peptidase-IV (DPP IV, PDB ID: 2ONC), and protein tyrosine phosphatase 1B (PTP-1B, PDB ID: 2F70). By using same software, water molecules and ligands were removed and polar H-atoms were added, followed by saving in PDB format. Molecular docking was performed by PatchDock server, which is an online, geometry based automatic docking tool (Duhovny et al., 2002). We selected Root Mean Square Deviation clustering value at 2.0 to discard the redundant solutions of docking. Docking was executed and evaluated on bases of atomic contact energy (ACE) value (Kcal/mol) (Schneidman-Duhovny et al., 2005). Top 20 poses were evaluated and one with lowest ACE value (Kcal/mol) was selected for evaluation through Biovia DSV 2016. Each complex was assessed in 3D pattern to check the maximum binding interactions formed between ligands and amino acid residues including: alanine (ALA), arginine (ARG), asparagine (ASN), aspartic acid (ASP), cysteine (CYS), glutamine (GLN), glutamic acid (GLU), glycine (GLY), histidine (HIS), isoleucine (ILE), lysine (LYS), methionine (MET), phenylalanine (PHE), proline (PRO), serine (SER), threonine (THR), tryptophan (TRP), tyrosine (TYR), threonine (THR), and valine (VAL).
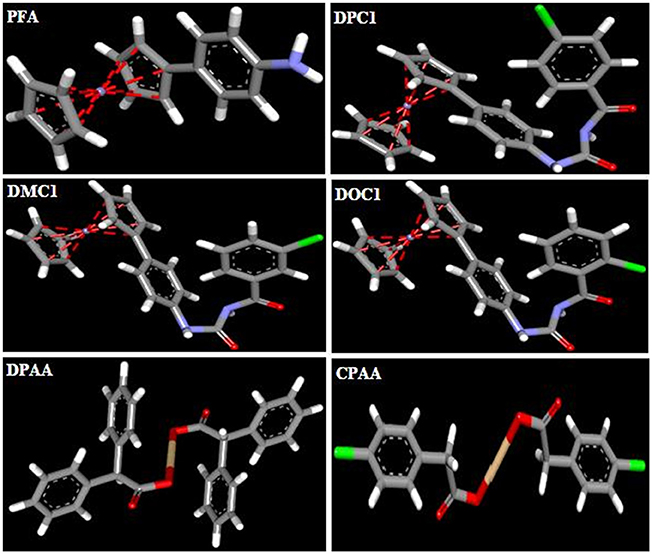
Figure 2. 3D-structures of ferrocene incorporated acyl ureas and homoleptic cadmium carboxylates: 4-ferrocenyl aniline (PFA), 1-(4-chlorobenzoyl)-3-(4-ferrocenylphenyl) urea (DPC1), 1-(3-chlorobenzoyl)-3-(4-ferrocenylphenyl) urea (DMC1), 1-(2-chlorobenzoyl)-3-(4-ferrocenylphenyl) urea (DOC1), bis (diphenylacetato) cadmium (II) (DPAA), and bis (4-chlorophenylacetato) cadmium (II) (CPAA), drawn through Guass View 5.0 Software and saved into PDB format. Atoms are shown by colors; gray color (carbon atoms), white color (hydrogen atoms), red color (oxygen atoms), blue color (nitrogen atoms), yellowish color (cadmium atoms), and green color (chlorine atoms).
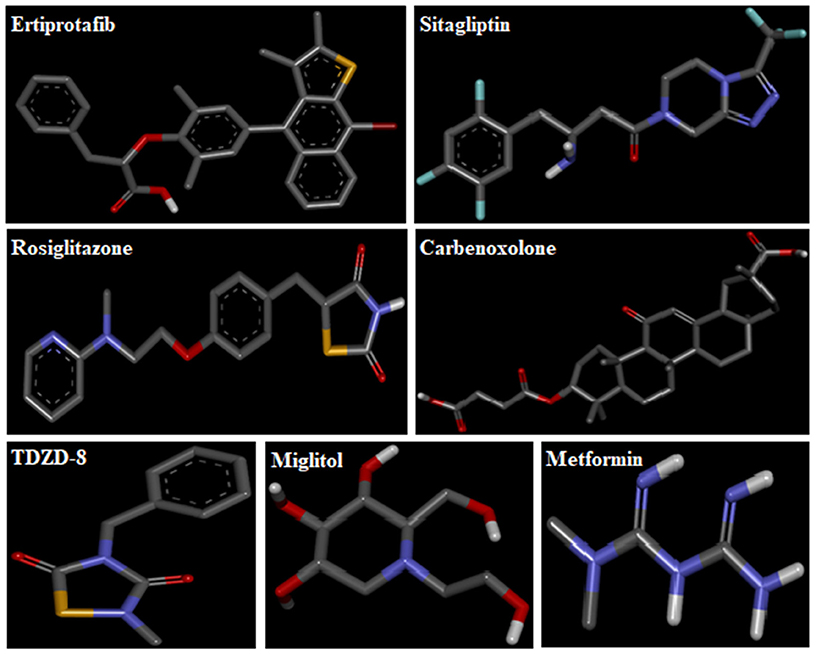
Figure 3. 3D-structures of reference drugs: miglitol, metformin, carbenoxolone, thiadiazolidinone-8 (TDZD-8), rosiglitazone, sitagliptin and ertiprotafib, drawn through Chem. Sketch 2015 2.5 and saved in PDB format through Biovia Discovery Studio 2016. Atoms are shown by colors; gray color (carbon atoms), white color (hydrogen atoms), red color (oxygen atoms), blue color (nitrogen atoms), dark red (bromine), and yellow color (sulfur atoms).
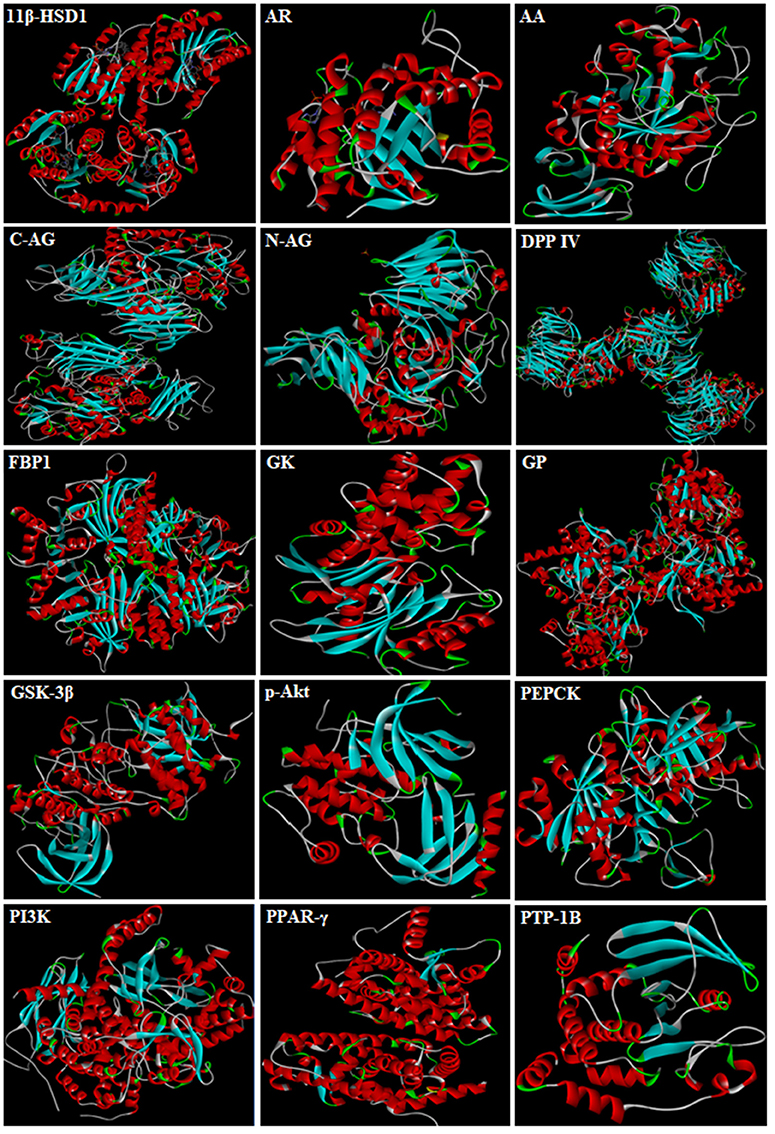
Figure 4. 3D-structures of protein targets involved in diabetes: alpha amylase (AA), C-alpha glucosidase (C-AG), N-alpha glucosidase (N-AG), aldose reductase (AR), glucokinase (GK), glycogen phosphorylase (GP), fructose-1,6-bisphosphatase (FBP1), phosphoenolpyruvate carboxykinase (PEPCK), 11β-hydroxysteroid dehydrogenase-1 (11β-HSD1), glycogen synthase kinase-3β (GSK-3β), peroxisome proliferator-activated receptor γ (PPAR-γ), phosphatidylinositol 3 kinase (PI3K), phosphorylated-Akt (p-Akt), dipeptidyl peptidase-IV (DPP IV) and protein tyrosine phosphatase 1B (PTP-1B).
Blood Glucose Levels and Body Weight Measurement
Balb-C mice were adapted to the laboratory conditions and kept on overnight fasting (12–14 h). Alloxan was used for the induction of diabetes (Dunn and McLetchie, 1943). Solution of alloxan monohydrate (300 mg/Kg) was freshly prepared in saline and injected intra-peritoneally to mice (Bukhari et al., 2015). After 48 h, tail prick method was used to measure blood glucose levels of animals. Mice with blood glucose levels ≥200 mg/dL were considered as diabetic (Saudek et al., 2008). On basis of docking results, two most potential compounds were selected for in vivo studies. For DPAA and DPC1, animals were placed in six groups for each compound. The sample size in each group comprised of five mice. Group I and II were non-diabetic control and diabetic control, injected with saline (10 mL/Kg) and alloxan monohydrate (300 mg/Kg) respectively. Group III, IV, and V were alloxan-induced diabetic mice, administered with the test compound at doses of 1, 5, and 10 mg/Kg respectively. Group VI was positive control and injected with metformin (500 mg/Kg). Blood glucose levels were measured at day 1, 5, 10, 15, and 20th, using Easy Gluco auto-coding glucometer. For complete treatment period, body weight of animals was measured at same regular intervals.
Oral Glucose Tolerance Test (OGTT)
After keeping on 18 h fasting, mice were placed into four groups (for both compounds total eight groups). The sample size in each group comprised of five mice. Group I and II were non-diabetic and diabetic control, injected with saline (10 mL/Kg) and alloxan (300 mg/Kg) respectively. Group III was treated with the test compound (DPAA, 10 mg/Kg/DPC1, 5 mg/Kg). Group IV was positive control and injected with metformin (500 mg/Kg). All groups were pre-treated and after 30 min. D-glucose load of 2 g/Kg was given orally. Blood glucose levels were measured at 0, 30, 60, 90, and 120 min., using Easy Gluco auto-coding glucometer (Marguet et al., 2000).
Glycosylated Hemoglobin (HbA1C) Test
After 6 weeks of treatment, HbA1C test was performed (Asgary et al., 2008) for all groups having sample size in each group comprised of five mice. Blood samples were collected using cardiac puncture method (Doeing et al., 2003). HbA1C level test carried out in Cantt Laboratory and Medical Imaging, Rawalpindi.
Acute Toxicity Test
Animals were kept on overnight fasting and distributed into different groups for each dose of DPAA (15, 25, 50, and 100 mg/Kg) and DPC1 (25, 50, and 100 mg/Kg). The sample size in each group comprised of five mice. After administration of compounds, animals were kept under observation for 7 days to determine mortality (Chen et al., 2009).
Statistical Analysis
Data expressed as mean ± standard error of mean (SEM). Significance of results was assessed by one-way analysis of variance (ANOVA), followed by post-hoc Tukey's test. P < 0.05 was deliberated to be statistically significant. The statistical assessment, preparation of graphs and evaluation was performed by using Graph Pad Prism 5.01.
Results
Docking Evaluation
Docking evaluation was done by assessing ACE values, number of hydrogen bonds (H-bonds), number of π-π bonds and hydrophobic interactions formed between ligand-protein complexes. ACE (Kcal/mol) values for complexes of ligands and targets are shown in Table 1. Number of H-bonds and amino acids involved in making H-bonds are presented in Table 2. Number of π-π bonds and amino acids forming π-π bonds are expressed in Table 3. Hydrophobic interactions of best docked poses for ligand-protein complexes are plotted in Table 4. Interactions formed by DPAA, CPAA, PFA, DPC1, DMC1, DOC1 and standard drugs against AA, C-AG, N-AG, AR, GK, GP, FBP1, PEPCK, 11β-HSD1, GSK-3β, PPAR-γ, PI3K, p-Akt, DPP IV, and PTP-1B are shown in Figures S1–S15, respectively.
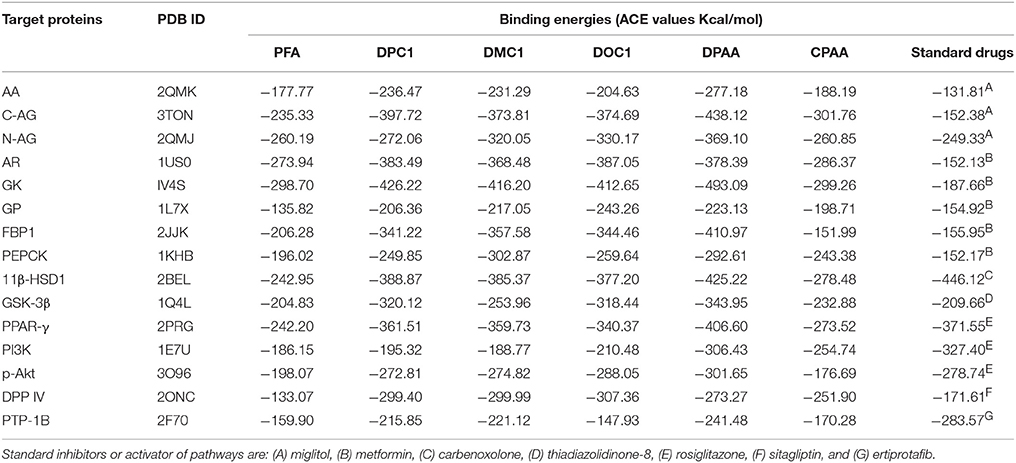
Table 1. ACE values (Kcal/mol) of best docked poses of 4-ferrocenyl aniline (PFA), 1-(4-chlorobenzoyl)-3-(4-ferrocenylphenyl) urea (DPC1), 1-(3-chlorobenzoyl)-3-(4-ferrocenylphenyl) urea (DMC1), 1-(2-chlorobenzoyl)-3-(4-ferrocenylphenyl) urea (DOC1), bis (diphenylacetato) cadmium (II) (DPAA), bis (4-chlorophenylacetato) cadmium (II) (CPAA) and standard drugs against alpha amylase (AA), C-alpha glucosidase (C-AG), N-alpha glucosidase (N-AG), aldose reductase (AR), glucokinase (GK), glycogen phosphorylase (GP), fructose-1,6-bisphosphatase (FBP1), phosphoenolpyruvate carboxykinase (PEPCK), 11β-hydroxysteroid dehydrogenase-1 (11β-HSD1), glycogen synthase kinase-3β (GSK-3β), peroxisome proliferator-activated receptor γ (PPAR-γ), phosphatidylinositol 3 kinase (PI3K), phosphorylated-Akt (p-Akt), dipeptidyl peptidase-IV (DPP IV) and protein tyrosine phosphatase 1B (PTP-1B).
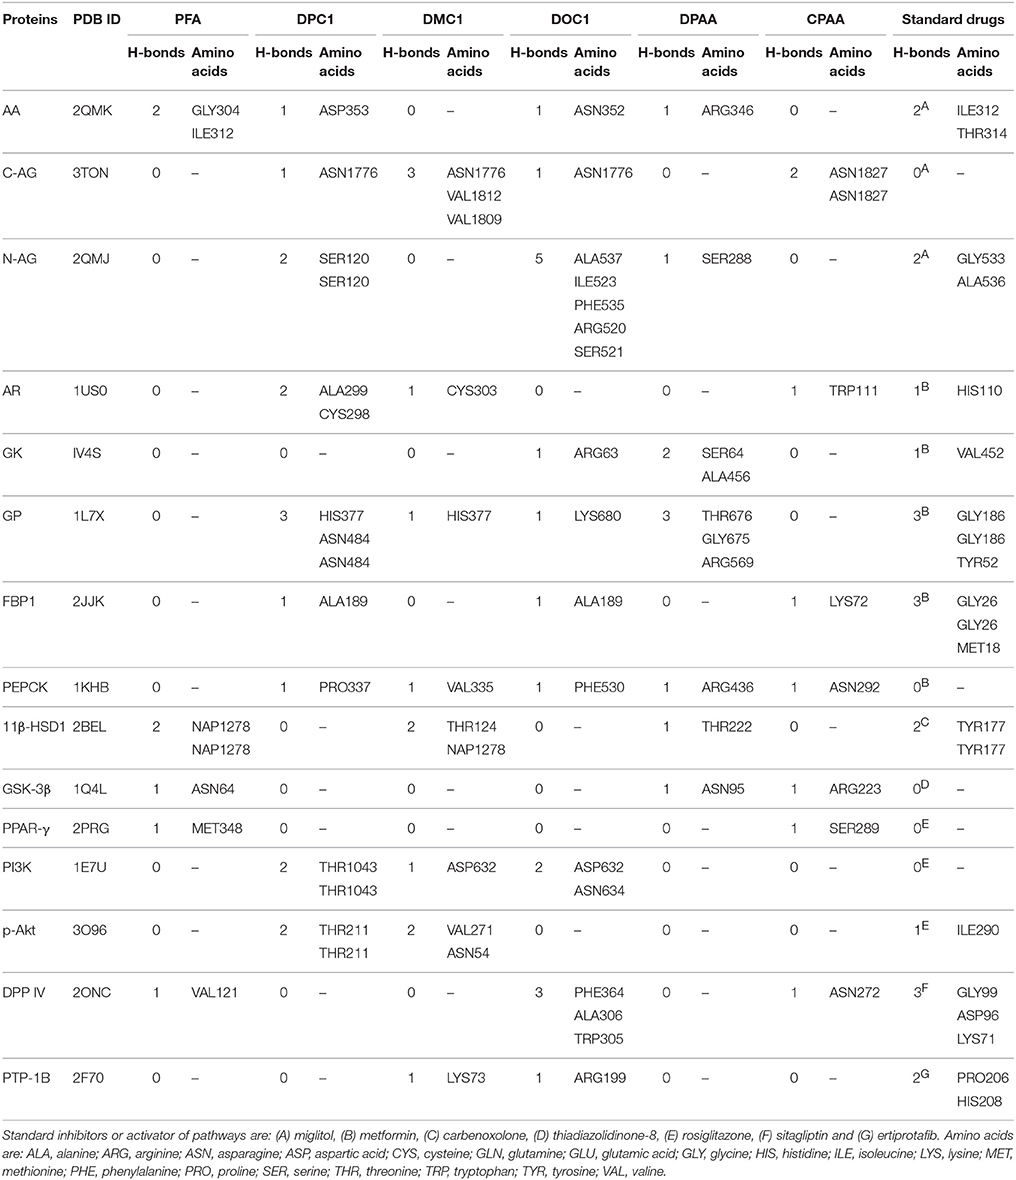
Table 2. Hydrogen bonds (H-bonds) formed by 4-ferrocenyl aniline (PFA), 1-(4-chlorobenzoyl)-3-(4-ferrocenylphenyl) urea (DPC1), 1-(3-chlorobenzoyl)-3-(4-ferrocenylphenyl) urea (DMC1), 1-(2-chlorobenzoyl)-3-(4-ferrocenylphenyl) urea (DOC1), bis (diphenylacetato) cadmium (II) (DPAA), bis (4-chlorophenylacetato) cadmium (II) (CPAA) and standard drugs against alpha amylase (AA), C-alpha glucosidase (C-AG), N-alpha glucosidase (N-AG), aldose reductase (AR), glucokinase (GK), glycogen phosphorylase (GP), fructose-1,6-bisphosphatase (FBP1), phosphoenolpyruvate carboxykinase (PEPCK), 11β-hydroxysteroid dehydrogenase-1 (11β-HSD1), glycogen synthase kinase-3β (GSK-3β), peroxisome proliferator-activated receptor γ (PPAR-γ), phosphatidylinositol 3 kinase (PI3K), phosphorylated-Akt (p-Akt), dipeptidyl peptidase-IV (DPP IV) and protein tyrosine phosphatase 1B (PTP-1B).
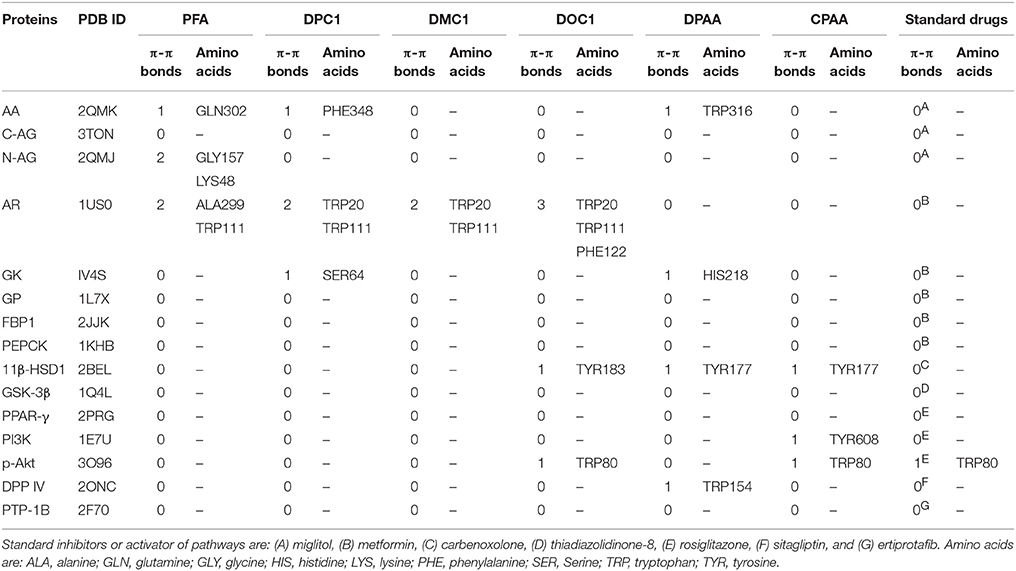
Table 3. Pi-Pi bonds (π-π bonds) formed by 4-ferrocenyl aniline (PFA), 1-(4-chlorobenzoyl)-3-(4-ferrocenylphenyl) urea (DPC1), 1-(3-chlorobenzoyl)-3-(4-ferrocenylphenyl) urea (DMC1), 1-(2-chlorobenzoyl)-3-(4-ferrocenylphenyl) urea (DOC1), bis (diphenylacetato) cadmium (II) (DPAA), bis (4-chlorophenylacetato) cadmium (II) (CPAA) and standard drugs against alpha amylase (AA), C-alpha glucosidase (C-AG), N-alpha glucosidase (N-AG), aldose reductase (AR), glucokinase (GK), glycogen phosphorylase (GP), fructose-1,6-bisphosphatase (FBP1), phosphoenolpyruvate carboxykinase (PEPCK), 11β-hydroxysteroid dehydrogenase-1 (11β-HSD1), glycogen synthase kinase-3β (GSK-3β), peroxisome proliferator-activated receptor γ (PPAR-γ), phosphatidylinositol 3 kinase (PI3K), phosphorylated-Akt (p-Akt), dipeptidyl peptidase-IV (DPP IV) and protein tyrosine phosphatase 1B (PTP-1B).
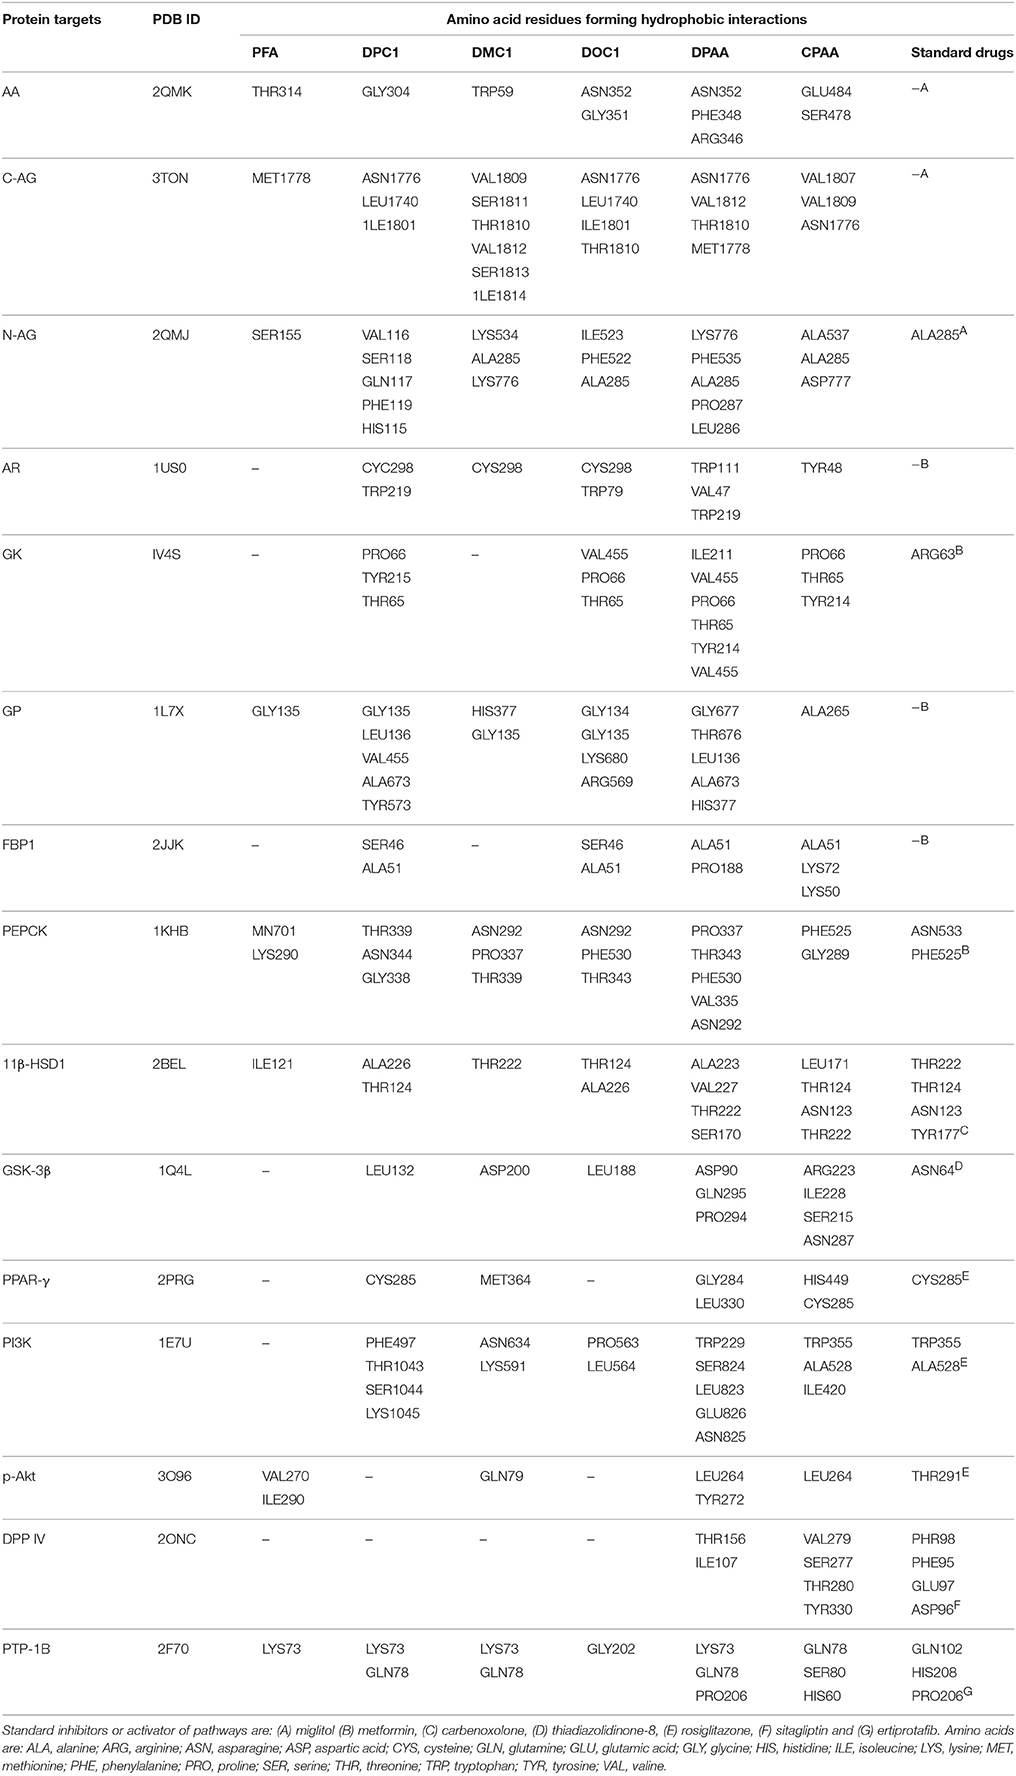
Table 4. Hydrophobic interactions formed by 4-ferrocenyl aniline (PFA), 1-(4-chlorobenzoyl)-3-(4-ferrocenylphenyl) urea (DPC1), 1-(3-chlorobenzoyl)-3-(4-ferrocenylphenyl) urea (DMC1), 1-(2-chlorobenzoyl)-3-(4-ferrocenylphenyl) urea (DOC1), bis (diphenylacetato) cadmium (II) (DPAA), bis (4-chlorophenylacetato) cadmium (II) (CPAA) and standard drugs against alpha amylase (AA), C-alpha glucosidase (C-AG), N-alpha glucosidase (N-AG), aldose reductase (AR), glucokinase (GK), glycogen phosphorylase (GP), fructose-1,6-bisphosphatase (FBP1), phosphoenolpyruvate carboxykinase (PEPCK), 11β-hydroxysteroid dehydrogenase-1 (11β-HSD1), glycogen synthase kinase-3β (GSK-3β), peroxisome proliferator-activated receptor γ (PPAR-γ), phosphatidylinositol 3 kinase (PI3K), phosphorylated-Akt (p-Akt), dipeptidyl peptidase-IV (DPP IV) and protein tyrosine phosphatase 1B (PTP-1B).
Effect on Blood Glucose Levels
At day 1, 5, 10, 15, and 20th, blood glucose levels of non-diabetic control (saline, 10 mL/Kg) group were 96 ± 4.11, 102 ± 3.74, 99 ± 2.44, 109 ± 3.63, and 114 ± 3.20 mg/dL respectively. Blood glucose levels of alloxan (300 mg/Kg) treated diabetic control group were 578 ± 12.55, 560 ± 15.78, 586 ± 4.78, 572 ± 9.66, and 581 ± 7.94 mg/dL respectively. Blood glucose levels of DPAA (1 mg/Kg) treated group were 522 ± 19.70, 500 ± 24.59, 447 ± 17.48 (P < 0.05 vs. diabetic control), 470 ± 20.26 and 548 ± 29.25 mg/dL respectively. Blood glucose levels of DPAA (5 mg/Kg) treated group were 361 ± 60.93, 215 ± 65.25, 174 ± 47.36, 302 ± 28.13, and 318 ± 30.93 mg/dL (P < 0.001 vs. diabetic control) respectively. Blood glucose levels of DPAA (10 mg/Kg) treated group were 273 ± 37.69, 167 ± 40.54, 139 ± 31.11, 131 ± 30.78, and 102 ± 6.77 mg/dL (P < 0.001 vs. diabetic control) respectively. Blood glucose levels of metformin (500 mg/Kg) treated group were 534 ± 21.98, 460 ± 26.25, 429 ± 30.01 (P < 0.01 vs. diabetic control), 402 ± 32.67 and 391 ± 34.24 mg/dL (P < 0.001 vs. diabetic control) respectively (Figure 5). Blood glucose levels of DPC1 (1 mg/Kg) treated group were 600 ± 0.00, 560 ± 28.60, 409 ± 82.53, 395 ± 80.70, and 369 ± 76.86 mg/dL (P < 0.05 vs. diabetic control) respectively. Blood glucose levels of DPC1 (5 mg/Kg) treated group were 196 ± 21.91, 181 ± 17.08, 170 ± 18.25, 154 ± 24.03, and 119 ± 17.99 mg/dL (P < 0.001 vs. diabetic control) respectively. Blood glucose levels of DPC1 (10 mg/Kg) treated group were 204 ± 14.87 (P < 0.001 vs. diabetic control), 570 ± 29.20, 568 ± 31.60, 321 ± 86.36 (P < 0.05 vs. diabetic control), and 207 ± 61.84 mg/dL (P < 0.001 vs. diabetic control) respectively (Figure 6).
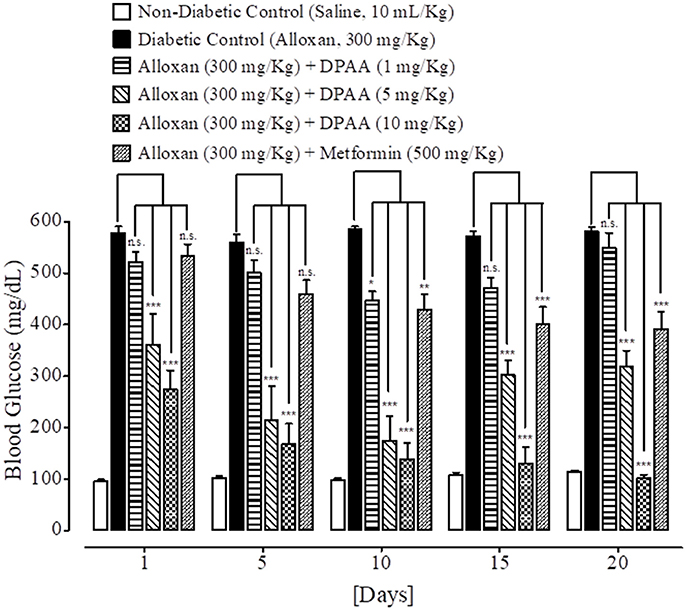
Figure 5. Bar-graph representing blood glucose levels at different treatment days of saline treated group (non-diabetic control), alloxan treated group (diabetic control), inhibitory effect of bis (diphenylacetato) cadmium (II) (DPAA) at different doses (1–10 mg/Kg) and metformin treated group against alloxan-induced hyperglycemia in mice. Data presented as mean ± SEM. Statistical analysis used one-way ANOVA, followed by post-hoc Tukey's test. *P < 0.05, **P < 0.01, ***P < 0.001 comparison of the blood glucose levels of DPAA and metformin treated groups vs. diabetic control group. n.s., non-significant. The sample size in each group comprised of five mice (n = 5).
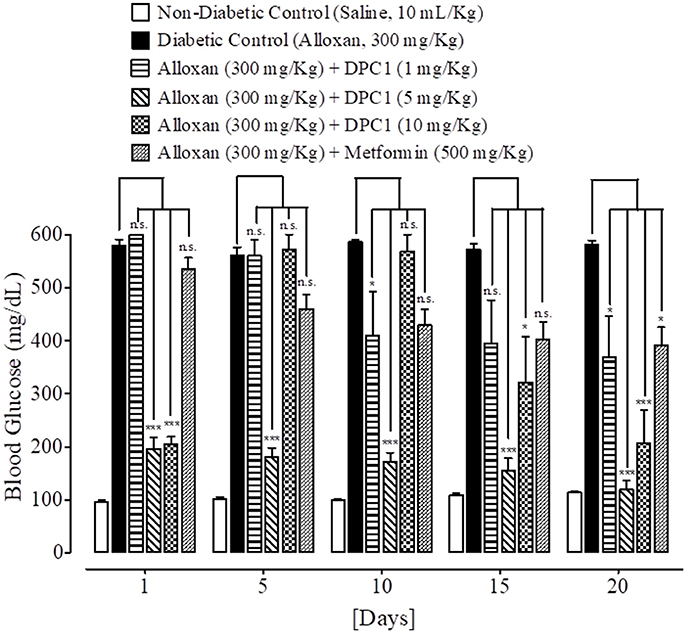
Figure 6. Bar-graph representing blood glucose levels at different treatment days of saline treated group (non-diabetic control), alloxan treated group (diabetic control), inhibitory effect of 1-(4-chlorobenzoyl)-3-(4-ferrocenylphenyl) urea (DPC1) at different doses (1–10 mg/Kg) and metformin treated group against alloxan-induced hyperglycemia in mice. Data presented as mean ± SEM. Statistical analysis used one-way ANOVA, followed by post-hoc Tukey's test. *P < 0.05, ***P < 0.001 comparison of the blood glucose levels of DPC1 and metformin treated groups vs. diabetic control group. n.s., non-significant. The sample size in each group comprised of five mice (n = 5).
Effect on Body Weight
At 20th treatment day, body weight of DPAA 1, 5 and 10 mg/Kg treated groups were improved by +3.8, +3.5, and +2.3 g values respectively. Body weight of metformin (500 mg/Kg) treated group was reduced to −1.8 g at 20th treatment day (Table 5). At 20th treatment day, body weight of DPC1 1, 5, and 10 mg/Kg treated group changed by −1.0, +5.0, and −0.6 g values respectively (Table 6).
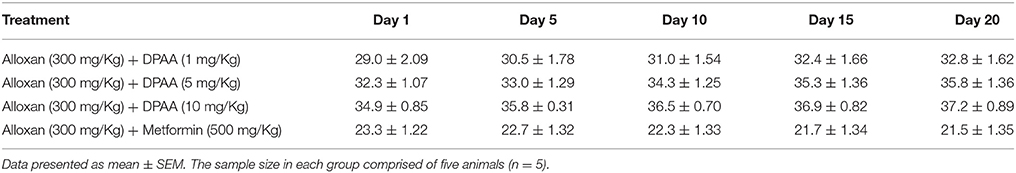
Table 5. Effect of bis (diphenylacetato) cadmium (II) (DPAA) and metformin at different treatment days on body weight (g) of alloxan-induced diabetic mice.
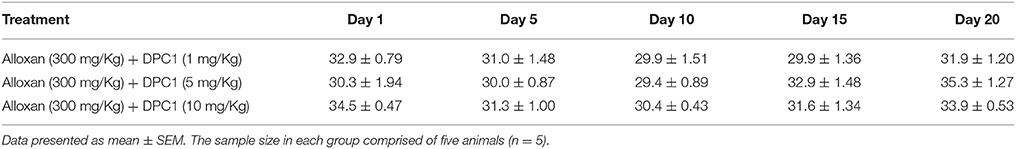
Table 6. Effect of 1-(4-chlorobenzoyl)-3-(4-ferrocenylphenyl) urea (DPC1) at different treatment days on body weight (g) of alloxan-induced diabetic mice.
Effect on Glucose Tolerance
At 0, 30, 60, 90, and 120 min., blood glucose levels of non-diabetic control (saline, 10 mL/Kg) group were 266 ± 12.53, 204 ± 18.50, 168 ± 11.97, 145 ± 14.17, and 111 ± 6.68 mg/dL respectively. Blood glucose levels of alloxan (300 mg/Kg) treated diabetic control group were 457 ± 60.44, 473 ± 54.63, 402 ± 73.62, 376 ± 59.66, and 403 ± 66.36 mg/dL respectively. Blood glucose levels of DPAA (10 mg/Kg) treated group were 477 ± 28.40, 361 ± 50.34, 283 ± 48.48, 238 ± 46.97, and 193 ± 30.19 mg/dL (P < 0.001 vs. diabetic control) respectively. Blood glucose levels of metformin (500 mg/Kg) treated group were 275 ± 19.46, 246 ± 18.20 (P < 0.01 vs. diabetic control), 178 ± 32.80 (P < 0.05 vs. diabetic control), 147 ± 27.66 (P < 0.01 vs. diabetic control) and 113 ± 21.55 mg/dL (P < 0.001 vs. diabetic control) respectively (Figure 7). Blood glucose levels of DPC1 (5 mg/Kg) treated group were 317 ± 36.79, 205 ± 23.35, 138 ± 8.12, 100 ± 9.69, and 87 ± 4.97 mg/dL, with significance level of P < 0.001 vs. diabetic control at 30, 90, and 120 min., while P < 0.01 vs. diabetic control at 60 min (Figure 8).
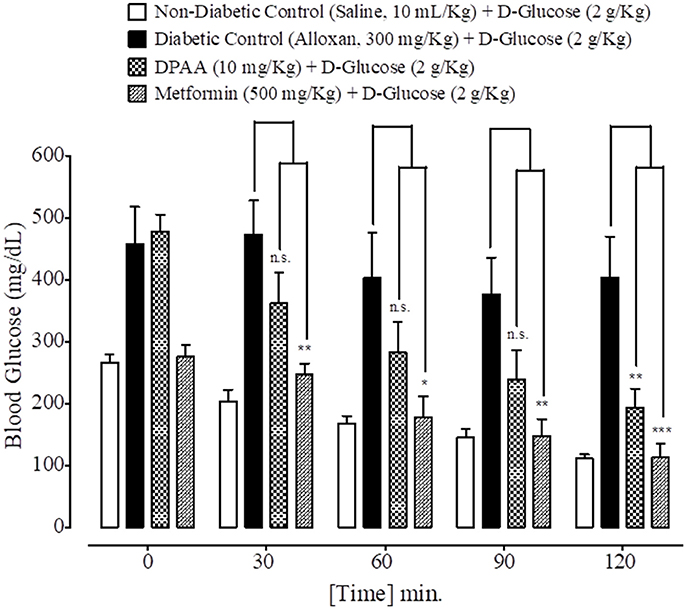
Figure 7. Bar graph representing blood glucose levels at different time intervals (0–120 min.) after administration of oral glucose load in mice of saline treated group (non-diabetic control), alloxan treated group (diabetic control), bis (diphenylacetato) cadmium (II) (DPAA) treated group and metformin pre-treated group. Data expressed as mean ± SEM. Statistical analysis used one-way ANOVA, followed by post-hoc Tukey's test. *P < 0.05, **P < 0.01, ***P < 0.001 comparison of the blood glucose levels of DPAA and metformin treated group vs. diabetic control group. n.s., non-significant. The sample size in each group comprised of five mice (n = 5).
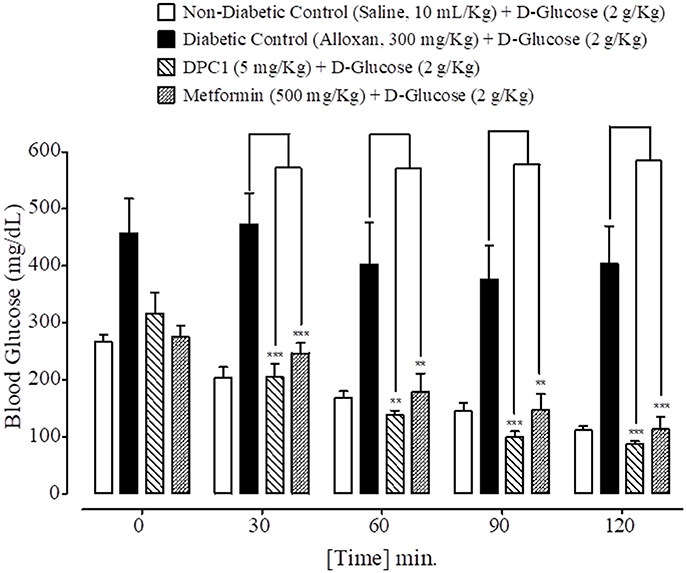
Figure 8. Bar graph representing blood glucose levels at different time intervals (0–120 min.) after administration of oral glucose load in mice of saline treated group (non-diabetic control), alloxan treated group (diabetic control), 1-(4-chlorobenzoyl)-3-(4-ferrocenylphenyl) urea (DPC1) treated group and metformin treated group. Data expressed as mean ± SEM. Statistical analysis used one-way ANOVA, followed by post-hoc Tukey's test. **P < 0.01, ***P < 0.001 comparison of the blood glucose levels of DPC1 and metformin treated group vs. diabetic control group. The sample size in each group comprised of five mice (n = 5).
Effect on HbA1C
HbA1C value of non-diabetic control (saline, 10 mL/Kg) group was 3.1%. DPAA and DPC1 (1, 5, and 10 mg/Kg) treated group showed significant (P < 0.001 vs. diabetic control group) reduction in the HbA1C levels in alloxan-induced diabetic animals. Metformin (500 mg/Kg) treated showed reduction in HbA1C levels having P < 0.001 compared to the diabetic control group (Table 7).
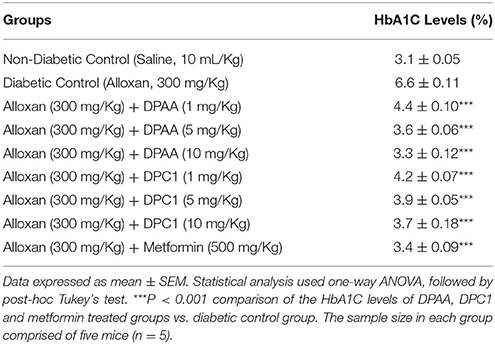
Table 7. Effect of bis (diphenylacetato) cadmium (II) (DPAA), 1-(4-chlorobenzoyl)-3-(4-ferrocenylphenyl) urea (DPC1) and metformin on glycosylated hemoglobin A1C (HbA1C) in mice.
Acute Toxicity
DPAA at doses of 15, 25, 50, and 100 mg/Kg caused 40, 80, and 100% mortality respectively. DPC1 at tested doses of 25, 50, and 100 mg/Kg did not exhibit any mortality (Table 8).
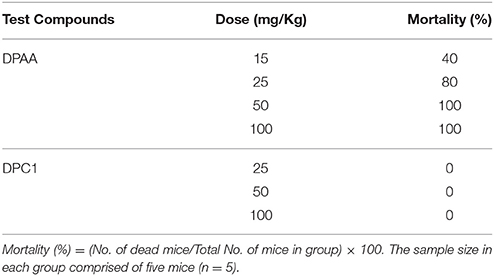
Table 8. Percentage (%age) mortality of mice caused by bis (diphenylacetato) cadmium (II) (DPAA) and 1-(4-chlorobenzoyl)-3-(4-ferrocenylphenyl) urea (DPC1) at different doses.
Discussion
The application of computational approaches has turn out to be vital constituent of drug discovery strategy processes and ligand/structure based virtual screening is extensively used for this purpose (Langer and Hoffmann, 2001; Bajorath, 2002). From 1980s, molecular docking was found to be a key method of structure based virtual screening and it is still a very active area in research (Kuntz et al., 1982; Gohlke and Klebe, 2002; Kitchen et al., 2004). Virtual screening carried out through molecular docking that has become essential for quick and cost effective screening of the ligands on basis of structures (de Lange et al., 2014; Zhong et al., 2015). Patch dock server used in the study, assess ligand-protein complex by scoring on basis of appropriate geometry and atomic desolvation free energy (Schneidman-Duhovny et al., 2005). Lower ACE value indicates lower desolvation energy which is favorable for ligand-protein complex (Guo et al., 2012). In stated cases, strength of π-π interaction for stabilization of structural complex is comparable to the strength of hydrogen bonding (Blakaj et al., 2001). In ground state, loss of π-π interaction does not lead to affect the active-site conformation but results in 20–30 times reduction in the rate constant of chemical activity (Pecsi et al., 2010). Hydrophobic interactions can also enhance affinity of ligand against target protein (Patil et al., 2010). Evaluation of binding affinity between ligands and proteins complexes was done by assessing ACE value, H-bonds, π-π interaction and hydrophobic interactions.
We have found in this study, DPAA showed best binding score with lowest ACE value against GK and most of the target proteins than standard and other test compounds. We can anticipate that it has highest binding affinity against GK. The ligands order of affinity against GK was found as; DPAA > DPC1 > DMC1 > DOC1 > CPAA > PFA > metformin. The ligands order of affinity against AR was shown as; DOC1 > DPC1 > DPAA > DMC1 > CPAA > PFA > metformin. Test compounds that are high in order formed π-π bonds, hydrophobic bonds and H-bonds with GK and AR, while metformin and miglitol showed only H-bonding. Moreover all ligands interact with allosteric binding site of GK (Matschinsky et al., 2006; Min et al., 2017) and AR (Antony and Vijayan, 2015). The ligands order of affinity against AA was found as; DPAA > DPC1 > DMC1 > DOC1 > CPAA > PFA > miglitol. Compounds with high affinity did not show binding with TRP59, ASP197, and GLU233 which are reported as essential amino acid residue of AA (Piparo et al., 2008). Only DMC1 showed interaction against TRP59, but do not show highest binding affinity. The ligands order of affinity against FBP1 was shown as; DPAA > DMC1 > DOC1 > DPC1 > PFA > metformin > CPAA. Along with H-bonds and hydrophobic interactions, other interactions such as alky, π-alky and van der waals interactions are shown by test compounds with high affinity. Amino acids; PRO188, ARG49, ALA51, ALA189, and PRO100 are found to be important. The ligands order of affinity against PEPCK was found as; DMC1 > DPAA > DOC1 > DPC1 > CPAA > PFA > metformin. All ligands exhibited interactions with reported binding site of PEPCK (Katiyar et al., 2015). Moreover, H-bonding is found to be important for ligand-PEPCK complex.
The ligands order of affinity against GP was found as; DOC1 > DPAA > DMC1 > DPC1 > CPAA > metformin > PFA. DOC1, DPAA, and DMC1 showed interactions with ASP283, a conservative amino acid (Hudson et al., 1993) and ARG569 that is responsible for salt bridge interactions (Barford and Johnson, 1989). The ligands order of affinity against N-AG was found as; DPAA > 1 > DMC1 > DPC1 > CPAA > PFA > miglitol. Ligands are not involved in making any strong bonding with reported binding site (Saqib and Siddiqi, 2008). The ligands order of affinity against C-AG was found as; DPAA > DPC1 > DOC1 > DMC1 > CPAA > PFA > miglitol. H-bonds and hydrophobic interactions are found to be important, but ligands did not show bonding with stated binding site (Ren et al., 2011). Amino acid ASN1776 is found to be vital. The ligands order of affinity against GSK-3β was found as; DPAA > DPC1 > DOC1 > DMC1 > CPAA > TDZD-8 > PFA. All ferrocene derivatives showed interactions with CYS199 which is reported as important amino acid of binding site (Perez et al., 2011). DPAA lack interaction with CYS199, but still exhibited high binding affinity.
The ligands order of affinity against 11β-HSD1 was found as; carbenoxolone > DPAA > DPC1 > DMC1 > DOC1 > CPAA > PFA. Carbenoxolone, DPAA and DPC1 exhibited high affinity and formed interactions with TYR177 which is reported as key amino acid (Kim et al., 2006). The ligands order of affinity against p-Akt was found as; DPAA > DOC1 > rosiglitazone > DMC1 > DPC1 > PFA > CPAA. Ligands having high binding affinity formed interactions with TYR272 and VAL270. The ligands order of affinity against PI3K was found as; rosiglitazone > DPAA > CPAA > DOC1 > DPC1 > DMC1 > PFA. It is revealed that homoleptic cadmium carboxylates showed more affinity than ferrocene incorporated acyl ureas. The ligands order of affinity against PPAR-γ was found as; DPAA > rosiglitazone > DPC1 > DMC1 > DOC1 > CPAA > PFA. Ligand with high affinity showed hydrophobic interactions. All ligands showed interaction with ARG288, an essential amino acid of binding site (Choi et al., 2010). The ligands order of affinity against DPP IV was found as; DOC1 > DMC1 > DPC1 > DPAA > CPAA > sitagliptin > PFA. DOC1, DMC1 and DPC1 showed different interactions with HIS363, LEU410, and ALA409. These amino acid residues are found to be crucial against DPP IV. The ligands order of affinity against PTP-1B was found as; ertiprotafib > DPAA > DMC1 > DPC1 > CPAA > PFA > DOC1. Ligands showed interactions with amino acid PRO206. Ligands having high affinity showed H-bonds and hydrophobic interactions against PRO206. Interaction with amino acids of reported binding site was not shown by any ligand (Jin et al., 2016).
In current study, only enzymes are targeted that are involved in activation or inhibition of pathways important for pathogenesis of diabetes. By using molecular docking technique, ligands can be tested against other possible anti-diabetic targets such as sulfonylurea receptors, GLUT 1, GLUT 2, and GLUT 4 receptors as well as ion channels such as involvement of calcium channels, ligand gated K+ channels and Na+/K+ transporters. In result of virtual screening, DPAA and DPC1 are found to be potential agonists of GK. GK activating effect can be a proposed mechanism for anti-diabetic effect. Alloxan-induced diabetes model was used to validate the GK activating effect of DPAA and DPC1. It has been reported that GK activity was found to be same in alloxan- and streptozotocin-induced diabetes by depletion of β-cells as in control group (Matschinsky, 2009).
DPAA and DPC1 (1 mg/Kg) exhibited results like diabetic control group, so dose <1 mg/Kg cannot be used for significant anti-diabetic activity. DPAA (5 and 10 mg/Kg) and DPC1 (5 mg/Kg) showed time-dependent hypoglycemic effect than metformin. DPC1 (10 mg/Kg) produced abrupt increase in glucose levels at day 5 and 10th. Normally 1–2 mg of iron circulates in the blood (Andrews, 1999). Iron overload can lead to insulin resistance and impaired glucose utilization. Enhanced insulin sensitivity and glucose utilization has been reported in iron-deficient rats than iron-sufficient control group (Henderson et al., 1986; Borel et al., 1993). This effect can also be resulted by catalysis of highly reactive OH· radicals formation by iron via Fenton reaction (Crichton et al., 2002). DPC1 dose ≥10 mg/kg can reverse the hypoglycemic effect, while toxicity test revealed 10 mg/Kg as highest safest dose of DPAA.
DPAA and DPC1 reversed the reduced body weight compared to metformin. Both compounds enhanced the oral glucose tolerance as caused by metformin. Compounds produced dose-dependent effect in reducing HbA1C levels and found to be effective as long term anti-diabetic agent (Koenig et al., 1976). Enhanced hypoglycemic effect of DPAA could be due to the reduction of plasma selenium levels by cadmium moiety (Gümüşlü et al., 1997; Bleys et al., 2007) along with α-glucosidase inhibition by carboxylate group (Roy et al., 2015). Higher effect of DPC1 could be possible by GP inhibition due to acyl urea group (Klabunde et al., 2005). Antioxidant effect of DPC1 could also be the proposed mechanism for anti-diabetic activity (Asghar et al., 2015).
Conclusions
Computational studies reveal binding affinities of selected ferrocene-based acyl ureas (PFA, DPC1, DMC1, and DOC1) and homoleptic cadmium carboxylates (DPAA and CPAA) against different proteins targets involved in pathogenesis of DM. Highest affinity was exhibited by DPAA and DPC1 against glucokinase. In vivo assays also validated the anti-diabetic effect of DPAA and DPC1. Both of the test compounds enhanced the glucose tolerance and decrease the HbA1C levels.
Author Contributions
SB carried out the computational studies, in vivo experimentations, evaluation of results and documentation. AK supervised the research project and drafted the final manuscript. FA and AB provided ferrocene derivatives. MU and SA provided the cadmium carboxylates. All authors read and approved the final manuscript.
Conflict of Interest Statement
The authors declare that the research was conducted in the absence of any commercial or financial relationships that could be construed as a potential conflict of interest.
Acknowledgments
Authors are thankful to Ms. Hira Shahid, Department of Statistics, Quaid-e-Azam University Islamabad, for providing technical support in usage of softwares, evaluation of results and confirmation of statistics applied. We are also grateful to Riphah Academy of Research and Education (RARE), Riphah International University and Cantt Laboratory and Medical Imaging, for facilitation and support.
Supplementary Material
The Supplementary Material for this article can be found online at: https://www.frontiersin.org/articles/10.3389/fphar.2017.01001/full#supplementary-material
References
Anderson, R. A., Cheng, N., Bryden, N. A., Polansky, M. M., Cheng, N., Chi, J., et al. (1997). Elevated intakes of supplemental chromium improve glucose and insulin variables in individuals with type 2 diabetes. Diabetes 46, 1786–1791. doi: 10.2337/diab.46.11.1786
Andrews, N. C. (1999). Disorders of iron metabolism. New Eng. J. Med. 341, 1986–1995. doi: 10.1056/NEJM199912233412607
Antony, P., and Vijayan, R. (2015). Identification of novel aldose reductase inhibitors from spices: a molecular docking and simulation study. PLoS ONE 10:e0138186. doi: 10.1371/journal.pone.0138186
Asgary, S., Parkhideh, S., Solhpour, A., Madani, H., Mahzouni, P., and Rahimi, P. (2008). Effect of ethanolic extract of Juglans regia L. on blood sugar in diabetes-induced rats. J. Med. Food 11, 533–538. doi: 10.1089/jmf.2007.0611
Asghar, F., Badshah, A., Hussain, R. A., Sohail, M., Akbar, K., and Butler, I. S. (2015). Synthesis, structural characterization, DNA binding and antioxidant potency of new ferrocene incorporated acyl ureas. J. Organomet. Chem. 797, 131–139. doi: 10.1016/j.jorganchem.2015.08.010
Asghar, F., Badshah, A., Lal, B., Zubair, S., Fatima, S., and Butler, I. (2017). Facile synthesis of fluoro, methoxy, and methyl substituted ferrocene-based urea complexes as potential therapeutic agents. Bioorg. Chem. 72, 215–227. doi: 10.1016/j.bioorg.2017.04.016
Bajorath, J. (2002). Integration of virtual and high-throughput screening. Nat. Rev. Drug Discov. 1, 882–894. doi: 10.1038/nrd941
Barberà, A., Gomis, R., Prats, N., Rodríguez-Gil, J., Domingo, M., Gomis, R., et al. (2001). Tungstate is an effective antidiabetic agent in streptozotocin-induced diabetic rats: a long-term study. Diabetologia 44, 507–513. doi: 10.1007/s001250100479
Barford, D., and Johnson, L. (1989). The allosteric transition of glycogen phosphorylase. Nature 340, 609–616. doi: 10.1038/340609a0
Blakaj, D. M., McConnell, K. J., Beveridge, D. L., and Baranger, A. M. (2001). Molecular dynamics and thermodynamics of protein– rna interactions: mutation of a conserved aromatic residue modifies stacking interactions and structural adaptation in the U1A– stem loop 2 RNA complex. J. Am. Chem. Soc. 123, 2548–2551. doi: 10.1021/ja005538j
Bleys, J., Navas-Acien, A., and Guallar, E. (2007). Serum selenium and diabetes in US adults. Diabetes Care 30, 829–834. doi: 10.2337/dc06-1726
Borel, M. J., Beard, J. L., and Farrell, P. A. (1993). Hepatic glucose production and insulin sensitivity and responsiveness in iron-deficient anemic rats. Am. J. Phys. Endo. Met. 264, E380–E390. doi: 10.1152/ajpendo.1993.264.3.E380
Bukhari, S. S., Abbasi, M. H., and Khan, M. A. (2015). Dose optimization of Alloxan for diabetes in albino mice. Biologica (Pakistan) 61, 301–305.
Chen, J., Dong, X., Zhao, J., and Tang, G. (2009). In vivo acute toxicity of titanium dioxide nanoparticles to mice after intraperitioneal injection. J. Appl. Toxicol. 29, 330–337. doi: 10.1002/jat.1414
Choi, J., Park, Y., Lee, H. S., Yang, Y., and Yoon, S. (2010). 1, 3-Diphenyl-1H-pyrazole derivatives as a new series of potent PPARγ partial agonists. Bioorg. Med. Chem. 18, 8315–8323. doi: 10.1016/j.bmc.2010.09.068
Crichton, R. R., Wilmet, S., Legssyer, R., and Ward, R. J. (2002). Molecular and cellular mechanisms of iron homeostasis and toxicity in mammalian cells. J. Inorg. Biochem. 91, 9–18. doi: 10.1016/S0162-0134(02)00461-0
de Lange, O., Wolf, C., Dietze, J., Elsaesser, J., Morbitzer, R., and Lahaye, T. (2014). Programmable DNA-binding proteins from Burkholderia provide a fresh perspective on the TALE-like repeat domain. Nucl. Acids Res. 42, 7436–7449. doi: 10.1093/nar/gku329
Doeing, D. C., Borowicz, J. L., and Crockett, E. T. (2003). Gender dimorphism in differential peripheral blood leukocyte counts in mice using cardiac, tail, foot, and saphenous vein puncture methods. BMC Clin. Pathol. 3:3. doi: 10.1186/1472-6890-3-3
Duhovny, D., Nussinov, R., and Wolfson, H. J. (2002). Efficient unbound docking of rigid molecules. Lecture Notes Comput. Sci. 2452, 185–200. doi: 10.1007/3-540-45784-4_14
Dunn, J. S., and McLetchie, N. (1943). Experimental alloxan diabetes in the rat. Lancet 242, 384–387. doi: 10.1016/S0140-6736(00)87397-3
Gohlke, H., and Klebe, G. (2002). Approaches to the description and prediction of the binding affinity of small-molecule ligands to macromolecular receptors. Angew. Chem. Int. Ed. 41, 2644–2676. doi: 10.1002/1521-3773(20020802)41:15<2644::AID-ANIE2644>3.0.CO;2-O
Gümüşlü, S., Yargiçoglu, P., Agar, A., Edremitlioglu, M., and Alicigüzel, Y. (1997). Effect of cadmium on antioxidant status in alloxane-induced diabetic rats. Biol. Trace Elem. Res. 57, 105–114. doi: 10.1007/BF02778193
Guo, F., Li, S. C., Wang, L., and Zhu, D. (2012). Protein-protein binding site identification by enumerating the configurations. BMC Bioinformatics 13:158. doi: 10.1186/1471-2105-13-158
Henderson, S. A., Dallman, P. R., and Brooks, G. A. (1986). Glucose turnover and oxidation are increased in the iron-deficient anemic rat. Am. J. Physiol. 250, E414–E421. doi: 10.1152/ajpendo.1986.250.4.E414
Heyliger, C. E., Tahiliani, A. G., and McNeill, J. H. (1985). Effect of vanadate on elevated blood glucose and depressed cardiac performance of diabetic rats. Science 227, 1474–1477. doi: 10.1126/science.3156405
Hudson, J. W., Golding, G. B., and Crerar, M. M. (1993). Evolution of allosteric control in glycogen phosphorylase. J. Mol. Biol. 234, 700–721. doi: 10.1006/jmbi.1993.1621
Jin, T., Yu, H., and Huang, X.-F. (2016). Selective binding modes and allosteric inhibitory effects of lupane triterpenes on protein tyrosine phosphatase 1B. Sci. Rep. 6:20766. doi: 10.1038/srep20766
Katiyar, S. P., Jain, A., Dhanjal, J. K., and Sundar, D. (2015). Mixed inhibition of cPEPCK by genistein, using an extended binding site located adjacent to its catalytic cleft. PLoS ONE 10:e0141987. doi: 10.1371/journal.pone.0141987
Kim, K. W., Wang, Z., Busby, J., Tsuruda, T., Chen, M., Hale, C., et al. (2006). The role of tyrosine 177 in human 11β-hydroxysteroid dehydrogenase type 1 in substrate and inhibitor binding: an unlikely hydrogen bond donor for the substrate. Biochim. Biophys. Acta 1764, 824–830. doi: 10.1016/j.bbapap.2006.02.008
Kitchen, D. B., Decornez, H., Furr, J. R., and Bajorath, J. (2004). Docking and scoring in virtual screening for drug discovery: methods and applications. Nat. Rev. 3, 935–949. doi: 10.1038/nrd1549
Klabunde, T., Wendt, K. U., Kadereit, D., Brachvogel, V., Burger, H.-J., Herling, A. W., et al. (2005). Acyl ureas as human liver glycogen phosphorylase inhibitors for the treatment of type 2 diabetes. J. Med. Chem. 48, 6178–6193. doi: 10.1021/jm049034y
Koenig, R. J., Peterson, C. M., Jones, R. L., Saudek, C., Lehrman, M., and Cerami, A. (1976). Correlation of glucose regulation and hemoglobin AIc in diabetes mellitus. N. Engl. J. Med. 295, 417–420. doi: 10.1056/NEJM197608192950804
Kuntz, I. D., Blaney, J. M., Oatley, S. J., Langridge, R., and Ferrin, T. E. (1982). A geometric approach to macromolecule–ligand interactions. J. Mol. Biol. 161, 269–288. doi: 10.1016/0022-2836(82)90153-X
Lal, B., Badshah, A., Altaf, A. A., Khan, N., and Ullah, S. (2011). Miscellaneous applications of ferrocene-based peptides/amides. Appl. Org. Chem. 25, 843–855. doi: 10.1002/aoc.1843
Langer, T., and Hoffmann, R. D. (2001). Virtual screening: an effective tool for lead structure discovery. Curr. Pharm. Design 7, 509–527. doi: 10.2174/1381612013397861
Marguet, D., Baggio, L., Kobayashi, T., Bernard, A. M., Pierres, M., and Nielsen, P. F. (2000). Enhanced insulin secretion and improved glucose tolerance in mice lacking CD26. Proc. Natl. Acad. Sci. U.S.A. 97, 6874–6879. doi: 10.1073/pnas.120069197
Mathers, C. D., and Loncar, D. (2006). Projections of global mortality and burden of disease from 2002 to 2030. PLoS Med. 3:e442. doi: 10.1371/journal.pmed.0030442
Matschinsky, F. M. (2009). Assessing the potential of glucokinase activators in diabetes therapy. Nat. Rev. Drug Discov. 8, 399–416. doi: 10.1038/nrd2850
Matschinsky, F. M., Magnuson, M. A., Zelent, D., Jetton, T. L., Doliba, N., Han, Y., et al. (2006). The network of glucokinase-expressing cells in glucose homeostasis and the potential of glucokinase activators for diabetes therapy. Diabetes 55, 1–12. doi: 10.2337/diabetes.55.01.06.db05-0926
Min, Q., Cai, X., and Sun, W. (2017). Identification of mangiferin as a potential Glucokinase activator by structure-based virtual ligand screening. Sci. Rep. 7:44681. doi: 10.1038/srep44681
Nathan, D. M., Buse, J. B., Davidson, M. B., Ferrannini, E., Holman, R. R., Sherwin, R., et al. (2009). Medical management of hyperglycemia in type 2 diabetes: a consensus algorithm for the initiation and adjustment of therapy. Diabetes Care 32, 193–203. doi: 10.2337/dc08-9025
Ozcelikay, A. T., Becker, D. J., Ongemba, L. N., Pottier, A. M., Henquin, J. C., and Brichard, S. M. (1996). Improvement of glucose and lipid metabolism in diabetic rats treated with molybdate. Am. J. Phys. Endo. Met. 270, E344–E352. doi: 10.1152/ajpendo.1996.270.2.E344
Pecsi, I., Leveles, I., Harmat, V., Vertessy, B. G., and Toth, J. (2010). Aromatic stacking between nucleobase and enzyme promotes phosphate ester hydrolysis in dUTPase. Nucl. Acids Res. 38, 7179–7186. doi: 10.1093/nar/gkq584
Perez, D. I., Palomo, V., Pérez, C., Gil, C., Dans, P. D., Luque, F. J., et al. (2011). Switching reversibility to irreversibility in glycogen synthase kinase 3 inhibitors: clues for specific design of new compounds. J. Med. Chem. 54, 4042–4056. doi: 10.1021/jm1016279
Piparo, E. L., Scheib, H., Frei, N., Williamson, G., Grigorov, M., and Chou, C. J. (2008). Flavonoids for controlling starch digestion: structural requirements for inhibiting human α-amylase. J. Med. Chem. 51, 3555–3561. doi: 10.1021/jm800115x
Ren, L., Qin, X., Cao, X., Wang, L., Bai, F., Bai, G., et al. (2011). Structural insight into substrate specificity of human intestinal maltase-glucoamylase. Protein Cell 2, 827–836. doi: 10.1007/s13238-011-1105-3
Patil, R., Das, S., Stanley, A., Yadav, L., Sudhakar, A., and Varma, A. K. (2010). Optimized hydrophobic interactions and hydrogen bonding at the target-ligand interface leads the pathways of drug-designing. PLoS ONE 5:e12029. doi: 10.1371/journal.pone.0012029
Roy, M., Devi, S. S., Roy, S., Singh, C., and Singh, K. S. (2015). Synthesis, characterization, crystal structures and in vitro antimicrobial activities of triorganotin (IV) complexes of azo-dicarboxylates. Inorg. Chim. Acta 426, 89–98. doi: 10.1016/j.ica.2014.11.030
Saqib, U., and Siddiqi, M. (2008). Probing ligand binding interactions of human alpha glucosidase by homology modeling and molecular docking. Intern. J. Integr. Biol. 2, 116–121.
Saudek, C. D., Herman, W. H., Sacks, D. B., Bergenstal, R. M., Edelman, D., and Davidson, M. B. (2008). A new look at screening and diagnosing diabetes mellitus. J. Clin. Endocrinol. Met. 93, 2447–2453. doi: 10.1210/jc.2007-2174
Schneidman-Duhovny, D., Inbar, Y., Nussinov, R., and Wolfson, H. J. (2005). PatchDock and SymmDock: servers for rigid and symmetric docking. Nucl. Acids Res. 33, W363–W367. doi: 10.1093/nar/gki481
Siva, L., and Kumar, V. S. (2013). Role of iron and copper in diabetics. Bull. Pharm. Med. Sci. 1, 210–221.
Sussman, J. L., Lin, D., Jiang, J., Manning, N. O., Prilusky, J., Ritter, O., et al. (1998). Protein Data Bank (PDB): database of three-dimensional structural information of biological macromolecules. Acta Cryst. Sect. D Biol. Crystallogr. 54, 1078–1084. doi: 10.1107/S0907444998009378
Tuomi, T. (2005). Type 1 and type 2 diabetes. Diabetes 54, S40–S45. doi: 10.2337/diabetes.54.suppl_2.S40
Ybarra, J., Behrooz, A., Gabriel, A., Koseoglu, M. H., and Ismail-Beigi, F. (1997). Glycemia-lowering effect of cobalt chloride in the diabetic rat: increased GLUT1 mRNA expression. Mol. Cell. Endocrinol. 133, 151–160. doi: 10.1016/S0303-7207(97)00162-7
Keywords: ferrocene-based acyl ureas, homoleptic cadmium carboxylates, molecular docking, anti-diabetic, mice
Citation: Bano S, Khan A, Asghar F, Usman M, Badshah A and Ali S (2018) Computational and Pharmacological Evaluation of Ferrocene-Based Acyl Ureas and Homoleptic Cadmium Carboxylate Derivatives for Anti-diabetic Potential. Front. Pharmacol. 8:1001. doi: 10.3389/fphar.2017.01001
Received: 02 November 2017; Accepted: 29 December 2017;
Published: 17 January 2018.
Edited by:
Ajay Sharma, Chapman University, United StatesReviewed by:
Cesario Bianchi, University of Mogi das Cruzes, BrazilFrancesco Pappalardo, Università degli Studi di Catania, Italy
Copyright © 2018 Bano, Khan, Asghar, Usman, Badshah and Ali. This is an open-access article distributed under the terms of the Creative Commons Attribution License (CC BY). The use, distribution or reproduction in other forums is permitted, provided the original author(s) or licensor are credited and that the original publication in this journal is cited, in accordance with accepted academic practice. No use, distribution or reproduction is permitted which does not comply with these terms.
*Correspondence: Arif-ullah Khan, YXJpZi51bGxhaEByaXBoYWguZWR1LnBr