 Joren De Smet1
 Filip Boyen2
 Siska Croubels1
 Geertrui Rasschaert3
 Freddy Haesebrouck2Patrick De Backer1
 Mathias Devreese1*
- 1Department of Pharmacology, Toxicology and Biochemistry, Faculty of Veterinary Medicine, Ghent University, Merelbeke, Belgium
- 2Department of Pathology, Bacteriology and Poultry Diseases, Faculty of Veterinary Medicine, Ghent University, Merelbeke, Belgium
- 3Technology and Food Science Unit, Flanders Research Institute for Agriculture, Fisheries and Food, Melle, Belgium
Florfenicol, which is licensed for veterinary use only, proves to be a potent antimicrobial for treatment of respiratory disease. However, the subsequent exposure of the gut microbiota to florfenicol is not well described. Hence, the effect of various administration protocols on both plasma and gastro-intestinal florfenicol concentrations in pigs was evaluated. In field situations were simulated by application of different administration routes and dosages [single oral bolus at 10 or 5 mg/kg body weight (BW), medicated feed at 10 or 5 mg/kg BW and intramuscular injections at 15 or 30 mg/kg BW]. After intramuscular administration of 30 mg florfenicol/kg BW, gastro-intestinal concentrations of florfenicol, quantified 10 h after the last administration, were significantly elevated in comparison with the other treatment groups and ranging between 31.5 and 285.8 μg/g over the different gut segments. For the other treatment groups, the influence of dose and administration route was not significantly different. Bacteriological analysis of the fecal samples from the animals at the start of the experiment, demonstrated the presence of both florfenicol susceptible (with minimal inhibitory concentration (MIC) values of 2–16 μg/mL) and florfenicol resistant (MIC ≥ 256 μg/mL) Escherichia coli isolates in all treatment groups. Following, at 10 h after the last administration the susceptible E. coli population was eradicated in all treatment groups due to the high intestinal florfenicol concentrations measured. Moreover, selection of the resistant E. coli strains during treatment occurred in all groups. This is likely related to the fact that the different treatment strategies led to high gastro-intestinal concentrations albeit not reaching the high magnitude of MIC values associated with florfenicol resistance (≥256 μg/mL). Conclusively, in our experimental setup the administration route and dose alterations studied, had no influence on monitored florfenicol resistance selection in E. coli from the microbiota.
Introduction
Antimicrobial resistance in bacteria is a constantly evolving phenomenon, with the extent of resistance increasing in parallel with the use of antimicrobials on a population level. The dissemination of antimicrobial resistance harbors the threat of compromising therapeutic efficacy in battling bacterial infections. Constraining these resistance issues is a crucial objective in human as well as in veterinary medicine. Current marketed antimicrobials are optimized solely based on their clinical efficacy, focussing on the target pathogen, without taking resistance selection in the commensal, non-target, microbiota into account. For instance, the intestinal microbiota (Liu et al., 2002). However, resistance in the microbiota poses a significant threat and concern for the spread of resistance in animals and also humans, according to the One Health approach (European Commission[EC], 2018). Hence, investigating the influence of the posology of antimicrobial therapy on selection of resistance in the commensal gut microbiota is an important strategy.
Florfenicol (FF), a derivate of chloramphenicol (CAP), is a broad-spectrum antimicrobial exclusively used in veterinary medicine. CAP has been banned for many years in food-producing animals, and is generally not used in human medicine because of its potential adverse effects such as aplastic anemia (Skolimowski et al., 1983). Thiamphenicol (TIA), another derivate, is available for parenteral use in case of severe infections (BCFI, 2018). Nonetheless, FF is safely applied in multiple animal species, such as swine, for respiratory tract infections. It exerts bacteriostatic activity against several bacterial species associated with porcine respiratory tract disease, including Actinobacillus pleuropneumoniae and Pasteurella multocida (Dorey et al., 2016). Acquired resistance to FF is generally very low or absent for these respiratory tract pathogens (Vanni et al., 2012). Apart from these target pathogens, the gut microbiota could also be exposed to FF during treatment. In general, FF has bacteriostatic activity against Enterobacteriaceae such as Escherichia coli and Salmonella Typhimurium, though often with elevated minimal inhibitory concentration (MIC) values (Syriopoulou et al., 1981). Several plasmids carrying FF resistance genes have already been associated with acquired FF resistance in E. coli isolates obtained from pigs (Blickwede and Schwarz, 2004) and cattle (Singer et al., 2004). Hence, antimicrobial therapy with FF could select for resistant E. coli, populations residing in the microbiota. Acrangioli et al. (2000) reported that all FF resistant isolates monitored, harbored floR resistance genes, conferring for an efflux protein belonging to the major facilitator (MF) superfamily of drug exporters (Braibant et al., 2005). Furthermore these isolates also displayed multiple drug resistance conferring to the ACSSuT (ampicillin, chloramphenicol, streptomycin, sulphonamides, and tetracyclines) genotype. Hence, FF induced selection of multi-drug resistant strains in the gut microbiota could pose a significant risk in terms of multi-drug resistance spread (Mather et al., 2013). Resistance to FF is not mediated by CAP resistance determinants, such as the enzyme chloramphenicol acetyltransferase (CAT) or the gene cmlA (Singer et al., 2004). However, these resistance determinants are also linked to mobile genetic elements; hence co-selection of CAT resistance by use of FF is also possible (Blickwede and Schwarz, 2004).
In order to assess the effects of an antimicrobial treatment on the microbiota, intestinal concentration data could provide valuable insights, which are lacking for many molecules in the current literature. For instance data on FF intestinal concentrations and subsequent microbiota exposure, during conventional treatment strategies in pigs, are not publicly available. In general, parenteral administration allows for more accurate dosing. Furthermore, it is assumed that a parenteral administration will lead to less gastro-intestinal exposure of the microbiota, because no absorption from the gut is required. This is in contrast with oral administration of antimicrobials. Nevertheless, De Smet et al. (2017) recently reported that similar gut concentrations of sulfadiazine and trimethoprim were obtained in pigs after oral and parental treatment. The same observation was reported by Devreese et al. (2014) after administering different doses of enrofloxacin in broilers via oral or parenteral route.
The present study investigated the gastro-intestinal concentrations of FF in different gut segments after administering the antimicrobial through oral gavage (not used in-field) and via medicated feed or intramuscular (IM) injection to simulate the actual in-field situation (Callens et al., 2012). Different dosage schemes were administered to assess the possible dose-related pharmacokinetic (PK) properties of FF. Subsequently; the fecal samples from the same animals were also used to study the selective effect for FF resistance in E. coli, as a Gram-negative indicator bacterium for the intestinal microbiota.
Materials and Methods
Animal Experiment
The animal experiment was approved by the Ethical Committee of the Faculties of Veterinary Medicine and Bioscience Engineering of Ghent University (case number EC 2015-16). The experiment was conducted with 36 pigs (Topigs 20, 12 weeks old, mixed genders) randomly divided into six FF treatment groups, each with a specific dosing scheme (Table 1). The animals were group-housed (n = 3) in separate confinements, within the same stable, on 50/50 concrete floor/grids. Before the start of the experiment all animals were allowed an acclimatization period of 5 days. For administration through oral gavage (groups 1 and 2), Amphen® oral granulated powder was used (Huvepharma NV, Antwerpen, Belgium). Groups 1 and 2 were administered an individually calculated single bolus, based on bodyweight (BW), of 5 mg FF/kg BW and 10 mg FF/kg BW, respectively, for 5 consecutive days. For the IM administrations (groups 3 and 4), Colfen® (Zoetis, Zaventem, Belgium) was administered twice in total, with a 48-h-interval, as described by the manufacturer at doses of 15 mg FF/kg BW and 30 mg FF/kg BW, respectively. The injection site was located in the neck, behind the base of the ear. In groups 5 and 6, FF was administered via medicated feed based on the average group BWs (per confinement of 3 animals). For these administrations, Floron® premix (KRKA Belgium NV, Sint-Niklaas, Belgium) was mixed into feed at an under dosage of 5 mg FF/kg BW and at conventional doses of 10 mg FF/kg BW, respectively for groups 5 and 6, again for 5 consecutive days. The animals received the complete amount of medicated feed in one administration at a fixed time point; allowing feed uptake during several hours. However, no ad libitum access to medicated feed was allowed, in order to estimate feed intake correctly. Blood samples (±1 mL) were collected in all treatment groups (n = 36) in heparin-containing vacuum tubes (Vacutest Kima, Arzergrande, Italy), through venepuncture (vena jugularis) at different time points (0.5, 1, 2, 3, 4, 6, 8, and 10 h) after the first administration of FF in each group. At time point 0 h and 10 h after the first administration, fecal samples were also collected in all treatment groups (n = 36) via rectal stimulation. Plastic sterile cups (40 mL) were filled, but contents were not quantified during collection. For the remaining treatment days, blood was collected at fixed time points, corresponding with the estimated time at maximal plasma concentrations (Tmax) of 2 h post-administration in all treatment groups (n = 36). Furthermore, blood was also collected every 10 h post-administration and also prior to the next FF administration in all treatment groups (n = 36). Fecal samples were collected (via rectal stimulation) twice daily, pre- and 10 h post-administration of FF in all treatment groups (n = 36) during the remainder of the experiment.
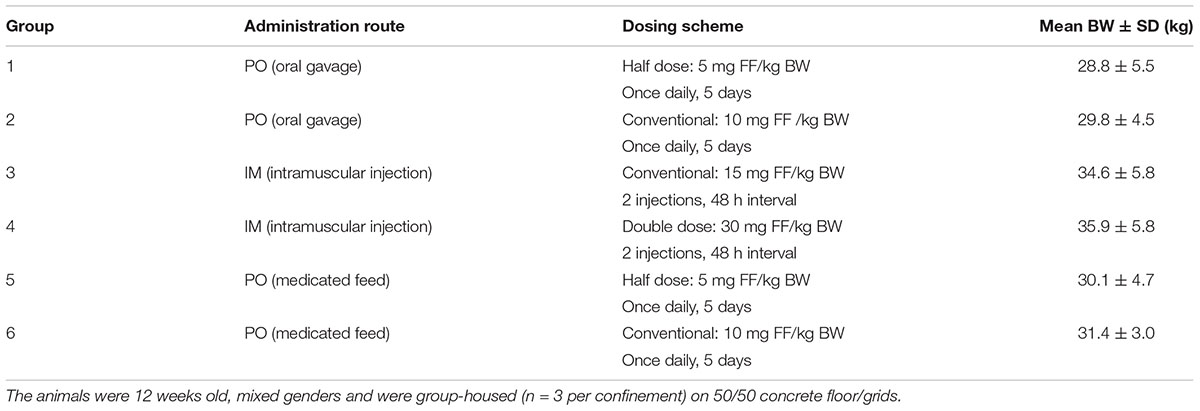
TABLE 1. Overview of the different treatment groups with mean bodyweight (BW), for the animal experiment.
On day three and five after initiating treatment, the animals of the IM and oral groups, respectively were euthanized, at 10 h after the last administration. Euthanasia was exerted with an intra-cardiac injection of sodium pentobarbital 20% (Kela Veterinaria, Sint-Niklaas, Belgium) after anaesthesia with a mix of 0.3 mg/kg BW xylazine (Xyl-M®, V.M.D. Vet, Arendonk, Belgium) and 15 mg/kg BW tiletamine-zolazepam (Zoletil 100®, Vibrac, Barneveld, Netherlands). Intestinal contents (luminal) were collected from different gut segments (duodenum, mid-jejunum, ileum, cecum, mid-colon, and rectum). The contents were sampled in a qualitative manner by use of sterile plastic beakers, and each sample was weighed. All blood samples were centrifuged (2851 × g, 10 min, 4°C) and plasma was collected and stored at ≤ -15°C for a maximum of 8 weeks until analysis for FF concentration. All fecal samples and intestinal contents were lyophilised for 48 h consecutively and weighed again afterward, and were manually grounded homogenously and stored at ≤ -80°C for a maximum of 20 weeks until quantitative and bacteriological analysis.
Analysis of Florfenicol in Plasma and Intestinal Content
Chemicals and Reagents
Analytical grade Ultra Performance Liquid Chromatography (UPLC) solvents were used: acetonitrile (ACN), methanol (MeOH) and water (H2O) from Fisher Scientific (Erembodegem, Belgium), ethyl acetate and glacial acetic acid from VWR (Leuven, Belgium). The analytical standard of FF and internal standard thiamphenicol (TIA) were purchased from Sigma-Aldrich (Diegem, Belgium). Standard stock solutions of 1.0 mg/mL were prepared in a H2O/MeOH solution (50/50 v/v) and were stored airtight and protected from light at 4–8°C for a maximal period of 3 weeks. Phosphate-buffered saline (PBS) was obtained from Sigma-Aldrich (Diegem), and sodium hydroxide (NaOH) from VWR (Leuven).
Sample Preparation
The fecal and intestinal samples were lyophilised. The loss-on-drying from each sample was compensated for based on the weights of the samples pre -and post lyophilisation, determined by use of an analytical balance. These samples were then weighed for quantitative analysis (1.0 g) and diluted 10-fold in PBS. Following, sample treatment for fecal and plasma samples was based on liquid-liquid extraction (LLE). Briefly, 25.0 μL of the internal standard solution (TIA, 100.0 μg/mL) and 100.0 μL of a 1M NaOH solution (pH 9 for optimal extraction yield) were added to each of the fecal and intestinal samples. Next, LLE was performed by adding 6 mL ethyl acetate. After roller-mixing (10 min) and centrifugation (2851 × g, 10 min), the supernatant was separated and dried under nitrogen flow (40 ± 2°C). The extract was reconstituted using 500.0 μL of a 90/10 v/v H2O/ACN solution. Processing of plasma samples was very similar; 25.0 μL of the internal standard (TIA, 50.0 μg/mL) and 25.0 μL of a 1M NaOH solution were added to the plasma aliquot of 250 μL, 3 mL ethyl acetate was used for extraction. Reconstitution was achieved with 250.0 μL of a 90/10 v/v H2O/ACN solution.
UPLC-PDA Analysis
Liquid chromatography was performed on an Acquity UPLC H-Class system (Waters NV, Zellik, Belgium). Chromatographic separation was achieved using an Acquity UPLC C18 column (2.1 mm × 50 mm, d.p.: 1.7 μm) in combination with an Acquity UPLC VanGuard pre-column (2.1 mm × 5 mm, d.p.: 1.7 μm), both obtained from Waters NV (Zellik, Belgium). Column oven temperature was 45.0°C and the autosampler tray was kept at 8.0°C. Mobile phases for chromatographic separation consisted of 0.1% glacial acetic acid in H2O (A) and ACN (B). The following gradient elution program was applied: 0–3.75 min (90% A, 10% B), 3.75–5.5 min (linear gradient to 40% A, 60% B), 5.5–6.0 min (linear gradient to 5% A, 95% B), 6.0–8.0 min (5% A, 95% B), 8.0–8.30 min (linear gradient to 85% A, 15% B), 8.30–11.00 min (90% A, 10% B). Flow rate was 400 μL/min. For detection, an Acquity UPLC Photo Diode Array (PDA) detector (Waters NV, Zellik, Belgium) was used. System parameters for Ultra-Violet (UV) detection were optimized using working solutions, i.e., 0.1 μg/mL FF, and the internal standard TIA, in a H2O/ACN mixture (90/10 v/v). For the quantification of FF, a wavelength of 223 nm was selected for maximal absorbance, after measuring a full spectrum. The analytical method was validated based on different parameters (precision, accuracy, limit of detection (LOD), limit of quantification (LOQ), and goodness-of-fit) using matrix-matched calibrator and quality control samples. Validation was exerted according to De Baere et al. (2012).
Pharmacokinetic Analysis
Phoenix® WinNonlin® 6.3 (Pharsight-Certara, Princeton, NJ, United States) was used for the pharmacokinetic (PK) analysis of the data via non-compartmental modelling (NCA). The area under the curve (AUC) was calculated using the linear up-log down trapezoidal method. Furthermore, several PK parameters were calculated: area under the 24 h-time curve (AUC0-24 h), area under the 58 h- or 106 h-time-curve (AUC0-58 h or AUC0-106 h). The AUC0-58 h or AUC0-106 h values were also normalized for dosage administered by dividing these values with the actual dosage (μg) administered per animal: AUC0-58 h/D or AUC0-106 h/D. The maximal plasma or fecal concentrations Cmax and time of maximal concentration Tmax were also calculated by NCA.
Enumeration, Identification and Characterization of E. coli in Fecal Samples
The fecal samples collected at time point 0 h before treatment and at 10 h after the last treatment (58 h for IM groups, 106 h for oral groups) were used for enumeration of E. coli. For these analyses, samples of three pigs were randomly selected from each treatment group for testing. The freeze-dried samples were weighed (1 g), reconstituted and serially 10-fold diluted (weight-based) in sterile PBS. Next, a spiral plater (IUL S.A., Barcelona, Spain) was used for plating 40 μL of each dilution onto (i) McConkey agar n°3 (MC; Oxoid NV, Erembodegem, Belgium) and (ii) MC agar supplemented with 16 μg/mL FF (EUCAST ECOFF value of E. coli for FF). After drying for a few minutes, the agar plates were aerobically incubated at 37°C for at least 20 h before performing a total plate count, on the dilution with a colony density of 20–300 per plate (Sutton, 2011). Per plate up to 3 different, large and regular shaped lactose positive colonies were purified and identified by Matrix-Assisted Laser Desorption Ionization-Time-Of-Flight Mass Spectrometry (MALDI-TOF MS, Bruker Daltonik, Evere, Belgium). For this analysis, purified colonies were applied to the MALDI target plate and covered with the appropriate matrix (1 μL of α-cyano-4-hydroxycinnamic acid) as instructed by Bruker Daltonik. MBT Compass software 4.1 (Bruker Daltonik, Evere)) was used for obtaining spectra which were matched against a database of 6.120 mean spectra projections (MSP). Only score values of ≥2.000 were taken into account.
Repetitive element sequenced-based (rep)-PCR was used for determination of genetic diversity among the different collected E. coli isolates. The protocols and materials used were similar to Peeters et al. (2018).
Statistical Analysis
Statistical analysis was performed by using SPSS 25.0 (IBM, Chicago, IL, United States). Plasma or intestinal concentrations and water content results were compared between the groups by means of a single-factor analysis of variance (ANOVA) under the assumption of normality and equal variances (Levene’s test). For post-hoc testing either Tukey was selected or Games-Howell in case of non-equal variances, in either case the significance level α was set at p = 0.05. All data are represented as mean ± SD, with n indicating the number of observations, unless otherwise indicated. Mean + SD is displayed for the graphical representation of the data.
Results and Discussion
Analytical Method Validation
The validation results for the different parameters are presented in Supplementary Tables A, B. The limit of quantification (LOQ) for FF was 0.125 μg/g in feces and 0.100 μg/mL in plasma. All parameters fulfilled the validation criteria as described in the Supplementary Tables A,B and as given by the De Baere et al. (2012), the Veterinary International Conference of Harmonisation (VICH) guidelines (VICH, 2015) and the European Commission (EC) guidelines on the performance of analytical methods (Kehrenberg et al., 2004).
Animal Experiment
During treatment with FF all animals presented a known treatment side-effect, namely diarrhea. For most animals this occurred during the second day of treatment and lasted for the entire treatment period. However, all animals were found to be clinically healthy during the entire treatment period. No control data is available to compare the extent of diarrhea with untreated animals.
Plasma FF Concentrations
The average plasma concentrations + standard deviation (SD) after FF administration are displayed in Figure 1A for treatment groups 1, 2 and Figure 1B for treatment groups 3, 4, up to 10 h after the first administration and during the full treatment period (106 h oral groups 1, 2, and 58 h for the IM groups 3, 4). Blood sampling is displayed in Figure 1C for the groups receiving medicated feed (5 and 6), during the full treatment period (106 h). The plasma PK parameters that were calculated for the different treatment groups are shown in Table 2. These parameters for FF in plasma are in agreement with other literature reports for IM administration (Dorey et al., 2017) and in-feed mixing of FF (Jiang et al., 2006).
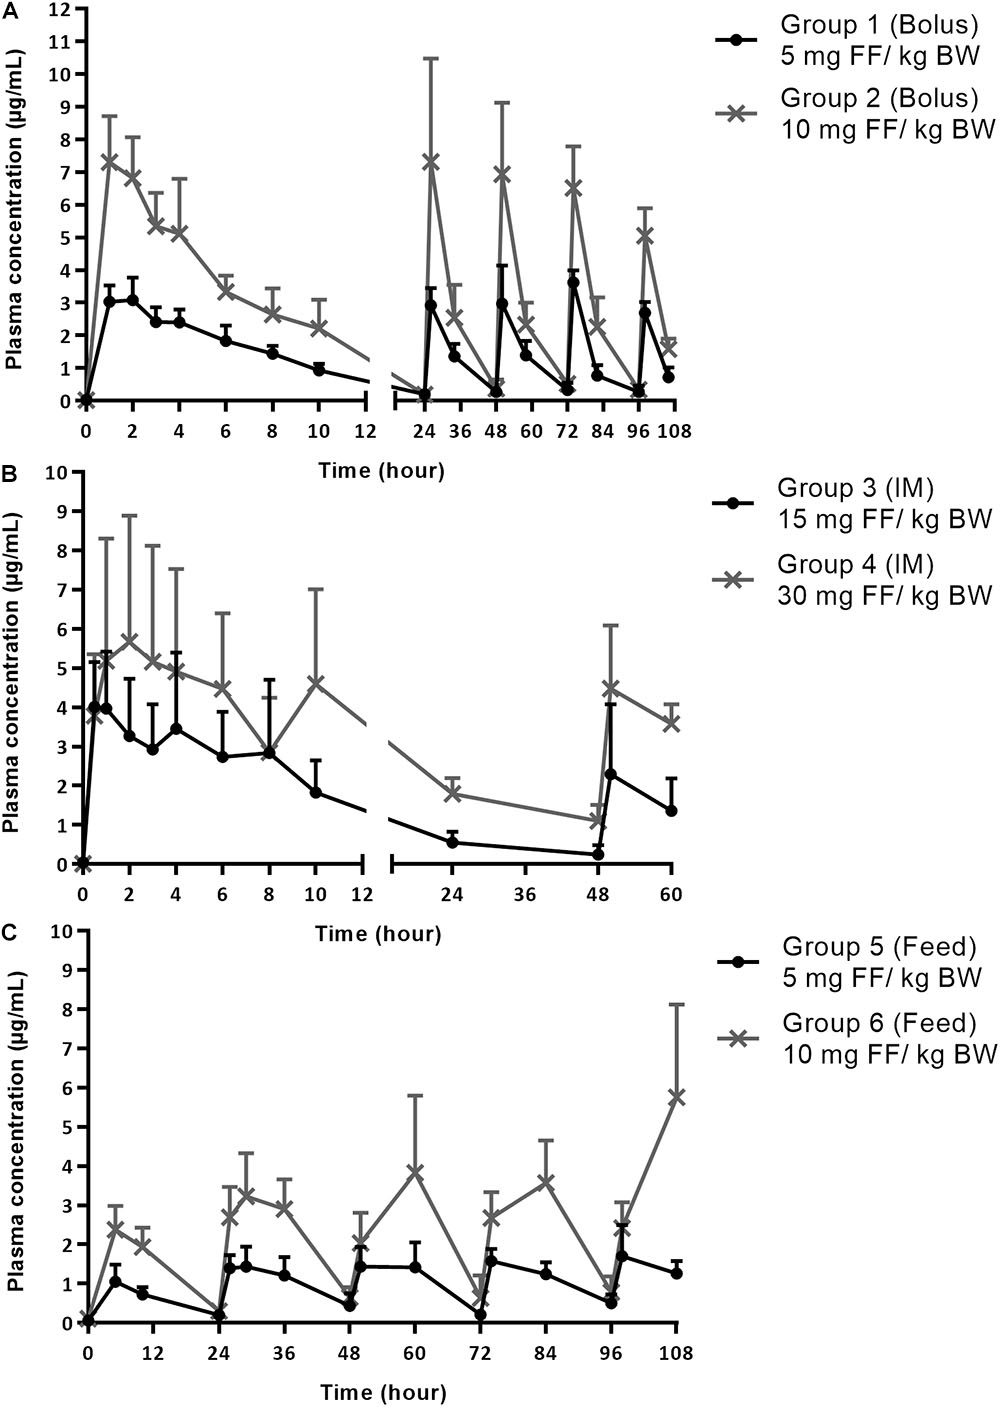
FIGURE 1. (A) Plasma concentrations of florfenicol (FF) after the first administration (0–24 h) and during entire treatment period (0–106 h) with bolus administration of 5 mg FF/kg BW in group 1 and 10 mg FF/kg BW in group 2. The bolus was administered once daily for 5 consecutive days. (B) Plasma concentrations of FF after the first administration (0–24 h) and during entire treatment period (0–58 h) with FF administered IM twice, with a 48 h-intervals in group 3 (15 mg FF/kg BW) and 4 (30 mg FF/kg BW). (C) Plasma concentrations of FF during entire treatment period (0–106 h) with medicated feed administered once daily at dosages of 5 mg FF/kg BW in group 5 and 10 mg FF/kg BW in group 6, for 5 consecutive days. All results are represented as mean + SD (n = 6).
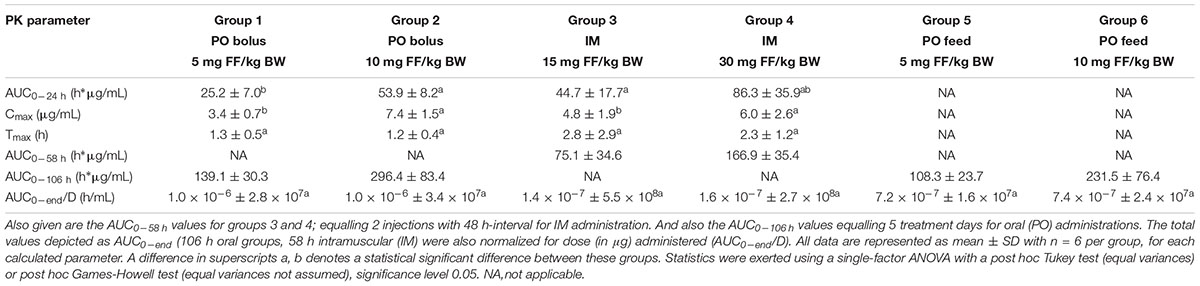
TABLE 2. Overview of plasma pharmacokinetic (PK) parameters of florfenicol (FF): area under the curve from 0 to 24 h (AUC0-24h) and within this time frame calculated maximal plasma concentration (Cmax), and time of Cmax (Tmax) for groups 1, 2, 3, and 4 after the first administration.
Similar plasma concentrations were reached over a 24-h-timespan after the oral bolus administration of FF and the IM administration for groups 1 and 3, respectively in this study, despite the lower oral dosage. These findings are also in accordance with a study by Liu et al.(2003) indicating high oral bioavailability, in the range of 100%, of FF in pigs. Thus in spite of its low solubility in water, oral administration of FF can lead to high systemic availability. Moreover, lower Cmax values were observed after IM administration in comparison with an oral bolus administration, which is likely due to a depot effect occurring in the muscle tissue and thus causing a prolonged slow release from the injection site, as also reported by Voorspoels et al. (1999) and Lobell et al (1994). The impact of in-feed mixing of FF on the oral bioavailability was also investigated by comparison of the AUC0-106 h values between the groups receiving oral bolus (1,2) and medicated feed (5,6) with the same respective dosages. No statistical significant differences (p < 0.05) were detected between group 1 and 5 (p = 0.91) and group 2 and 6 (p = 0.30). Hence, the plasma concentrations of FF during the 5-day treatment period are not statistically different after oral bolus or medicated feed administration, for a given dose. Finally, the relation between dose and plasma concentration was linear. After normalizing the AUC0-end values with the dose administered (in μg) for the sets of groups 1–2, 3–4, and 5–6, constant values between these sets of groups were achieved (Table 2). Hence, doubling or halving the dose of FF for the same administration route, will have a similar impact on systemic exposure to FF.
Intestinal and Fecal FF Concentrations
After lyophilisation of the intestinal and fecal samples, the loss of water content was calculated. Subsequently, the determined FF concentrations from the lyophilised material were compensated for based on the water loss from each individual sample. Hence, the FF concentrations as given throughout the manuscript are based on the weight of the actual samples, taking water content into account.
The intestinal concentrations in the different gastro-intestinal segments were compared over the different treatment groups (Table 3). Group 4, administered the highest dose of 30 mg FF/kg BW via IM injection, showed significantly higher (p < 0.05) FF concentrations in most of the gastro-intestinal segments (apart from ileum and colon) in comparison with the other groups. Group 6, administered medicated feed at 10 mg FF/kg BW, showed significantly higher jejunal concentrations in comparison with the other groups (apart from group 4). This is most probably related to the ongoing uptake of FF in the proximal segments, after medicated feed administration. The high FF concentrations established after IM administration are likely related to a mechanism of enterohepatic recirculation (Liu et al., 2003) and/ or a gastro-intestinal secretion from blood to gut lumen (De Smet et al., 2017), consequently these processes can also occur after oral administration of FF. However, neither of these mechanisms has been elucidated for FF in pigs. Furthermore, no significant differences were detected when comparing the intestinal concentrations between the other treatment groups over the different gastro-intestinal segments. These data suggest that the administration route has no effect on FF exposure in the gastro-intestinal tract. There is a dose-related influence, albeit not always statistically significant, with higher concentrations measured after administration of higher doses.
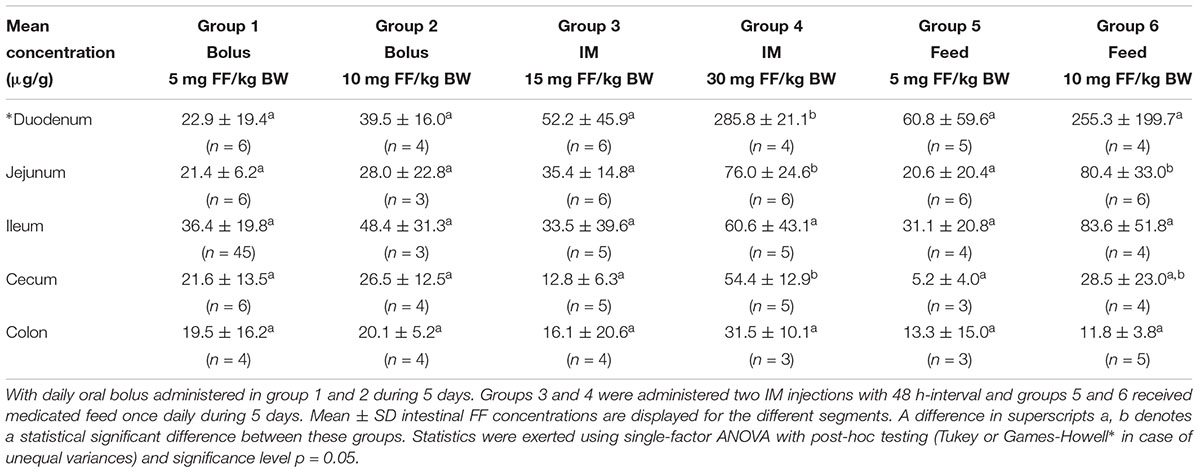
TABLE 3. Intestinal content concentrations of florfenicol (FF) in the different gastro-intestinal segments.
FF concentrations in fecal samples were below the LOQ of 0.125 μg/g in all treatment groups. However, transitional diarrhea, a well-known side effect of FF in pigs, could potentially contribute to dilution of the samples yielding low fecal concentrations. The exact cause of this adverse effect is not known; although it is commonly hypothesized these effects are due to the irritable properties of the molecule, its bacterial killing properties causing the release of endotoxins or a shift in microbiota during therapy (i.e., microbial dysbiosis). For the latter it has been demonstrated in mice that an antimicrobial-induced dysbiosis is related to an impaired gastro-intestinal motility and an increase in fecal water content (Caputi et al., 2017). In the present study, pigs in all treatment groups developed diarrhea. The extent of diarrhea was estimated by comparing the weight loss from the intestinal and fecal samples pre- and post-freeze-drying (Figure 2). Normally, resorption of water is one of the main functions of the distal gastro-intestinal segments, which results in less water content. However, in this study the water content was highest in the cecum and colon segments in all treatment groups. After post-hoc comparison of the different groups, significant differences were detected (p > 0.05) in water content within the same intestinal segment; in group 4 (30 mg FF/kg BW) the colon segment showed significantly higher mean (n = 6) water content in comparison with group 1 (p = 0.030). In the other intestinal segments, significant differences were not detected.
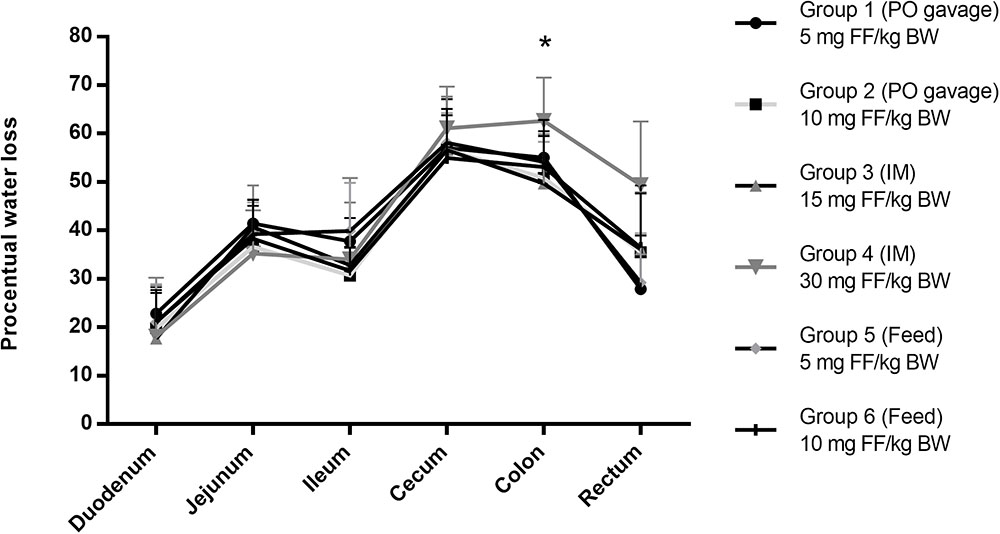
FIGURE 2. Water content calculated after a 48 h freeze-drying process of the intestinal content samples from all treatment groups. With the oral bolus groups 1 and 2 administered 5 and 10 mg FF/kg BW, respectively, groups 3 and 4 administered IM 15 and 30 mg FF/kg BW, respectively and groups 5 and 6 administered medicated feed at 5 and 10 mg FF/kg BW, respectively. Water content was calculated based on the sample weight pre- and post-freeze-drying. ∗Significant differences were detected between group 4 and group 1 (p = 0.030) after single-factor ANOVA with a post-hoc Tukey test (equal variances). No significant differences were detected for each of the other gastro-intestinal segments after a single-factor ANOVA with a post-hoc Tukey test (equal variances) or in case of the rectum segment a post-hoc Games-Howell test (equal variances not assumed), with significance level p = 0.05 for all tests.
In conclusion, this transient side-effect occurred during all treatment strategies applied in our experimental setup, meaning after 2 FF IM injections or after 5 days of one daily oral bolus or medicated feed administration, although a higher water content was observed for group 4 after IM administration of 30 mg FF/kg BW in cecum, colon and rectum.
Microbiological Experiments and Intestinal Florfenicol Pharmacokinetics
The microbiological analysis of the fecal samples revealed a mean E. coli colony forming unit (CFU) count of 3.08 × 10⁵ ± 1.99 × 10⁵ per g faeces over the different treatment groups at time point 0 h (Supplementary Table C). At this time point, the vast majority of the isolates (99.5% up to 100%) were unable to grow on the FF supplemented MacConkey agar plates (16 μg FF/mL). Moreover, all identified isolates (3 colonies per plate) retained from the un-supplemented MacConkey agar had FF MIC values ranging between 2 and 16 μg/mL, while the isolates retrieved from MacConkey agar plates supplemented with FF (n = 3 colonies), all showed MIC values of ≥ 256 μg/mL (gradient test strip upper limit). However, at the end of the treatment period (58 h for IM groups, 106 h for oral groups), a clear shift was observed. While the total E. coli count on plain MacConkey hardly changed after treatment, with mean counts over the different treatment groups of 6.78 105 ± 2.00 105 CFU/g, these populations consisted mainly of isolates (from 86.8 up to 100.0%) able to grow on the FF supplemented MacConkey agar plates (Supplementary Table C). All isolates retrieved at time point 58 h or 106 h showed MIC values of ≥ 256 μg/mL. All randomly selected and purified colonies were confirmed as E. coli by MALDI-TOF MS analysis, with score values of ≥2.300.
The bacteriological findings were subsequently combined with the PK data from the gastro-intestinal segments of the individual animals. Given the time-dependent (Watteyn et al., 2015) bacteriostatic effect of FF, the associated PK/PD index for efficacy is time above MIC in a 24 h dosing interval (T > MIC). However, because of the manner of intestinal sample collection, following euthanasia, a time-dependent gut concentration profile cannot be established over the whole course of therapy in this study. Hence, the intestinal concentrations measured in the different groups were matched with the wild-type MIC cut-off for susceptible isolates (16 μg/mL) and the gradient test strip upper limit for resistant isolates (256 μg/mL), as given in Figure 3. Data based on the PK/PD integration, complete eradication of susceptible E. coli strains in the different gastro-intestinal segments is predicted by the end of therapy, which was also reflected by the lack of susceptible isolates recovered from the fecal samples at the end of therapy. Furthermore, all resistant isolates retrieved at time 0 h and 58 h (end IM treatment) or 106 h (end oral treatment) displayed MIC values of at least 256 μg/mL, which is higher (apart from group 4) than the mean measured maximal FF concentrations ± SD (group 1: 36.4 ± 19.8 μg/g, group 2: 48.4 ± 31.3 μg/g, group 3: 52.2 ± 45.9 μg/g, group 4: 285.8 ± 21.1 μg/g, group 5: 60.8 ± 59.6 μg/g, group 6: 255.3 ± 199.7 μg/g), favoring selection of resistant isolates in all treatment regimens under FF pressure.
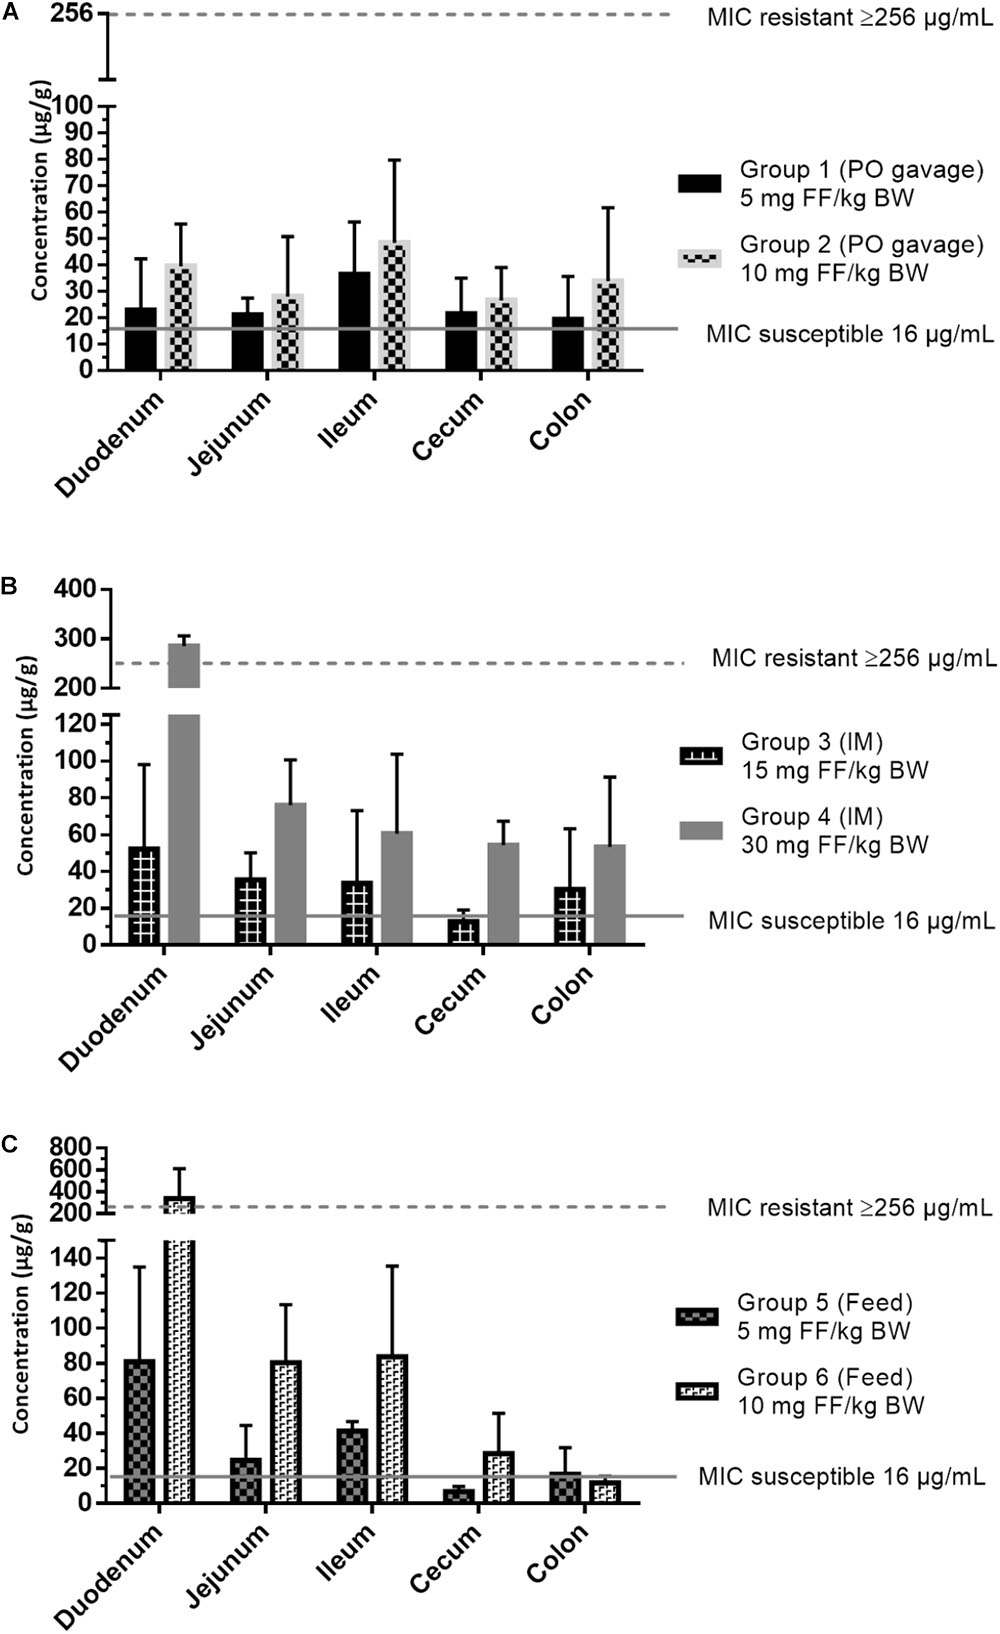
FIGURE 3. Intestinal content concentrations of florfenicol (FF) in different gastro-intestinal segments: duodenum, jejunum, ileum, cecum and colon at 10 h after the last administration, combined with minimal inhibitory concentration (MIC) values for susceptible and resistant Escherichia coli isolates. Results are presented as mean + SD (n = 6). (A) Group 1 (5 mg FF/kg BW) and 2 (10 mg FF/kg BW) administered an oral bolus of florfenicol (FF) during 5 days (once daily), (B) Group 3 (15 mg FF/kg BW) and group 4 (30 mg FF/kg BW) administered intramuscular FF injections twice (48 h interval), and (C) Group 5 (5 mg FF/kg BW) and 6 (10 mg FF/kg BW) administered medicated feed once daily during 5 days.
Based on earlier literature reports, FF resistance in E. coli is associated with values of 16 < MIC ≤ 512 μg/mL (White et al., 2000; Bischoff et al., 2002). Furthermore, the dissemination of FF resistance is mostly related to mobile genetic elements; with reports of different conjugative plasmids or transposons harboring FF resistance genes, which can be found in E. coli field strains (Doublet et al., 2005; Meunier et al., 2010). Hence, conjugative plasmids could contribute to the distribution of FF resistance genes in several bacterial species and in different animals (Cloeckaert et al., 2000; Kehrenberg et al., 2006). FF resistance can also be located on the chromosome or non-conjugative plasmids (Singer et al., 2004), which would still allow for selection of these resistant mutants under antimicrobial pressure. In our study, before and after treatment, multiple E. coli genotypes were detected in both the susceptible and resistant E. coli isolates (Figure 4). There was no obvious selection toward one or a limited number of genotypes after treatment, since the number of resistant genotypes seemed to increase after treatment. Even though the currently used methods cannot provide definite proof, the obtained results suggest that both selection of pre-existing resistant isolates and the horizontal transfer of resistance determinants toward originally susceptible strains may have contributed to the emergence of the resistant E. coli population, after treatment in this experimental setup. Finally, these findings were not related to an untreated control group. Hence, the spread of resistant genotypes from one treatment group to another cannot be excluded either.
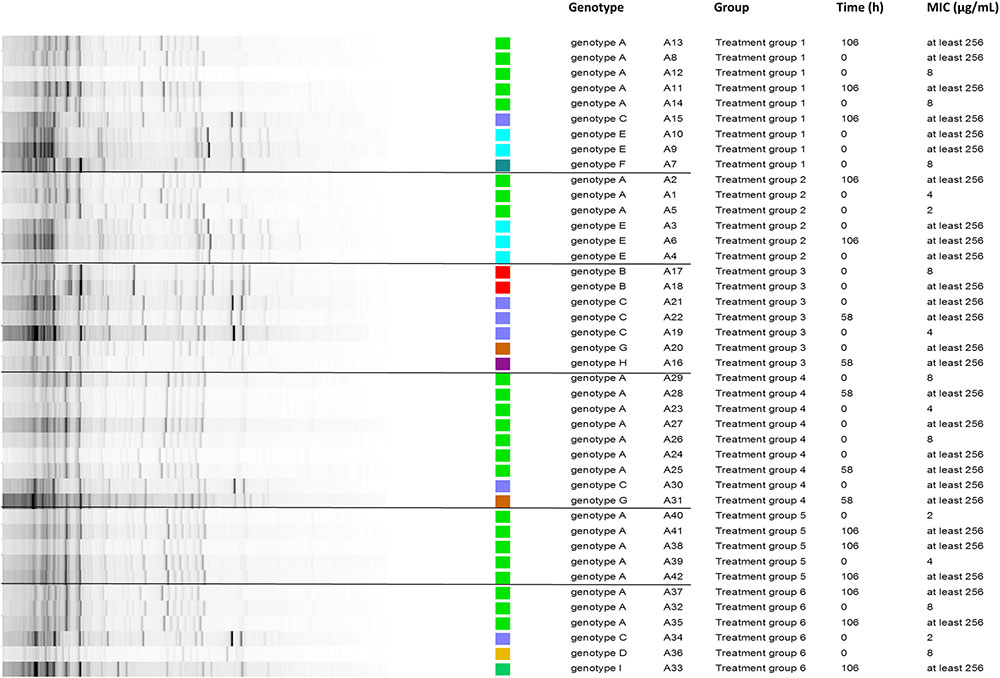
FIGURE 4. Repetitive element sequenced-based (rep)-PCR of 42 different retrieved Escherichia coli isolates (time point 0 h and also 58 h for intramuscular treated groups or 106 h for oral treated groups), from 6 different treatment groups and in total from 18 different pigs. The minimal inhibitory concentration (MIC in μg/mL) was determined for each isolate. With treatment group 1 and 2 administered an oral bolus at 5 and 10 mg florfenicol (FF)/kg BW, respectively, group 3 and 4 administered FF intramuscularly twice with 48-h interval at 15 and 30 mg FF/kg BW, respectively, and group 5 and 6 administered medicated feed at 5 and 10 mg FF/kg BW, respectively. Different genotypic groups or single isolates were found as indicated by the color scheme. The different groups are outlined between the black lines. Genotypic diversity occurred on group- and animal-level, hence excluding selection of one resistant mutant.
Finally, in these experiments no effect of dose alteration or administration route on resistance selection in E. coli, as Gram-negative indicator bacterium, was observed. Even though the animals of group 4, administered the highest IM dose of 30 mg FF/kg BW, displayed elevated intestinal FF concentrations. In this sense, all microbiological experiments indicated a strong selection of resistant E. coli strains during treatment with FF, in all treatment groups. This may be related to the fact that all treatment strategies led to sufficiently high gastro-intestinal concentrations for eradication of susceptible strains and allowing for selective enrichment of resistant isolates.
Conclusion
In general, a linear relationship between dose and FF plasma concentration was found for a given administration route. Following, no significant effects of the administration route on gastro-intestinal concentrations of FF were observed. However, in most gastro-intestinal segments, elevated FF concentrations were measured after IM administration of the highest dose, i.e., 30 mg FF/kg BW. No significant differences in FF intestinal concentrations were detected among the other treatment groups. Bacteriological analysis of the fecal samples demonstrated the presence of both FF susceptible and FF resistant E. coli isolates at the start of the treatment. The susceptible isolates displayed MIC values of 2–16 μg/mL. In relation to the high FF intestinal concentrations measured at 10 h after the last administration, eradication of susceptible E. coli strains is expected during treatment. All characterized resistant isolates displayed MIC values equal to or greater than 256 μg/mL. Hence, these high MIC values associated with FF resistance allowed for selection of resistance in the different gastro-intestinal segments, irrespective of treatment group.
These results are a cause for concern in terms for gastro-intestinal exposure of the microbiota to FF. Taking into account that the gut microbiota is a major resistance reservoir; exposure to such concentrations of FF could increase resistance selection and spread, as observed in the present study for E. coli. Furthermore, plasmid-mediated co-selection or cross resistance with FF also has to be contemplated. FF is used for respiratory tract infections, hence the effects of the molecule on the microbiota could be considered as an adverse event in terms of AMR. However, awareness of this adverse event needs to be implemented, in order to warrant a prudent use of FF in respiratory tract infections and minimize the risk of AMR selection and spread from the microbiota.
Author Contributions
JDS, SC, FB, FH, PDB, and MD prepared the experimental design. JDS conducted the animal experiments, performed the analytical method development and sample analysis. JDS, FB, and GR performed the bacteriological analysis. JDS and MD performed the pharmacokinetic analysis. JDS did the statistical analysis. JDS, SC, FB, GR, FH, PDB, and MD prepared the manuscript. All authors read and approved the final manuscript.
Funding
This work was supported by the Belgian Federal Public Service of Health, Food Chain Safety and Environment [Grant Number RF 14/6287 DOSERESIST]. The MALDI-TOF mass spectrometer was financed by the Research Foundation Flanders (FWO-Vlaanderen) as Hercules project AUGE/15/05.
Conflict of Interest Statement
The authors declare that the research was conducted in the absence of any commercial or financial relationships that could be construed as a potential conflict of interest.
Acknowledgments
The assistance of G. Antonissen, E. Biebaut, N. Broekaert, S. Debevere, T. De Mil, E. Gasthuys, M. Lauwers, J. Millecam, W. Schelstraete and A. Watteyn for the animal experiments is gratefully acknowledged. The assistance of R. Temmerman for the bacteriological assays is gratefully acknowledged.
Supplementary Material
The Supplementary Material for this article can be found online at: https://www.frontiersin.org/articles/10.3389/fphar.2018.01265/full#supplementary-material
References
Arcangioli, M. A., Leroy-Setrin, S., Martel, J. L., and Chaslus-Dancla, E. (2000). Evolution of chloramphenicol resistance, with emergence of cross-resistance to florfenicol, in bovine Salmonella typhimurium strains implicates definitive phage type (DT) 104. J. Med. Microbiol. 49, 103–110. doi: 10.1099/0022-1317-49-1-103
Bischoff, K. M., White, D. G., McDermott, P. F., Zhao, S. H., Gaines, S., Maurer, J. J., et al. (2002). Characterization of chloramphenicol resistance in beta-hemolytic Escherichia coli associated with diarrhea in neonatal swine. J. Clin. Microbiol. 40, 389–394. doi: 10.1128/JCM.40.2.389-394.2002
Blickwede, M., and Schwarz, S. (2004). Molecular analysis of florfenicol-resistant Escherichia coli isolates from pigs. J. Antimicrob. Chemother. 53, 58–64. doi: 10.1093/jac/dkh007
Braibant, M., Chevalier, J., Chaslus-Dancla, E., Pages, J. M., and Cloeckaert, A. (2005). Structural and functional study of the phenicol-specific efflux pump FloR belonging to the major facilitator superfamily. Antimicrob. Agents Chemother. 49, 2965–2971. doi: 10.1128/AAC.49.7.2965-2971.2005
Callens, B., Persoons, D., Maes, D., Laanen, M., Postma, M., Boyen, F., et al. (2012). Prophylactic and metaphylactic antimicrobial use in Belgian fattening pig herds. Prev. Vet. Med. 106, 53–62. doi: 10.1016/j.prevetmed.2012.03.001
Caputi, V., Marsilio, I., Filpa, V., Cerantola, S., Orso, G., Bistoletti, M., et al. (2017). Antibiotic-induced dysbiosis of the microbiota impairs gut neuromuscular function in juvenile mice. Br. J. Pharmacol. 174, 3623–3639. doi: 10.1111/bph.13965
Cloeckaert, A., Baucheron, S., Flaujac, G., Schwarz, S., Kehrenberg, C., Martel, J. L., et al. (2000). Plasmid-mediated florfenicol resistance encoded by the floR gene in Escherichia coli isolated from cattle. Antimicrob. Agents Chemother. 44, 2858–2860. doi: 10.1128/AAC.44.10.2858-2860.2000
De Baere, S., Osselaere, A., Devreese, M., Vanhaecke, L., De Backer, P., and Croubels, S. (2012). Development of a liquid-chromatography tandem mass spectrometry and ultra-high-performance liquid chromatography high-resolution mass spectrometry method for the quantitative determination of zearalenone and its major metabolites in chicken and pig plasma. Anal. Chim. Acta 756, 37–48. doi: 10.1016/j.aca.2012.10.027
De Smet, J., Croubels, S., De Backer, P., and Devreese, M. (2017). Effect of administration route and dose alteration on sulfadiazine-trimethoprim plasma and intestinal concentrations in pigs. Int. J. Antimicrob. Agents 50, 707–714. doi: 10.1016/j.ijantimicag.2017.06.012
Devreese, M., Antonissen, G., De Baere, S., De Backer, P., and Croubels, S. (2014). Effect of administration route and dose escalation on plasma and intestinal concentrations of enrofloxacin and ciprofloxacin in broiler chickens. BMC Vet. Res. 10:289. doi: 10.1186/s12917-014-0289-1
Dorey, L., Hobson, S., and Lees, P. (2016). Activity of florfenicol for Actinobacillus pleuropneumoniae and Pasteurella multocida using standardised versus non-standardised methodology. Vet. J. 218, 65–70. doi: 10.1016/j.tvjl.2016.11.004
Dorey, L., Pelligand, L., Cheng, Z. R., and Lees, P. (2017). Pharmacokinetic/pharmacodynamic integration and modelling of florfenicol for the pig pneumonia pathogens Actinobacillus pleuropneumoniae and Pasteurella multocida. PLoS One 12:e0177568. doi: 10.1371/journal.pone.0177568
Doublet, B., Schwarz, S., Kehrenberg, C., and Cloeckaert, A. (2005). Florfenicol resistance gene floR is part of a novel transposon. Antimicrob. Agents Chemother. 49, 2106–2108. doi: 10.1128/AAC.49.5.2106-2108.2005
European Commission [EC] (2018). A European One Health action plan against Antimicrobial Resistance (AMR). Luxembourg: European Commission.
Jiang, H. X., Zeng, Z. L., Chen, Z. L., Liu, J. J., and Fung, K. F. (2006). Pharmacokinetics of florfenicol in pigs following intravenous, intramuscular or oral administration and the effects of feed intake on oral dosing. J. Vet. Pharmacol. Ther. 29, 153–156. doi: 10.1111/j.1365-2885.2006.00727.x
Kehrenberg, C., Meunier, D., Targant, H., Cloeckaert, A., Schwarz, S., and Madec, J. Y. (2006). Plasmid-mediated florfenicol resistance in Pasteurella trehalosi. J. Antimicrob. Chemother. 58, 13–17. doi: 10.1093/jac/dkl174
Kehrenberg, C., Mumme, J., Wallmann, J., Verspohl, J., Tegeler, R., Kuhn, T., et al. (2004). Monitoring of florfenicol susceptibility among bovine and porcine respiratory tract pathogens collected in Germany during the years 2002 and 2003. J. Antimicrob. Chemother. 54, 572–574. doi: 10.1093/jac/dkh371
Liu, J. Z., Fung, K. F., Chen, Z. L., Zeng, Z. L., and Zhang, J. (2002). Tissue pharmacokinetics of florfenicol in pigs experimentally infected with Actinobacillus pleuropneumoniae. Eur. J. Drug Metab. Pharmacokinet. 27, 265–271. doi: 10.1007/BF03192337
Liu, J. Z., Fung, K. F., Chen, Z. L., Zeng, Z. L., and Zhang, J. (2003). Pharmacokinetics of florfenicol in healthy pigs and in pigs experimentally infected with Actinobacillus pleuropneumoniae. Antimicrob. Agents Chemother. 47, 820–823. doi: 10.1128/AAC.47.2.820-823.2003
Lobell, R. D., Varma, K. J., Johnson, J. C., Sams, R. A., Gerken, D. F., and Ashcraft, S. M. (1994). Pharmacokinetics of florfenicol following intravenous and intramuscular doses to cattle. J. Vet. Pharmacol. Ther. 17, 253–258. doi: 10.1111/j.1365-2885.1994.tb00241.x
Mather, A. E., Reid, S. W. J., Maskell, D. J., Parkhill, J., Fookes, M. C., Harris, S. R., et al. (2013). Distinguishable epidemics of multidrug-resistant Salmonella typhimurium DT104 in different hosts. Science 341, 1514–1517. doi: 10.1126/science.1240578
Meunier, D., Jouy, E., Lazizzera, C., Doublet, B., Kobisch, M., Cloeckaert, A., et al. (2010). Plasmid-borne florfenicol and ceftiofur resistance encoded by the floR and bla(CMY-2) genes in Escherichia coli isolates from diseased cattle in France. J. Med. Microbiol. 59, 467–471. doi: 10.1099/jmm.0.016162-0
Peeters, L. E. J., Croubels, S., Rasschaert, G., Imberechts, H., Daeseleire, E., Dewulf, J., et al. (2018). Effect of residual doxycycline concentrations on resistance selection and transfer in porcine commensal Escherichia coli. Int. J. Antimicrob. Agent 51, 123–127. doi: 10.1016/j.ijantimicag.2017.04.018
Singer, R. S., Patterson, S. K., Meier, A. E., Gibson, J. K., Lee, H. L., and Maddox, C. W. (2004). Relationship between phenotypic and genotypic florfenicol resistance in Escherichia coli. Antimicrob Agents Chemother. 48, 4047–4049. doi: 10.1128/AAC.48.10.4047-4049.2004
Skolimowski, I. M., Knight, R. C., and Edwards, D. I. (1983). Molecular basis of chloramphenicol and thiamphenicol toxicity to DNA in vitro. J. Antimicrob. Chemother. 12, 535–542. doi: 10.1093/jac/12.6.535
Sutton, S. (2011). http://www.microbiol.org/resources/monographswhite-papers/counting-colonies/ [accessed December 06, 2017].
Syriopoulou, V. P., Harding, A. L., Goldmann, D. A., and Smith, A. L. (1981). In vitro antibacterial activity of fluorinated analogs of chloramphenicol and thiamphenicol. Antimicrob. Agents Chemother. 19, 294–297. doi: 10.1128/AAC.19.2.294
Vanni, M., Merenda, M., Barigazzi, G., Garbarino, C., Luppi, A., Tognetti, R., et al. (2012). Antimicrobial resistance of Actinobacillus pleuropneumoniae isolated from swine. Vet. Microbiol. 156, 172–177. doi: 10.1016/j.vetmic.2011.10.022
VICH (2015). VICH GL49: Guidance for Industry: Studies to Evaluate the Metabolism and Residue Kinetics of Veterinary Drugs in Food-Producing Animals: Validation of Analytical Methods used in Residue Depletion Studies. http://www.fda.gov/downloads/AnimalVeterinary/GuidanceComplianceEnforcement/GuidanceforIndustry/UCM207942.pdf [accessed April 14, 2016].
Voorspoels, J., D’Haese, E., De Craene, B. A., Vervaet, C., De Riemaecker, D., Deprez, P., et al. (1999). Pharmacokinetics of florfenicol after treatment of pigs with single oral or intramuscular doses or with medicated feed for three days. Vet. Rec. 145, 397–399. doi: 10.1136/vr.145.14.397
Watteyn, A., Devreese, M., De Baere, S., Plessers, E., Wyns, H., De Backer, P., et al. (2015). Efficacy of florfenicol and gamithromycin in an Ornithobacterium rhinotracheale infection model in turkeys: a pharmacokinetic-pharmacodynamic approach. J. Vet. Pharmacol. Ther. 38, 25–26.
Keywords: florfenicol, administration route, intestinal concentration, Escherichia coli, resistance selection
Citation: De Smet J, Boyen F, Croubels S, Rasschaert G, Haesebrouck F, De Backer P and Devreese M (2018) Similar Gastro-Intestinal Exposure to Florfenicol After Oral or Intramuscular Administration in Pigs, Leading to Resistance Selection in Commensal Escherichia coli. Front. Pharmacol. 9:1265. doi: 10.3389/fphar.2018.01265
Received: 12 August 2018; Accepted: 17 October 2018;
Published: 06 November 2018.
Edited by:
Raffaele Capasso, Università degli Studi di Napoli Federico II, ItalyReviewed by:
Cristina Giaroni, Università degli Studi dell’Insubria, ItalyIzumi Kaji, Vanderbilt University Medical Center, United States
Copyright © 2018 De Smet, Boyen, Croubels, Rasschaert, Haesebrouck, De Backer and Devreese. This is an open-access article distributed under the terms of the Creative Commons Attribution License (CC BY). The use, distribution or reproduction in other forums is permitted, provided the original author(s) and the copyright owner(s) are credited and that the original publication in this journal is cited, in accordance with accepted academic practice. No use, distribution or reproduction is permitted which does not comply with these terms.
*Correspondence: Mathias Devreese, TWF0aGlhcy5EZXZyZWVzZUBVR2VudC5iZQ==