 Jun Ma1,2
 Benjamin Haibe-Kains
 Penggao Dai
- 1National Engineering Research Center for Miniaturized Detection Systems, Northwest University, Xi’an, China
- 2Princess Margaret Cancer Centre, University Health Network, Toronto, ON, Canada
- 3Shaanxi Microbiology Institute, Xi’an, China
The interactions between drugs and their target proteins induce altered expression of genes involved in complex intracellular networks. The properties of these functional network modules are critical for the identification of drug targets, for drug repurposing, and for understanding the underlying mode of action of the drug. The topological modules generated by a computational approach are defined as functional clusters. However, the functions inferred for these topological modules extracted from a large-scale molecular interaction network, such as a protein–protein interaction (PPI) network, could differ depending on different cluster detection algorithms. Moreover, the dynamic gene expression profiles among tissues or cell types causes differential functional interaction patterns between the molecular components. Thus, the connections in the PPI network should be modified by the transcriptomic landscape of specific cell lines before producing topological clusters. Here, we systematically investigated the clusters of a cell-based PPI network by using four cluster detection algorithms. We subsequently compared the performance of these algorithms for target gene prediction, which integrates gene perturbation data with the cell-based PPI network using two drug target prioritization methods, shortest path and diffusion correlation. In addition, we validated the proportion of perturbed genes in clusters by finding candidate anti-breast cancer drugs and confirming our predictions using literature evidence and cases in the ClinicalTrials.gov. Our results indicate that the Walktrap (CW) clustering algorithm achieved the best performance overall in our comparative study.
Introduction
Drugs physically bind specific target proteins and activate downstream effectors to ultimately change the gene expression profiles of tumor cells, which are highly modular in the context of molecular interaction networks (Hartwell et al., 1999; Berger and Iyengar, 2009; Sah et al., 2014). Investigation of the modular properties of interactomes, such as protein–protein interaction (PPI) networks, can facilitate further discovery of the underlying molecular interaction mechanisms that drive cell response under specific conditions, such as drug treatment (Isik et al., 2015). Previous studies have used interaction networks to predict gene function, identify novel disease-related genes and to understand the overlapping association across disease phenotypes (Sharan et al., 2007; Lee et al., 2008; Menche et al., 2015). Recently, computational approaches have been used to build topological clusters as functional modules in PPI networks. For example, Spirin and Mirny identified modules in the PPI network through three methods and subsequently demonstrated the association between topological clusters and functional modules (Spirin and Mirny, 2003). Additionally, Kenley and Cho proposed a graph entropy algorithm to identify functional clusters from PPI networks (Kenley and Cho, 2011). These efforts have led to more effective modeling of PPIs and the drug targeting thereof with respect to specific diseases.
In the last decades, cancer cell lines have been widely used as models for understanding cancer biology and cellular response to anticancer drugs (Goodspeed et al., 2016). These cell lines have not only been comprehensively profiled at the molecular level, but they have also been used in large pharmacogenomic studies. The Connectivity Map (CMap) contains to date more than 7,000 expression profiles in five cancer cell lines (MCF7 and ssMCF7, human breast adenocarcinoma cell line; HL-60, human promyelocytic leukemia cell line; PC-3, human prostate cancer cell line; SK-MEL-5, melanoma cell line), screened for transcriptional responses induced by 1,309 small molecule compounds at varying concentrations from 6,100 microarray experiments conducted using the Affymetrix HT_HG_U133A array with 22,283 probesets (Lamb et al., 2006). Previous studies have also reported that the CMap data can be used to link transcriptional biomarkers to known mechanisms of drug action, such as the thioridazine inhibition of the phosphatidylinositol-3′-kinase (PI3K)/AKT pathway in ovarian cancer cells (Bae et al., 2011), allowing the identification of drug target proteins and facilitating the process of drug repurposing (Babcock et al., 2013; Iskar et al., 2013; Wu et al., 2013; Musa et al., 2017). In this study, we extensively used the transcriptomic and pharmacogenomic data pertaining to the cell lines found in the CMap to further understand the topological clustering in PPI networks from a comparative computational approach. We focused our interest on the MCF7 cell line, as it is the most commonly used cell line in human breast carcinoma, established in 1973 at the Michigan Cancer Foundation (Holliday and Speirs, 2011). Due to the hormone sensitivity found in MCF7 through the expression of the estrogen receptor (ER), this cell line has been reported as an ideal model to study hormone response in breast cancer (Levenson and Jordan, 1997).
Over the past few years, systems biology has made significant progress in addressing fundamental biological questions by making use of PPIs, leading to practical applications in drug target identification and drug discovery (Iskar et al., 2013; Wu et al., 2013; Ivliev et al., 2016). The STRING database (version 10.0) provides critical assessment and integrates all possible direct and indirect PPIs for more than 2,000 species, including 19,247 proteins with 8,548,002 interactions for Homo sapiens (Szklarczyk et al., 2015). Furthermore, various drug targeting measures have been developed, including a method called local radiality (LR) by Isik et al. (2015), integrating perturbed gene expression with PPI network information to prioritize drug target identification through different essential protein detection algorithms. The STRING database assigns a confidence score to each predicted protein–protein association calculated based on several sources, including published literature, experimental interaction data, and data concerning co-regulation of genes. However, despite these ongoing efforts that investigate cellular PPIs, due to the varying gene expression profiles in different cell lines, proteins exhibit dynamic behavior in interaction that current cell-agnostic PPI assignment methods do not fully recapitulate (Holliday and Speirs, 2011; Liang et al., 2014). As such, accuracy is poor for functional cluster prediction in individual cancer cell lines using existing clustering algorithms, and there remains a lack of convergence between the algorithms due to their diverse module detection theories and methods (Liu et al., 2017). Inspired by this, we developed a cell-based PPI network using the MCF7 cell line as an alternative to current cell-agnostic models. In this study, we compared the properties of functional clusters elucidated from a cell-based PPI network in the MCF-7 cell line produced by four module detection algorithms. We subsequently extract drug-induced functionally perturbed genes from the big clusters (defined as clusters with a size of greater than or equal to 10) detected by the algorithms and integrate them with MCF7 cell-based network information to improve the prioritization of target genes. Finally, we illustrate the potential association between perturbed genes and clusters in the MCF7 cell-based PPI network through investigations in drug repurposing. Our results highlight the validity of this comparative approach to identify novel anti-breast cancer drugs, which were further validated using literature and data from ClinicalTrials.gov (Figure 1). Furthermore, our results indicate that the Walktrap (CW) algorithm yields the best performance for detecting functional clusters in the PPI network.
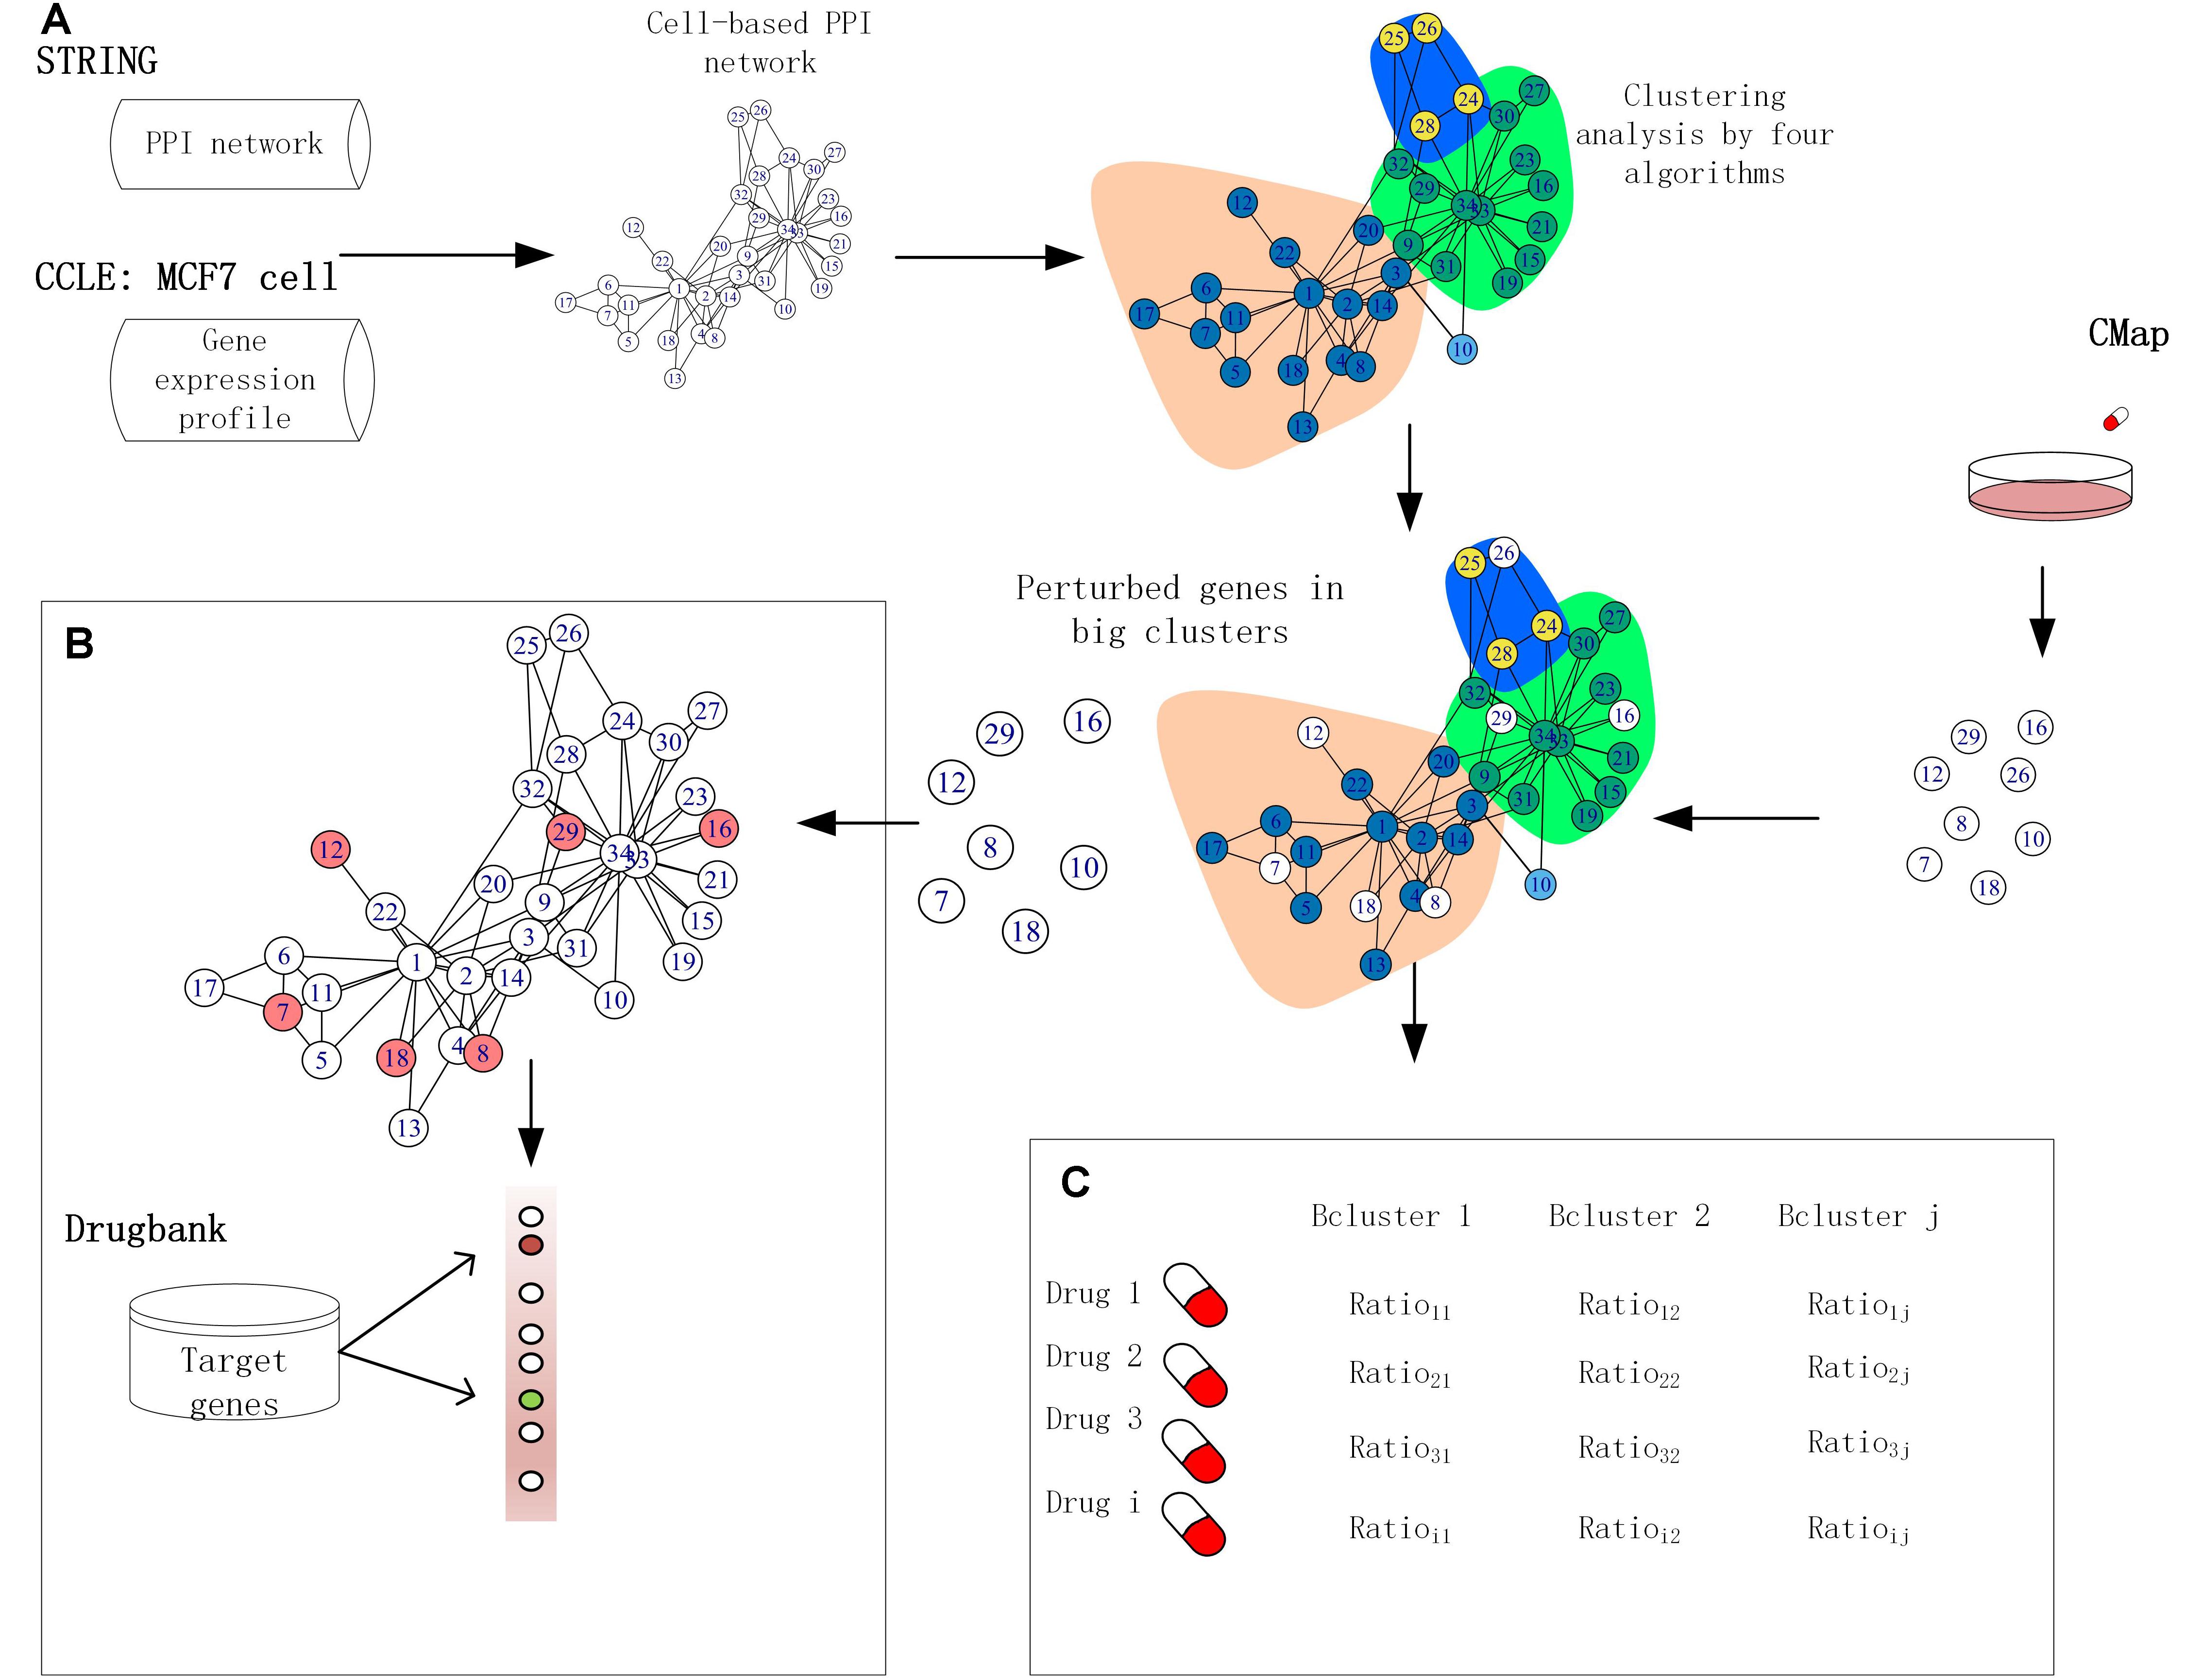
Figure 1. Framework for application of functional clusters. (A) The interactions in the human protein–protein interaction (PPI) network were removed if the corresponding proteins were not expressed in the MCF-7 cell lines. The clusters were built by four module detection algorithms. (B) The target genes were ranked based on the score produced by combining the perturbed genes of big size clusters with network information. (C) Cancer drugs by similarity analysis based on the fraction of perturbed genes in clusters.
Materials and Methods
Establishment of Cell-Based PPI Network Using MCF7
We downloaded the human PPIs from the STRING database (version 10) (Szklarczyk et al., 2015) to serve as the unfiltered PPIs for our cell-based PPI network. The ENSP IDs of the proteins found in STRING human PPI network were matched to their corresponding ENSG gene IDs using the R package biomaRt (version 2.34.2) (Badalà et al., 2009). To create the cell-based PPI network, we used as filtering criteria the gene expression data of the MCF7 cell line obtained from the Broad-Novartis Cancer Cell Line Encyclopedia (CCLE). The CCLE project provides public access to genomic data (Supplementary Table S1), as well as the analysis and visualization thereof for approximately 1,000 cancer cell lines (Barretina et al., 2012; Smirnov et al., 2018), with MCF7 being one of them. The gene expression data of the MCF7 cell line in CCLE were obtained using the R package PharmacoGx (version 1.12.0) (Smirnov et al., 2016), which contains the pharmacological profiles of several hundred cell lines generated by CCLE, the Genentech Cell Line Screening Initiative (gCSI) (Klijn et al., 2014), the Genomics of Drug Sensitivity in Cancer (GDSC) (Garnett et al., 2012) and the GRAY dataset, generated in Dr. Joe Gray’s lab at the Oregon Health and Science University (Daemen et al., 2013). To calculate the expression value of genes found in the MCF7 cell line, we converted the number of fragments per kilobase per million (FPKM) mapped reads units were converted to log2(FPKM+1) as the expression value of genes. We defined expressed genes is defined as those with a log2(FPKM+1) value of greater than or equal to 1 [log2(FPKM+1) ≥ 1] (Gonzalez-Porta et al., 2013). Using this definition, the MCF7 cell line expresses 13,096 genes. We then developed the cell-based PPI network subsetting the human PPI network to only include these expressed genes MCF7.
To limit non-existent and false-positive interactions between proteins in the MCF7 cell-based PPI network, we further filtered this network based on PPI confidence scores. The STRING repository has a confidence score for each PPI according to sources including existing literature, as well as co-expression and experimental data. A PPI has a high confidence score if there is supporting evidence for the interaction from a wide range of these sources. We selected PPIs with a confidence score of greater than 800 to be included in our final MCF7 cell-based network, which was also used in all downstream analysis. The MCF cell-based PPI network contains 7,904 protein members projecting 2,13,422 interactions, which represent the nodes and edges of the network, respectively.
Functional Cluster Identification Algorithms
To date, a number of different criteria have been proposed for defining clusters in networks (Gao et al., 2009). A cluster is defined as a group of nodes in a network that are densely interconnected to each other, while sparsely connected to other the nodes of the same network. In this study, four widely used clustering algorithms were evaluated, compared, and categorized based on the methods applied for cluster identification (Orman et al., 2012) (Supplementary Table S2): These algorithms were selected due to their short runtimes determined in preliminary tests using the R package igraph (version 1.2.1) (Csardi and Nepusz, 2006).
The leading eigenvector (CLE) algorithm detects densely connected clusters in a network graph by calculating the leading non-negative eigenvector of the modularity matrix of the graph (Newman, 2006). Pons and Latapy have proposed a module detection hierarchical structure algorithm called the Walktrap (CW) for module detection, which is a hierarchical structure algorithm. They argued that short random walks tend to stay in the same cluster (Pons and Latapy, 2005). In the label propagation (CLP) algorithm, each node is initialized with a unique numeric label and chooses the label that is dominated by its neighbors during an iterative process. The CLP algorithm tends to gather densely connected nodes with the same label that comprise a cluster (Raghavan et al., 2007). Lastly, we also obtained topological gene clusters by implementing the infomap (CI) algorithm, proposed by Rosvall and Bergstrom (2008), to decompose the cell-based PPI network into clusters by employing random walks to analyze the information flow through a network. The igraph R package igraph (version 1.2.1 number) (Csardi and Nepusz, 2006) was used to identify clusters in the cell-based PPI network using the four cluster detection algorithms with on default arguments. Afterwards, we extracted the big clusters produced by the four algorithms, defined as those with a size of greater than or equal to 10 members. We also defined small clusters as those with less than 10 members. The big clusters detected by each algorithm were considered as functional clusters and subsequently used for target gene prediction and drug repurposing.
To elucidate the effect of network size for the clustering by CI and CW, we calculated the ratio of proteins in the big clusters to the total number of proteins in both the cell-agnostic PPI and the MCF7 cell-based PPI networks. The formula for this calculation is shown below:
where Pb represents number of proteins in the big clusters, and Pt stands for the total number of proteins in each PPI network.
Evaluation of Biological Processes
The biological processes in Gene Ontology (GO), which provide functions of genes and gene products determined by biological process (BP), molecular function (MF), and cellular component (CC), were downloaded from Molecular Signatures Database1. We enriched connected protein members of each big cluster in the cell-based PPI network to the GO terms to annotate protein function as well as to confirm the mechanisms of action of candidate anti-breast cancer drugs through hypergeometric tests using the R package piano (version 1.18.1) (Väremo et al., 2013). The biological process GO terms with false discovery rate (FDR) ≤ 0.05 were considered.
Drug Perturbation Signatures in Cancer Cell Lines
To curate drug perturbation data, we first accessed the normalized gene expression in the MCF7 cell line from CMap via PharmacoGx (version 1.12.0) (Smirnov et al., 2016). We used the drugPerturbationSig function to identify genes whose expression is differentially expressed upon drug treatment, creating a signature representing gene expression changes induced by each drug. The algorithm of this function uses a linear regression model for the effect of drug concentration on gene expression in cell lines, while adding a term controlling for the batch effect in the CMap dataset:
where G stands for gene expression, Ci indicates the concentration of a given compound, T denotes the type of cell line, D represents the duration of the experiment, and B represents the experimental batch, while βs are the regression coefficients. The significance of the association between a drug and a gene was estimated by the statistical significance of βi, which was calculated using an F-test to determine the improvement in fit after inclusion of the term. The function returns four values including the estimated coefficient for concentration, the t-statistic, the p-value and the FDR associated with that coefficient in a 3D array with genes and drugs. The t-statistic, carries information regarding the direction (up or down) of regulation of a given gene to identify perturbation in microarray experiments (Guo et al., 2006; Jeffery et al., 2006). The t-statistic returned by the lm function in R was calculated by following equation:
where βi is the regression coefficient of the sample regression line, and SE is the standard error of the slope. After pre-processing, genes whose p-value was less than 0.01 were considered perturbed and their absolute t-statistic values were used as differential expression data. In CMap, the MFC7 cell line was treated with 1,255 drugs. Using the drugPerturbationSig function, we discovered in this cell line 11,833 distinct perturbed genes whose expression profiles were subsequently analyzed downstream this study.
Integration of Gene Perturbation Data With Cell-Based PPI Network
We argue that perturbed genes participate in one of the big clusters generated by the clustering algorithms, and will be highly related to the mechanism of action of the drug that induced said perturbation. To integrate gene perturbation data into the MCF7 cell-based PPI network, we further filtered the network so that the perturbed genes were included only if they participate in the big clusters of each algorithm.
Drug Target Prioritization in MCF7 Cell-Based PPI Network With Gene Perturbation Data
To date, several methods have been used to combine gene perturbation data with network information to find the target genes of compounds. Laenen et al. (2013) proposed a local measure called correlation diffusion (CD) that stands for a random walk-based algorithm to predict drug target genes. They first filtered out all connectivity correlation coefficients based on a certain t-threshold and normalized the coefficient value for each retaining correlation of its corresponding gene. Afterwards, they only considered single genes and their directly connected perturbed neighbors in the filtered network to compute the score for target gene prioritization. In contrast, a global measure using a shortest path (SP) approach combines the entire network topology propriety and perturbation data to calculate the gene score (Isik et al., 2015). The hypothesis for SP is that perturbed genes should have the shortest path to the target genes in the network. For this study, we used CD and SP to prioritize drug targets produced by the four clustering algorithms to compare the accuracy of each. We first revised the CD and SP methods to prioritize drug targets in the MCF7 cell-based network (CCD and CSP, respectively) with the perturbed genes, and the outcome of the evaluation of the four algorithms by the two methods are assigned new acronyms (CCD_CLE, CCD_CLP, CCD_CW, and CCD_CI; CSP_CLE, CSP_CLP, CSP_CW, and CSP_CI, respectively). Here, we show the revised formulations as follows for the two algorithms:
For CCD:
where Pij is the confidence value score of genes i and j expressed in the MCF7 cell-based PPI network. Normalizing the confidence scores based on the remaining connections per protein, the elements of a normalized interaction matrix M can be defined as formula 4. Multiplication of the Tpr with this matrix results in a ranking score for each gene:
where Tpr is a t-statistic value of each perturbed gene. The perturbed genes in CCD_CLE, CCD_CLP, CCD_CW, and CCD_CI are filtered as those found in the big clusters of each clustering algorithm. The ranking score of each gene in CCD is computed by integrating the MCF-7 cell-based PPI network with all Prs perturbed genes. The control group (CD_C) combine the PPI network (confidence score > 800) with all Prs perturbed genes induced by each drug.
For CSP:
where Pij is the confidence score of genes i and j expressed in the MCF7 cell-based PPI network. Pr is defined as a perturbed gene of MCF-7 to a drug, and it belongs to a big cluster as determined by the four algorithms. Lastly, we sort genes based on the score in increasing order for the CSP algorithm. Prioritized genes in CSP_CLE, CSP_CLP, CSP_CW, and CSP_CI were produced by the shortest path algorithm based on the functional perturbed gene and confidence score in MCF-7 cell-based PPI network. Gene’s scores in CSP group is calculate by shortest path between gene in MCF-7 cell-based PPI network and all perturbed gene induced by drug. We also computed the distance between genes in PPI network only filtered by confidence scores and all perturbed genes as control (SP_C).
Drug Target Identification and Selection of Candidate Drugs
The target genes of the drugs used to treat the cell lines in the CMap database were downloaded from Drugbank2 (Wishart et al., 2008), a database that comprehensively combines information about drug targets with that of drug action and that has been widely used for drug target discovery, drug design, and drug interaction prediction. We used Drugbank to determine target genes of drugs in the MCF7 cell-based PPI network. In the Drugbank database, 3,291 proteins are marked as the targets of approximately 4,900 drugs, 60% of which are including Food and Drug Administration (FDA)-approved drugs and tagged 10% are drugs under investigation (labeled as “experimental drugs”). The gene symbols were obtained by matching the UniProt identifier of the target genes in the drug target identifiers file3. The UniProt database contains structure and function information of completely sequenced proteins, annotated with unique and stable identifiers (Consortium, 2017). After the mapping and filtering steps, 298 drugs with 270 target proteins were identified for the treated MCF-7 cell lines in CMap. This information was subsequently used to evaluate the performance of drug target prediction.
Evaluation of Performance of Drug Prioritization
We evaluated the performance of the two target prioritization algorithms using precision-recall curves (PRC). The true positive (TP), true negative (TN), false positive (FP), and FN (false negative (FN) predictions were defined as previously described (Laenen et al., 2013). We divided the predictions into true and false sets based on each cut-off. TPs are all correctly predicted known targets above or equal to the rank cut-off. FPs are all proteins ranked above the cut-off, which are not in the known target set. FNs are known drug targets that are ranked below the cut-off and all remaining proteins are defined as TNs. The recall indicator is defined as
whereas the precision indicator is defined as
The two indicators were calculated using all possible thresholds from 1 to 13,184 (indicating the number of nodes in the MCF7 cell-based PPI network filtered by confidence scores) for the ranking list of drug targets. We made a PRC for the precision and recall of different rank cut-offs and calculated an area under the curve (AUC) value. Simple expression ranking can be set up as a baseline approach for performance assessment of the CCD and CSP network-based drug target ranking methods.
Characteristic of Drugs in Clusters Across Four Detection Algorithms
We calculated the proportion of drug-perturbed genes in each big cluster across the four detection algorithms. The characteristic of a drug is evaluated by equation (10):
Where NCi denotes the number of perturbed genes within the ith big cluster, and NP is the total number of drug-perturbed genes.
Mechanism of Action of Candidate Breast Anticancer Drugs
For each drug, we extracted the perturbed genes of the drug within the biggest clusters to analyze function enrichments using hypergeometric tests. The biological process GO terms with an FDR of less than ≤ 0.05 were considered and overlapping biological processes were identified among candidate anti-breast cancer drugs. We generated the relationship of GO terms by Supek et al. (2011), which summarizes and visualizes long lists of GO terms. The Cytoscape tool (version 3.6.1) was used for GO term visualization.
Results
Clusters From the MCF7 Cell PPI Network
To investigate differences in clustering structure produced by the four clustering algorithms, CLE, CLP, CW, and CI, we applied them to the MCF-7 cell-based PPI network, consisting of 7,904 proteins and 213,422 interactions. The four algorithms displayed a diversity of topological module sizes. We defined big clusters as those with a size of greater than or equal to 10 members and small clusters as those less than 10 members. The number of small clusters was larger than the number of big clusters in all algorithms (Figure 2A), which comprise a smaller proportion of the total number of clusters (15%, CW; 27.6%, CLE; 29%, CLP and; 0.3%, CI) (Supplementary Table S3), consistent with a previous report that compared the modular structure of human cell-agnostic PPI networks generated by seven community detection methods (Liu et al., 2017). The CW algorithm identified the largest number of big clusters (n = 55), as well as 341 small clusters. The CI algorithm detected 14 big clusters and 2,897 small clusters. Moreover, we calculated the ratio of the number of proteins in the clusters to the total number of proteins for all algorithms; the number of nodes was subsequently compared between (≥10 members) and small clusters (2 ≤ members < 10). Our results show that although the number of big clusters did not represent the majority of all clusters, the number of nodes included in big clusters of each algorithm, except CI, takes up the largest portion of the proteins in MCF7 cell-based PPI network. The distribution of cluster sizes is a crucial feature in determining the cluster structure in the four algorithms. It seems to follow a power-law distribution indicating that their sizes are heterogeneous, with many small clusters and only a few large ones (Figure 2B). For CLE, each cluster with a distinct size was detected only once, whereas the size distribution of the clusters detected by the other three algorithms had longer tails (Supplementary Figure S1).
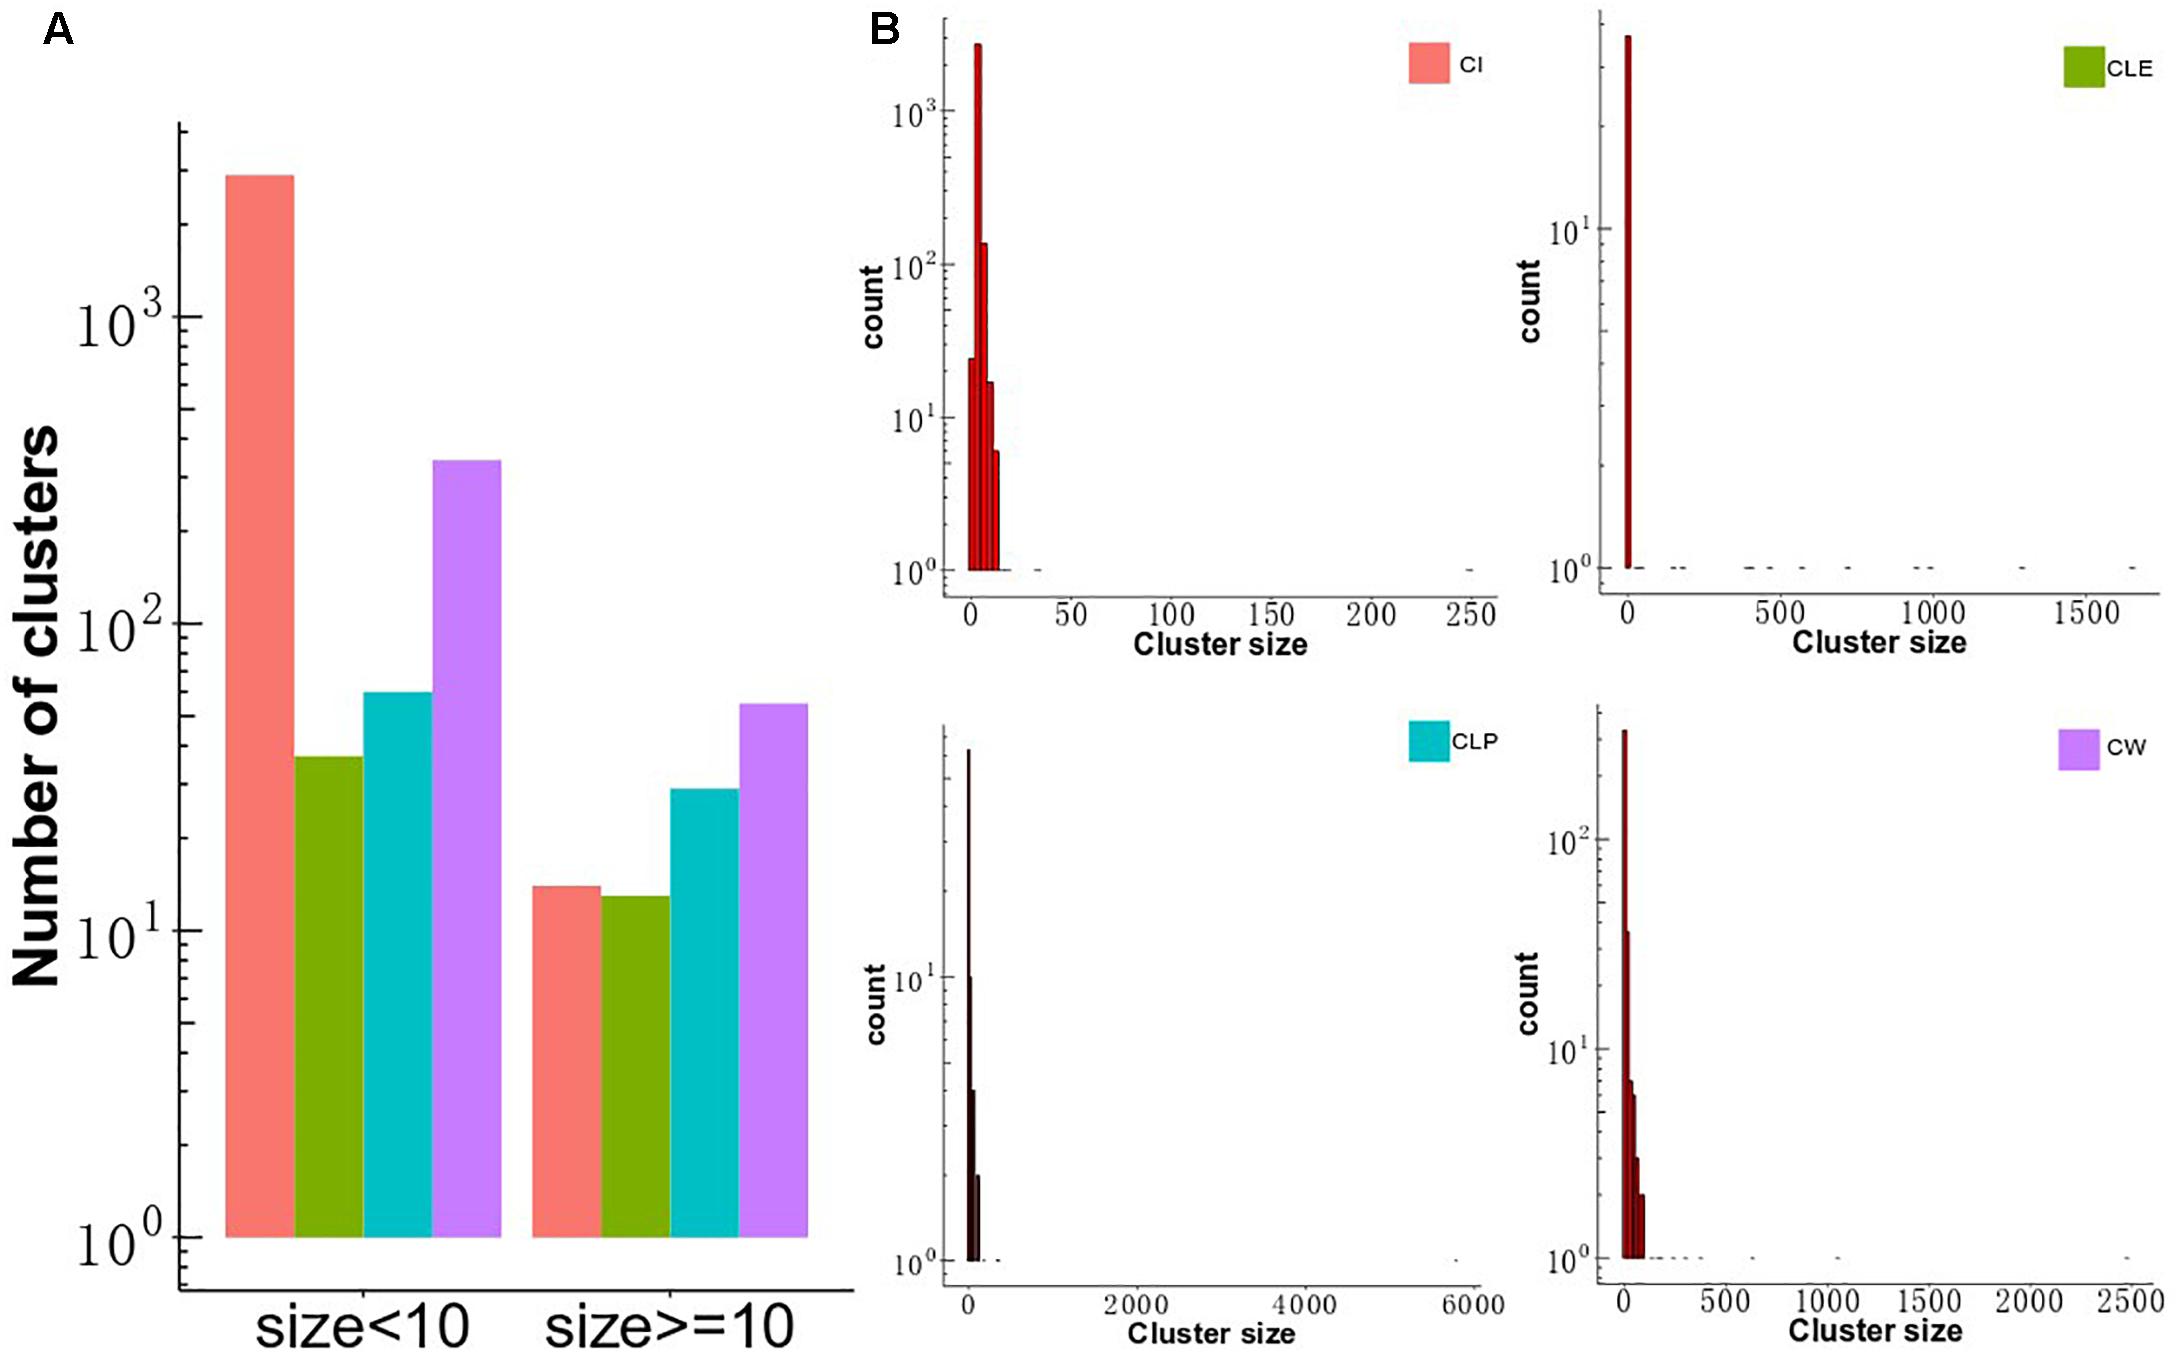
Figure 2. Distribution of cluster size and the overlap of the big clusters among the four algorithms. (A) The distribution of cluster size identified by CW, CLP, CLE, and CI algorithms in MCF-7 cell PPI network. The y-axis shows the number of clusters, and the x-axis gives two groups across four methods, which is classified based on the threshold of member number in each cluster. (B) Distribution of cluster size. The size of clusters detected by four different community partition methods (CLE, CLP, CW, and CI) in the MCF-7 cell PPI network. The x-axis represents the size of the cluster, and the y-axis describes the density of clusters.
To validate the agreement amongst the big clusters produced by the four algorithms, we computed the Jaccard index of protein members in all the big clusters between paired algorithms. We observed that most protein members in the big clusters identified by CW, CLP, and CLE are shared, as determined by high Jaccard indices (Figure 3A). We argue that the reason for this finding is that PPI networks naturally contain an underlying cluster structure and these three algorithms are hierarchical clustering methods. The CI algorithm is an exception because it identifies clusters based on coding theory and does not follow a hierarchical approach (Peel, 2010; Yang et al., 2016). Furthermore, clusters identified by CI require minimal bandwidth to represent some random walks in the network. We found that all four algorithms agree on 418 proteins in the big clusters. The CLP, CW, and CLE algorithms also share 6,487 proteins in their respective big clusters (Figure 3B). The big clusters generated by CLE contain a greater number of protein members (7,821 proteins) than other methods. On the other hand, 428 of 7,904 proteins are in the big clusters generated by CI. To elucidate the potential reason of cluster structure difference produced by CI, we further compared the number of protein members in the big clusters produced by CI with CW in the unfiltered cell-based PPI network (containing all connections) and filtered cell-based PPI network (confidence score > 800). CI is a compression-based approach, finding the clustering structure that provides the shortest description length for a random walk on the graph. Compared with the unfiltered cell-based PPI network, more proteins are grouped into big clusters in the filtered cell-based PPI network (Supplementary Figure S4A). Supplementary Figure S4B shows that the number of proteins in the filtered cell-based PPI network (confidence score > 800) plays an important role for clustering using the CI algorithm; more protein members can share the fixed connections to increase the median degree of each network (Supplementary Table S5), thus getting a greater number of nodes for big clusters. Thus, the CI algorithm considers most protein members with less degrees in the network as unimportant details and filters them out during clustering. Orman et al. (2011) also found that CI algorithm can produce a large number of small clusters from generated networks. Unlike the CI algorithm, the number of proteins and the number of connections has less impact for cluster size by the CW algorithm (Supplementary Figure S5).
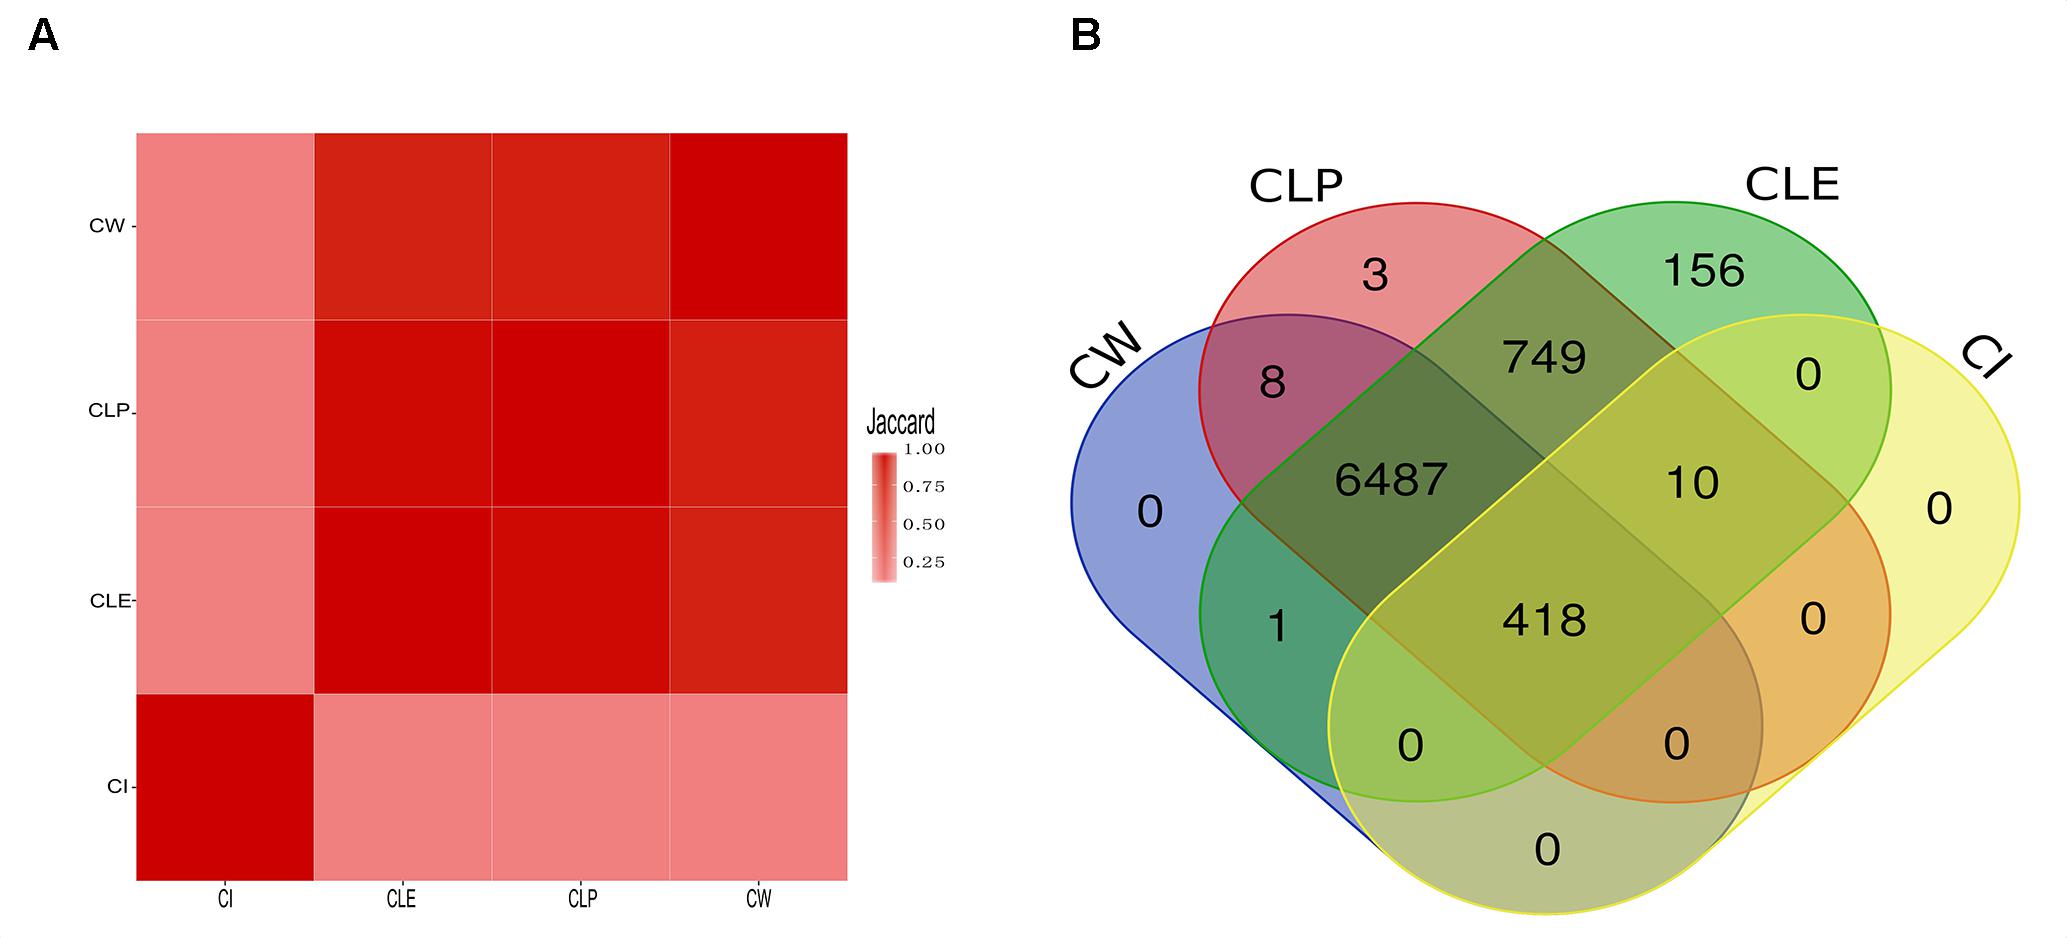
Figure 3. The similarity among the big clusters that were detected by four community detection methods. (A) The heatmap illustrates the Jaccard value of all big clusters of two algorithms. (B) The overlap of protein members that are clustered in big cluster among algorithms. All proteins in big clusters of CW and CI are shared with big clusters produced by CLE and CLP, while CLE and CLP contain its specific proteins in the big clusters.
Go Term Analysis for Clusters
Clusters have been considered as function modules in the past decades (Qin and Gao, 2010). However, different clustering methods generate different protein clusters with different sizes and protein members, potentially confounding the function annotation for each cluster. For each algorithm, we searched for big clusters with shared biological processes, and we found that these big clusters were distinct when enriched to GO terms. This suggests that all proteins in the big clusters are essential not only in cancer cell growth but also participate in diverse biological processes, which are identified by different cluster detection approaches. In the heatmap shown in Figure 4, the rows represent the top 20 significant biological processes and the columns represent the clusters from the MCF7 cell-based PPI network. We found significantly distinct clusters in all of the four algorithms and highlighted the most significant biological processes in the biggest cluster in each of the four algorithms. For example, in the CW heatmap (Figure 4), the annotation “Transcription” denotes the biggest cluster determined by this algorithm and is associated with the regulation of transcription through the RNA polymerase II promoter. In addition, Supplementary Table S4 shows the adjusted p-values of these processes associated with the clusters. Approximately 3,000 biological processes of the big clusters are shared among CW, CLP, and CLE (Supplementary Figure S2). Furthermore, 51 of the 55 big clusters detected by CW contain biological processes that map to GO terms (Supplementary Figure S3), while a smaller number of big clusters in CLP, CLE, and CI (25, 12, and 5) is seen containing such processes. These results indicate that CLE, CLP, and CI can identify more complex functional clusters than CW.
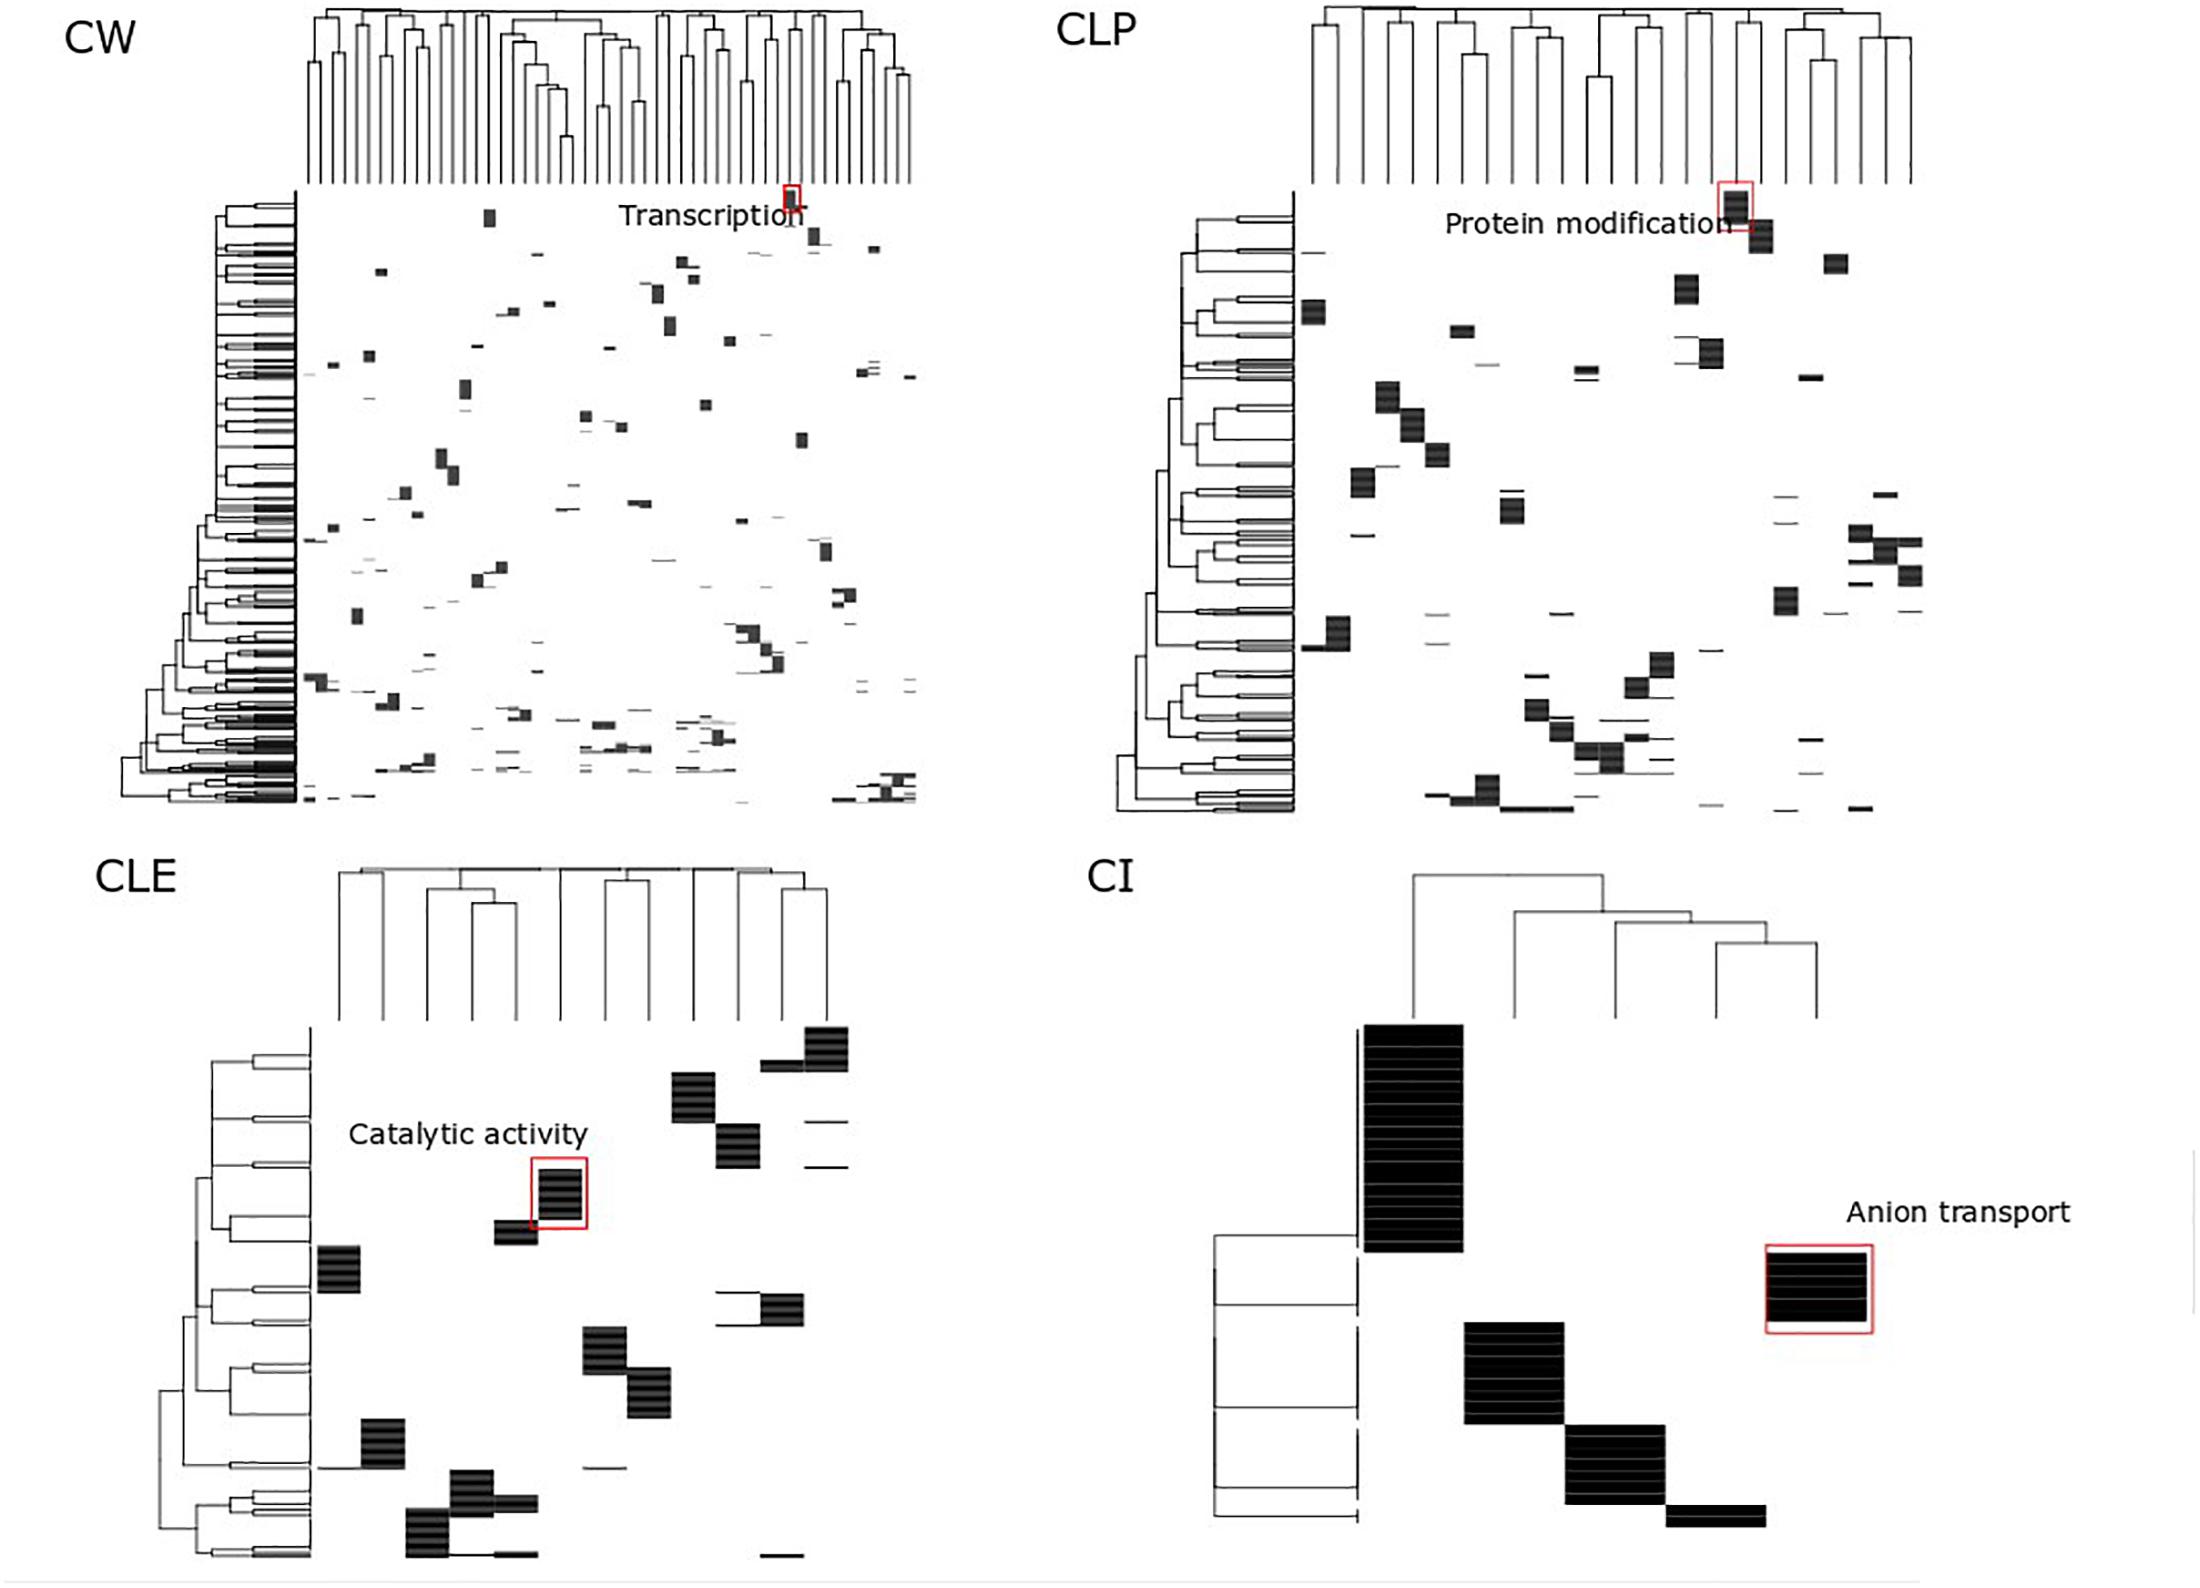
Figure 4. Functional analysis of big size clusters. This heatmap displays the top 20 significant associations between clusters and biological processes across four clusters detection algorithms. Color denotes enrichment of a given cluster with a biological process, hypergeometric log p-value after Benjamin–Hochberg adjustment. Cluster height reflects the number of interrelated processes associated with the given cluster. Cluster weight reflects clusters that shared this significant function. For major cluster based on each cluster detection algorithm, key biological themes are marked.
Cluster Improved Shortest Path Algorithm Performance
Isik et al. (2015) integrated perturbed genes from drug-treated cell lines and human PPI networks to identify drug target genes. However, the expression profiles of genes in different cell lines are different and may influence the interaction between proteins (Liang et al., 2014). To improve the performance of drug target identification, we first selected genes exhibiting drug-induced perturbation signatures from the big clusters produced by the four algorithms and considered these genes as functionally perturbed genes (FPGs) of the drugs. Then, we focused on integrating the FPGs of each of the 298s mapped to Drugbank with the MCF-7 cell-based PPI network using our revised CSP and CCD algorithms to combine perturbed genes with MCF-7 cell-based PPI networks to prioritize target genes and calculate the AUC to compare the performance of several conditions. We prioritized 270 target genes for the 298 drugs using the ranks produced by the two algorithms, which were subsequently sorted to predict the possible targets of a given drug. Figure 5A shows the number of perturbed genes of the drugs in the network after several different filtering conditions. We observed 11,715 perturbed genes for the 298 drugs in MCF-7 before the application of any PPI networks. After integration of the human cell-agnostic PPI network from STRING, 8,987 perturbed genes were found, while 5,989 of these genes remained once the human PPI network was further filtered to control for the MCF7 cell line (i.e., the MCF7 cell-based network). We found that 5,321 functionally perturbed genes appeared in both MCF-7 cell-based PPI network and big clusters produced by CW algorithm. We found that removing non-existing interactions in the network reduced the number of FPs while elucidating the shortest distance from the target genes to the perturbed genes associated with individual drugs. We validate our comparative and integrative approach as we found that using perturbed genes found only in functional clusters for calculating the shortest distance proves more effective than using all perturbed genes. For both CD and SP, we integrated the cell-agnostic PPI network (with confidence score > 800) with all drug-induced perturbed genes, as opposed to FPGs, as control groups (SP_C and CD_C) (Figure 5B and Supplementary Figure S6). We observed in the controls that the data of the target genes and their corresponding drugs produced by CD are less than that generated by SP (Table 1). We found that the cell-based PPI network improved the performance of drug target ranking by first evaluating all perturbed genes without the integration of clusters (Figures 5C,D). The AUC value as determined by CSP for the cell-based group (CSP, 0.30) was higher than that of the cell-agnostic control (SP_C, 0.29). The CCD method found similar results: the AUC value of the cell-based group (CCD, 0.09) was also higher than that of the control group (CD_C, 0.06). For the CSP approach, perturbed proteins found in functional clusters (i.e., proteins translated from FPGs) can further improve target gene ranking; this outcome was not seen for CCD (Figures 5C,D). For instance, CSP_CLE, CSP_CLP, and CSP_CW have a higher AUC value compared to CSP (0.38 AUC). Figure 5D shows the results are similar for the AUC value across CLE, CLP, CW, and, CCD. The shape of the baseline curve is significantly different from all other curves. Collectively, these results indicated that network-based approaches demonstrate improved performance for drug target ranking, although the participation of perturbed proteins in functional clusters contribute less to drug target prioritization calculated by CCD.
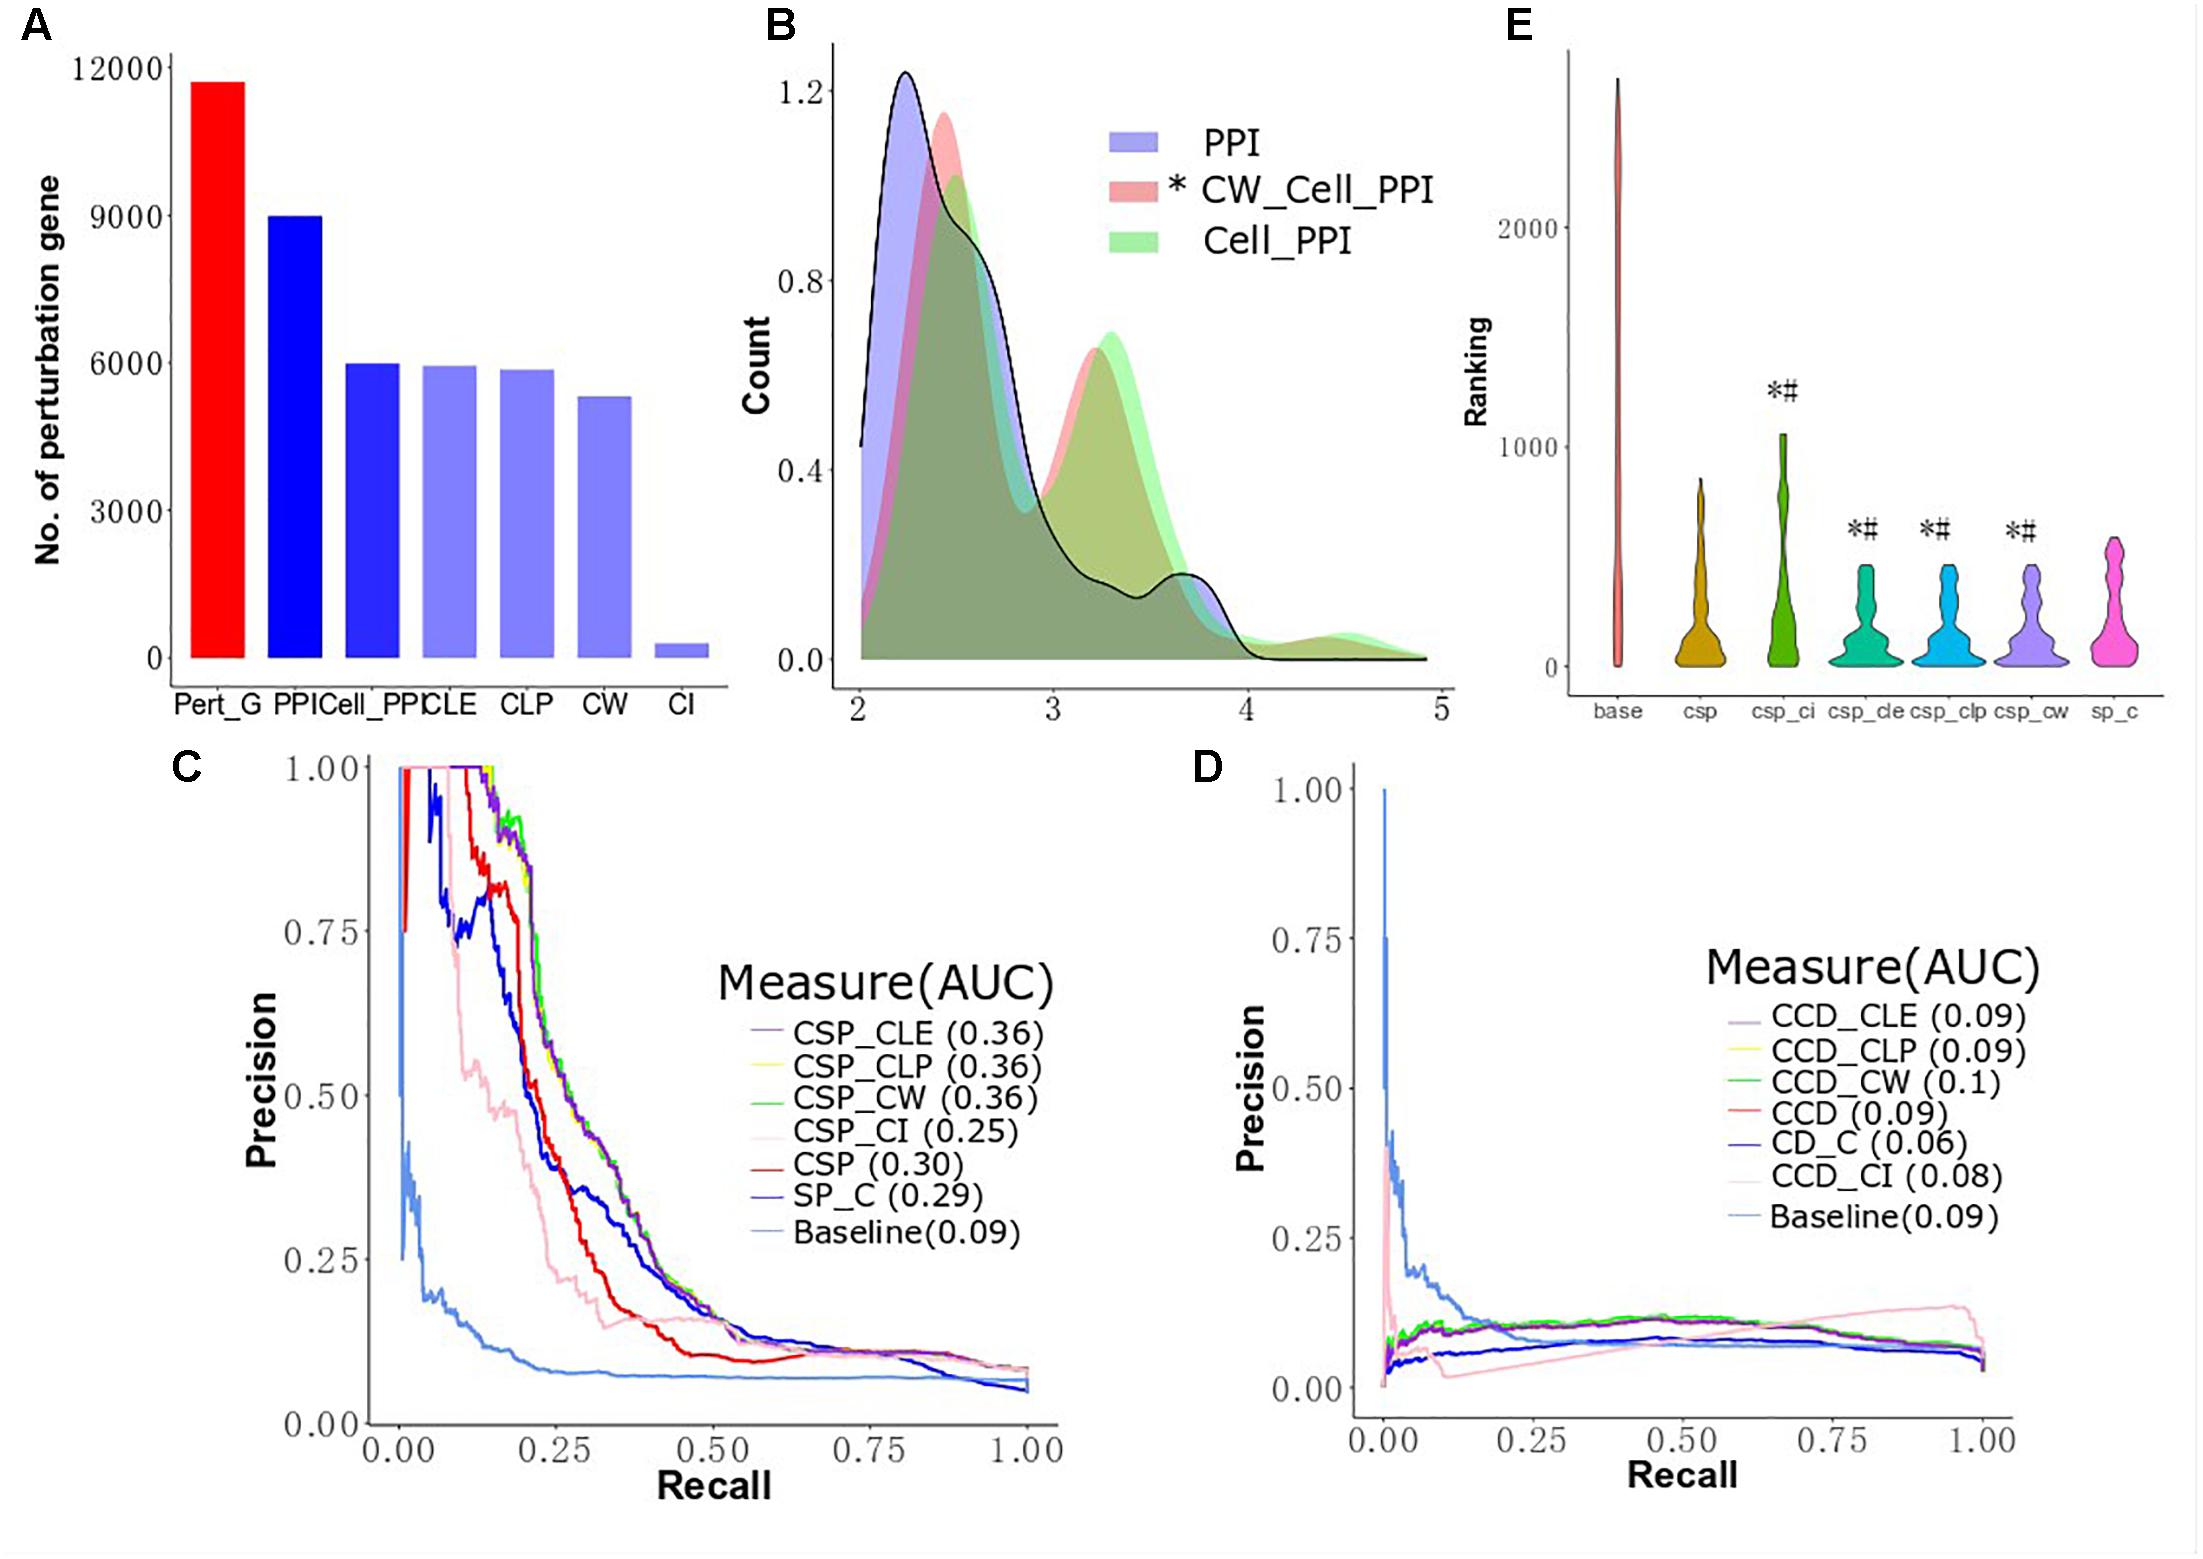
Figure 5. Cluster improving the performance of target prioritization. (A) The number of perturbed genes in MCF-7 cell lines after filtering by differential conditions. (B) Differentially expressed genes in clusters of cell PPI network are closer to known targets. The distributions of CW cell PPI are statistically different with PPI and cell PPI (Mann–Whitney, p-value < 2.2e−16 and p-value = 3.804e−05, respectively). (C) Performance of target gene prioritization using local radiality among functional genes selection algorithms (CLE, CLP, CW, and CI). (D) Performance of target gene prioritization using correlation diffusion among functional genes selection algorithms (CLE, CLP, CW, and CI). (E) The predictions are given for the top 200 of the target gene ranking lists. # means the target ranking curve is significant different with the curve of human network based on Mann–Whitney test; ∗ means the target ranking curve is significant different with the curve of cell-based network based on Mann–Whitney test.
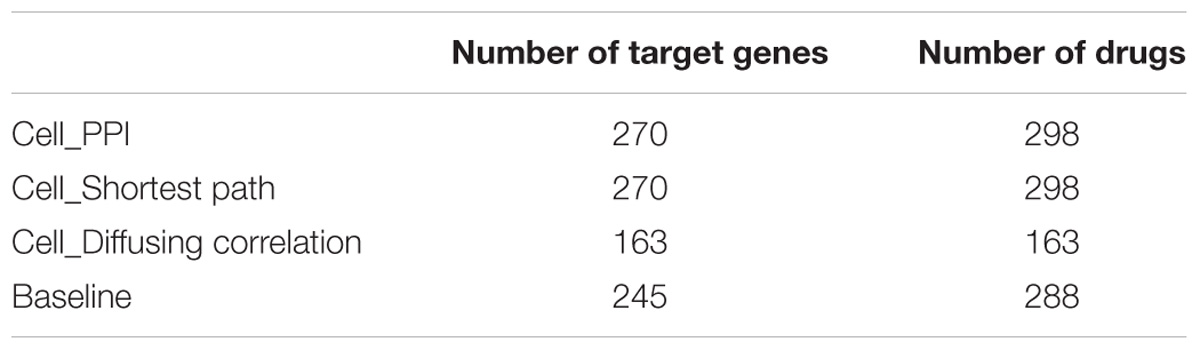
Table 1. The 270 drug target genes extracted from MCF-7 cell-based PPI network filtered by s > 800.
For the cell-based PPI network, the top 200 target genes rank in CLE, CLP, and CW, including 66 target genes shared between the three algorithms and corresponding to 127 drugs with significantly lower than CSP (Wilcoxon signed rank test, p-value = 0.04604, 0.04989, and 0.0347, respectively) and SP_C (Wilcoxon signed rank test, p-value = 0.000978, 0.001027, and 0.0006714, respectively) (Figure 5E). Top 200 target genes in baseline contains 102 unique target genes to 136 unique drugs. Most of the known targets and drugs in CW, CLP and CLE overlap with the top 200 genes in the ranking list of the CSP group (TCSP) (Table 2). These results show that the SP algorithm can further benefit the target gene ranking by integrating FPGs with network structure.
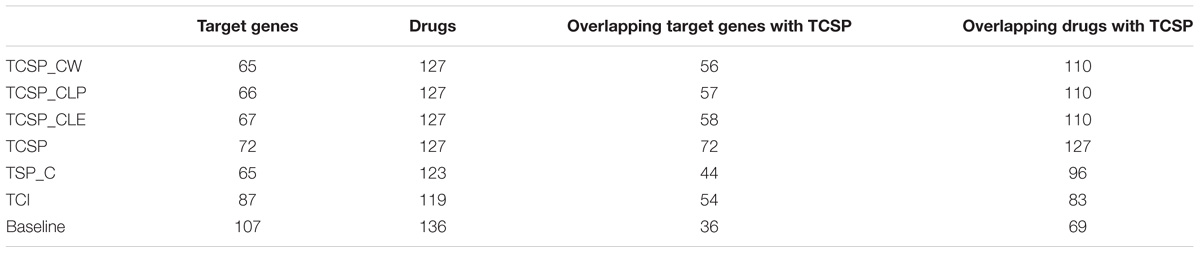
Table 2. The top 200 drug target genes in the ranking list.
Drug Repurposing in Breast Cancer Based on the Cluster
Comparing Potential Anti-cancer Drugs Identified by Cluster Detection Algorithms
Understanding the association between drugs and diseases at the molecular level is critical to unveil disease mechanisms and treatments (Zhao and Li, 2012). Drugs interact with targets and off-targets, inducing downstream pathway activity causing perturbations in the cellular transcriptome (Isik et al., 2015). The perturbed genes reflect the cellular response after drug treatment. If the perturbed genes of drugs that bind different target genes participate in the same functional clusters, these drugs could share a similar mode of action. Different algorithms generate different protein clusters with different sizes and protein members, potentially influencing functional annotation of each cluster. The hypothesis is that the fraction of perturbed genes of a drug in the clusters can reflect the properties of the drug. In this study, we used gene perturbation data integrated with clusters in the MCF7 cell-based network to find promising anti-breast cancer drugs. For each big cluster, we calculated the fraction of perturbed genes by each of the 298 drugs out of the total number of genes in that cluster, resulting in a matrix that illustrates the effect of each drug on each big cluster (Figure 1C). We then calculated the Pearson correlation of the perturbed gene proportions in the big clusters for the 298 drugs and compared it between these drugs and FDA-approved breast anticancer drugs, such as tamoxifen. Tamoxifen, an ER-targeting prodrug, is the most commonly administered chemotherapeutic drug in breast cancer patients. It is also the drug reported to induce the most gene perturbation in breast cancer cells. Figure 6 illustrates the distribution of the Pearson’s correlation between tamoxifen and the perturbed gene fractions. We found a strong correlation (r > 0.5) across CW, CLE, CLP, and CI. The reason for this result is that the bigger clusters of each algorithm usually include the most perturbed genes of drugs. We further predicted the top nine drugs from the drug ranking list for the each of the four algorithms as our candidate anti-breast cancer drugs, sorted based by the Pearson correlation coefficient. We demonstrated our predictions of each algorithm using evidence in the Clinical trials4 and literature (Table 3). All top nine drugs predicted by CW demonstrated ability to inhibit cell growth or induce apoptosis in breast cancer cells, while the other three algorithms predicted fewer candidate anti-breast cancer drugs that fulfilled this aim. We found fulvestrant, geldanamycin, loperamide, and ouabain (an endogenous hormone) to be the common promising candidate anti-cancer drugs identified by both CW and CLP. Fulvestrant, a known ER antagonist, is recommended as a treatment option for ER-positive breast cancer (Lamb et al., 2006). Geldanamycin, a heat shock protein 90 inhibitor, has been evaluated for the cancer treatment in a phase III clinical trial (Shipp et al., 2011). Loperamide, a peripheral opiate agonist that induces a dose-dependent apoptosis and G2/M arrest in human cancer cell lines (Wen et al., 2012; Regan et al., 2014), is typically used as an antidiarrheal and was also identified as a promising anti-cancer drug by CI, in addition to CW and CLP. Furthermore, Raloxifene (identified by CLE), Fulvestrant (identified by CW and CLP), Geldanamycin (identified by CW and CLP), Tanespimycin (identified by CW), and Alvespimycin (identified by CLP) are currently in the process of being approved by clinical trials. Then, we performed drug repurposing on raloxifene, an FDA-approved breast anti-cancer drug, and for paclitaxel, an anti-mitotic anti-cancer agent, to identify their promising anti-cancer drugs, respectively. Three drugs chemically analogous to raloxifene detected by CW and CLP are currently being validated by clinical trials. Four raloxifene analogs identified by CW have in vitro evidence, while two discovered by CLP demonstrate cell experiment evidence (Supplementary Table S6). Supplementary Table S7 shows that four candidate drugs associated with paclitaxel detected by CW have been used on breast cancer patients in the Clinicaltrials database and two others drugs were proved in vitro. Therefore, integrating the clusters produced by the Walktrap algorithm with drug-induced differential gene expression yields the best performance for drug repurposing.
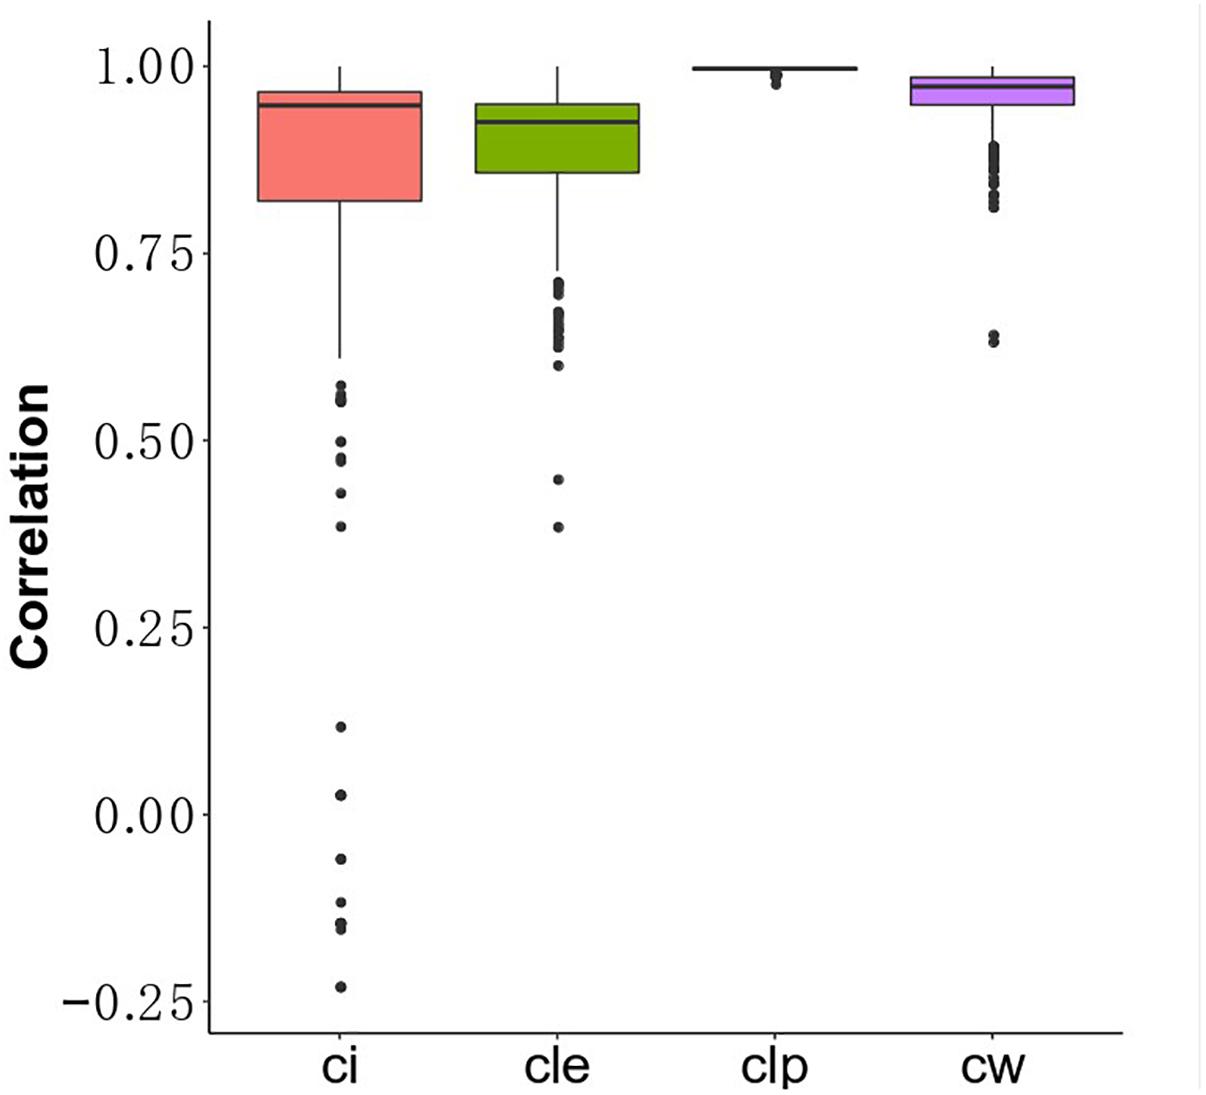
Figure 6. The distribution of Pearson value of fractions between drugs and tamoxifen.
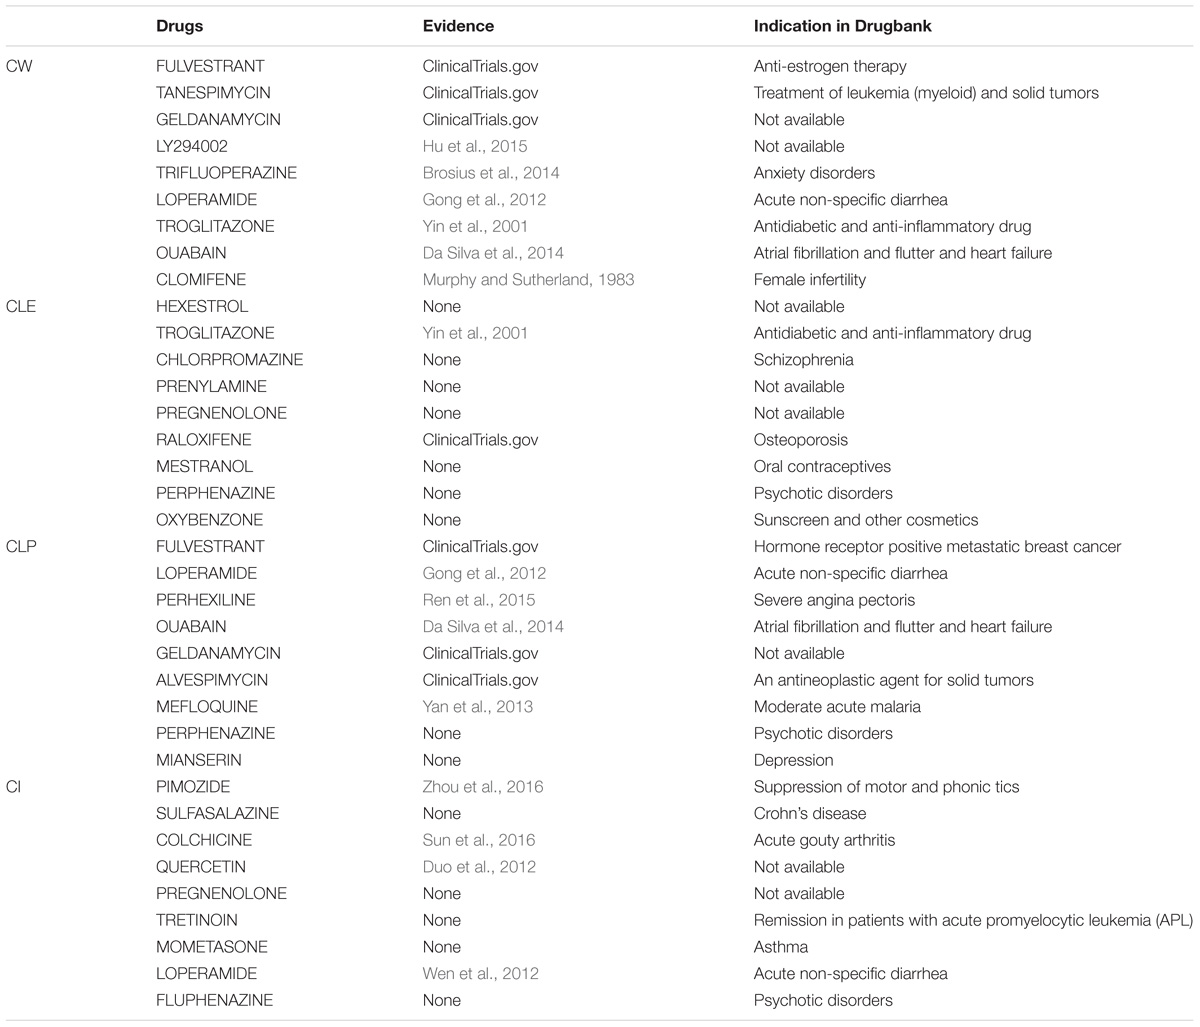
Table 3. Top nine potential anti-breast cancer drugs generated by the four algorithms.
Common Biological Processes of Candidate Breast Anti-cancer Drugs
We argue that perturbed genes that participate big functional clusters are important for studying the mode of action of drugs. To better understand this association for the candidate anticancer drugs detected by the top-performing algorithm, we extracted the perturbed genes of tamoxifen, fulvestrant, geldanamycin, and clomifene within the biggest cluster of CW to analyze their functions using a hypergeometric test. We obtained the overlapping biological processes shared amongst the four drugs (Figure 7). We found that these drugs, despite their differences in chemical structure and target genes, share 33 common biological processes, 3 of which are directly involved in cell growth and development, including regulation of cell proliferation, cell death, and cell cycle. Moreover, the biological pathways associated with these drugs also shared the GO term for estrogen response (GO: 0043627).
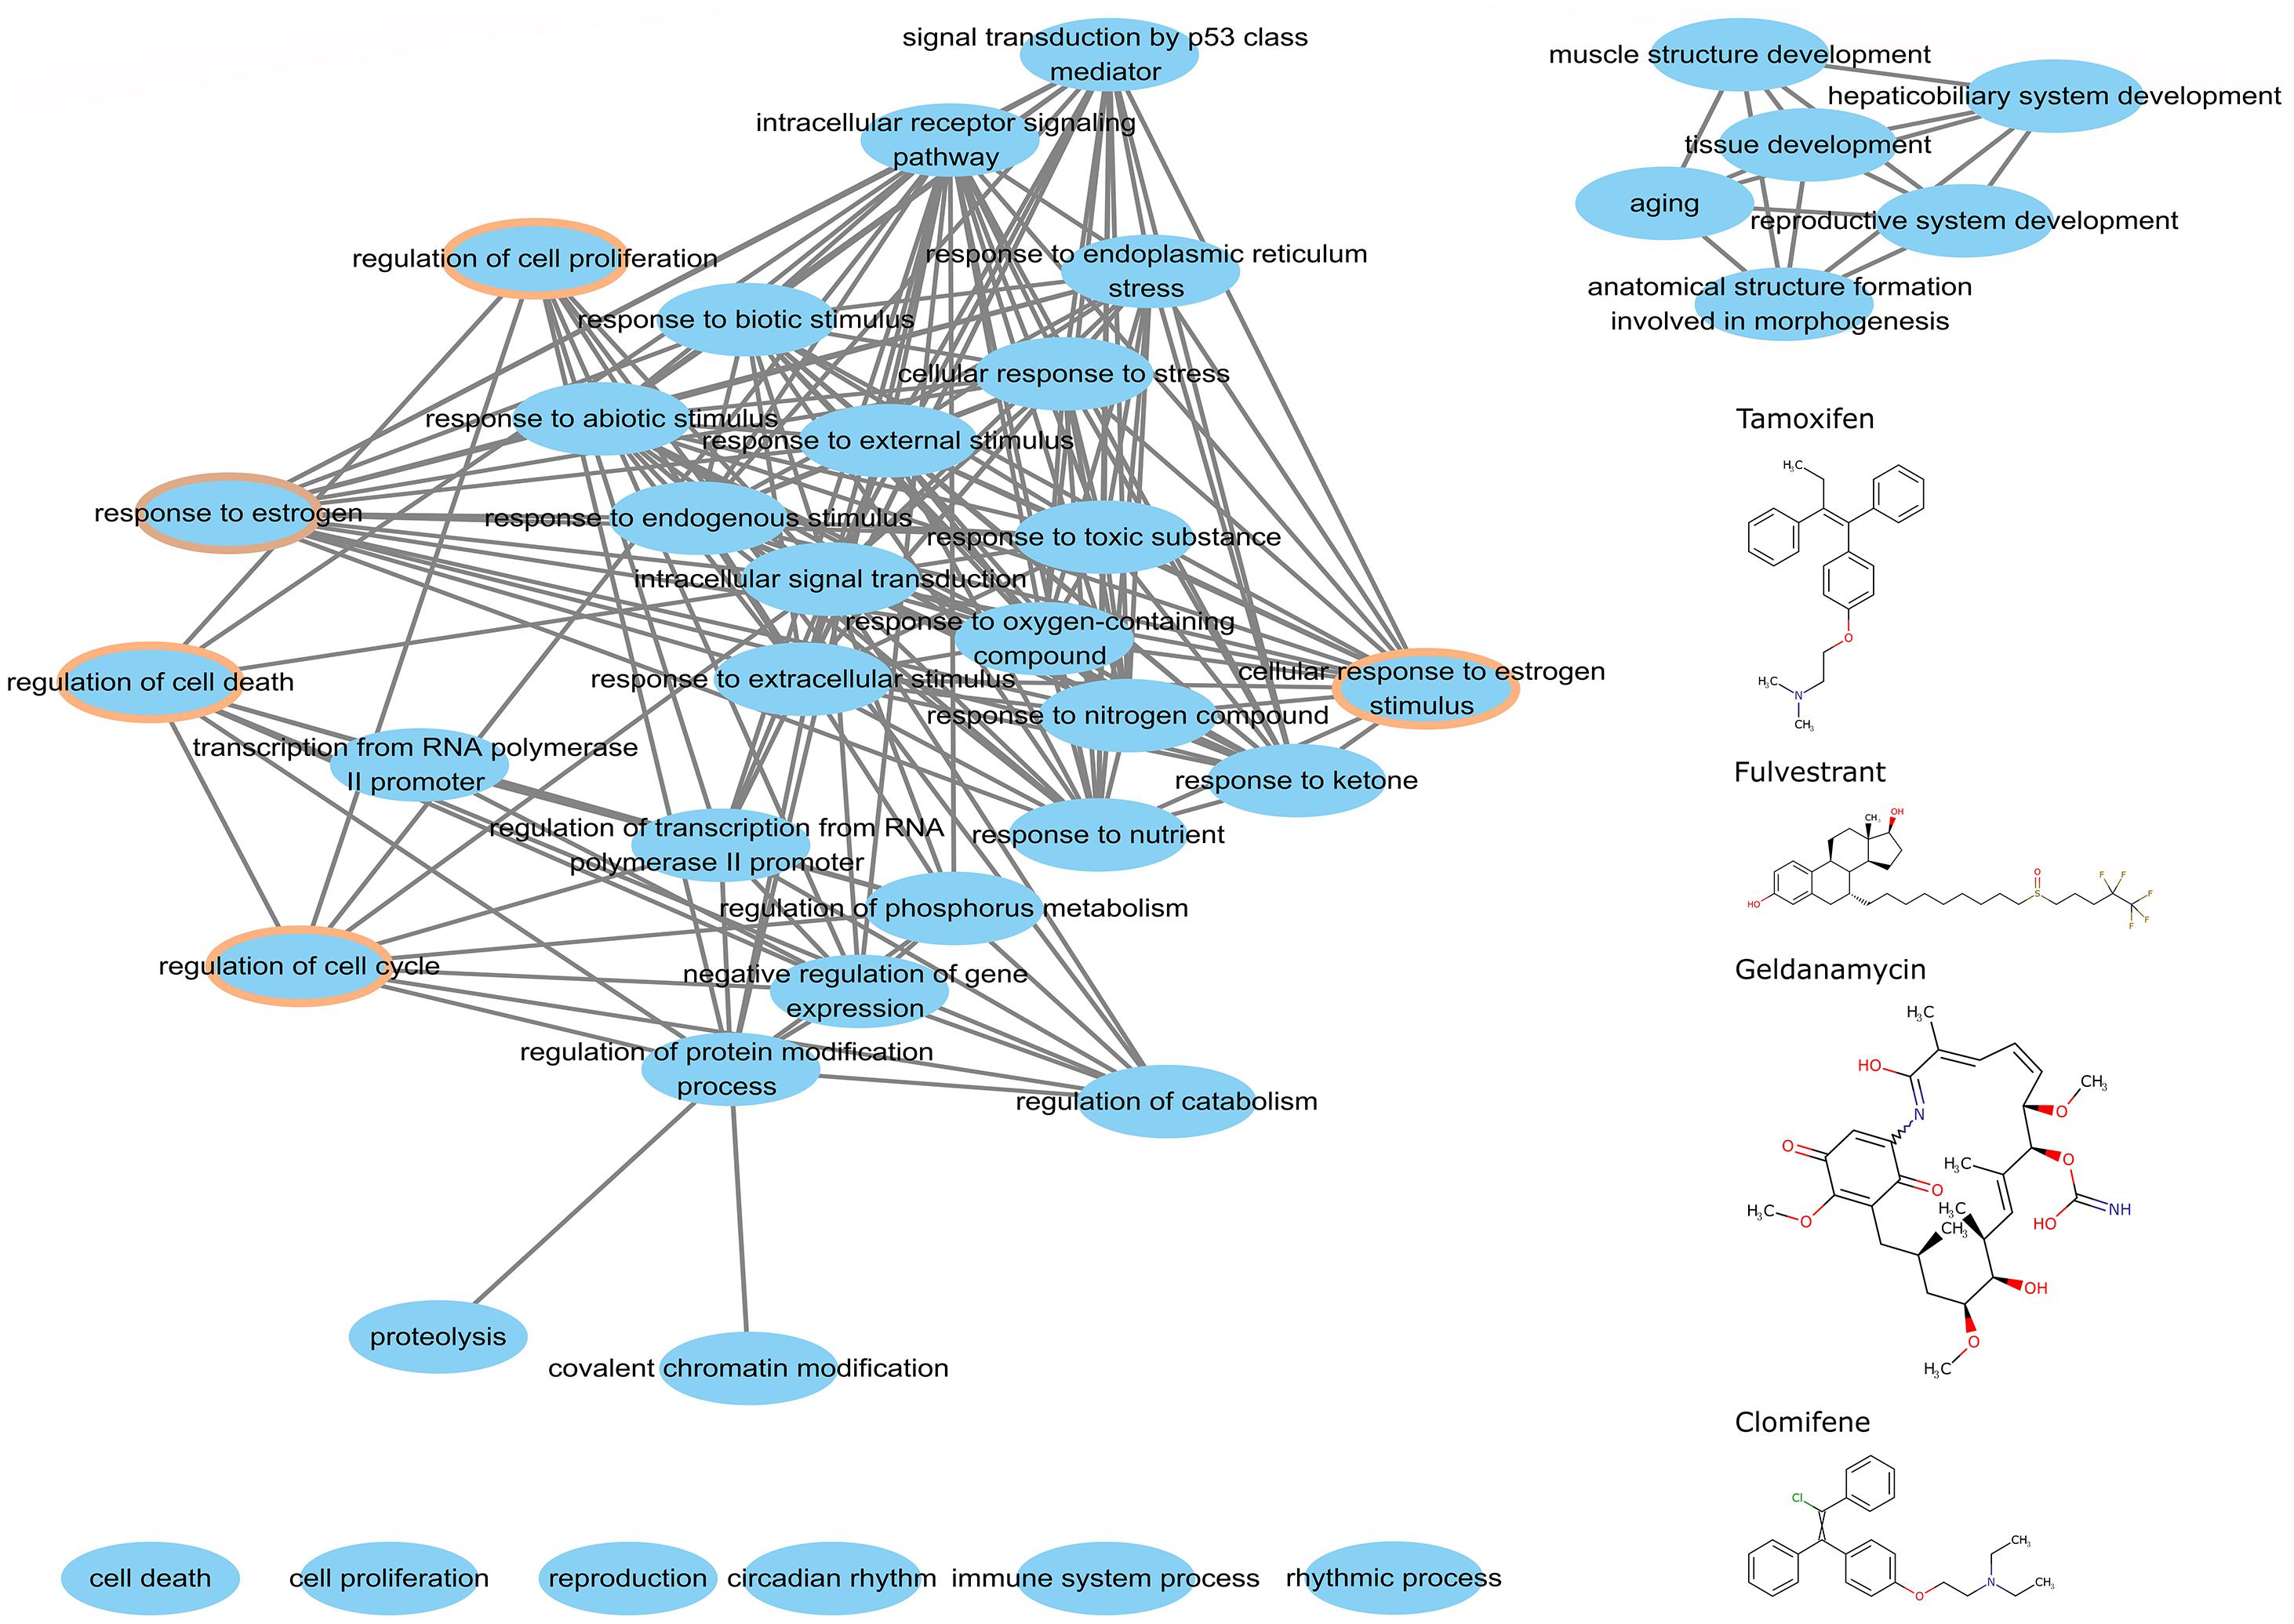
Figure 7. The common biological process of perturbed genes in the major cluster. The chemical structures of tamoxifen, fulvestrant, geldanamycin, and clomifene are on the right. The brown circle denotes the functional processes related to cell growth and development.
Discussion
The interactions among molecular components link biological functions, which are typically involved in functionally related clusters for their activities (Barabási and Oltvai, 2004; Liu et al., 2017). It has been reported that genes of similar disease phenotypes have a significantly higher number of interactions and highly connect with each other than with random genes (Goh and Choi, 2012), and the topological modules usually define disease-associated functional clusters (Ruan et al., 2006). However, Liu et al. (2017) pointed out the functional diversity of clusters in human PPI networks and that cluster detection approaches should be used with caution. Meanwhile, most studies classify the modules without considering the expression profile of specific cell lines or tissue types. In this study, we compared the clusters in the MCF-7 cell-based PPI network produced by four cluster detection algorithms, leading eigenvector (CLE), Walktrap [CWlabel propagation (CLP), and Infomap (CI)].
We observed that the big clusters (size ≥ 10) comprised a smaller fraction of total clusters and the big clusters generated by CLP, CLE, and CW contained most protein members, except CI. The distribution of node degrees in the network is a crucial factor for finding clusters using the CI algorithm. Therefore, we argue that compression-based clustering approaches should be used with caution for the identification of function clusters.
Drugs usually target multiple gene products and have the potential to be used for the treatment of several diseases. Some gene products may lead to serious side-effects and others may introduce novel applications to guide drug repurposing. Moreover, tumors are highly multifactorial at the molecular level, involving interactions in gene function networks (Zickenrott et al., 2017). The Connectivity Map (CMap) is a collection of gene expression profiles of five cancer cell lines before and after treatment with 1,300 small molecules (Lamb et al., 2006). In previous studies, integration of gene perturbation data in CMap with human PPI networks revealed drug targets and key pathways (Isik et al., 2015). However, most of the current network-based approaches for identification of essential proteins neglect significant differences in expression profiles among tissue types or even cell lines. We found that using a cell-based PPI network for target gene identification reduced the number of false positives for determining the shortest path between target and perturbed genes and improved drug target prediction compared with the cell-agnostic human PPI network. In this study, we improved target gene prediction by combining a cell-based PPI network with gene perturbation involved in big clusters.
Shortest path and correlation diffusion are two target gene prioritization algorithms. The SP measure assumes that deregulated genes might be close to drug targets based on network topology. SP identifies more diverse targets than CD, which agrees with previous conclusions (Isik et al., 2015). Moreover, we observed that integrating functional cluster-related perturbed genes with the MCF-7 cell-based network by CDhas little influence on the target gene prediction. The CD ranking, a random walk-based measure (Isik et al., 2015), sorts the proteins based on connectivity correlation in the network (Laenen et al., 2013). Cluster detection algorithms are also used as connection factor to identify functional clusters. Thus, the perturbed genes within the small clusters did not change the target gene ranking based on the this method. Furthermore, we calculated the fraction of drug-perturbed genes in each cluster as a drug-specific pattern to reflect cell response after drug treatment. We compared these patterns across tamoxifen, raloxifene, and paclitaxel, by computing the Pearson correlation to find promising anti-breast cancer candidate drugs. We observed that these drugs are highly similar to tamoxifen as predicted by CW, CLP, CLE, and CI. We selected the top nine drugs from each similarity ranking list as promising anti-breast cancer drugs and validated them through published literature and clinical trial cases. Based on the validation result, we found that the CW cluster detection algorithm showed the best ability to extract functional clusters from the network. To better understand the potential application of these drugs in breast cancer treatment, we performed a GO term analysis by extracting deregulated genes for four known anti-breast cancer drugs from the major cluster and obtained the overlapping biological processes among these drugs. The perturbed genes of these drugs not only appeared in big clusters detected from our cell-based PPI network, but also participated in common biological processes, such as cell cycle, cell death, and estrogen response pathways. We also used brinzolamide-induced gene perturbation data, which weakly correlates with tamoxifen, as a negative control, only three perturbed genes were found to overlap with gene members in the main cluster and no significant GO term enrichment was seen.
In summary, we gained insights into the structure of interactions by cluster detection algorithms and implemented the properties of clusters in the identification of target proteins and drug repurposing. We provide a new computational pipeline for the identification of drugs. However, the therapeutic potential of these agents requires further investigation.
Author Contributions
JM, BH-K, and PD conceived and designed the study. JM and LG developed the methodology. JM, LG, JW, and XM analyzed and interpreted the data (e.g., statistical analysis, biostatistics, and computational analysis). JM, JW, BH-K, and XM wrote, reviewed, and/or revised the manuscript. BH-K and PD supervised the study.
Funding
This work was supported by China Scholarship Council (CSC): National constructed high-level university-sponsored graduate programs; Shaanxi Natural Science Foundation (2018JZ3007).
Conflict of Interest Statement
The authors declare that the research was conducted in the absence of any commercial or financial relationships that could be construed as a potential conflict of interest.
Acknowledgments
The authors thank Petr Smirnov, Zhaleh Safikhani, and Seyed Ali Madani Tonekaboni for helpful advice and discussion about building cluster from cell-based PPI network, obtaining Perturbation genes data from CMap and drug target genes from Drugbank.
Supplementary Material
The Supplementary Material for this article can be found online at: https://www.frontiersin.org/articles/10.3389/fphar.2019.00109/full#supplementary-material
Footnotes
- ^ http://software.broadinstitute.org/gsea/msigdb/index.jsp
- ^ www.drugbank.ca/releases/5-0-11/downloads/target-all-uniprot-links
- ^ www.drugbank.ca/releases/5-0-11/downloads/target-all-polypeptide-ids
- ^ www.clinicaltrials.gov
References
Babcock, J. J., Du, F., Xu, K., Wheelan, S. J., and Li, M. (2013). Integrated analysis of drug-induced gene expression profiles predicts novel hERG inhibitors. PLoS One 8:e69513. doi: 10.1371/journal.pone.0069513
Badalà, F., Nouri-mahdavi, K., and Raoof, D. A. (2009). Mapping identifiers for the integration of genomic datasets with the R/Bioconductor package biomaRt. Nat. Protoc. 4, 1184–1191. doi: 10.1038/jid.2014.371
Bae, S., Kim, B., and Kang, S. (2011). A gene signature-based approach identi fi es thioridazine as an inhibitor of phosphatidylinositol-3′ -kinase (PI3K)/AKT pathway in ovarian cancer cells. Gynecol. Oncol. 120, 121–127. doi: 10.1016/j.ygyno.2010.10.003
Barabási, A.-L., and Oltvai, Z. N. (2004). Network biology: understanding the cell’s functional organization. Nat. Rev. Genet. 5, 101–113. doi: 10.1038/nrg1272
Barretina, J., Caponigro, G., Stransky, N., Venkatesan, K., Margolin, A. A., Kim, S., et al. (2012). The cancer cell line encyclopedia enables predictive modelling of anticancer drug sensitivity. Nature 483:603. doi: 10.1038/nature11003
Berger, S. I., and Iyengar, R. (2009). Network analyses in systems pharmacology. Bioinformatics 25, 2466–2472. doi: 10.1093/bioinformatics/btp465
Brosius, S. N., Turk, A. N., Byer, S. J., Longo, J. F., Kappes, J. C., Roth, K. A., et al. (2014). Combinatorial therapy with tamoxifen and trifluoperazine effectively inhibits malignant peripheral nerve sheath tumor growth by targeting complementary signaling cascades. J. Neuropathol. Exp. Neurol. 73, 1078–1090. doi: 10.1097/NEN.0000000000000126
Castro, L. S., Kviecinski, M. R., Ourique, F., Parisotto, E. B., Grinevicius, V. M., Correia, J. F., et al. (2016). Albendazole as a promising molecule for tumor control. Redox Biol. 10, 90–99. doi: 10.1016/j.redox.2016.09.013
Consortium, T. U. (2017). UniProt: the universal protein knowledgebase. Nucleic Acids Res. 45, 158–169. doi: 10.1093/nar/gkw1099
Csardi, G., and Nepusz, T. (2006). The igraph software package for complex network research. InterJ. Complex Syst. 1695, 1–9.
Da Silva, V. A., Da Silva, K. A., Delou, J. M., Da Fonseca, L. M., Lopes, A. G., and Capella, M. A. (2014). Modulation of ABCC1 and ABCG2 proteins by ouabain in human breast cancer cells. Anticancer. Res. 34, 1441–1448.
Daemen, A., Griffith, O. L., Heiser, L. M., Wang, N. J., Enache, O. M., Sanborn, Z., et al. (2013). Modeling precision treatment of breast cancer. Genome Biol. 14:R110. doi: 10.1186/gb-2013-14-10-r110
Deng, X.-H., Song, H.-Y., Zhou, Y.-F., Yuan, G.-Y., and Zheng, F.-J. (2013). Effects of quercetin on the proliferation of breast cancer cells and expression of survivin in vitro. Exp. Ther. Med. 6, 1155–1158. doi: 10.3892/etm.2013.1285
Duo, J., Ying, G.-G., Wang, G.-W., and Zhang, L. (2012). Quercetin inhibits human breast cancer cell proliferation and induces apoptosis via Bcl-2 and Bax regulation. Mol. Med. Rep. 5, 1453–1456. doi: 10.3892/mmr.2012.845
Gakhar, G., Ohira, T., Shi, A., Hua, D. H., and Nguyen, T. A. (2008). Antitumor effect of substituted quinolines in breast cancer cells. Drug Dev. Res. 69, 526–534. doi: 10.1002/ddr.20281
Gao, L., Sun, P. G., and Song, J. (2009). Functional Modules in Protein Interaction Networks. J. Bioinform. Comput. Biol. 7, 217–242. doi: 10.1142/S0219720009004023
Garnett, M. J., Edelman, E. J., Heidorn, S. J., Greenman, C. D., Dastur, A., Lau, K. W., et al. (2012). Systematic identification of genomic markers of drug sensitivity in cancer cells. Nature 483, 570–575. doi: 10.1038/nature11005
Goh, K.-I., and Choi, I.-G. (2012). Exploring the human diseasome: the human disease network. Brief. Funct. Genomics 11, 533–542. doi: 10.1093/bfgp/els032
Gong, X. W., Xu, Y. H., Chen, X. L., and Wang, Y. X. (2012). Loperamide, an antidiarrhea drug, has antitumor activity by inducing cell apoptosis. Pharmacol. Res. 65, 372–378. doi: 10.1016/j.phrs.2011.11.007
Gonzalez-Porta, M., Frankish, A., Rung, J., Harrow, J., and Brazma, A. (2013). Transcriptome analysis of human tissues and cell lines reveals one dominant transcript per gene. Genome Biol. 14:R70. doi: 10.1186/gb-2013-14-7-r70
Goodspeed, A., Heiser, L. M., Gray, J. W., and Costello, J. C. (2016). Tumor-derived cell lines as molecular models of cancer pharmacogenomics. Mol. Cancer Res. 14, 3–13. doi: 10.1158/1541-7786.MCR-15-0189
Guo, L., Lobenhofer, E. K., Wang, C., Shippy, R., Harris, S. C., Zhang, L., et al. (2006). Rat toxicogenomic study reveals analytical consistency across microarray platforms. Nat. Biotechnol. 24, 1162–1169. doi: 10.1038/nbt1238
Hartwell, L. H., Hopfield, J. J., Leibler, S., and Murray, A. W. (1999). From molecular to modular cell biology. Nature 402, C47–C52. doi: 10.1038/35011540
Holliday, D. L., and Speirs, V. (2011). Choosing the right cell line for breast cancer research. Breast Cancer Res. 13:215. doi: 10.1186/bcr2889
Hu, Y., Guo, R., Wei, J., Zhou, Y., Ji, W., Liu, J., et al. (2015). Effects of PI3K inhibitor NVP-BKM120 on overcoming drug resistance and eliminating cancer stem cells in human breast cancer cells. Cell Death Dis. 6:e2020. doi: 10.1038/cddis.2015.363
Inchiosa, M. A. Jr. (2018). Anti-tumor activity of phenoxybenzamine and its inhibition of histone deacetylases. PLoS One 13:e0198514. doi: 10.1371/journal.pone.0198514
Isik, Z., Baldow, C., Cannistraci, C. V., and Schroeder, M. (2015). Drug target prioritization by perturbed gene expression and network information. Sci. Rep. 5:17417. doi: 10.1038/srep17417
Iskar, M., Zeller, G., Blattmann, P., Campillos, M., Kuhn, M., Kaminska, K. H., et al. (2013). Characterization of drug-induced transcriptional modules: towards drug repositioning and functional understanding. Mol. Syst. Biol. 9:662. doi: 10.1038/msb.2013.20
Ivliev, A. E., t Hoen, P. A., Borisevich, D., Nikolsky, Y., and Sergeeva, M. G. (2016). Drug repositioning through systematic mining of gene coexpression networks in cancer. PLoS One 11:e0165059. doi: 10.1371/journal.pone.0165059
Jeffery, I. B., Higgins, D. G., and Culhane, A. C. (2006). Comparison and evaluation of methods for generating differentially expressed gene lists from microarray data. BMC Bioinformatics 7:359. doi: 10.1186/1471-2105-7-359
Juarez, M., Schcolnik-Cabrera, A., and Dueñas-Gonzalez, A. (2018). The multitargeted drug ivermectin: from an antiparasitic agent to a repositioned cancer drug. Am. J. Cancer Res. 8, 317–331.
Kenley, E. C., and Cho, Y. R. (2011). Detecting Protein Complexes and Functional Modules from Protein Interaction Networks: A Graph Entropy Approach. Available at: http://onlinelibrary.wiley.com/doi/10.1002/pmic.201100193/full
Klijn, C., Durinck, S., Stawiski, E. W., Haverty, P. M., Jiang, Z., Liu, H., et al. (2014). A comprehensive transcriptional portrait of human cancer cell lines. Nat. Biotechnol. 33, 306–312. doi: 10.1038/nbt.3080
Laenen, G., Thorrez, L., Börnigen, D., and Moreau, Y. (2013). Finding the targets of a drug by integration of gene expression data with a protein interaction network. Mol. Biosyst. 9, 1676–1685. doi: 10.1039/c3mb25438k
Lamb, J., Crawford, E. D., Peck, D., Modell, J. W., Blat, I. C., Wrobel, M. J., et al. (2006). The connectivity map: using gene-expression signatures to connect small molecules, genes, and disease. Science 313, 1929–1935. doi: 10.1126/science.1132939
Lee, D.-S., Park, J., Kay, K. A., Christakis, N. A., Oltvai, Z. N., and Barabási, A.-L. (2008). The implications of human metabolic network topology for disease comorbidity. Proc. Natl. Acad. Sci. U.S.A. 105, 9880–9885. doi: 10.1073/pnas.0802208105
Lee, H., Kang, S., and Kim, W. (2016). Drug repositioning for cancer therapy based on large-scale drug-induced transcriptional signatures. PLoS One 11:e0150460. doi: 10.1371/journal.pone.0150460
Levenson, A. S., and Jordan, V. C. (1997). MCF-7: the first hormone-responsive breast cancer cell line. Cancer Res. 57, 3071–3079.
Liang, S.-S., Wang, T.-N., and Tsai, E.-M. (2014). Analysis of protein-protein interactions in MCF-7 and MDA-MB-231 cell lines using phthalic acid chemical probes. Int. J. Mol. Sci. 15, 20770–20788. doi: 10.3390/ijms151120770
Liu, B., Huang, X., Hu, Y., Chen, T., Peng, B., Gao, N., et al. (2016). Ethacrynic acid improves the antitumor effects of irreversible epidermal growth factor receptor tyrosine kinase inhibitors in breast cancer. Oncotarget 7, 58038–58050. doi: 10.18632/oncotarget.10846
Liu, G., Wang, H., Chu, H., Yu, J., and Zhou, X. (2017). Functional diversity of topological modules in human protein-protein interaction networks. Sci. Rep. 7:16199. doi: 10.1038/s41598-017-16270-z
Menche, J., Sharma, A., Kitsak, M., Ghiassian, S. D., Vidal, M., Loscalzo, J., et al. (2015). Disease networks. Uncovering disease-disease relationships through the incomplete interactome. Science 347:1257601. doi: 10.1126/science.1257601
Murphy, L. C., and Sutherland, R. L. (1983). Antitumor activity of clomiphene analogs in vitro: relationship to affinity for the estrogen receptor and another high affinity antiestrogen-binding site. J. Clin. Endocrinol. Metab. 57, 373–379. doi: 10.1210/jcem-57-2-373
Murren, J. R., Durivage, H. J., Buzaid, A. C., Reiss, M., Flynn, S. D., Carter, D., et al. (1996). Trifluoperazine as a modulator of multidrug resistance in refractory breast cancer. Cancer Chemother. Pharmacol. 38, 65–70. doi: 10.1007/s002800050449
Musa, A., Ghoraie, L. S., Zhang, S.-D., Galzko, G., Yli-Harja, O., Dehmer, M., et al. (2017). A review of connectivity map and computational approaches in pharmacogenomics. Brief. Bioinform. 19, 506–523. doi: 10.1093/bib/bbw112
Narang, V. S., Pauletti, G. M., Gout, P. W., Buckley, D. J., and Buckley, A. R. (2007). Sulfasalazine-induced reduction of glutathione levels in breast cancer cells: enhancement of growth-inhibitory activity of Doxorubicin. Chemotherapy 53, 210–217. doi: 10.1159/000100812
Newman, M. E. J. (2006). Finding community structure in networks using the eigenvectors of matrices. Phys. Rev. E Stat. Nonlin. Soft Matter Phys. 74:036104. doi: 10.1103/PhysRevE.74.036104
Orman, G. K., Labatut, V., and Cherifi, H. (2011). Qualitative comparison of community detection algorithms. Commun. Comput. Inf. Sci. 167, 265–279. doi: 10.1007/978-3-642-22027-2-23
Orman, G. K., Labatut, V., and Cherifi, H. (2012). Comparative evaluation of community detection algorithms: a topological approach. J. Stat. Mech. Theory Exp. 2012:08001. doi: 10.1088/1742-5468/2012/08/P08001
Pantziarka, P., Bouche, G., Meheus, L., Sukhatme, V., and Sukhatme, V. P. (2014). Repurposing Drugs in Oncology (ReDO)-mebendazole as an anti-cancer agent. Ecancermedicalscience 8:443. doi: 10.3332/ecancer.2014.443
Peel, L. (2010). “Estimating network parameters for selecting community detection algorithms,” in 2010 13th International Conference on Information Fusion, Piscataway, NJ, 1–8. doi: 10.1109/ICIF.2010.5712065
Pons, P., and Latapy, M. (2005). Computing Communities in Large Networks Using Random Walks. Available at: https://link.springer.com/chapter/10.1007/11569596_31
Pons, P., and Latapy, M. (2006). Computing Communities in Large Networks Using Random Walks. J. Graph Algorithms Appl. 10, 191–218. doi: 10.7155/jgaa.00124
Qi, C., Zhou, Q., Li, B., Yang, Y., Cao, L., Ye, Y., et al. (2014). Glipizide, an antidiabetic drug, suppresses tumor growth and metastasis by inhibiting angiogenesis. Oncotarget 5, 9966–9979. doi: 10.18632/oncotarget.2483
Qin, G., and Gao, L. (2010). Spectral clustering for detecting protein complexes in protein–protein interaction (PPI) networks. Math. Comput. Model. 52, 2066–2074. doi: 10.1016/j.mcm.2010.06.015
Raghavan, U. N., Albert, R., and Kumara, S. (2007). Near linear time algorithm to detect community structures in large-scale networks. Phys. Rev. E76:036106. doi: 10.1103/PhysRevE.76.036106
Regan, R. C., Gogal, R. M., Barber, J. P., Tuckfield, R. C., Howerth, E. W., and Lawrence, J. A. (2014). Cytotoxic effects of loperamide hydrochloride on canine cancer cells. J. Vet. Med. Sci. 76, 1563–1568. doi: 10.1292/jvms.13-0537
Ren, X.-R., Wang, J., Osada, T., Mook, R. A. Jr., Morse, M. A., Barak, L. S., et al. (2015). Perhexiline promotes HER3 ablation through receptor internalization and inhibits tumor growth. Breast Cancer Res. 17:20. doi: 10.1186/s13058-015-0528-9
Rosvall, M., and Bergstrom, C. T. (2008). Maps of random walks on complex networks reveal community structure. Proc. Natl. Acad. Sci. U.S.A. 105,1118–1123. doi: 10.1073/pnas.0706851105
Ruan, X.-G., Wang, J.-L., and Li, J.-G. (2006). A network partition algorithm for mining gene functional modules of colon cancer from DNA microarray data. Genomics Proteomics Bioinformatics 4, 245–252. doi: 10.1016/S1672-0229(07)60005-9
Sah, P., Singh, L. O., Clauset, A., and Bansal, S. (2014). Exploring community structure in biological networks with random graphs. BMC Bioinformatics 15:220. doi: 10.1186/1471-2105-15-220
Sharan, R., Ulitsky, I., and Shamir, R. (2007). Network-based prediction of protein function. Mol. Syst. Biol. 3:88. doi: 10.1038/msb4100129
Shen, T., Shang, C., Zhou, H., Luo, Y., Barzegar, M., Odaka, Y., et al. (2017). Ciclopirox inhibits cancer cell proliferation by suppression of Cdc25A. Genes Cancer 8, 505–516. doi: 10.18632/genesandcancer.135
Shipp, C., Watson, K., and Jones, G. L. (2011). Associations of HSP90 client proteins in human breast cancer. Anticancer. Res. 31, 2095–2101.
Smirnov, P., Kofia, V., Maru, A., Freeman, M., Ho, C., El-Hachem, N., et al. (2018). PharmacoDB: an integrative database for mining in vitro anticancer drug screening studies. Nucleic Acids Res. 46, D994–D1002. doi: 10.1093/nar/gkx911
Smirnov, P., Safikhani, Z., El-Hachem, N., Wang, D., She, A., Olsen, C., et al. (2016). PharmacoGx: an R package for analysis of large pharmacogenomic datasets. Bioinformatics 32, 1244–1246. doi: 10.1093/bioinformatics/btv723
Spirin, V., and Mirny, L. A. (2003). Protein complexes and functional modules in molecular networks. Proc. Natl. Acad. Sci. U.S A. 100, 12123–12128. doi: 10.1073/pnas.2032324100
Sun, Y., Lin, X., and Chang, H. (2016). Proliferation inhibition and apoptosis of breast cancer MCF-7 cells under the influence of colchicine. J. BUON 21, 570–575.
Supek, F., Bošnjak, M., Škunca, N., and Šmuc, T. (2011). REVIGO summarizes and visualizes long lists of gene ontology terms. PLoS One 6:e21800. doi: 10.1371/journal.pone.0021800
Szklarczyk, D., Franceschini, A., Wyder, S., Forslund, K., Heller, D., Huerta-Cepas, J., et al. (2015). STRING v10: protein-protein interaction networks, integrated over the tree of life. Nucleic Acids Res. 43, D447–D452. doi: 10.1093/nar/gku1003
Väremo, L., Nielsen, J., and Nookaew, I. (2013). Enriching the gene set analysis of genome-wide data by incorporating directionality of gene expression and combining statistical hypotheses and methods. Nucleic Acids Res. 41,4378–4391. doi: 10.1093/nar/gkt111
Wen, X., Hong, Y., Ling, X., and Xiang, Y. (2012). Loperamide, an antidiarrhea drug, has antitumor activity by inducing cell apoptosis. Pharmacol. Res. 65, 372–378. doi: 10.1016/j.phrs.2011.11.007
Wishart, D. S., Knox, C., Guo, A. C., Cheng, D., Shrivastava, S., Tzur, D., et al. (2008). DrugBank: a knowledgebase for drugs, drug actions and drug targets. Nucleic Acids Res. 36, D901–D906. doi: 10.1093/nar/gkm958
Wu, Z., Wang, Y., and Chen, L. (2013). Network-based drug repositioning. Mol. Biosyst. 9, 1268–1281. doi: 10.1039/c3mb25382a
Yan, K.-H., Lin, Y.-W., Hsiao, C.-H., Wen, Y.-C., Lin, K.-H., Liu, C.-C., et al. (2013). Mefloquine induces cell death in prostate cancer cells and provides a potential novel treatment strategy in vivo. Oncol. Lett. 5, 1567–1571. doi: 10.3892/ol.2013.1259
Yang, Z., Algesheimer, R., and Tessone, C. J. (2016). A comparative analysis of community detection algorithms on artificial networks. Sci. Rep. 6:30750. doi: 10.1038/srep30750
Yde, C. W., Clausen, M. P., Bennetzen, M. V., Lykkesfeldt, A. E., Mouritsen, O. G., and Guerra, B. (2009). The antipsychotic drug chlorpromazine enhances the cytotoxic effect of tamoxifen in tamoxifen-sensitive and tamoxifen-resistant human breast cancer cells. Anticancer. Drugs 20, 723–735. doi: 10.1097/CAD.0b013e32832ec041
Yin, F., Wakino, S., Liu, Z., Kim, S., Hsueh, W. A., Collins, A. R., et al. (2001). Troglitazone inhibits growth of MCF-7 breast carcinoma cells by targeting G1 cell cycle regulators. Biochem. Biophys. Res. Commun. 286, 916–922. doi: 10.1006/bbrc.2001.5491
Zhao, S., and Li, S. (2012). A co-module approach for elucidating drug-disease associations and revealing their molecular basis. Bioinformatics 28, 955–961. doi: 10.1093/bioinformatics/bts057
Zheng, H.-X., Wu, L.-N., Xiao, H., Du, Q., and Liang, J.-F. (2014). Inhibitory effects of dobutamine on human gastric adenocarcinoma. World J. Gastroenterol. 20, 17092–17099. doi: 10.3748/wjg.v20.i45.17092
Zhou, W., Chen, M.-K., Yu, H.-T., Zhong, Z.-H., Cai, N., Chen, G.-Z., et al. (2016). The antipsychotic drug pimozide inhibits cell growth in prostate cancer through suppression of STAT3 activation. Int. J. Oncol. 48, 322–328. doi: 10.3892/ijo.2015.3229
Keywords: breast cancer, PPI network, target gene, drug repositioning, drug action, CMap, cell proliferation
Citation: Ma J, Wang J, Ghoraie LS, Men X, Haibe-Kains B and Dai P (2019) A Comparative Study of Cluster Detection Algorithms in Protein–Protein Interaction for Drug Target Discovery and Drug Repurposing. Front. Pharmacol. 10:109. doi: 10.3389/fphar.2019.00109
Received: 03 October 2018; Accepted: 28 January 2019;
Published: 19 February 2019.
Edited by:
Tingjun Hou, Zhejiang University, ChinaReviewed by:
Cao Dongsheng, Central South University, ChinaAlfredo Pulvirenti, Università degli Studi di Catania, Italy
Copyright © 2019 Ma, Wang, Ghoraie, Men, Haibe-Kains and Dai. This is an open-access article distributed under the terms of the Creative Commons Attribution License (CC BY). The use, distribution or reproduction in other forums is permitted, provided the original author(s) and the copyright owner(s) are credited and that the original publication in this journal is cited, in accordance with accepted academic practice. No use, distribution or reproduction is permitted which does not comply with these terms.
*Correspondence: Penggao Dai, ZGFpcGdAbnd1LmVkdS5jbg==