Abstract
Eucommiae Cortex is commonly used for treating various diseases in a form of the crude and salt-fired products. Generally, it is empirical to distinguish the difference between two types of Eucommiae Cortex. The metabolomics coupled with chemometrics strategy was proposed to filter the combinatorial discriminatory quality markers for precise distinction and further quality control of the crude and salt-fired Eucommiae Cortex. The metabolomics data of multiple batches of Eucommiae Cortex samples was obtained by ultra-high performance liquid chromatography coupled with mass spectrometry (UHPLC-MS). Orthogonal partial least-squares discriminant analysis was utilized to filter candidate markers for characterizing the obvious difference of the crude and salt-fired Eucommiae Cortex. The accuracy of combinatorial markers was validated by random forest and partial least squares regression. Finally, eleven combinatorial discriminatory quality markers from 67 identified compounds were rapidly screened, identified, and determined for distinguishing the difference between crude and salt-fired Eucommiae Cortex. It was demonstrated that UHPLC-MS based metabolomics with chemometrics was a powerful strategy to screen the combinatorial discriminatory quality markers for distinguishing the crude and salt-fired Eucommiae Cortex and to provide the reference for precise quality control of Eucommiae Cortex.
Introduction
Eucommiae Cortex, also named Duzhong in China, is the dry bark of Eucommia ulmoides Oliv. tree and one of the oldest traditional chinese herbal medicines (Zhao et al., 2015). It has been listed as one of the “Middle grade” medicines in Sheng Nong’s herbal classic since two thousand years ago (Cronquist and Takhtadzhian, 1981). It is used clinically to treat a variety of diseases such as osteoporosis, rheumatoid arthritis, hypertension, and menopause syndrome (He et al., 2014). The active ingredients mainly included lignans, iridoids, phenolics, and so on. These ingredients have a wide range of pharmacological activities such as antihypertensive, anti-aging, antioxidant, antimutagenic, and anti-inflammatory activities (Li et al., 2014; Zhu and Sun, 2018).
Traditional Chinese Herbs (TCHs) have been widely used to treat various diseases over thousand years and its global demand is also increasing year after year. Generally, most of Chinese herbs should be prepared in several special processing ways such as stir-frying, steaming, boiling, stewing, and so on (Wang F. et al., 2017). This may directly change the content of some certain compounds, possibly affecting the pharmacological activities of TCHs (Wu et al., 2018). As officially recorded in Chinese pharmacopeia (2015 edition), both the crude and salt-fired Eucommiae Cortex commonly used to treat the disease in clinic. Moreover, salt-fired herb medicines are more preferred to act on the “kidney channel” and further improve kidney and liver function according to the Chinese medicine traditional processing theory. Modern research showed that the content and absorption behavior of active compounds would be obviously changed when the Eucommiae Cortex was subject to the salt-fired processing (Lu et al., 2018). Importantly, it needs to be clearly stated whether the crude or the salt-fired Eucommiae Cortex is used for Chinese medicine prescriptions. For example, the salt-fired Eucommiae Cortex was explicitly prescribed to be used for Yougui Wan, Tianma Wan and Qing’e Wan. Compared with the chemical drugs, herbal medicines are the mixtures of multicompounds, which would bring a huge challenge for prescribing the appropriate compounds for quality evaluation. The chemical marker of quality control (QC) of TCHs is commonly one or a few compound (Li et al., 2019). In Chinese Pharmacopeia (2015 edition), the quality standard of Eucommiae Cortex is that the content of pinoresinol di-o-glucopyranoside is not less than 0.1%. However, it may be not specific and practical due to a lack of definitive standard used for distinguishing two types of Eucommiae Cortex products. Therefore, it is necessary to discover the effective quality markers for distinguishing the crude and salt-fired Eucommiae Cortex.
Recently, metabolomic technology has become an important and valuable tool in the life sciences. It has been extended to a variety of research areas such as biomarker discovery, disease diagnosis, and quality evaluation of TCHs (Mao et al., 2017; Aszyk et al., 2018). Fortunately, metabolomic methods greatly contribute to discoveries of difference markers that represent the change in the biological environment caused by the special disturbances. Liquid chromatography-mass spectrometry (LC-MS) method plays an important role in the acquisition of metabolomic dataset and identification of metabolites depending on its high separation capacity and sensitivity (Zhou et al., 2012). Chemometrics is quite versatile due to the perfect combination of mathematics, statistics, and computer science (Ziegel, 2004). It provides many good algorithms to mine and retrieve more valuable chemical information from natural products (Kumar et al., 2014). Among the algorithms, random forest (RF) and partial least squares regression (PLSR) are commonly regarded as the effective tool in classification and accuracy prediction for multivariate data (Xia et al., 2017; Wang et al., 2019). Thus, the use of metabolomics in combination with chemometrics might exhibit the unique advantage for the analysis the discrimination between crude Eucommiae Cortex and its processed product.
In this work, an LC-MS based metabolomics coupled with chemometrics strategy was proposed to screen the combinatorial discriminatory quality markers (CdQMs) for distinction of crude and salt-fired Eucommiae Cortex. Firstly, a total of the 38 different batches of the crude and salt-fired Eucommiae Cortex were subjected to ultra-high performance liquid chromatography coupled with quadrupole time-of-flight mass spectrometry (UHPLC-Q-TOF/MS) analysis for acquisition of the whole chemical profile. Secondly, the CdQMs were stepwise filtered from massive metabolomics data by a series of approaches of chemometrics analysis. To be specific, the filtering process was followed by the several rules: 1) the markers could well distinguish the crude and salt-fired Eucommiae Cortex; 2) the markers had high accuracies; 3) the markers were easy to access commercially and quantify. At last, the content of the CdQMs in the crude and salt-fired Eucommiae Cortex were analyzed by UHPLC–PDA (photodiode array detector) method and the effectiveness of CdQMs were further validated by discriminant analysis. The LC-MS metabolomics coupled with chemometrics strategy was successfully used to screen the CdQMs for distinguishing the crude and salt-fired Eucommiae Cortex.
Materials and Methods
Plant Material
A total of 54 batches of crude and salt-fired Eucommiae Cortex were used for this study. Among the, the 27 batches of crude samples (C1-C19 and VC1-VC8) and 19 batches of salt-fired samples (S1-S19) were purchased from different drugstores in Tianjin and Hebei province of China. Moreover, according to Chinese Pharmacopeia (2015 edition), we processed eight batches of salt-fired samples (VS1-VS8) using the crude samples (VC1-VC8). All samples were authenticated as Eucommia ulmoides Oliver. by Prof. Lin Ma (Tianjin University of Traditional Chinese Medicine). The voucher specimens of Eucommia ulmoides Oliv., such as QFNU QFNU0018228, QFNU QFNU0018229, SYS SYS00189991, WUK 0060451, etc., were deposited in Chinese Virtual Herbarium (http://www.cvh.ac.cn/), and corresponding herbarium codes, for example, QFNU, SYS, WUK, etc., were searchable in the NYBG Steere Herbarium (http://sweetgum.nybg.org/science/ih/?_ga=2.40299874.1384373005.1557930148-1052084957.1548409239).
Chemicals and Reagents
HPLC grade acetonitrile, methanol, and formic acid were obtained from Fisher Scientific (Pittsburg, PA, USA) and Anaqua™ Chemicals Supply (Wilmington, DE, USA), respectively. Deionized water was purified by Milli-Q academic ultra-pure water system (Millipore, Milford, MA, USA). Standard substances such as geniposidic acid, neochlorogenic acid, chlorogenic acid, caffeic acid, geniposide, genipin, pinoresinol di-o-glucopyranoside, syringaresinol di-o-glucopyranoside, isochlorogenic acid A, pinoresinol o-glucopyranoside, and isochlorogenic acid C were purchased from Chengdu Desite Bio-Technology Co., Ltd (Chengdu, China). The purity of all standard substances was more than 98%.
Preparation of Sample and Standard Substance Solution
Preparation of Sample Solution
The samples were powered and passed through 80 mesh sieves. The powder (0.400 g) was accurately weighed and was then extracted by ultrasonic method (40 kHz, 1,200 W) for 20 min at room temperature (28°C) with 50% methanol-water (10 ml). All the sample solution was passed through a 0.22-µm filter membrane and was stored at 4◦C for subsequent experiments.
Preparation of Standard Substance Stock Solution
Eleven standard substances (geniposidic acid, neochlorogenic acid, chlorogenic acid, caffeic acid, geniposide, genipin, pinoresinol di-o-glucopyranoside, syringaresinol di-o-glucopyranoside, isochlorogenic acid A, pinoresinol o-glucopyranoside, and isochlorogenic acid C) were accurately weighed and respectively dissolved with methanol solvent. The separate standard solutions were then mixed as stock solution for plotting standard curves through stepwise dilution.
UHPLC-Q-TOF/MS Acquisition Analysis
UHPLC-Q-TOF/MS system was composed of Agilent 1290 UHPLC instrument (Agilent Technologies, Waldbronn, Germany) and Agilent 6520 Q-TOF mass spectrometer (Agilent Corporation, Santa Clara, CA, USA). The mass spectra data was acquired in the negative electrospray ion (ESI) mode. The chromatographic peaks were separated on an ACQUITY UPLC BEH C18 Column (2.1 × 150 mm, 1.7 µm, Waters) at a flow rate of 0.3 ml/min. The temperature of column was at room temperature (28°C). Mobile phase consisted of 0.1% formic acid–water (A) and acetonitrile (B). The gradient elution program was set as: 0–2.5 min, 5%–10% B; 2.5–7 min, 10%–13% B; 7–10 min, 13%–15% B; 10–11 min, 15%–18% B; 11–15 min, 18%–30% B; 15–17 min, 30%–45% B; 17–22 min, 45%–95% B; 22–27 min, 95%–5% B. The post run time was 5 min. The injection was 5 µl. The related Q-TOF/MS parameters were listed as follows: drying gas, N2; gas flow rate, 11 L/min; drying gas temperature, 330◦C; nebulizer gas pressure, 40 psig; capillary voltage, 3500 V; fragmentor voltage, 120 V; skimmer voltage, 65 V; octopole RF, 750 V; collision energy (CE), 20 and 30 V. The scan range of mass spectra was m/z 100 – 1,500.
UHPLC-PDA Analysis
The quantitative analysis was carried out by the Waters Acquity UHPLC instrument (Waters Corp., Milford, MA, USA) using with PDA. The chromatography column, mobile phase and flow rate setting were as same as UPLC-Q-TOF/MS method. The column temperature was 40°C. The gradient elution program was set as: 0–2.5 min, 5%–10% B; 2.5–5.5 min, 10%–11% B; 5.5–6 min, 11%–12% B; 6–10 min, 12%–15% B; 10–13 min, 15%–17% B; 13–14 min, 17%–25% B; 14–15 min, 25%–5% B. The post run was 3 min. The optimal absorbed wavelengths were respectively 240 nm for geniposidic acid, geniposide, genipin, and pinoresinol di-o-glucopyranoside; 227 nm for syringaresinol di-o-glucopyranoside; and 327 nm for neochlorogenic acid, chlorogenic acid, caffeic acid, isochlorogenic acid A, and isochlorogenic acid C. In order to make the quantitative analysis more convenient, the multiwavelengths switch method was employed and was set as follows: 1.20–2.15 min, 240–327 nm; 2.15–4.50 min, 327–240 nm; 4.50–7.15 min, 240–227 nm; 7.15–10 min, 227–327; 10–12.24 min, 327–227 nm; 12.24–13.00 min, 227–327 nm. The injection volume was 3 µl.
Qualitative Analysis Method
Six types of compounds in Eucommiae Cortex have been summarized on the basis of the literatures, including lignans, phenylpropanoids, iridoids, phenolic acids, and others. The chemical formula and name of all the compounds collected were imported into an excel file and saved as the.csv form. Then the in-house compounds library of Eucommiae Cortex had been completed and was used to quickly found out the compounds of interest from the massive raw MS2 data by the function “find by formula” on the Agilent MassHunter Qualitative Workstation Analysis B.07.00 (Agilent Technologies Inc., Santa Clara, CA, USA). At last, the in-depth identification was performed by matching real MS, MS2 data from the EIC (extraction ion chromatography) with the related information in the literatures, especially, the characteristic ions and fragment pattern.
Method Validation
UHPLC-Q-TOF/MS Acquisition Method Validation
The precision, repeatability, and stability were investigated to validate the applicability of UHPLC-Q-TOF/MS method by using the QC samples. All sample solutions were mixed in a certain volume to prepare for the QC sample. The six independent QC samples were subject to UHPLC-Q-TOF/MS analysis within one day and three continuous days for evaluating the precision. The same QC sample was injected six times to assess the repeatability of acquisition method. The stability was conducted by analyzing response intensity of the target analytes in the QC samples at 0, 2, 4, 6, 8, 12, and 24 h. All the above validation results were presented as the relative standard deviation (RSD).
UHPLC-PDA Quantitative Method Validation
The mixed standard stock solution was stepwise diluted into the different working concentrations required by each calibration curve. Calibration curves required was plotted with the peak area as X-axis and the concentrations of target compounds as Y-axis, respectively. The mixed standard solution containing 11 analytes was gradually diluted into the concentrations where the ratio of signal to noise (S/N) was detected as 3 and 10, respectively. These mixed standard solutions were then used to evaluate the limits of detection (LOD) and limits of quantification (LOQ). The precision and accuracy of intra- and interday were analyzed by calculating the RSD values of the mixed standard solutions with three different concentrations (low, medium, and high). The repeatability of UHPLC-PDA quantitative method was evaluated by extraction and analysis of the target compounds in six independent samples. The sample solutions were repeatedly injected six times to explore stability at 0, 2, 4, 6, 8, 10, 12, and 24 h in room temperature (28°C), respectively. The recovery experiment was conducted by adding the certain quantity of 11 standards mixture to the samples and the results were assessed by recovery rate (%).
Data Analysis
Firstly, all the raw data acquired in (-)-ESI mode were introduced to the R software (R Foundation for Statistical Computing, Vienna, Austria) where all mz values detected would be normalized. Secondly, a mass of above metabolomics data was used for the orthogonal partial least-squares discriminant analysis (OPLS-DA) by the Simca-P (version 14.1, Umetrics, Umea, Sweden) in order to initially filter the candidate compounds. Thirdly, the accuracy of CdQMs was validated by PLSR and RF algorithms on Matlab R2015B (Mathworks, Natick, USA). At last, the discriminant function was used to evaluate the applicability of filtered CdQM and predict the types of unknown Eucommiae Cortex products by SPSS 17.0 (SPSS, Chicago, IL, USA).
Results and Discussion
UHPLC-Q-TOF/MS Acquisition Method Validation
The retention times (Rt), mass to charge ratios (m/z), and peak areas of 11 CdQMs were employed to calculate the RSD values, which were regarded as the important assessment indicator of precision, repeatability, and stability. It was acceptable that the RSD values were no more than 5%. The RSD values of intra- and interday precisions were all below 3.46%, which displayed a high accuracy of Rt, m/z, and peak areas of target ions in the process of multiple samples analysis by the UHPLC-Q-TOF/MS method. Moreover, the repeatability with the RSDs ranging from 0.00% to 3.86% showed good consistency of results detected by UHPLC-Q-TOF/MS. Finally, the RSDs indicative of stability were within 0.00%–3.30%, demonstrating that sample solutions was enough stable for qualitative detection in 24 h. In conclusion, all the above results (Table S1) indicated that this UHPLC-Q-TOF/MS method was applicable and reliable for acquiring the metabolomics data.
Compound Identification in Crude Eucommiae Cortex
Acquisition of Chemical Compounds Information
The identification of chemical compounds was essential for filtering the candidate markers in the following study. The whole chemical profile of Eucommiae Cortex was acquired in the negative ESI mode. In general, the qualitative analysis was time-consuming and labor-intensive due to the massive MS1 and MS2 data. However, we built the in-house library for the targeted identification, which could rapidly search the known compounds from complex mass spectra data. A total of 72 candidate compounds (Table S2) were initially extracted from the MS/MS spectra data. The same compound might hit for several times, whereas the hitting peaks appeared at different retention times. These peaks possibly represented isomers. Therefore, 72 candidate compounds need to be further identified by matching the accuracy MS data (error <5 ppm), key characteristic ions, and chromatographic elution order with that in the literatures to exclude the false positive results. Finally, 67 compounds (Table 1 and Figure 1) in Eucommiae Cortex were tentatively identified, containing 31 lignans, 10 iridoids, 10 phenylpropanoids, 6 organic acids, 10 other compounds.
Table 1
| Cpd no. | Rt (min) | Formula | [M-H]- | [M+COOH]- | MS/MS(-) | Δppm | Identification | References | |
|---|---|---|---|---|---|---|---|---|---|
| 1 | 1.178 | C6H8O7 | 191.0196 | 111.0076, 129.0178, 154.9993, 173.0085 | 3.26 | Isocitric acid | Others | He et al., 2018; Lei et al., 2018 | |
| 2 | 1.45 | C15H22O9 | 391.1231 | 101.0243, 111.0064, 147.0446, 165.0551, 183.0652 | 4.29 | Aucubin | Iridoids | Allen et al., 2015; He et al., 2018; Jiang et al, 2019 | |
| 3 | 1.534 | C16H22O11 | 389.1090 | 113.0245, 119.0368, 139.0394, 147.0427, 165.0552, 183.0658, 209.0448, 227.0539 | 0.47 | Deacetylasperulosidic acid | Iridoids | He et al., 2018 | |
| 4 | 2.077 | C13H16O9 | 315.0714 | 108.0195, 153.0159 | 2.39 | Protocatechuicacid-4-glucoside | Phenylpropanoids | He et al., 2018 | |
| 5 | 2.194 | C15H20O12S | 423.0598 | 119.0497, 163.0396, 199.0068, 215.0008, 242.9988, 261.008, 303.1024 | 1.11 | 6-(4-Formyl-2,6- dimethoxyphenoxy)-3,4,5- trihydroxytetrahydro-2H-pyran-2-yl) methyl hydrogen sulfate | Others | He et al., 2018 | |
| 6 | 2.212 | C14H18O9 | 329.0873 | 123.0443, 152.011, 167.0342 | 1.53 | 2-Glucopyranosyloxy-5- hydroxyphenyl acetic acid | Organic acids | He et al., 2018 | |
| 7 | 2.28 | C8H8O4 | 167.0341 | 108.02303, 123.0413, 152.0104 | 0.80 | Vanillic acid | Organic acids | Lei et al., 2018 | |
| 8 | 2.348 | C16H22O10 | 373.1125 | 101.0242, 123.0447, 147.0431, 149.0602, 167.0704, 193.0497, 211.0606 | 3.97 | Geniposidic acid | Iridoids | Allen et al., 2015; He et al., 2018; Jiang et al., 2019 | |
| 9 | 2.534 | C7H6O4 | 153.0186 | 109.0293 | 4.78 | 3,4-Dihydroxy benzoic acid | Organic acids | He et al., 2018; Jia et al., 2019 | |
| 10 | 2.753 | C15H20O10 | 359.0981 | 123.0087, 138.032, 153.05331, 166.9983, 182.0214, 197.0444 | 0.75 | 4-Glucopyranosyloxy-3,5- dimethoxy benzoic acid | Organic acids | He et al., 2018; Jia et al., 2019 | |
| 11 | 2.874 | C16H18O9 | 353.0883 | 135.0451, 161.025, 173.0453, 179.0341, 191.0557 | -1.40 | Neochlorogenic acid | Phenylpropanoids | Allen et al., 2015; He et al., 2018 | |
| 12 | 3.008 | C15H24O10 | 363.1281 | 101.0246, 105.0191, 123.0445, 147.0295 | 4.31 | Harpagide | Iridoids | He et al., 2018 | |
| 13 | 3.484 | C13H24O9 | 323.1336 | 101.0235, 113.0237, 119.0344, 131.0352, 143.0386, | 3.63 | Periplobiose | Others | He et al., 2018; Jia et al., 2019 | |
| 14 | 3.568 | C7H6O3 | 137.0241 | 108.0218, 109.0282, 119.0153, 136.0158 | 2.30 | 3-Hydroxybenzoic acid | Others | He et al., 2018; Jia et al., 2019 | |
| 15 | 3.702 | C22H28O14 | 515.1398 | 179.0351, 191.0555, 323.0786 | 1.61 | cis 5-o-(3' -o-caffeoyl glucosyl) quinic acid | Phenylpropanoids | He et al., 2018; Jia et al., 2019 | |
| 16 | 4.109 | C32H44O17 | 745.2532 | 179.0706, 195.0657, 327.1237, 345.1349, 357.1306, 375.1444, 537.1926 | 4.07 | Olivil 4' ,4”-di-o- glucopyranoside | Lignans | He et al., 2018; Jiang et al., 2019 | |
| 17 | 4.16 | C16H18O9 | 353.0883 | 135.0446, 155.0341, 161.0239, 173.0448, 179.0344, 191.0559 | -1.40 | Chlorogenic acid | Phenylpropanoids | Allen et al., 2015; He et al., 2018; Jia et al., 2019 | |
| 18 | 4.492 | C16H18O9 | 353.0876 | 135.0440, 155.0351, 161.0225, 173.0444, 179.0340, 191.0554 | 0.58 | Cryptochlorogenic acid | Phenylpropanoids | Allen et al., 2015; He et al., 2018 | |
| 19 | 4.636 | C9H8O4 | 179.0355 | 109.0308, 117.0338, 134.0364, 135.0446 | -2.88 | Caffeic acid | Phenylpropanoids | Zhang et al., 2016; He et al., 2018 | |
| 20 | 5.132 | C17H22O10 | 385.1136 | 101.0239, 123.0465, 177.0550 | 1.09 | 4-[3-Glucopyranosyloxy-2- hydroxyphenyl]-3-methyl-4- oxobutanoic acid | Organic acids | He et al., 2018 | |
| 21 | 5.465 | C18H26O10 | 447.1501 | 101.0242, 111.0083, 134.0326, 149.0487, 161.0453, 233.0655, 251.0941, 269.1011 | 1.99 | 4-[2-(Xylopyranosyloxy)ethyl] phenylxylopyranoside | Others | He et al., 2018 | |
| 22 | 5.742 | C16H18O8 | 337.0933 | 161.0239, 163.0398, 191.0555 | -1.21 | 3-p-coumaroylquinic acid | Phenylpropanoids | He et al., 2018 | |
| 23 | 5.929 | C17H24O10 | 433.1341 | 101.0244, 105.0323, 123.0450, 147.0401, 207.0657, 225.0768 | -2.70 | Geniposide | Iridoids | He et al., 2018; Jia et al., 2019 | |
| 24 | 6.07 | C26H34O12 | 537.1956 | 151.0352, 297.1106, 312.1036, 327.1236, 345.1367, 357.1324 | 3.99 | Olivil 4' -o-glucopyranoside | Lignans | He et al., 2018; Jiang et al., 2019 | |
| 25 | 6.552 | C32H42O17 | 697.2336 | 373.1291, 535.1812 | 1.90 | l-Hydroxypinoresinol di-o- glucopyranoside | Lignans | He et al., 2018 | |
| 26 | 6.62 | C33H44O19 | 743.2380 | 343.1179, 373.1286, 535.1886 | 3.23 | Naringin DHC 4-o- β -d- glucopyranoside | Others | He et al., 2018; Jia et al., 2019 | |
| 27 | 7.62 | C11H14O5 | 225.0767 | 101.0244, 105.0347, 119.0500, 123.0445, 147.0444, 207.0663 | 0.65 | Genipin | Iridoids | Allen et al., 2015; Zhang et al., 2016; He et al., 2018 | |
| 28 | 7.907 | C26H34O12 | 537.1956 | 151.0354, 195.0659, 297.1106, 327.1200, 375.1403 | 3.99 | Olivil 4”-o-glucopyranoside | Lignans | He et al., 2018 | |
| 29 | 8.162 | C32H42O16 | 681.2373 | 136.0165, 151.0395, 175.076, 327.1279, 342.1108, 357.1350, 519.1824 | 3.97 | Pinoresinol di-o- glucopyranoside | Lignans | Brenes et al., 2000; Feng et al., 2007 | |
| 30 | 8.705 | C32H42O16 | 681.2376 | 179.0536, 339.1248, 01.1789, 219.1864 | 3.97 | Dehydrodiconiferyl 4,γ ‘-o- glucopyranoside | Lignans | He et al., 2018 | |
| 31 | 8.974 | C17H20O9 | 367.1028 | 134.0366, 173.0422, 191.0551 | 1.78 | 5-o-feruloylquinic acid | Phenylpropanoids | He et al., 2018; Jia et al., 2019 | |
| 32 | 9.112 | C23H26O13 | 509.1295 | 123.0442, 153.0181, 182.0212, 197.0451, 211.0608, 297.0624, 311.0764 | 1.11 | 4,8,9,10-tetrahydroxy-3,6,7-trimethoxy-2-anthryl-glucopyranoside | Organic acids | He et al., 2018; Jia et al., 2019 | |
| 33 | 9.196 | C33H46O18 | 729.2584 | 165.0553, 491.1922, 503.1920, 521.2033 | 3.75 | 3-[4-(2-[4-Glucopyranosyloxy- 3-methoxyphenyl)-2−hydroxy- 1-(hydroxymethyl) ethoxy]- 3,5−dimethoxyphenyl]-2- propen-1-ylglucopyranoside | Others | He et al., 2018 | |
| 34 | 9.315 | C33H44O17 | 711.2487 | 387.1447, 549.1960 | 2.63 | Medioresinol di-o- glucopyranoside | Lignans | He et al., 2018 | |
| 35 | 9.738 | C26H32O12 | 535.1800 | 181.0499, 269.0827, 298.082, 313.1096, 325.1005, 343.1183, 358.1068 | 3.92 | l-Hydroxypinoresinol 4'-o- glucopyranoside | Lignans | He et al., 2018; Jiang et al., 2019 | |
| 36 | 10.196 | C26H32O12 | 535.1800 | 151.0419, 181.0494, 298.0839, 313.1062, 343.1171, 373.1294 | 3.92 | l-Hydroxypinoresinol 4”-o- glucopyranoside | Lignans | He et al., 2018; Jiang et al., 2019 | |
| 37 | 10.281 | C34H46O18 | 741.2593 | 166.0294, 181.0491, 357.1347, 371.1440, 402.1312, 417.1552 | 2.48 | Syringaresinol di-o- glucopyranoside | Lignans | Chai et al., 2012; He et al., 2018 | |
| 38 | 10.671 | C10H18O5 | 217.1078 | 123.0758, 127.0724, 137.0953, 155.1075, 171.1015, 199.0947 | 1.59 | Epieucommiol | Iridoids | He et al., 2018; Jiang et al., 2019; Jia et al., 2019 | |
| 39 | 11.838 | C23H26O13 | 509.1292 | 123.0445, 152.0115, 167.0340, 183.0297, 197.0455, 327.0710 | 1.69 | 4-{[6-o-(4-hydroxy-3,5- dimethoxybenzoyl)- glucopyranosyl]oxy}-3- methoxybenzoic acid | Others | He et al., 2018 | |
| 40 | 12.094 | C25H31NO11 | 520.1811 | 101.0248, 147.0446 | 2.56 | Eucomoside B | Iridoids | Allen et al., 2015; He et al., 2018 | |
| 41 | 12.705 | C25H24O12 | 515.1189 | 135.0444, 155.0355, 161.0245, 173.0450, 179.0346, 191.0552, 335.0780, 353.0865 | 1.16 | Isochlorogenic acid A | Phenylpropanoids | He et al., 2018; Jia et al., 2019 | |
| 42 | 12.774 | C20H22O7 | 373.1291 | 150.0317, 162.0331, 165.0543, 177.0525, 180.0418 | 0.47 | Erythro-guaiacylglycerol-β - conifery aldehyde ether | Lignans | He et al., 2018 | |
| 43 | 12.79 | C43H56O21 | 907.3220 | 165.0550, 195.0678, 357.1308, 387.1445, 535.1994, 565.2034, 745.2721, 861.2972 | 2.35 | Hedyotol C di-o- glucopyranoside | Lignans | He et al., 2018; Jiang et al., 2019 | |
| 44 | 12.858 | C43H54O22 | 921.3000 | 341.0882, 417.1579, 759.2532 | 3.68 | Unknown | Lignans | He et al., 2018 | |
| 45 | 12.991 | C20H22O6 | 357.1342 | 136.0155, 175.0727, 297.1164, 311.1266, 327.0943 | 0.45 | Pinoresinol | Lignans | Brenes et al., 2000 | |
| 46 | 12.994 | C26H32O11 | 519.1862 | 136.0160, 151.0396, 175.0754, 297.1131, 311.1287, 357.1348 | 1.89 | Pinoresinol-o-glucopyranoside | Lignans | Qi et al., 2019 | |
| 47 | 13.059 | C27H34O12 | 549.1978 | 136.0154, 166.0269, 181.0505, 372.1212, 387.1451 | -0.45 | Medioresinol 4”-o- β-d- glucopyranoside | Lignans | He et al., 2018; Jiang et al., 2019 | |
| 48 | 13.113 | C9H16O4 | 187.0972 | 123.0813, 143.1073, 169.0864 | 2.03 | Eucommiol | Iridoids | He et al., 2018; Jiang et al., 2019; Jia et al., 2019 | |
| 49 | 13.333 | C44H58O22 | 937.3316 | 387.1405, 891.2881 | 3.30 | Glycerol-syringaresinol ether di-glucopyranoside | Lignans | He et al., 2018 | |
| 50 | 13.516 | C28H36O13 | 579.2027 | 151.0031, 166.0262, 181.0499, 402.1316, 417.1558 | 1.92 | Syringaresinol 4'-o- glucopyranoside | Lignans | He et al., 2018; Qi et al., 2019 | |
| 51 | 13.604 | C27H34O12 | 549.1978 | 151.0398, 181.0498, 372.1203, 387.1439, 150.0335 | -4.09 | Eucommin A | Lignans | He et al., 2018; Qi et al., 2019 | |
| 52 | 13.859 | C20H22O7 | 373.1278 | 162.0344, 165.0574 | 3.95 | Threo-guaiacylglyc erol-β conifery aldehyde ether | Lignans | He et al., 2018 | |
| 53 | 13.875 | C25H24O12 | 515.1189 | 135.0442, 155.0344, 161.0224, 173.0448, 179.0342, 191.0557, 335.0774, 353.0874 | 1.16 | Isochlorogenic acid C | Phenylpropanoids | He et al., 2018; Jia et al., 2019 | |
| 54 | 14.063 | C42H52O21 | 891.2918 | 167.0396, 311.0770, 387.1431, 417.1552 | 1.16 | Syringaresinol vanillic acid ether diglucopyranoside | Lignans | He et al., 2018; Jia et al., 2019 | |
| 55 | 14.195 | C40H48O19 | 831.2689 | 167.0379, 311.0753, 343.1194, 519.1846, 669.2187 | 3.37 | Pinoresinol vanillic acid ether | Lignans | He et al., 2018; Jia et al., 2019 | |
| 56 | 14.264 | C15H26O7 | 317.1601 | 163.1155, 181.1225, 199.1346, 207.1019, 225.1139, 243.1235 | 1.50 | diglucopyranoside 2-(5-Hydroxy-2,3-dimethyl-2- cyclopenten-1- yl)ethylglucopyranoside | Others | He et al., 2018 | |
| 57 | 14.265 | C41H50O20 | 861.2794 | 151.0400, 311.0760, 357.1375, 387.1440, 699.2325 | 3.33 | Medioresinol vanillic acid ether diglucopyranoside | Lignans | He et al., 2018; Jia et al., 2019 | |
| 58 | 14.334 | C20H22O7 | 373.1295 | 136.0157, 181.0514, 188.0471, 269.0825, 285.1125, 298.0855, 313.1083, 358.1049 | -0.60 | 1-Hydroxypinoresinol | Lignans | Pi et al., 2016; He et al., 2018; Jiang et al., 2019 | |
| 59 | 14.398 | C21H24O7 | 433.1499 | 166.0253, 181.0472 | 1.30 | Medioresinol | Lignans | He et al.,2018; Jia et al.,2019 | |
| 60 | 14.401 | C40H48O19 | 831.2686 | 167.0336, 311.0764, 343.1177 | 3.75 | Pinoresinol vanillic acid ether di-o-glucoside isomer | Lignans | He et al., 2018; Jiang et al., 2019 | |
| 61 | 14.604 | C37H46O16 | 745.2690 | 151.0388, 165.0550, 181.0477, 195.0643, 341.0859, 357.1361, 387.1446, 535.1957, 583.2191 | 3.09 | Glycerol-medioresinol ether 4”- glucopyranoside | Lignans | He et al., 2018; Jiang et al., 2019; Jia et al., 2019 | |
| 62 | 15.094 | C37H46O16 | 745.2688 | 165.0549, 181.0494, 195.0654, 357.1359, 387.1438, 505.1856, 535.1964, 583.2174 | -4.51 | Glycerol-medioresinol ether 4”'−glucopyranoside | Lignans | He et al.,2018; Jiang et al., 2019; Jia et al., 2019 | |
| 63 | 16.3 | C36H42O16 | 729.2393 | 167.0367, 181.0493, 311.0771, 341.0870, 387.1440, 403.1367, 417.1560 | 0.38 | Syringaresinol vanillic acid ether glucopyranoside | Lignans | He et al., 2018 | |
| 64 | 16.383 | C35H40O15 | 699.2292 | 151.0388, 167.0342, 197.0446, 311.0778, 341.0881, 357.1340, 387.1440 | 0.35 | Medioresinol vanillic acid ether glucopyranoside | Lignans | He et al., 2018; Jiang et al., 2019; Jia et al., 2019 | |
| 65 | 16.586 | C34H38O14 | 669.2182 | 167.0352, 311.0772, 327.1228, 343.1191, 357.1316 | 1.01 | Pinoresinol vanillic acid ether glucopyranoside | Lignans | He et al., 2018; Jia et al., 2019 | |
| 66 | 16.638 | C9H16O3 | 171.1023 | 153.0902 | 0.35 | 1-Deoxyeucommiol | Iridoids | He et al., 2018 | |
| 67 | 17.873 | C12H20O4 | 227.1281 | 143.8607, 165.1225 | 3.43 | 5,6,7,8-tetrahydro-7-hydroxy-3,3- dimethyl-1H-cyclopenta[1,3]dioxepin-6-ethanol | Others | He et al., 2018 |
The identification of constituents of crude Eucommiae Cortex extract by UHPLC-Q-TOF/MS in negative ion mode.
Figure 1
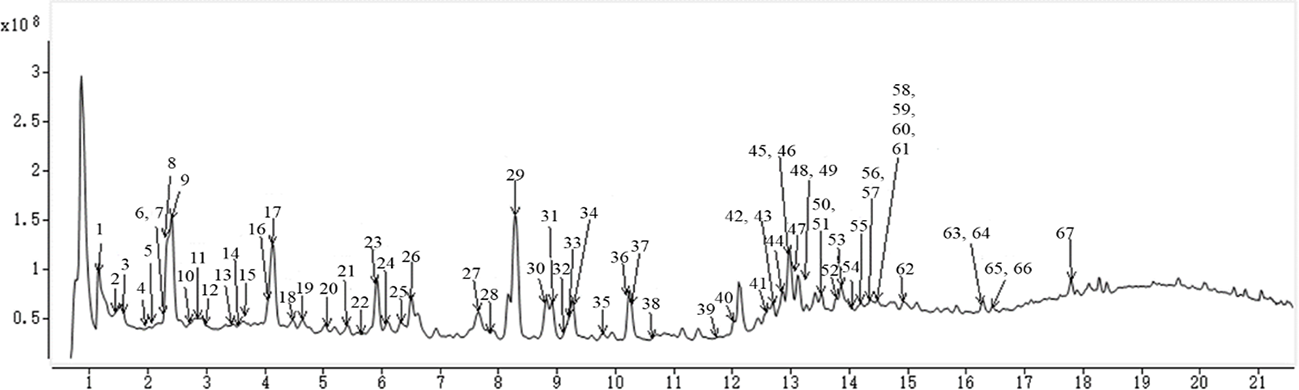
The total ion chromatograms of Eucommiae Cortex by ultra-high performance liquid chromatography coupled with mass spectrometry (UHPLC-Q-TOF/MS) in negative ion mode.
Identification of Lignans
Lignans and their derivatives were a main class of secondary metabolites in Eucommiae Cortex, and display various bioactivities in vivo or in vitro (Deyama, 1983; Shi et al., 2013). In this work, 31 lignans have been tentatively characterized, including compounds 16, 24-25, 28-30, 34-37, 42-47, 49-52, 54, 55, 57-65 (Brenes et al., 2000; Guo et al., 2007; Feng et al., 2007; Chai et al., 2012; Pi et al., 2016; He et al., 2018; Jia et al., 2019; Jiang et al., 2019; Qi et al., 2019). The most lignans in Eucommiae Cortex are phenylpropanoid dimers with one or two glucose units, which means a few of the MS2 fragments followed by the loss of glucose neutral moiety. Moreover, the MS2 spectrum of lignans showed several key characteristic ions at m/z 327, 311, 181, and 150, which were mainly attributed to cleavage of the tetrahydrofuran ring and losses of CH3, CH2O, CO, CH3O, and CH3OH (Guo et al., 2007; Jiang et al., 2019). Take several compounds for examples to illustrate the qualitative process. The quasi-molecular ion [M-H]- of compound 29 at m/z 681 corresponded to the formula C32H42O16. Its MS2 fragmental ions at m/z 519 and m/z 357 were observed due to the loss of 1 and 2 glucose groups, respectively, and MS2 ion at m/z 151 was generated by the cleavage of tetrahydrofuran-ring. The compound 29 was thereof identified as pinoresinol di-o-glucopyranoside (Brenes et al., 2000; Feng et al., 2007). The parent ion [C20H22O6-H]- of compound 45 at m/z 357 firstly was converted into the characteristic ion at m/z 327 due to the cleavage of tetrahydrofuran-ring. Moreover, another characteristic ion at m/z 311 was also observed owing to the loss of CH3 (15 Da) from the ion at m/z 327. Thus, the compound 45 was tentatively identified as pinoresinol (Brenes et al., 2000). As to the compound 46, its parent ion [C26H32O11-H]- at m/z 591 was lower 162 Da than that of compound 29. Additionally, it shared the similar characteristic ions to compound 29 at m/z 311, 297. Finally, compound 46 was rapidly identified as pinoresinol-o-glucopyranoside (Qi et al., 2019). The compounds 42 and 52 with [M-H]- ion at m/z 373 had another characteristic ion at m/z 165 and further produced ion with m/z 150 by the loss of CH3. Compared the real retention behavior with that in the reported literatures (He et al., 2018), compounds 42 and 52 were tentatively identified as erythro-guaiacylglycerol-β-conifery aldehyde ether and threo-guaiacylglycerol-β-conifery aldehyde ether, respectively. Although several lignans such as compounds 25, 30, 34, 43, 44, and 49 could not be found based on the characteristic ions, they were also tentatively identified by comparing with the precise parent ions (error below 5 ppm), MS2 fragment ions and the retention behavior with the data obtained in literatures (He et al., 2018; Jiang et al., 2019).
Identification of Phenylpropanoids
The phenylpropanoids in Eucommiae Cortex were divided into the simple phenylpropanoids and polyol phenylpropanoids, that is, caffeoyl quinic acids. In general, the caffeoyl quinic acids were more prone to produce [caffeoyl]- ion peak at m/z 179 or/and [quinine]- ion peak at m/z 191 (Ouyang et al., 2017; He et al., 2018; Jiang et al., 2019). The MS2 ion peak at m/z 173 appeared because one molecule H2O was separated from the precursor ion at m/z 191 (Özgen et al., 2009; He et al., 2018; Jiang et al., 2019). Thus, the characteristic diagnosis ion at 191, 179, and/or 173 were used for rapid identification of compounds 11, 15, 17, 18, 22, 31, 41, and 53. Compounds 11, 17, and 18 exhibited the same molecular ion [M-H]- at m/z 353 and also shared the product ions at m/z 161 and 135 attributed to the loss of one molecular H2O (18 Da) and CO2 (44 Da) from the [caffeoyl]- ion at m/z 179. According to the information reported, compounds 11, 17, and 18 were tentatively speculated as neochlorogenic acid, chlorogenic acid, and cryptochlorogenic acid (Allen et al., 2015; He et al., 2018; Jia et al., 2019), respectively. The cleavage pattern of isomers 41 and 53 were basically consistent with chlorogenic acid isomers. Therefore, it was inferred that compounds 41 and 53 were isochlorogenic acid A and C (He et al., 2018; Jia et al., 2019), respectively. In addition, the simple phenylpropanoids (compounds 4 and 19) in Eucommiae Cortex were cleaved in the different way. The [M−H]- ion of compound 19 (caffeic acid) at m/z 179 produced an [M-H-CO2]- ion at m/z 135 and an [M-H-CO2-H2O]- ion at m/z 117. However, the product ion [M-H-Glc]- of compound 4 (protocatechuicacid-4-glucoside) at m/z 153 eliminated the neutral group CO2 to yield the ion at m/z 108 (Zhang et al., 2016; He et al., 2018).
Identification of Iridoids
A total of 10 iridoids were identified in this work, including compounds 2, 3, 8, 12, 23, 27, 38, 40, 48, and 66 (Özgen et al., 2009; Allen et al., 2015; Pi et al., 2016; He et al., 2018; Hsueh and Tsai, 2018; Jiang et al., 2019). The most iridoid glycosides were inclining to get aglycon ion due to eliminate glucose neutral group (162 Da). For example, compounds 2, 3, 8, and 23 yielded [M-H-Glc]- ion at m/z 183, 227, 211 and 225 (Allen et al., 2015; He et al., 2018; Jia et al., 2019; Jiang et al., 2019). As reported in the literatures (He et al., 2018; Jiang et al., 2019), the characteristic ions of iridoids were at m/z 101, 119 and/or 147. The identified iridoids except for 38 48, and 66 showed the characteristic diagnosis ions at m/z 101 and m/z 147 (He et al., 2018). The characteristic ion at m/z 101 was indicative of a CH2OH group or CH3 and OH groups linked to the C-8 position. Another characteristic ion at m/z 147, was the consequence of successive elimination of glycosidic moiety or loss of H2O, CO2, HCOOH, and HCOOCH3 moiety. The compounds 38, 48, and 66 displayed (M-H)- ions at m/z 217, 187 and 171 corresponding to chemical formula C10H18O5, C9H16O4, and C9H16O3. Their MS2 ions peak at m/z 199, 169, and 153 were yielded by loss of H2O from the parent ion. Moreover, the other MS2 ions and retention behavior were consistent with that in the reported literatures (He et al., 2018; Jia et al., 2019). Thus, compounds 38, 48, and 66 were probably epieucommiol, eucommiol and 1-deoxyeucommiol.
Identification of Phenolic Acids
Compounds 6, 7, 9, 10, 20, and 32 (Table 1) were tentatively identified on the basis of the key ions at m/z 123 and 153 indicative of the core skeleton similar to derivatives of catechol and 3,4-dihydroxy benzoic acid (He et al., 2018; Lei et al., 2018; Jiang et al., 2019; Jia et al., 2019). Moreover, a few of common neutral fragments such as CH3, CO2, and glucosyl unit were also recognized as important identification features of phenolic acids. For example, the vanillic acid (compounds 7) lose the methyl radical (.CH3) and one molecule CO2 to get fragment ions at m/z 152 and m/z 108, respectively (Lei et al., 2018).
Identification of Other Compounds
As to other compounds (1, 5, 13, 14, 21, 26, 33, 39, 56, and 67), it was impossible to identify compounds base on the key characteristic ions due to the lack of detail information about shared structure. However, the compounds could be tentatively identified by comparing the experimental data with information of literatures, such as precise MS data and fragment ions (He et al., 2018; Jia et al., 2019; Jiang et al., 2019).
Metabolomics Data Analysis
Metabolomics analysis has good performance on screening the difference compounds in natural plant samples. Using the R package XCMS, all the raw mass spectra data of C1-C19 and S1-S19 samples, which were acquired from UHPLC-Q-TOF/MS-ESI-, was converted into a three-dimensional matrix including information of a mass of variables, such as retention times, m/z values, peak intensities. Then 2,843 variables were generated and were subjected to OPLS-DA analysis on the SIMIC software. OPLS-DA, a supervised multivariate data analysis method, was characterized by difference analysis of inter-groups. The OPLS-DA plot (Figure 2A) displayed the obvious separation between crude and salt-fired samples in the presence of 2,843 variables. However, 2,843 variables were not practical for distinction of two types of Eucommiae Cortex and even QC assessment. Thus OPLS-DA was further utilized to mine potential and obvious difference compounds based on the value of variable importance parameter (VIP) higher than 1, which was considered to greatly contribute to the separation of clustering. Then a total of 505 candidate compounds were rapidly filtered from 2,843 variables. It was shown (Figure 2B) that the crude and salt-fired Eucommiae Cortex was well distinguished by the 505 compounds as candidate markers.
Figure 2
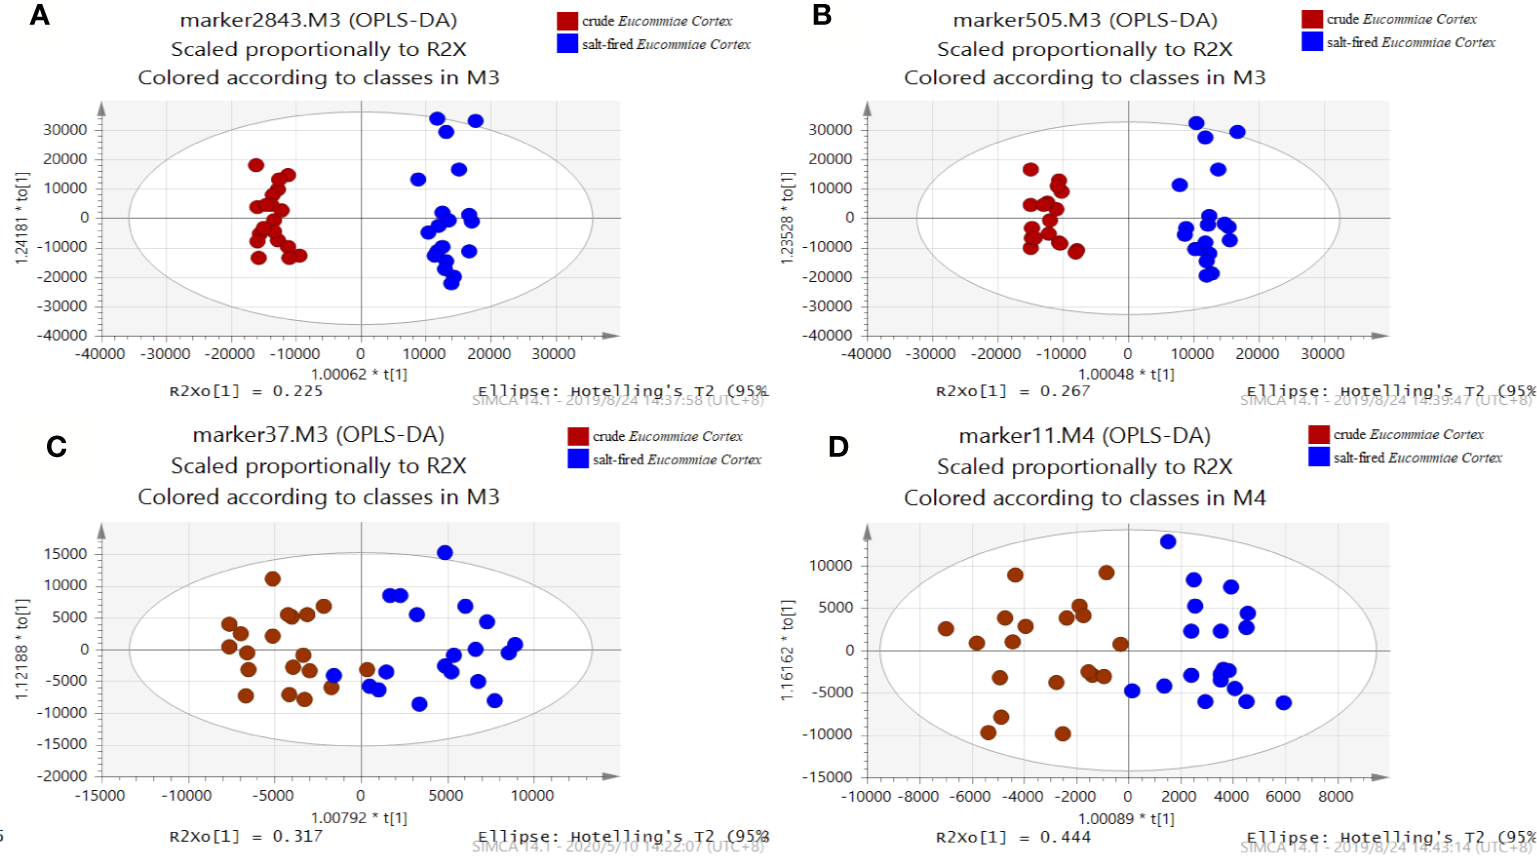
The orthogonal partial least-squares discriminant analysis (OPLS-DA) model for 38 samples of the crude and salt-fired Eucommiae Cortex by 2,843 variables (A), 505 variables (B), 37 variables (C), and 11 variables (D), respectively.
Identification of the Candidate Markers
The 505 candidate markers with the VIP >1 would be explicitly identified on the basis of qualitative study of compounds in Eucommiae Cortex. Thirty-seven compounds were rapidly identified from 505 candidate markers according to m/z values and retention time of the significant difference markers. They were respectively compounds 1, 2, 3, 5, 6, 8, 9, 10, 11, 14, 16, 17, 19, 21, 23, 25, 26, 27, 29, 33, 34, 37, 39, 40, 41, 43, 44, 46, 48, 49, 50, 53, 60, 63, 64, 65, and 66 (Table 1). The other unknown markers would continue to be identified. Moreover, OPLS-DA analysis results (Figure 2C) showed that two groups of Eucommiae Cortex samples were basically differentiated by the 37 candidate markers. It suggested that the filtered 37 compounds might be potential CdQMs as an alternative to the 505 candidate markers.
Selection and Verification of the Final CdQMs
Although the range of difference markers was limited to 37 CdQMs in Eucommiae Cortex by the analysis of OPLS-DA, it was still considerably difficult to simultaneously achieve the QC and effective distinction of the crude Eucommiae Cortex and its salt-fired product. Therefore, it was indeed necessary to further filter the practical CdQMs from the above 37 identified CdQMs. Then the CdQMs would be unambiguously defined according to the following characteristics: easy quantitation, commercial access, and the most importantly, good distinction ability to two types of Eucommiae Cortex products. Consequently, eleven compounds (geniposidic acid, neochlorogenic acid, chlorogenic acid, caffeic acid, geniposide, genipin, pinoresinol di-o-glucopyranoside, syringaresinol di-o-glucopyranoside, isochlorogenic acid A, and isochlorogenic acid C) were roughly selected as potential CdQMs based on the first two characteristics. The OPLS-DA analysis (Figure 2D) showed that 11 potential CdQMs could well separate the crude samples and salt-fired samples. However, the accuracy of the selected CdQMs needs to be further validated. Herein, two supervised learning model, the PLSR and RF, were implemented to determine the accuracy of the markers generated via each filtering steps. The batches of C1-10 and S1-10 were respectively set as training set of the crude group and the salt-fired group. The remaining batches (C11-19 of crude Eucommiae Cortex and S11-19 of salt-fired Eucommiae Cortex) were analyzed as testing set. In general, the training set was used to build a model, whereas the testing set was used to verify the established model and provide the accuracies of related variables. Finally, the PLSR and RF algorithms were employed to predict and classify the 38 batches of samples with the 2843, 505, 37, and 11 compounds as variables, respectively. The analysis results of algorithms (Table 2) showed the accuracies of 2,843, 505, and 11 variables were all more than 90%, whereas the accuracy of 37 variables were obviously lower than those of others. It demonstrated that the 37 compounds were not optimal candidate markers. Interestingly, the accuracy of 11 variables was equivalent to that of 505 variables, and even close to the accuracy of 2,843 variables. Therefore, the 11 compounds as CdQMs could be fully behalf of the whole compounds in Eucommiae Cortex for distinguishing the crude and salt-fired Eucommiae Cortex and were used for quality evaluation of two-types of Eucommiae Cortex products.
Table 2
| Algorithms | Different amounts of variables | |||
|---|---|---|---|---|
| 2843 | 505 | 38 | 11 | |
| PLSR | 100% | 100% | 66.7% | 94.1% |
| RF | 100% | 100% | 83.3% | 94.1% |
The accuracies of different variables by PLSR and RF Algorithms.
UHPLC-PDA Quantitative Method Validation
To validate the UHPLC-PDA method, the selectivity, linearity, LOD and LOQ, repeatability, accuracies and precisions, stability, and recoveries should be investigated and the related data was well displayed (Tables S3 and S4). In contrast to the chromatogram of the 11 standard substances and blank solution, obvious interference was not observed in the chromatogram of extract solution (Figure 3), indicating that the analytical method had good selectivity for detection of 11 analytes. A total of 11 standard curve lines enabled to accurately determine the concentrations of target components within the analysis range due to the r2 values more than 0.9991. The range of LOQs and LODs for 11 CdQMs were from 0.03 to 1.00 µg/ml and 0.01 to 0.3 µg/ml, respectively. The detection method was much stable to determine multisamples due to the RSDs of repeatability below 5%. The intra-day and inter-day accuracies were the range of 88.2%–105% and the RSDs of the corresponding precisions were within 0.10%–4.69%. The results obviously validated the fact that this quantitative method could analyze accurately the samples in several days. The recoveries of this method for the 11 components ranged from 95.0% to 104% (Table S3), fully demonstrating the extremely little loss of target compounds in the extraction and sampling process. Overall, this developed UHPLC-PDA method was well fitting for the analysis of the 11 CdQMs in Eucommiae Cortex samples.
Figure 3
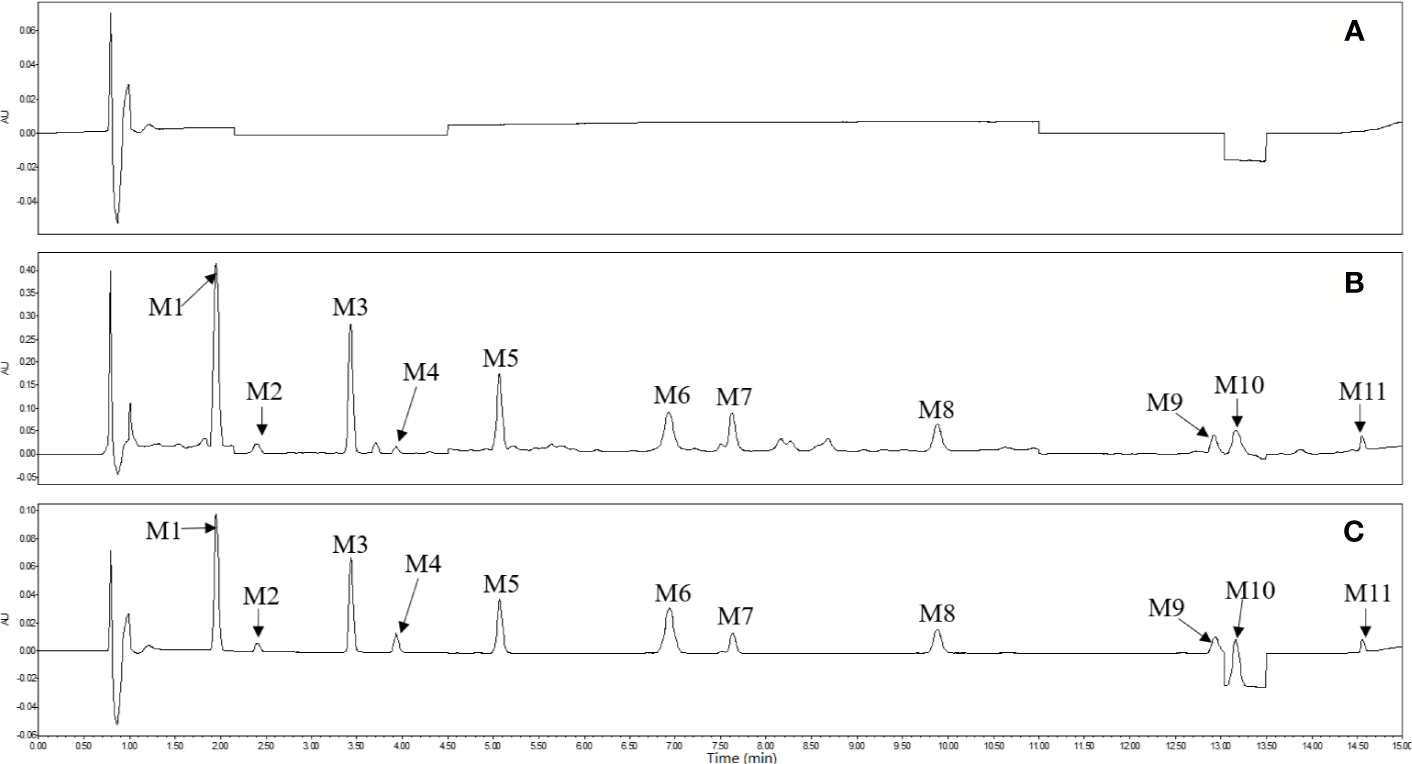
Ultra-high performance liquid chromatography (UHPLC) chromatograms of blank solvent solution (A), sample solution (B), and mixed standard solution (C). M1-11 represented geniposidic acid, neochlorogenic acid, chlorogenic acid, caffeic acid, geniposide, genipin, pinoresinol di-o-glucopyranoside, syringaresinol di-o-glucopyranoside, isochlorogenic acid A, pinoresinol o-glucopyranoside, and isochlorogenic acid C, respectively.
Analysis of Different Batches of Eucommiae Cortex samples
In order to exclude the influence of origin places on the selection of quality markers, 8 batches of the crude Eucommiae Cortex and their salt-fired products from Sichuan Province in China were analyzed using the same OPLS-DA strategy according to the same rules. The same eleven quality markers were also found and filtered. Although VIP values of eleven quality markers (Table S5) from the same origin place were different with those of samples from the different origin places, these eleven quality markers could divide these samples into two groups. One is the crude and the other is salt-fired group. This result was basically consistent with the real situation. Thus, the processing could change the chemical contents of 11 CdQMs in crude samples leading to the difference from the salt-fired samples. Based on the above analysis, eleven CdQMs were identified and regarded as the featured markers that could be alternative to the whole chemical compounds profile for differentiation of the crude and the salt-fired Eucommiae Cortex.
The validated UHPLC-PDA method was employed to simultaneously determine the content of the 11 CdQMs (geniposidic acid, neochlorogenic acid, chlorogenic acid, caffeic acid, geniposide, genipin, pinoresinol di-o-glucopyranoside, syringaresinol di-o-glucopyranoside, isochlorogenic acid A, pinoresinol o-glucopyranoside, and isochlorogenic acid C) in 54 batches of Eucommiae Cortex samples. Among them, the C1-C19 and VC1-VC8 batches were crude Eucommiae Cortex and remaining batches (S1-S19 and VS1-VS8) were salt-fired Eucommiae Cortex. Base on the average content of each marker (Table 3), the contents of nine markers (geniposidic acid, neochlorogenic acid, caffeic acid, geniposide, genipin, pinoresinol di-o-glucopyranoside, syringaresinol di-o-glucopyranoside, isochlorogenic acid A, and isochlorogenic acid C) were reduced while two markers (chlorogenic acid and pinoresinol o-glucopyranoside) were increased after crude Eucommiae Cortex samples were salt-fired. The possible reason was relation to the structure transformation of compounds such as oxidation, decomposition, isomerization in the salt-fired process (Wu et al., 2018). Moreover, these CdQMs had a variety of pharmacological activities such as antioxidant, anti-inflammatory, anti-cancer, anti-atherosclerosis, and anti-hypertension (Gao et al., 2015; Li et al., 2015; Liu et al., 2016; Wang J. et al., 2017; Ma et al., 2019; Xia et al., 2019). Thus, content fluctuation of these markers between the crude Eucommiae Cortex and its salt-fired product probably lead to change in bioactive effects. Because many factors could affect the content of chemical ingredients in Eucommiae Cortex, more in-depth research need to be carried out for clarifying the influence of processing on the multiple chemical ingredients of Eucommiae Cortex in the future.
Table 3
| Batches | Average content (μg/mg) | ||||||||||
|---|---|---|---|---|---|---|---|---|---|---|---|
| M1 | M2 | M3 | M4 | M5 | M6 | M7 | M8 | M9 | M10 | M11 | |
| C | 1.65 | 0.06 | 0.51 | 0.05 | 0.31 | 0.40 | 1.81 | 0.52 | 0.16 | 0.32 | 0.04 |
| S | 1.45 | 0.05 | 0.54 | 0.02 | 0.28 | 0.08 | 1.22 | 0.30 | 0.13 | 0.36 | 0.03 |
The average content of 11 CdQMs in different bathes of Eucommiae Cortex samples (μg/mg).
M1-11 represented geniposidic acid, neochlorogenic acid, chlorogenic acid, caffeic acid, geniposide, genipin, pinoresinol di-o-glucopyranoside, syringaresinol di-o- glucopyranoside, isochlorogenic acid A, pinoresinol o-glucopyranoside, and isochlorogenic acid C, respectively; C represented the crude Eucommiae Cortex group
(C1-C19 and VC1-VC8); S represented the salt-fired Eucommiae Cortex group (S1- S19 and VS1-VS8).
Discriminant Analysis
Discriminant analysis was characterized by predicting classification of the unknown sample. Discriminant analysis was used to determine whether the unknown samples are crude or salt-fired Eucommiae Cortex. The crude samples (C1-C19) and salt-fired samples (S1-S19) were labeled as group 1 and group 2 (Table 4), respectively. The contents of 11 CdQMs in these samples were used as modeling data to build the unstandardized canonical discriminant model by SPSS software. The samples (VC1-VC8 and VS1-VS8) were selected as testing sample. The discriminant function generated was showed as follows:
Table 4
| Batches | Actual groups | Predictive groups | Discriminant scores |
|---|---|---|---|
| C1 | 1 | 1 | 1.55389 |
| C2 | 1 | 1 | 0.34026 |
| C3 | 1 | 1 | 2.53401 |
| C4 | 1 | 2# | -0.56361 |
| C5 | 1 | 1 | 1.42251 |
| C6 | 1 | 1 | 1.35273 |
| C7 | 1 | 1 | 2.13122 |
| C8 | 1 | 1 | 1.04150 |
| C9 | 1 | 1 | 0.22947 |
| C10 | 1 | 1 | 0.02528 |
| C11 | 1 | 1 | 2.49143 |
| C12 | 1 | 1 | 1.80828 |
| C13 | 1 | 1 | 3.15104 |
| C14 | 1 | 1 | 0.44475 |
| C15 | 1 | 1 | 0.72497 |
| C16 | 1 | 1 | 2.80181 |
| C17 | 1 | 1 | 0.71904 |
| C18 | 1 | 1 | 1.33373 |
| C19 | 1 | 1 | 2.97135 |
| S1 | 2 | 2 | -1.73808 |
| S2 | 2 | 2 | -0.53112 |
| S3 | 2 | 2 | -1.16221 |
| S4 | 2 | 2 | -0.71001 |
| S5 | 2 | 2 | -0.45801 |
| S6 | 2 | 2 | -1.39650 |
| S7 | 2 | 2 | -1.94982 |
| S8 | 2 | 2 | -2.20743 |
| S9 | 2 | 2 | -1.21746 |
| S10 | 2 | 2 | -1.99632 |
| S11 | 2 | 2 | -1.10804 |
| S12 | 2 | 2 | -2.16652 |
| S13 | 2 | 2 | -0.07373 |
| S14 | 2 | 2 | -3.69995 |
| S15 | 2 | 2 | -0.25776 |
| S16 | 2 | 2 | -1.15230 |
| S17 | 2 | 2 | -0.71390 |
| S18 | 2 | 2 | -1.20901 |
| S19 | 2 | 2 | -2.76548 |
| VC1 | - | 1 | 0.54668 |
| VC2 | - | 1 | 1.73195 |
| VC3 | - | 1 | 1.58948 |
| VC4 | - | 1 | 1.96910 |
| VC5 | - | 1 | 1.16438 |
| VC6 | - | 1 | 1.64134 |
| VC7 | - | 1 | 3.28505 |
| VC8 | - | 1 | 0.39950 |
| VS1 | - | 2 | -0.08497 |
| VS2 | - | 2 | -0.46013 |
| VS3 | - | 2 | -0.68333 |
| VS4 | - | 2 | -0.07023 |
| VS5 | - | 2 | -1.09459 |
| VS6 | - | 2 | -3.20495 |
| VS7 | - | 1# | 1.26397 |
| VS8 | - | 2 | -0.07440 |
The classification results by discriminant analysis.
1, represented the crude Eucommiae Cortex group; 2, represented the salt-fired Eucommiae Cortex group; -, represented the unknown groups; #represented the incorrect classification.
where X1 to X11 represented the contents of geniposidic acid, neochlorogenic acid, chlorogenic acid, caffeic acid, geniposide, genipin, pinoresinol di-o-glucopyranoside, syringaresinol di-o-glucopyranoside, isochlorogenic acid A, pinoresinol o-glucopyranoside, and isochlorogenic acid C, respectively; the γ is the discriminant score. The classification accuracies of this model were 97.4% and 78.9% corresponding to originally grouped cases and cross-validation grouped cases, respectively. It demonstrated that the reliability of this discriminant model was acceptable. Discriminant score of each sample was calculated through the discriminant function. Two centroid values of crude Eucommiae Cortex and salt-fired Eucommiae Cortex group were respectively 1.395 and -1.395. Their sum was the discriminant value. If discriminant score of one sample was higher than 0, it would be classified into the crude Eucommiae Cortex group. Otherwise, they would belong to salt-fired Eucommiae Cortex. The results of predictive groups (Table 4) displayed that most of samples except for C4 in known groups were correctly classified. Only one unclassified sample (VS7) were not correctly predicted. These results demonstrated that simultaneous determination of 11 CdQMs coupled with discriminant analysis could well be used to differentiate the crude and salt-fired Eucommiae Cortex.
Conclusion
The CdQMs were screened for precise quality assessment of crude and salt-fired Eucommiae Cortex by LC-MS metabolomics with chemometrics strategy. An in-house component library of Eucommiae Cortex was built for rapid search of known compounds, which would make the qualitative analysis efficient and time-saving. Eleven CdQMs including geniposidic acid, neochlorogenic acid, chlorogenic acid, caffeic acid, geniposide, genipin, pinoresinol di-o-glucopyranoside, syringaresinol di-o-glucopyranoside, isochlorogenic acid A, pinoresinol o-glucopyranoside, and isochlorogenic acid C, were screened step by step and could well differentiate the crude and salt-fired Eucommiae Cortex. It was concluded that LC-MS metabolomics with chemometrics was a powerful strategy to filter CdQMs for distinguishing the crude and salt-fired Eucommiae Cortex. It would provide a reliable reference for the in-depth investigation of difference between the crude and salt-fired Eucommiae Cortex.
Statements
Data availability statement
All datasets generated for this study are included in the article/Supplementary Material.
Author contributions
Y-XC and XG designed the experiment. Y-XC and JG analyzed the experimental data. JG, JL, XY, HW, JH, and EL performed the experiment and wrote the manuscript.
Acknowledgments
This work was supported by Science and Technology Program of Tianjin (No.19ZYPTJC00060), Tianjin Research Program of Application Foundation and Advanced Technology (18JCYBJC95000), Special Program of Talents Development for Excellent Youth Scholars in Tianjin.
Conflict of interest
The authors declare that the research was conducted in the absence of any commercial or financial relationships that could be construed as a potential conflict of interest.
Supplementary material
The Supplementary Material for this article can be found online at: https://www.frontiersin.org/articles/10.3389/fphar.2020.00838/full#supplementary-material
References
1
ÖzgenU.KazazC.SecenH.Çalişİ.CoşkunM.HoughtonP. J. (2009). A novel naphthoquinone glycoside from Rubia peregrina L. Turk. J. Chem.33, 561–568. doi: 10.3906/kim-0806-28
2
AllenF.GreinerR.WishartD. (2015). Competitive fragmentation modeling of ESI-MS/MS spectra for putative metabolite identification. Metabolomics11, 98–110. doi: 10.1007/s11306-014-0676-4
3
AszykJ.BylińskiH.NamieśnikJ.Kot-WasikA. (2018). Main strategies, analytical trends and challenges in LC-MS and ambient mass spectrometry-based metabolomics. Trends Anal. Chem.108, 278–295. doi: 10.1016/j.trac.2018.09.010
4
BrenesM.HidalgoF. J.GarcíaA.RiosJ. J.GarcíaP.ZamoraR.et al. (2000). Pinoresinol and 1-acetoxypinoresinol, two new phenolic compounds identified in olive oil. J. Am. Oil Chem. Soc77, 715–720. doi: 10.1007/s11746-000-0115-4
5
ChaiX.WangY.SuY. F.BahA. J.HuL.GaoY.et al. (2012). A rapid ultra performance liquid chromatography–tandem mass spectrometric method for the qualitative and quantitative analysis of ten compounds in Eucommia ulmodies Oliv. J. Pharm. Biomed. Anal.57, 52–61. doi: 10.1016/j.jpba.2011.08.023
6
CronquistA.TakhtadzhianA. L. (1981). An integrated system of classification of flowering plants (New York: Columbia University Press).
7
DeyamaT. (1983). The constituents of Eucommia ulmoides OLIV. I. Isolation of (+)-Medioresinol Di-O-β-D-glucopyranoside. Chem. Pharm. Bull.31, 2993–2997. doi: 10.1248/cpb.31.2993
8
FengS.NiS.SunW. (2007). Preparative isolation and purification of the lignan pinoresinol diglucoside and liriodendrin from the bark of Eucommia ulmoides Oliv. by high speed countercurrent chromatography. J. Liq. Chromatogr. Relat. Technol.30, 135–145. doi: 10.1080/10826070601036324
9
GaoY.ChenZ. Y.LiangX.XieC.ChenY. F. (2015). Anti-atherosclerotic effect of geniposidic acid in a rabbit model and related cellular mechanisms. Pharm. Biol.53, 280–285. doi: 10.3109/13880209.2014.916310
10
GuoH.LiuA. H.YeM.YangM.GuoD. A. (2007). Characterization of phenolic compounds in the fruits of Forsythia suspensa by high-performance liquid chromatography coupled with electrospray ionization tandem mass spectrometry. Rapid Commun. Mass Spectrom.21, 715–729. doi: 10.1002/rcm.2875
11
HeX.WangJ.LiM.HaoD.YangY.ZhangC.et al. (2014). Eucommia ulmoides Oliv.: ethnopharmacology, phytochemistry and pharmacology of an important traditional Chinese medicine. J. Ethnopharmacol.151, 78–92. doi: 10.1016/j.jep.2013.11.023
12
HeM.JiaJ.LiJ.WuB.HuangW.LiuM.et al. (2018). Application of characteristic ion filtering with ultra-high performance liquid chromatography quadrupole time of flight tandem mass spectrometry for rapid detection and identification of chemical profiling in Eucommia ulmoides Oliv. J. Chromatogr. A155, 481–491. doi: 10.1016/j.chroma.2018.04.036
13
HsuehT. P.TsaiT. H. (2018). Preclinical pharmacokinetics of scoparone, geniposide and rhein in an herbal medicine using a validated LC-MS/MS method. Molecules23, 2716. doi: 10.3390/molecules23102716
14
JiaJ.LiuM.WenQ.HeM.OuyangH.ChenL.et al. (2019). Screening of anti-complement active ingredients from Eucommia ulmoides Oliv. branches and their metabolism in vivo based on UHPLC-Q-TOF/MS/MS. J. Chromatogr. B.1124, 26–36. doi: 10.1016/j.jchromb.2019.05.029
15
JiangP.MaY.GaoY.LiZ.LianS.XuZ.et al. (2016). Comprehensive Evaluation of the Metabolism of Genipin-1-β-d-gentiobioside in Vitro and in Vivo by Using HPLC-Q-TOF. J. Agric. Food Chem.64, 5490–5498. doi: 10.1021/acs.jafc.6b01835
16
JiangY.LiuR.ChenJ.LiuM.LiuM.LiuB.et al. (2019). Application of multifold characteristic ion filtering combined with statistical analysis for comprehensive profiling of chemical constituents in anti-renal interstitial fibrosis I decoction by ultra-high performance liquid chromatography coupled with hybrid quadrupole-orbitrap high resolution mass spectrometry. J. Chromatogr. A.1600, 197–208. doi: 10.1016/j.chroma.2019.04.051
17
KumarN.BansalA.SarmaG. S.RawalR. K. (2014). Chemometrics tools used in analytical chemistry: An overview. Talanta123, 186–199. doi: 10.1016/j.talanta.2014.02.003
18
LeiX. Q.LiG.ChengL.WangX. L.MengF. Y. (2018). Identification of Ligustici Rhizoma et Radix and its adulterants based on their chemical constituents by UHPLC-Q/TOF-MS combined with data mining. J. Pharm. Biomed. Anal.154, 123–137. doi: 10.1016/j.jpba.2018.02.053
19
LiY.HanC.WangJ.XiaoW.WangZ.ZhangJ.et al. (2014). Investigation into the mechanism of Eucommia ulmoides Oliv. based on a systems pharmacology approach. J. Ethnopharmacol.151, 452–460. doi: 10.1021/acs.jafc.8b01312
20
LiL.GuoY.ZhaoL.ZuY.GuH.YangL. (2015). Enzymatic hydrolysis and simultaneous extraction for preparation of genipin from bark of eucommia ulmoides after ultrasound, microwave pretreatment. Molecules20, 18717–18731. doi: 10.3390/molecules201018717
21
LiY.XieY.HeY.HouW.LiaoM.LiuC. (2019). Quality Markers of Traditional Chinese Medicine: Concept, Progress, and Perspective. Engineering5, 813–980. doi: 10.1016/j.eng.2019.01.015
22
LiuE.LinY.WangL.HuoY.ZhangY.GuoJ.et al. (2016). Simultaneous Determination of Pinoresinol Di-glucopyranoside and Pinoresinol Glucoside in Rat Plasma by HPLC-tandem MS/MS for Pharmacokinetic Study. Chin. Herb. Med.8, 337–343. doi: 10.1016/S1674-6384(16)60060-6
23
LuJ.LiuL.ZhuX.WuL.ChenZ.XuZ.et al. (2018). Evaluation of the Absorption Behavior of Main Component Compounds of Salt-Fried Herb Ingredients in Qing’e Pills by Using Caco-2 Cell Model. Molecules23, 3321. doi: 10.3390/molecules23123321
24
MaS.ZhangC.ZhangZ.DaiY.GuR.JiangR. (2019). Geniposide protects PC12 cells from lipopolysaccharide-evoked inflammatory injury via up-regulation of miR-145-5p. Artif. Cells Nanomed. Biotechnol.47, 2875–2881. doi: 10.1080/21691401.2019.1626406
25
MaoQ.KongM.ShenH.ZhuH.ZhouS. S.LiS. L.et al. (2017). LC-MS-based Metabolomics in Traditional Chinese Medicines Research: Personal Experiences. Chin. Herb. Med.9, 14–21. doi: 10.1016/S1674-6384(17)60071-6
26
OuyangH.LiJ.WuB.ZhangX.LiY.YangS.et al. (2017). A robust platform based on ultra-high performance liquid chromatography Quadrupole time of flight tandem mass spectrometry with a two-step data mining strategy in the investigation, classification, and identification of chlorogenic acids in Ainsliaea fragrans Champ. J. Chromatogr. A.1502, 38–50. doi: 10.1016/j.chroma.2017.04.051
27
PiJ. J.WuX.RuiW.FengY. F.GuoJ. (2016). Identification and fragmentation mechanisms of two kinds of chemical compositions in eucommia ulmoides By UPLC-ESI-Q-TOF-MS/MS. Chem. Nat. Compd.52, 144–148. doi: 10.1007/s10600-016-1574-y
28
QiL. W.ChenC. Y.LiP. (2019). Structural characterization and identification of iridoid glycosides, saponins, phenolic acids and flavonoids in Flos Lonicerae Japonicae by a fast liquid chromatography method with diode-array detection and time-of-flight mass spectrometry. Rapid Commun. Mass Spectrom.23, 3227–3242. doi: 10.1002/rcm.4245
29
ShiS. Y.PengM. J.ZhangY. P.PengS. (2013). Combination of preparative HPLC and HSCCC methods to separate phosphodiesterase inhibitors from Eucommia ulmoides bark guided by ultrafiltration-based ligand screening. Anal. Bioanal. Chem.405, 4213–4223. doi: 10.1007/s00216-013-6806-4
30
WangF.WangB.WangL.XiongZ. Y.GaoW.LiP.et al. (2017). Discovery of discriminatory quality control markers for Chinese herbal medicines and related processed products by combination of chromatographic analysis and chemometrics methods: Radix Scutellariae as a case study. J. Pharm. Biomed. Anal.138, 70–79. doi: 10.1016/j.jpba.2017.02.004
31
WangJ.CaoG.WangH.YeH.ZhongY.WangG.et al. (2017). Characterization of isochlorogenic acid A metabolites in rats using high-performance liquid chromatography/quadrupole time-of-flight mass spectrometry. Biomed. Chromatogr.31, e3927. doi: 10.1002/bmc.3927
32
WangY. J.LiT. H.JinG.WeiY. M.LiL. Q.KalkhajehY. K.et al. (2019). Qualitative and quantitative diagnosis of nitrogen nutrition of tea plants under field condition using hyperspectral imaging coupled with chemometrics. J. Sci. Food. Agric.100, 161–167. doi: 10.1002/jsfa.10009
33
WuX.WangS.LuJ.JingY.LiM.CaoJ.et al. (2018). Seeing the unseen of chinese herbal medicine processing (paozhi): advances in new perspectives. Chin. Med.13, 4. doi: 10.1186/s13020-018-0163-3
34
XiaB. H.HuY. Z.XiongS. H.TangJ.YanQ. Z.LinL. M. (2017). Application of random forest algorithm in fingerprint of Chinese medicine: different brands of Xiasangju granules as example. China J. Chin. Mater. Med.42, 1324–1330. doi: 10.19540/j.cnki.cjcmm.20170121.020
35
XiaJ. X.ZhaoB. B.ZanJ. F.WangP.ChenL. L. (2019). Simultaneous determination of phenolic acids and flavonoids in Artemisiae Argyi Folium by HPLC-MS/MS and discovery of antioxidant ingredients based on relevance analysis. J. Pharm. Biomed. Anal.175, 112734. doi: 10.1016/j.jpba.2019.06.031
36
ZhangQ. Q.DongX.LiuX. G.GaoW.LiP.YanH. (2016). Rapid separation and identification of multiple constituents in Danhong Injection by ultra-high performance liquid chromatography coupled to electrospray ionization quadrupole time-of-flight tandem mass spectrometry. Chin. J. Nat. Med.14., 147–160. doi: 10.1016/S1875-5364(16)60008-0
37
ZhaoB. T.JeongS. Y.KimT. I.SeoE. K.MinB. S.SonJ. K.et al. (2015). Simultaneous quantitation and validation of method for the quality evaluation of Eucommiae cortex by HPLC/UV. Arch. Pharm. Res.38, 2183–2192. doi: 10.1007/s12272-015-0642-3
38
ZhouB.XiaoJ. F.TuliL.RessomH. W. (2012). LC-MS-based metabolomics. Mol. Biosyst.8, 470–481. doi: 10.1039/c1mb05350g
39
ZhuM. Q.SunR. C. (2018). Eucommia ulmoides Oliver: a potential feedstock for bioactive products. J. Agric. Food Chem.66, 5433–5438. doi: 10.1021/acs.jafc.8b01312
40
ZiegelE. R. (2004). Statistics and chemometrics for analytical chemistry: statistics and chemometrics for analytical chemistry. Technometrics46, 498–499. doi: 10.1198/tech.2004.s248
Summary
Keywords
Eucommiae Cortex, ultra-high performance liquid chromatography coupled with mass spectrometry, metabolomics, chemometrics, combinatorial discriminatory quality markers
Citation
Guo J, Li J, Yang X, Wang H, He J, Liu E, Gao X and Chang Y-x (2020) A Metabolomics Coupled With Chemometrics Strategy to Filter Combinatorial Discriminatory Quality Markers of Crude and Salt-Fired Eucommiae Cortex. Front. Pharmacol. 11:838. doi: 10.3389/fphar.2020.00838
Received
24 September 2019
Accepted
21 May 2020
Published
17 June 2020
Volume
11 - 2020
Edited by
Fengguo Xu, China Pharmaceutical University, China
Reviewed by
Chu Chu, Zhejiang University of Technology, China; Ruili Yang, South China Agricultural University, China; Wei Zhang, Macau University of Science and Technology, Macau
Updates
Copyright
© 2020 Guo, Li, Yang, Wang, He, Liu, Gao and Chang.
This is an open-access article distributed under the terms of the Creative Commons Attribution License (CC BY). The use, distribution or reproduction in other forums is permitted, provided the original author(s) and the copyright owner(s) are credited and that the original publication in this journal is cited, in accordance with accepted academic practice. No use, distribution or reproduction is permitted which does not comply with these terms.
*Correspondence: Yan-xu Chang, Tcmcyx@tjutcm.edu.cn
This article was submitted to Ethnopharmacology, a section of the journal Frontiers in Pharmacology
Disclaimer
All claims expressed in this article are solely those of the authors and do not necessarily represent those of their affiliated organizations, or those of the publisher, the editors and the reviewers. Any product that may be evaluated in this article or claim that may be made by its manufacturer is not guaranteed or endorsed by the publisher.