 Lihua Zuo1,2†
 Liwei Liu1,2†
 Yantao Yang1,2Jie Yang1,2Min Chen3Huafeng Zhang4Jian Kang1,2
 Xiaojian Zhang1,2
 Jiabo Wang5*
 Zhi Sun1,2*
- 1Department of Pharmacy, the First Affiliated Hospital of Zhengzhou University, Zhengzhou, China
- 2Henan Engineering Research Center of Clinical Mass Spectrometry for Precision Medicine, Zhengzhou, China
- 3Department of Neurology, The First Affiliated Hospital of Zhengzhou University, Zhengzhou, China
- 4Department of Orthopedics, the First Affiliated Hospital of Zhengzhou University, Zhengzhou, China
- 5School of Traditional Chinese Medicine, Capital Medical University, Beijing, China
Prucalopride was widely used for chronic constipation, which is difficult to be adequately relieved by laxatives in adult patients in clinic. Due to the difficulty in metabolite identification, metabolic process of prucalopride had not been investigated in vivo. In this study, an efficient strategy was proposed for comprehensive metabolite profiling of prucalopride after oral administration in rat plasma, urine, and feces samples. This strategy was composed of five steps. First, the samples at multiple time points after oral administration were collected to increase the representativeness of the samples. Second, different sample preparation methods were investigated to obtain superior extraction efficiency. Third, the raw data of test sample and blank sample were acquired using ultra-performance liquid chromatography with Q-Exactive hybrid quadrupole–orbitrap high-resolution accurate mass spectrometry under the positive and negative full-scan/dd MS2 mode. Fourth, combined mass defect filter with background subtraction model in soft of compound discovery, all peaks were constructed to filter potential metabolites after retention time alignment and ion filtration, which could remove large amounts of interference ions. Besides, it can predict potential biotransformation, promoting to understand how to metabolize the drug. This provides multiple possibilities and prevents us conjecturing the potential metabolites blindly. Finally, the verification procedure was implemented through exporting the structure and MS2 spectrum to the analytical tool of Mass Frontier. The proposed strategy significantly improved the targeted detection and identification for metabolites in vivo. A total of 47 metabolites were tentatively characterized in the plasma, urine, and feces samples after oral administration of prucalopride. This study could provide a valuable reference for systematic metabolite profile of drug in vivo.
Introduction
The drug-related metabolites could provide abundant information related to the side effects and formation of active or other toxic metabolites (Balasaheb et al., 2018; Godinho et al., 2018; Radko and Olejnik, 2018; Shankar et al., 2018). However, in vivo samples are very complex with majority of detected peaks in low abundance, which may throw a huge obstacle to acquire purified metabolite-related data from complex materials (Chaleckis et al., 2019). Furthermore, even though the purified data are obtained, the structure elucidation and the annotation of particular biotransformation still are an ongoing challenge (Wolfender et al., 2015; Mahieu and Patti, 2017). Therefore, the efficient strategies that could extract and target detect the multiple trace-absorbed prototypes and metabolites from the complex biological matrix are in great demand.
As one of the leading edge techniques in the drug metabolite research, ultra-high-performance liquid chromatography coupled with mass spectrometry (UHPLC-MS) has developed rapidly in recent decades. It could shorten the analysis time and improve the analysis efficiency by optimizing the parameters of chromatography–mass spectrometry. Meanwhile, there are several scan modes, such as information-dependent acquisition (IDA), selected reaction monitoring (SRM), and precursor and neutral loss scan, which have their own superiorities and characteristics. But due to its drawbacks, including relatively insensitive scan functions, long duty cycle, and multiple injections to monitor multiple precursors and neutral, it was used in the drug-related metabolite studies previously (Gao et al., 2015). While data-independent acquisition (DIA) is more suitable to acquire comprehensive data because they could obtain complete fragment ion information by two interleaved scan functions using gradient collision energy, respectively (Roemmelt et al., 2014; Zhu et al., 2014; Maurer and Meyer, 2016; Zhou and Yin, 2016; Ludwig et al., 2018; Wang et al., 2018; Yao et al., 2018). Although the data acquisition method has improved, what we will be facing is still a heavy workload. Hence, the strategy integrated the acquisition mode, and database and data analysis tools have been proposed. MDF combined with BS are common data processing method, which should select a MDF template indicating that the metabolites without high similarity to the template would not be detected. But the MDF-processed data often display false-positive results and cannot offer sufficient information for the structure (Xing et al., 2015a; Xing et al., 2017; Li et al., 2018a; Zhou et al., 2018). So, the novel ring double bond (RDB; valence values of elements in structure) filter was added to show rich structural information in more sensitive full-scan MS chromatograms. In addition, the combination of neutral loss and precursor ion scan mode was also applied to the explanation of the metabolites, but the systematic and comprehensive metabolite data cannot be obtained with the structure elucidation being time consuming and laborious (Domínguez-Romero et al., 2013; Xing et al., 2015b; Blaženović et al., 2018; Li et al., 2018b).
Prucalopride is the first representative of a novel chemical class of dihydrobenzofurancarboxamide derivatives, which has highly selective agonist activity and high affinity 5-HT4 receptor to act primarily on different parts of the lower gastrointestinal tract, promoting cholinergic, nonadrenergic and noncholinergic neurotransmission by enteric neurons (Sun et al., 2016). In our previous study of our group, the pharmacokinetics and tissue distribution of prucalopride had been studied (Sun et al., 2016; Zuo et al., 2016). However, the metabolites of prucalopride in vivo are not clear. So, in this study, the metabolite identification of prucalopride was taken as a case. Forty-seven metabolites were identified in total with some interesting phenomena that found that the drug could combine with some endogenous substances, such as amino acid, palmitic acid, and so on. This study may support the scientific explanation for the activity or toxicity.
In this study, a comprehensive strategy was proposed for the rapid identification of the metabolites of prucalopride after oral administration based on the ultra-performance liquid chromatography with Q-Exactive hybrid quadrupole–orbitrap high-resolution accurate mass spectrometry (UHPLC-HRMS). This strategy could be divided into five steps. The flow chart is shown in Figure 1. First, the plasma, urine, and feces samples at multiple time points after oral administration were collected for analysis. Second, different sample preparation methods were investigated to obtain superior extraction efficiency, including the protein precipitation, liquid–liquid extraction, and solid phase extraction. Third, the MS acquisition method was optimized under the positive and negative full-scan/dd MS2 mode. Fourth, combined mass defect filter with background subtraction model in soft of compound discovery, all peaks were constructed to filter potential metabolites after retention time alignment and ion filtration, which could remove large amounts of interference ions. Besides, it can predict potential biotransformation, which could help us in inferring the metabolic process of the drug. This provides multiple possibilities and prevents us conjecturing the potential metabolites blindly. Finally, the verification procedure was implemented through exporting the structure and MS2 spectrum to the analytical tool of Mass Frontier. The absorbed metabolites were comprehensively characterized by reference standards and MS/MS fragmentation in rat plasma, urine, and feces after oral administration of prucalopride. The entire strategy presented in this study significantly will improve the targeted detection and identification for metabolites in complex biological samples.
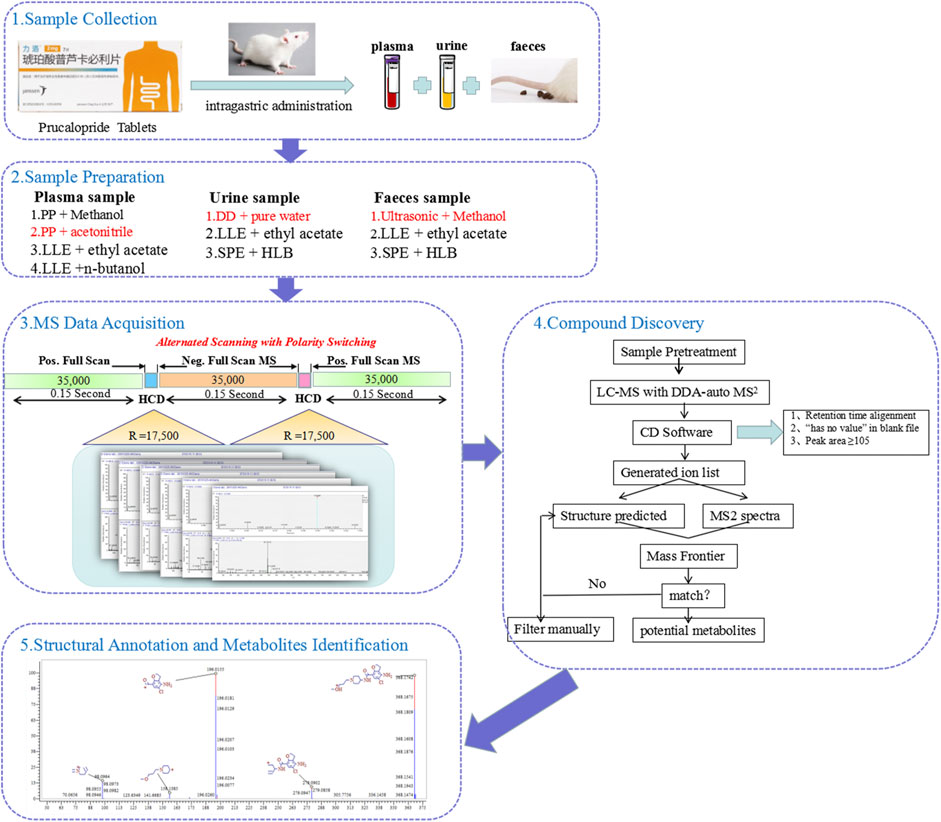
FIGURE 1. The workflow of analytical strategy for metabolite identification using UHPLC-Q-Orbitrap HRMS in combination with multiple data mining techniques.
Experiment and Methods
Material, Reagents, and Animals
Prucalopride (purity >99%) was obtained from Sigma Chemical Co. (St.Louis, MO, United States). Acetonitrile and methanol of HPLC grade were purchased from Fisher Scientific (Fair Lawn, NJ, United States). The chemical of formic acid was of HPLC grade and purchased from Aladdin Industrial Corporation (Shanghai, China). All other reagents were of analytical grade. Deionized water was purified via a Milli-Q system (Millipore, Milford, MA, United States).
Male Sprague–Dawley (SD) rats, weighing 200 ± 20 g, were acquired from the Experimental Animal Center of Zhengzhou University (Zhengzhou, China). In order to adapt to the environment, all animals were fed under the controlled temperature (20 ± 2°C), humidity (60 ± 5%), and 12-h-light/12-h-dark cycle for one week before the experiment. All protocols of animal experiments were in accordance with the Regulations of Experimental Animal Administration issued by the Animal Ethics Committee of First Affiliated Hospital of Zhengzhou University.
Chromatographic Conditions
Chromatographic separation was performed on an UHPLC Dionex Ultimate 3,000 (Thermo Scientific, San Jose, United States) equipped with a binary pump solvent management system with online degasser, autosampler, and column oven. A Waters ACQUITY UPLC® BEH C18 column (2.1 mm × 100 mm, 1.7 µm) was employed and the column temperature was maintained at 40°C. The mobile phase was composed of A (0.1% formic acid in water) and B (acetonitrile) with the following gradient elution: 0.0–3.0 min, 5%B; 3.0–10.0 min, 5–30%B; 10.0–27.0 min, 30–80% B; 27.0–28.0 min, 80–100% B; 28.0–30.0 min, 100% B; and 30.0–32.0 min, 100–5% B at a flow of 0.2 ml/min. The autosampler was conditioned at 10°C, and the injection volume was 5 µL for analysis.
Mass Spectrometric Conditions
A Q-Exactive high-resolution mass spectrometry using a heated electrospray ionization (HESI) ion source was tandem to the UHPLC system. The optimized parameters of mass spectrometry were illustrated as below: spray voltage: + 3.5 kV or −2.8 kV; sheath gas pressure: 40 arb; aux gas pressure: 10 arb; sweep gas pressure: 0 arb; capillary temperature: 320°C; auxiliary gas heater temperature: 300°C; S-lens RF level: 50 V; scan mode: full MS/dd-MS2, 1) full MS: resolution: 70,000; automatic gain control (AGC) target: 3.0 e6; maximum injection time (IT): 200 ms; scan range: 80–1,200 m/z; 2) dd-MS/MS2: resolution: 17,500; AGC target: 1.0 e5; maximum IT: 50 ms; loop count: five; isolation window: 2.0 m/z; NCE/stepped: 20, 30, and 40; and dynamic exclusion: 10.0 s. Nitrogen was used for spray stabilization and as the collision gas in the C-trap. All data collected in profile mode were acquired and processed using Thermo Xcalibur 3.0 software. Regarding the sequence of analysis, all samples were randomized. Blank sample containing barely the solvent was added after every 20 samples, aiming to elute residuals or other impurities which were retained by the chromatography column in the previous spectra records.
Sample Collection
Blood samples of 300 μL were collected via the orbital vein at 0 (predose); 10 min; 30 min; 1, 2, and 4 h after oral administration of 1.0 mg/kg prucalopride. The heparin sodium was added to exert the anticoagulant action, and the samples were centrifuged at 3,500 rpm for 10 min at 4°C, then all plasma samples were pooled together. Blank urine and feces samples were collected by putting the SD rats into the metabolic cages, and the rats were fasted but drunk freely. The samples after administration were collected the same as the above.
Sample Preparation
Protein in rat plasma sample (100 µL) was precipitated with the acetonitrile (300 µL). After vortexing for 3 min, the sample was centrifuged at 13,000 rpm for 10 min. Then, the supernatant was transferred into a 1.5-ml centrifuge tube and evaporated to dryness in a vacuum centrifugal concentrator. The residue was dissolved in 50 µL of 50% methanol with vortex mixing for 1 min, and the centrifugation process was the same as the above for 5 min. Finally, 5 µL supernatant was injected into the UHPLC-MS/MS system for analysis.
The urine sample (200 µL) was diluted with 200 µL pure water, vortexing for 1 min. After centrifuging at 13,000 rpm for 10 min, the supernatant was filtered by 0.22 µm MCE microporous filter membrane into sample bottle for analysis.
The feces sample (0.2 g) was weighed precisely into the 4 ml EP tube, adding 2 ml methanol and ultrasonic dissolving, then the supernatant was transferred and centrifuged at 13,000 rpm for 10 min. After that, the supernatant was filtered by 0.22 µm nylon microporous filter membrane into the sample bottle for analysis.
MS Data Processing
The HRMS data of all samples were processed in the Compound Discoverer 2.1 (CD, Thermo Fisher Scientific) to extract the metabolite-related dataset according to the structural correlation between the drug and its metabolites. Then, the information of blank samples as control from the above dataset was removed by setting “has no value” in blank file after the retention time alignment and database search. And the peak area of ions was equal or greater than 105 in order to differentiate the metabolites from the base peaks. Next, the structure was speculated based on the fragmentation pattern and relative purified ion lists, which possessed the message of molecular formula, molecular weight, retention time, potential biotransfromation, etc. The structure and mass spectrometry were further exported to the Mass Frontier 7.0 (MF, Thermo Fisher Scientific) to observe whether the structure and fragments match.
Results and Discussion
Optimization of Sample Preparation
For different samples, the process of sample treatment was investigated. In order to extract and detect more metabolites of prucalopride from plasma samples, we systematically investigated the sample preparation method, including the commonly used protein precipitation (PP) with methanol and acetonitrile and liquid–liquid extraction (LLE) with ethyl acetate and n-butanol. In order to extract and detect more metabolites of prucalopride from urine samples, direct dilution (DD) with pure water, liquid–liquid extraction (LLE) with ethyl acetate, and solid phase extraction (SPE) with Oasis® HLB cartridges were done. In order to extract and detect more metabolites of prucalopride from feces samples, ultrasonic extraction with methanol, liquid–liquid extraction (LLE) with ethyl acetate, and solid phase extraction (SPE) with Oasis® HLB cartridges were done. By comparing the extraction efficiency, the treatment conditions of plasma samples (100 µL) were finally protein precipitation (PP) with acetonitrile (300 µL). Because there were a large number of metabolites in urine and the polarity of metabolites is quite different, the urine sample (200 µL) was diluted with 200 µL pure water in order to ensure that more metabolites could be detected. While for feces samples, the sample preparation was adopted by ultrasonic extraction with methanol.
Optimization of Chromatographic and Mass Spectrometric Conditions
In order to obtain higher responses, suitable retention behaviors, and symmetrical peak shapes for the analyte, various mobile phase conditions (methanol, acetonitrile, different proportions of formic acid, ammonium acetate, and 100% water) were tested as potential mobile phases. Finally, acetonitrile–water containing 0.1% formic acid was chosen for its good peak shapes. It was also noted that gradient elution could dramatically narrow the peak shape and improve the response intensity and resolution.
For MS parameters optimizing, scans were simultaneously implemented in both positive and negative ion detection mode. In Q-Exactive instrument, there were two modes that could be used to perform an accurate qualitation. They were full MS/dd MS2 mode and all-ion fragmentation (AIF). All ions entered into HCD for collision under the AIF mode. Due to no selectivity for parent ions, this data acquisition mode was rarely used. While under the full MS/dd MS2 mode, the matching fragment information of primary and secondary mass spectra simultaneously. So the full MS/dd MS2 mode was adopted for metabolite profiling of prucalopride in rats. Meanwhile, the other MS parameters, such as the gas pressure, the heated temperature, and the spray voltage, were all well optimized for maximum response. The optimal parameters settings are shown in Mass Spectrometric Conditions.
The Establishment of MDF and BS Model in CD
Metabolite identification, still, is a hard nut to crack at present. There are not only complex endogenous components but also abundant metabolites, which display a high degree of structural variability. The established strategy could solve the matters in the metabolite annotation to a great extent, which was proposed as follows. After the pretreatment, the data extraction was operated with the IDA-based data acquisition, which was based on the retention time alignment, database searching, scoring, etc. Then, the extracted ion lists were filtered by setting parameter in manual. Furthermore, the tentative identification was conducted.
Retention Time Alignment and Ion Extraction
After importing the raw files of control and samples into the soft of compound discovery, the alignment algorithm looks for matching features (chromatographic peaks with the same m/z × RT dimensions) in the input files. Then, the following parameters such as parent compound or compounds, number of dealkylation and dearylation steps, number and type of transformation steps, and list of possible adduct ions would be set based on the experimenter’s demands and metabolic type to search the metabolites of detected compounds. When the application finds a matching compound, it will mark the pathway for fast search. According to the above, an expected ion list was generated.
Matrix Filter and Noise Subtraction
The first step extracts the related data from the complex data, while the annotation of the generated ion list still is a huge project which may contain several thousand potential ion features as well as the interference of the noise and biological matrix. In order to subtract the matrix, the parameter was set with “has no value” in the blank file for screening. Furthermore, considering differentiation of the metabolites with baseline noise, we set the peak area equal or greater than 105 or other ranges according to the actual requirement. By filtering, the resulting list information will be significantly reduced, which will reduce unnecessary work and improve the efficiency.
Structural Annotation and Metabolites Identification
Structural elucidation is time consuming and labor-intensive process to manually interpret spectra; thus, the powerful analytical software is considered with its unique new features to significantly improve our workflow. Mass Frontier (MF) can offer a number of enhancements designed to increase productivity. The generated ion list after the data handling procedure from CD contains the messages of molecular formula, molecular weight, retention time, and potential transformation. And in the same window interface, the mass spectrometry is presented along with the corresponding compound information and the parent drug is used as the reference in the bottom of the mass spectrometry with the corresponding compound in the upper, which is convenient for the structure fragment alignment. Therefore, we can deduce the metabolites’ structure by fragmentation regulation of mass spectra and transformation suggested. Then, the mass spectra called out from the Xcalibur 3.0 is exported into the MF, which automatically generated fragments and detailed fragmentation and rearrangement mechanisms from the chemical structure. If the theoretical fragmentation through the MF could match the MS2 spectrogram, the compound was identified tentatively; if not, the ion feature was filtered manually.
Comprehensive Characterization of Metabolites of Prucalopride in vivo
In this study, the plasma, urine, and feces were collected for the metabolite identification. The raw data files containing experiment group and control group were uploaded into the CD, a total of 2,717, 5,869, and 5,310 ion were extracted in the plasma, urine, and feces samples with the software running, respectively. Then, the remaining ions were handled further, just 340, 777, and 300 ions ultimately left. According to suggested transformation pathways, molecular formula, and mass spectrometry fragment ions to predict the underlying metabolite structures which can be confirmed by MF in turn, we identified 47 tentative metabolites in total. All the information of 47 metabolites of prucalopride detected by UHPLC-Q-Orbitrap HRMS is listed in Table 1. And Supplementary Figure S1 shows the extraction flow chromatography and MS/MS spectrum of prucalopride and metabolites.
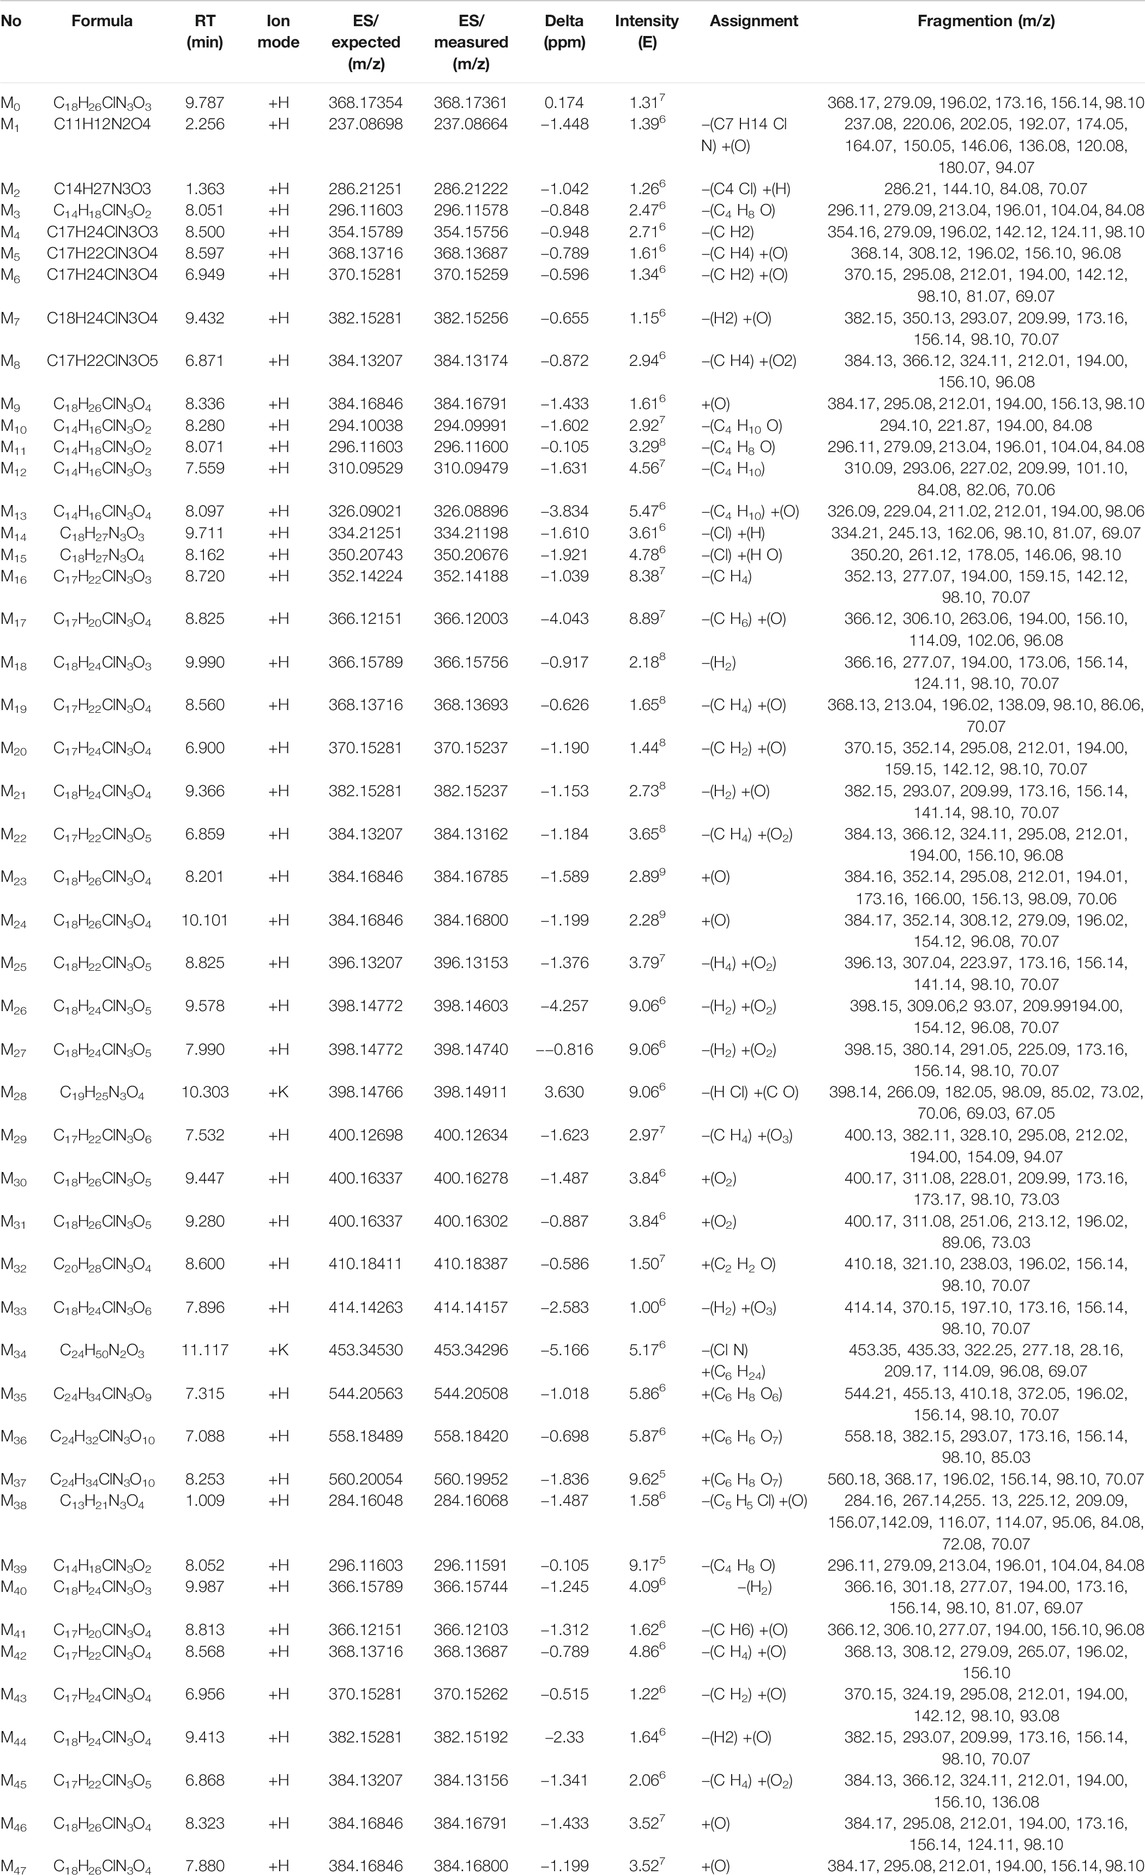
TABLE 1. All information of 47 metabolites of prucalopride detected and annotated by UHPLC-Q-Orbitrap HRMS.
Identification of Metabolites in Rat Plasma
In the positive ion mode, the ion flow chromatograph of prucalopride reference (C18H26ClN3O3) was extracted, and the excimer ion peak of m/z 368.17354 [M + H]+ was generated (tR = 9.978 min, error: 0.174 ppm), as shown in Figure 2.
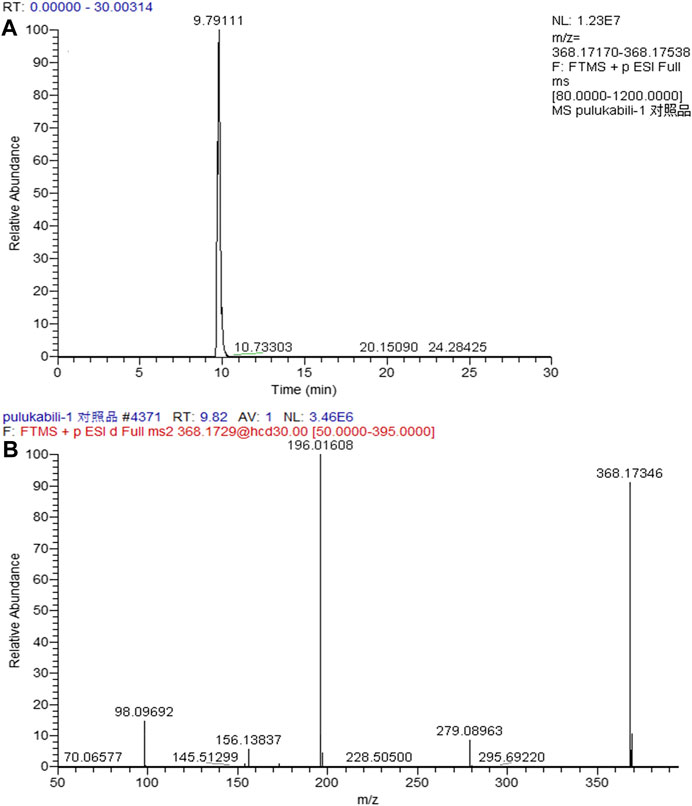
FIGURE 2. The chromatogram (A) and mass spectrogram (B) of prucalopride in positive ion mode.
There were nine metabolites (M1-M9; Figure 3) identified tentatively in the plasma with the information summarized in Table 1. Metabolites M1 and M2 mainly occurred the break of bond in the “N” linked with piperidine ring, M1 (a part of prucalopride with benzofuran ring) was the ion at m/z 237.08664, which is the product of acetylation with the reaction site in amino group or hydroxyl group, and M2 was detected at 1.363 min with m/z 286.21222, which was the other part of parent drug and bound with ornithine in vivo. The fitted chemical formula of M3 was C14H18ClN3O2, a difference of C4H8O with prucalopride which indicated the loss of alkyl chain moiety, and the characteristic ions were in accordance with the speculative structure. The M4 was found at 8.500 with m/z 354.15756 (with a mass shift of 14.02 Da, just lost of a methyl group), so this metabolite showed the characteristic fragments with m/z 279.09, 196.02, and 98.10. M5 and M6 (m/z 368.13687 and m/z 370.15259) were the oxidation products in piperidine ring or furan ring with the methyl group leaving. M7 presented at 9.432 min with m/z 382.15256, and only oxidation in furan ring was happened; thus, this metabolite had common fragments with the parent drug, m/z 173.16, 156.14, 98.10, and 70.07. M8 was yielded via oxidation in piperidine ring and furan ring and demethylation of the alkyl chain. Metabolite M9 was the oxidation product in the furan ring and presented precursor ion m/z 384.16846 with RT 8.336 min. Due to the tiny structural changes, the characteristic fragment ions (m/z 173.16, 156.13, 98.09, and 70.06) were detected.
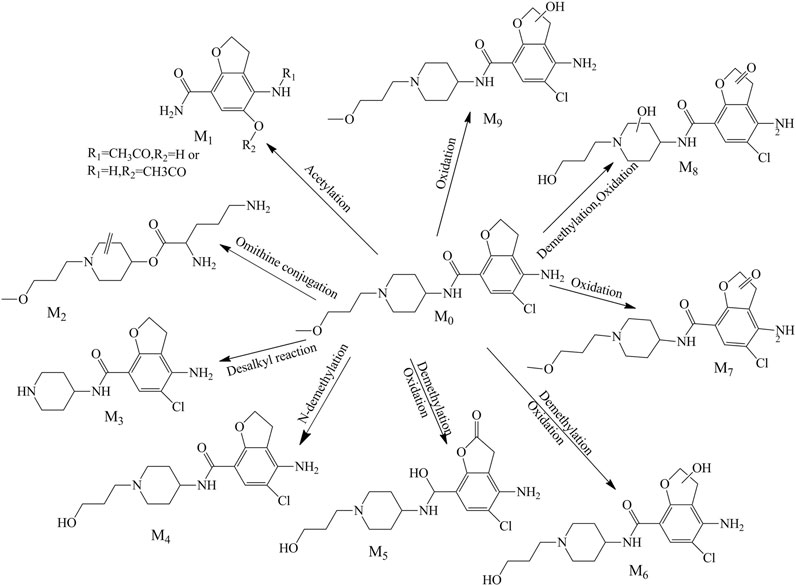
FIGURE 3. Proposed metabolite pathway of prucalopride in the plasma.
Identification of Metabolites in Rat Urine
A total of 28 metabolites (M10–M37; Figures 4A,B) were found in the urine which involved complex metabolic reaction. Metabolites M10–M12 (RT 8.280, 8.071, and 7.559 min) were detected as the leaving of the alkyl chain moiety with m/z 294.09991, 296.11600, and 310.09479, respectively. And, compared with the metabolite M11, M10 took off two hydrogen atoms to generate a double bond in furan ring, and M12 was oxidized in the furan ring. Metabolite M13 (RT 8.097, m/z 326.08896) was also the result of the ornithine conjugation, but different from the metabolite M2, the ornithine was combined with the acylamino group of the other side of the drug structure. The parent drug prucalopride was a chlorine-containing compound; thus, oxidative dechlorination and reductive dechlorination happened when it was metabolized and yielded the metabolite M14 and M15 at 9.711 and 8.162 min with m/z 334.21198 and 350.20676.
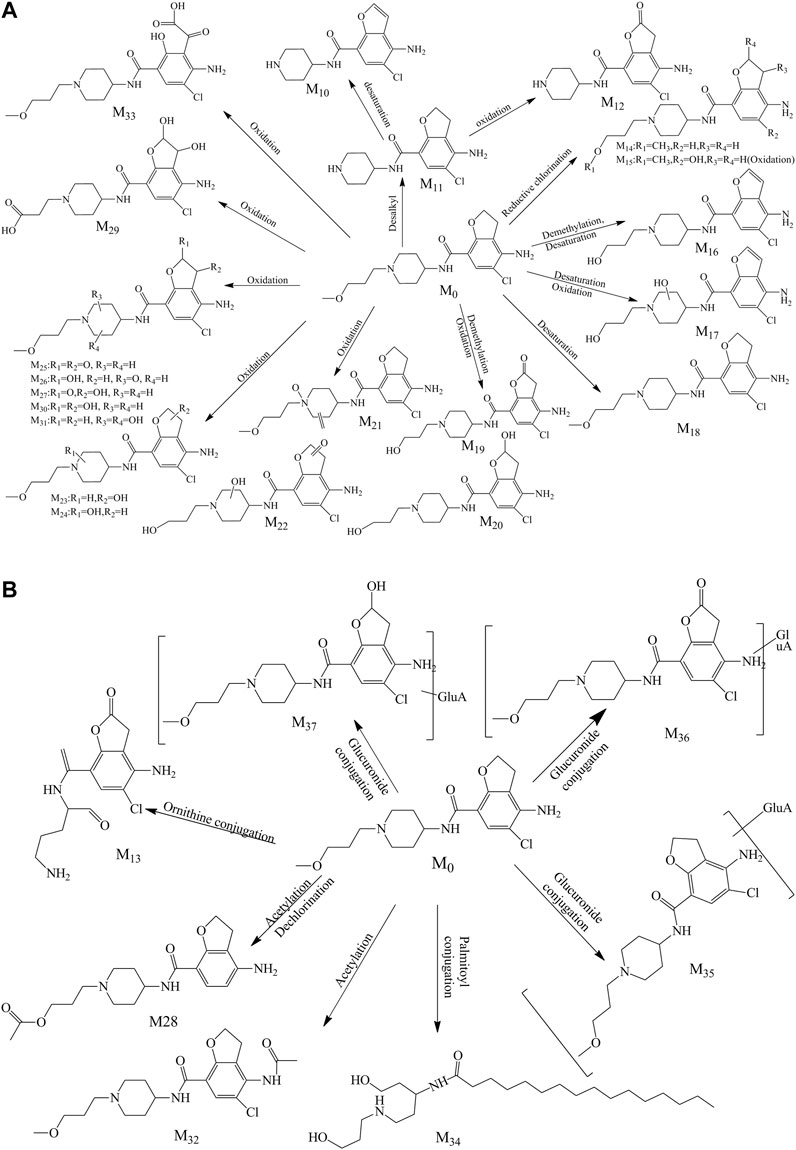
FIGURE 4. (A) Proposed phase I metabolite pathway of prucalopride in the urine. (B) Proposed phase II metabolite pathway of prucalopride in the urine.
Metabolite M16 was detected at 8.720 min with the mass charge ratio 352.14188. And the fitted molecular formula was C17H22ClN3O3, just a difference of 2H with the M4 (C17H24ClN3O3). The typical fragment ions (m/z 352.13, 277.07, and 194.00) that indicated the part of furan ring had a deviation of 2 Da with the metabolite M4 suggesting that M16 lost 2H from the furan ring in the basis of M4A.
Metabolites M17, M19, and M20 were the products of the demethylation and were found at 8.825, 8.560, and 6.900 min with m/z 366.12003, 368.13693, and 370.15237, while oxidation or dehydrogenation also took place in different positions of the piperidine ring or furan ring. Metabolite M18 just took off two hydrogen atoms in the basis of parent drug; therefore, m/z 277.07 (a mass shift of 2.02 Da, dehydrogenated from the ion m/z 279.09), 194.00 (a mass shift of 2.02 Da, dehydrogenated from the ion m/z 156.02), 173.06, 156.14, 98.10, and 70.07 were detected which were the typical ion fragments of the prucalopride.
The oxidation in the “N” of piperidine ring also happened to generate metabolite M21 (RT 9.366 and m/z 382.15237), with oxidation, dehydrogenation, or demethylation in other regions. M22 was found at 6.859 min with m/z 384.13162, and this compound might be the same substance with the M8 according to the comparison of MS2 spectrum. And this assumption was confirmed by the MF. M23 was the oxidation product in the furan ring and presented precursor ion m/z 384.16785 with RT 8.201 min. The mass charge ratio and retention time were approaching between M9 and M23 which suggested that they might possess the same structure. The MS2 spectra of both were analogous and the result from MF confirmed the above assumption. M24 was the isomer of M23 with the oxidation position in the piperidine ring and exhibited precursor ion m/z 384.16800 with RT 10.101 min. And it showed the characteristic fragment ions (m/z 173.16, 156.13, 98.09, and 70.06).
Metabolites M25, M26, M27, M30, and M31 all possessed two oxidation sites in piperidine ring or furan ring which was a kind of main metabolic pathway of the parent molecule, their mass charge ratios were 396.13153, 398.14740, 398.14603, 400.16302, and 400.16278, and the retention time was 8.825, 9.578, 7.990, 9.447, and 9.280, respectively. In the basis of M30, the demethylation and oxidation in the alkyl side chain happen to emerge M29, which was found at 7.532 min with m/z 400.12634. The [M + K] ion of the metabolite M28 was m/z 398.14911 and was detected at 10.303 min, the acetylation occurred with the hydroxyl group after the demethylation with the hydrogen atom dropping out in furan ring and chlorine atom leaving away the benzene ring through reductive dechlorination.
M32 was an acetylated product of the parent drug, combined with the amino group of benzene ring and detected at the 8.600 min with the m/z 410.18387. Typical fragments (m/z 196.02, 156.14, 98.10, and 70.07) were found in the MS2 of this metabolite. M33 (m/z 414.14157, RT 7.896) was a ring-opening compound with the furan ring opening and oxidation conducted. M34 was an interesting metabolite which was a palmitic acid derivative exhibited at 11.117 min with m/z 453.34296. Such a way to metabolize was rare in the current literature reports and united closely with the endogenous substances. Therefore, the discovery of a metabolic mode like this was meaningful for the metabolite exploration.
The metabolites of M35, M36, and M37 were the phase II metabolites identified as glucuronic acid conjugates preliminarily. The detailed information was summarized in Table 1. The molecular weight of M35 was 176 Da more than the parent drug, it was a glucuronic acid conjugate obviously. The fitted molecular formulas for M36 and M37 were C24H32ClN3O10 and C24H34ClN3O10, indicating that an oxidation happened in the basis of M35 (C24H34ClN3O9). And the structure was exported to the MF to confirm the matching between the structure and the MS2 spectrum, and the outcome corroborated our speculation.
Identification of Metabolites in Rat Feces Samples
In the feces samples, 10 metabolites (M38–M47, Figure 5) were found in total. Metabolite 38 was the glutamine conjugate combined with the part of alkyl chain, this metabolite was found at 1.009 min with m/z 284.16068. M39 was detected at 8.052 with m/z 296.11591. The retention time and mass charge ratio were close to the M3, and the MS2 spectrum was analogous; thus, we assumed that the M39 and M3 were the same substance. Metabolite M40 (RT 9.987, m/z 366.15744) was the reactive product of dehydrogenation and generated typical fragment ions m/z 194.00, 173.16, 156.14, and 98.10. The fitted molecular formula for metabolite M41 was C17H20ClN3O4, which was found in the urine (M17) as well. Through the comparison of both, M41 was considered as the same substance with M17. M42 and M43 were yielded via demethylation and oxidation in different sites, with RT 8.568 and 6.956 min and m/z 368.13687 and 370.15262, separately. The metabolite M44 was C18H24ClN3O4, and this metabolite was detected in the plasma and urine as well. The retention time and MS2 spectrum were matching; thus, these metabolites were the same substance. M45 was detected at 6.868 min with m/z 384.13156. This compound was generated through the demethylation and oxidation in the piperidine ring or furan ring which was found in the plasma and urine as well. The precursor ion of M46 was m/z 384.16791 along with RT 8.323, the hydroxylation reaction happened in the furan ring, and the fragment ions (m/z 194.00, 173.16, 156.14, and 98.10) were detected as the diagnostic ions. M47 was the result of the oxidative ring–opening reaction, with RT 7.880 min and m/z 384.16800. The detailed information is showed in Table 1.
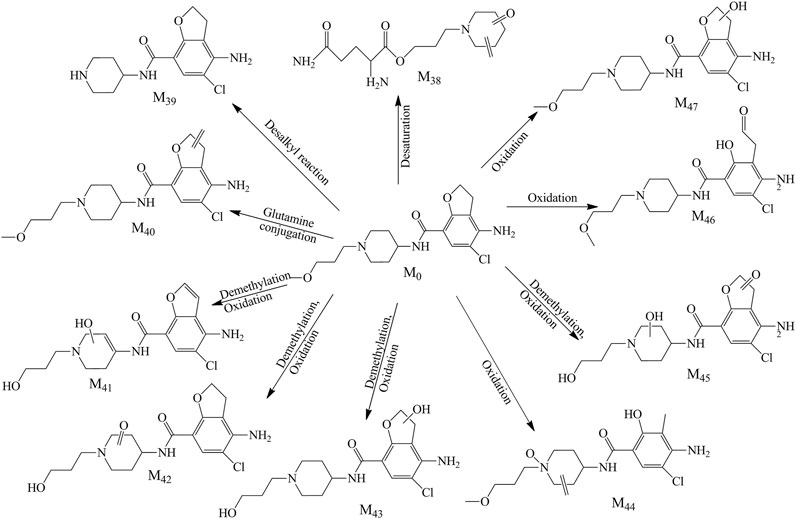
FIGURE 5. Proposed metabolite pathway of prucalopride in the feces.
Metabolite Profiling of Prucalopride
The entire process optimization strategy was applied for comprehensive in vivo metabolite profiling of prucalopride in rats, and 47 tentative metabolites were identified in total. The MS2 spectrum and corresponding fragment ions of prucalopride in Figure 6. By analyzing metabolite structures, they mainly occurred in phase I metabolic reaction including oxidation reaction, dehydration, desaturation, and glucuronide conjugation, the typical phase Ⅱ metabolite reaction. But beyond that we also found some interesting phenomena that the drug could be metabolized by combining with the ornithine and glutamine, and some important endogenous amino acids. Besides, the palmitoyl conjugation was also discovered in the urine and feces. As shown in Figure 2, the structural formula of prucalopride was C18H26ClN3O3, with MS spectrum including the characteristic product ions of the m/z 279.09, m/z 196.02, m/z 173.16, m/z 156.12, m/z 98.10, and m/z 70.07. And based on the drug and metabolites’ structural characteristics, the changes mainly contained: oxidation or desaturation of piperidine ring or furan ring in diffident positions, demethylation of alkyl chain moiety in piperidine ring, separation of alkyl side chain, amide bond breaking, opening of piperidine ring or furan ring and conjugation reaction combined with the above.
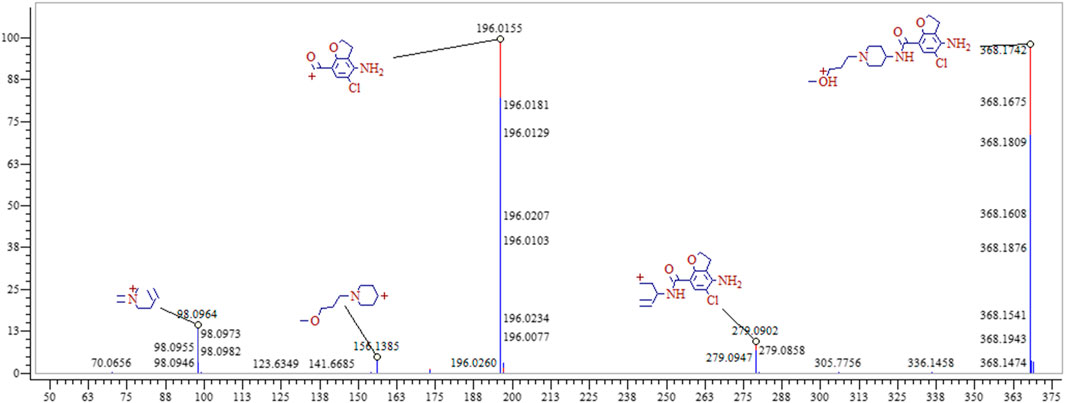
FIGURE 6. The MS2 spectrum and corresponding fragment ions of prucalopride.
Conclusion
In this study, an entire process optimization strategy was proposed for comprehensive in vivo metabolite profiling of prucalopride in rat plasma, urine, and feces samples after oral administration based on ultra-performance liquid chromatography with Q-Exactive hybrid quadrupole–orbitrap high-resolution mass spectrometry. The strategy was composed of sample collection, optimization sample preparation, and chromatographic and mass spectrometry conditions, establishment of MDF and BS model in CD, and structural annotation and metabolites identification. The proposed strategy was applied into the prucalopride and 47 metabolites were identified in total, among which 41 metabolites were not previously reported. Compared with other current methods, this strategy is time saving and easily processable. And this method not only can solve the crucial problem obstructing in the data processing and identification of metabolites more efficiently, but also provide convenience for confirmation of the structural reliability. Especially for identification of complex components’ metabolites, for example, natural medicine, this method could extract metabolite-related dataset based on the components one by one and obtain respective related data, and this is a great breakthrough in the field of the metabolite identification.
Data Availability Statement
The original contributions presented in the study are included in the article/Supplementary Material, further inquiries can be directed to the corresponding authors.
Ethics Statement
The animal study was reviewed and approved by The Animal Ethics Committee of First Affiliated Hospital of Zhengzhou University.
Author Contributions
LZ, LL, JW, and ZS designed the research, conducted and performed the majority of the experiment, and revised the manuscript; YY, JY, and MC assisted on supported several experimental performances and dealt with the statistical data; HZ, JK, and XZ supervised the research and revised the manuscript. All authors approved the final version to be published.
Funding
The National Natural Science Foundation of China (No. 82003921), the Open Research Fund of Beijing Key Laboratory of Bio-characteristic Profiling for Evaluation of Rational Drug Use (No.2019-KF12), the Foundation of Beijing medical and health (No.YWJKJJHKYJJ-B17818), the key scientific research project of Henan Institution of Higher Education (No.19A360008 and No. 21A320057), the Joint Construction Project of Henan Medical Science Project (No.SBGJ22002078), and the Health Science and Technology Innovation Excellent Talents Training Project for Young and Middle-aged in Henan Province (No.YXKC2020058).
Conflict of Interest
The authors declare that the research was conducted in the absence of any commercial or financial relationships that could be construed as a potential conflict of interest.
Acknowledgments
This work was supported by the National Natural Science Foundation of China (No.82003921), the Open Research Fund of Beijing Key Laboratory of Bio-characteristic Profiling for Evaluation of Rational Drug Use (No.2019-KF12), the Foundation of Beijing medical and health (No.YWJKJJHKYJJ-B17818), and the key scientific research project of Henan institution of higher education (No.19A360008 and No. 21A320057). The Joint Construction Project of Henan Medical Science Project (No.SBGJ22002078) and the Health Science and Technology Innovation Excellent Talents Training Project for Young and Middle-aged in Henan Province (No.YXKC2020058).
Supplementary Material
The Supplementary Material for this article can be found online at: https://www.frontiersin.org/articles/10.3389/fphar.2021.610226/full#supplementary-material.
Abbreviations
AIF, all-ion fragmentation; BS, background subtraction; CD, compound discovery; DD, direct dilution; HESI, heated electrospray ionization; HRMS, high-resolution mass spectrometry; IDA, information-dependent acquisition; LLE, liquid–liquid extraction; MDF, mass defect filter; PP, protein precipitation; SPE, solid phase extraction; SRM, selected reaction monitoring; UHPLC, ultra-performance liquid chromatography.
References
Balasaheb, B. C., Tiwari, S., Shankar, G., Nimbalkar, R. D., Garq, P., Srinivas, R., et al. (2018). In vitro and in vivo metabolic investigation of the Palbociclib by UHPLC-Q-TOF/MS/MS and in silico toxicity studies of its metabolites. J. Pharm. Biomed. Ana. 157, 59–74. doi:10.1016/j.jpba.2018.05.008
Blaženović, I., Kind, T., Ji, J., and Fiehn, O. (2018). Software tools and approaches for compound identification of LC-MS/MS data in metabolomics. Metabolites 8 (2), 31. doi:10.3390/metabo8020031
Chaleckis, R., Meister, I., Zhang, P., and Wheelock, C. E. (2019). Challenges, progress and promises of metabolite annotation for LC-MS-based metabolomics. Curr. Opin. Biotechnol. 55, 44–50. doi:10.1016/j.copbio.2018.07.010
Domínguez-Romero, J. C., García-Reyes, J. F., Martínez-Romero, R., Berton, P., Martínez-Lara, E., Del Moral-Leal, M. L., et al. (2013). Combined data mining strategy for the systematic identification of sport drug metabolites in urine by liquid chromatography time-of-flight mass spectrometry. Analytica Chim. Acta 761, 1–10. doi:10.1016/j.aca.2012.11.049
Gao, Y., Zhang, R., Bai, J., Xia, X., Chen, Y., Luo, Z., et al. (2015). Targeted data-independent acquisition and mining strategy for trace drug metabolite identification using liquid chromatography coupled with tandem mass spectrometry. Anal. Chem. 87, 7535–7539. doi:10.1021/acs.analchem.5b01205
Godinho, A. L. A., Martins, I. L., Nunes, J., Charneira, C., Grilo, J., Silva, D. M., et al. (2018). High resolution mass spectrometry-based methodologies for identification of Etravirine bioactivation to reactive metabolites: in vitro and in vivo approaches. Eur. J. Pharm. Sci. 119, 70–82. doi:10.1016/j.ejps.2018.03.026
Li, H., Yang, B., Cao, D., Wang, Q., Rong, L., and Zhou, X. (2018a). Identification of rotundic acid metabolites after oral administration to rats and comparison with the biotransformation by Syncephalastrum racemosum AS 3.264. J. Pharm. Biomed. Anal. 150, 406–412. doi:10.1016/j.jpba.2017.12.026
Li, Z., Lu, Y., Guo, Y., Cao, H., Wang, Q., Shui, W., et al. (2018b). Corrigendum to "Comprehensive evaluation of untargeted metabolomics data processing software in feature detection, quantification and discriminating marker selection" [ACA 1029, (2018) 50-57]. Analytica. Chim. Acta. 1044, 199. doi:10.1016/j.aca.2018.10.029
Ludwig, C., Gillet, L., Rosenberger, G., Amon, S., Collins, B. C., Aebersold, R., et al. (2018). Data-independent acquisition-based SWATH-MS for quantitative proteomics: a tutorial. Mol. Syst. Biol. 14, e8126. doi:10.15252/msb.20178126
Mahieu, N. G., and Patti, G. J. (2017). Systems-level annotation of a metabolomics data set reduces 25 000 features to fewer than 1000 unique metabolites. Anal. Chem. 89, 10397–10406. doi:10.1021/acs.analchem.7b02380
Maurer, H. H., and Meyer, M. R. (2016). High-resolution mass spectrometry in toxicology: current status and future perspectives. Arch. Toxicol. 90, 2161–2172. doi:10.1007/s00204-016-1764-1
Radko, L., and Olejnik, M. (2018). Cytotoxicity of anticancer candidate salinomycin and identification of its metabolites in rat cell cultures. Toxicol. Vitro 52, 314–320. doi:10.1016/j.tiv.2018.07.006
Roemmelt, A. T., Steuer, A. E., Poetzsch, M., and Kraemer, T. (2014). Liquid chromatography, in combination with a quadrupole time-of-flight instrument (LC QTOF), with sequential window acquisition of all theoretical fragment-ion spectra (SWATH) acquisition: systematic studies on its use for screenings in clinical and forensic toxicology and comparison with information-dependent acquisition (IDA). Anal. Chem. 86, 11742–11749. doi:10.1021/ac503144p
Shankar, G., Borkar, R. M., Udutha, S., Anagoni, S. P., and Srinivas, R. (2018). Identification and structural characterization of in vivo metabolites of balofloxacin in rat plasma, urine and feces samples using Q-TOF/LC/ESI/MS/MS : in silico toxicity studies. J. Pharm. Biomed. Anal. 159, 200–211. doi:10.1016/j.jpba.2018.06.050
Sun, Z., Zuo, L., Kang, J., Zhou, L., Jia, M., Li, Z., et al. (2016). Development and validation of a sensitive UHPLC-MS/MS method for quantitation of prucalopride in rat plasma and its application to pharmacokinetics study. J. Chromatogr. B Analyt Technol. Biomed. Life Sci. 1033-1034, 328–333. doi:10.1016/j.jchromb.2016.09.006
Wang, L., Su, B., Zeng, Z., Li, C., Zhao, X., Lv, W., et al. (2018). Ion-pair selection method for pseudotargeted metabolomics based on SWATH MS acquisition and its application in differential metabolite discovery of Type 2 diabetes. Anal. Chem. 90, 11401–11408. doi:10.1021/acs.analchem.8b02377
Wolfender, J. L., Marti, G., Thomas, A., and Bertrand, S. (2015). Current approaches and challenges for the metabolite profiling of complex natural extracts. J. Chromatogr. A. 1382, 136–164. doi:10.1016/j.chroma.2014.10.091
Xing, J., Zang, M., and Liu, H. (2017). The application of a novel high-resolution mass spectrometry-based analytical strategy to rapid metabolite profiling of a dual drug combination in humans. Anal. Chim. Acta. 993, 38–46. doi:10.1016/j.aca.2017.08.047
Xing, J., Zang, M., Zhang, H., and Zhu, M. (2015a). The application of high-resolution mass spectrometry-based data-mining tools in tandem to metabolite profiling of a triple drug combination in humans. Anal. Chim. Acta 897, 34–44. doi:10.1016/j.aca.2015.09.034
Xing, R., Zhou, L., Xie, L., Hao, K., Rao, T., Wang, Q., et al. (2015b). Development of a systematic approach to rapid classification and identification of notoginsenosides and metabolites in rat feces based on liquid chromatography coupled triple time-of-flight mass spectrometry. Anal. Chim. Acta 867, 56–66. doi:10.1016/j.aca.2015.02.039
Yao, C. L., Pan, H. Q., Wang, H., Yao, S., Yang, W. Z., Hou, J. J., et al. (2018). Global profiling combined with predicted metabolites screening for discovery of natural compounds: characterization of ginsenosides in the leaves of Panax notoginseng as a case study. J. Chromatogr. A. 1538, 34–44. doi:10.1016/j.chroma.2018.01.040
Zhou, J., and Yin, Y. (2016). Strategies for large-scale targeted metabolomics quantification by liquid chromatography-mass spectrometry. Analyst 141, 6362–6373. doi:10.1039/c6an01753c
Zhou, W., Shan, J., and Meng, M. (2018). A two-step ultra-high-performance liquid chromatography-quadrupole/time of flight mass spectrometry with mass defect filtering method for rapid identification of analogues from known components of different chemical structure types in Fructus Gardeniae-Fructus Forsythiae herb pair extract and in rat's blood. J. Chromatogr. A. 1563, 99–123. doi:10.1016/j.chroma.2018.05.067
Zhu, X., Chen, Y., and Subramanian, R. (2014). Comparison of information-dependent acquisition, SWATH, and MS(all) techniques in metabolite identification study employing ultrahigh-performance liquid chromatography-quadrupole time-of-flight mass spectrometry. Anal. Chem. 86, 1202–1209. doi:10.1021/ac403385y
Keywords: prucalopride, metabolite identification, high-resolution mass spectrometry, the entire and novel strategy, metabolic network
Citation: Zuo L, Liu L, Yang Y, Yang J, Chen M, Zhang H, Kang J, Zhang X, Wang J and Sun Z (2021) An Entire Process Optimization Strategy for Comprehensive In Vivo Metabolite Profiling of Prucalopride in Rats Based on Ultra-Performance Liquid Chromatography With Q-Exactive Hybrid Quadrupole–Orbitrap High-Resolution Mass Spectrometry. Front. Pharmacol. 12:610226. doi: 10.3389/fphar.2021.610226
Received: 25 September 2020; Accepted: 17 February 2021;
Published: 07 May 2021.
Edited by:
Olavi R Pelkonen, University of Oulu, FinlandReviewed by:
Serge Rudaz, Université de Genève, SwitzerlandMassimo Valoti, University of Siena, Italy
Copyright © 2021 Zuo, Liu, Yang, Yang, Chen, Zhang, Kang, Zhang, Wang and Sun. This is an open-access article distributed under the terms of the Creative Commons Attribution License (CC BY). The use, distribution or reproduction in other forums is permitted, provided the original author(s) and the copyright owner(s) are credited and that the original publication in this journal is cited, in accordance with accepted academic practice. No use, distribution or reproduction is permitted which does not comply with these terms.
*Correspondence: Zhi Sun, c3VuemhpMjAxM0AxNjMuY29t; Jiabo Wang, cGhhcm1fc2NpQDEyNi5jb20=
†These authors have contributed equally to this work and share first authorship