 Sangwoo Seo1
 Youngmin Kim2*
 Hyo-Jeong Han3
 Woo Chan Son3*
 Zhen-Yu Hong4
 Insuk Sohn4
 Jooyong Shim5
 Changha Hwang1,2*
- 1Department of Data and Knowledge Service Engineering, Dankook University, Gyeonggido, Korea
- 2Department of Statistics, Dankook University, Gyeonggido, Korea
- 3Department of Pathology, College of Medicine, University of Ulsan, Asan Medical Center, Seoul, Korea
- 4Arontier, Seoul, Korea
- 5Department of Statistics, Institute of Statistical Information, Inje University, Gyeongsangnamdo, Korea
Despite several improvements in the drug development pipeline over the past decade, drug failures due to unexpected adverse effects have rapidly increased at all stages of clinical trials. To improve the success rate of clinical trials, it is necessary to identify potential loser drug candidates that may fail at clinical trials. Therefore, we need to develop reliable models for predicting the outcomes of clinical trials of drug candidates, which have the potential to guide the drug discovery process. In this study, we propose an outer product–based convolutional neural network (OPCNN) model which integrates effectively chemical features of drugs and target-based features. The validation results via 10-fold cross-validations on the dataset used for a data-driven approach PrOCTOR proved that our OPCNN model performs quite well in terms of accuracy, F1-score, Matthews correlation coefficient (MCC), precision, recall, area under the curve (AUC) of the receiver operating characteristic, and area under the precision–recall curve (AUPRC). In particular, the proposed OPCNN model showed the best performance in terms of MCC, which is widely used in biomedicine as a performance metric and is a more reliable statistical measure. Through 10-fold cross-validation experiments, the accuracy of the OPCNN model is as high as 0.9758, F1 score is as high as 0.9868, the MCC reaches 0.8451, the precision is as high as 0.9889, the recall is as high as 0.9893, the AUC is as high as 0.9824, and the AUPRC is as high as 0.9979. The results proved that our OPCNN model shows significantly good prediction performance on outcomes of clinical trials and it can be quite helpful in early drug discovery.
Introduction
Over the past 30 years, failures at all phases of clinical trials have increased rapidly for safety reasons (Ledford, 2011; Hay et al., 2014; Lysenko et al., 2018; Liu et al., 2021). This phenomenon happens despite significant improvements at all stages of the drug development pipeline (Scannell et al., 2012). There have been many improvements in screening for drugs that are likely to fail clinical trials.
Drug-likeness scores are widely utilized as a useful guideline for eliminating toxic molecules during the early stages of drug development. This concept was first introduced by Lipinski’s rule of five (Ro5), which screens molecules with a low probability of useful oral activity due to poor absorption or permeation (Lipinski et al., 1997). That is to say, the Ro5 enhanced the drug discovery process because it helps in distinguishing between drug-like and nondrug-like molecules. However, Lipinski argued that the Ro5 is a very conservative strategy because this rule does not guarantee drug-likeness (Lipinski, 2004). To enhance the Ro5, Veber’s rule and Ghose’s rule were proposed (Ghose et al., 1999; Veber et al., 2002). The quantitative estimate for drug-likeness (QED) was also recently proposed as an alternative to rule-based methods (Bickerton et al., 2012).
Despite lots of advances in identifying potentially toxic drugs, overall failure rates of clinical trials continued to increase (Hay et al., 2014). To deal with this problem, Gayvert et al. recently proposed a new data-driven approach PrOCTOR, which predicts the odds of clinical trial outcomes on the basis of random forests that integrates chemical properties of drugs and target-based properties (Gayvert et al., 2016). It was exhibited that both the chemical features and target-related gene expression values contribute to effective classification. In this study, we will also use the chemical features of drugs and target-based features for predicting successes and failures of clinical trials. Lo et al. applied machine learning techniques to predict the outcomes of randomized clinical trials using drug development and clinical trial data (Lo et al., 2019). Munos et al. improved the prediction of clinical success using machine learning algorithms based on a large database of projects (Munos et al., 2020).
Modeling the relationship between chemical structure of drug and molecular activity is very important for drug development for precision medicine. In this study, we employ a novel outer product–based convolutional neural network (OPCNN) to integrate effectively chemical features of the drugs, biological network features, genotype-tissue expression (GTEx) features, and target loss frequency. The purpose of this research is to propose a two-dimensional (2D) convolutional neural network (CNN) based on the outer product of chemical feature vector and a target-based feature vector to predict successes and failures of clinical trials.
Materials and Methods
Dataset
We evaluated our proposed OPCNN using the same dataset as in Gayvert et al. (Gayvert et al., 2016), which consists of 757 approved drugs for positive class and 71 failed drugs for negative class. We notice that the dataset is imbalanced. The imbalance ratio of majority to minority compounds is 10.662. The set of 47 input features describing each drug contains 10 molecular properties, 34 target-based properties, and three drug-likeness rule outcomes for the Lipinski’s rule of five, Veber’s, and Ghose’s rules. There are several missing values for six features. We impute them with relevant median values. Molecular properties represent molecular weight, XLogP, polar surface area, hydrogen bond donor and acceptor counts, formal charge, number of rings, rotatable bond count, refractivity, and logP solubility. For a set of 30 target-based features, we use the median expression of each drug’s known gene targets in 30 different tissues, including the blood, skin, brain, liver, testis, muscle, nerve, and heart, calculated from the GTEx project. For three other target-based features, we use the network connectivity of the target, with the gene degree feature and betweenness feature computed using an aggregated gene–gene interaction network. We also use a feature that represents the loss-of-function mutation frequency in the target gene.
Model Development
The Proposed OPCNN Classifier
The problem of predicting clinical successes and failures of clinical trials is modeled as a binary classification task. For a given drug
Figure 1 explains the entire workflow of the proposed OPCNN classifier for the prediction of successes and failures in clinical trials. Our OPCNN consists of three residual blocks and five fully connected (FC) layers. Each residual block has three convolution layers, each of which employs 32 kernels with kernel size 3 and stride size 1, and the rectified linear unit (ReLU) activation function. The numbers in parentheses of FC(1), FC(50), and FC(100) indicate the number of nodes. FC(1) layer employs the sigmoid activation function. Both FC(50) and FC(100) layers employ the rectified linear unit (ReLU) activation function. Our method consists of two stages. First, the representative feature vectors of chemical feature vector and target-based feature vector are calculated and then the outer products between these two representative feature vectors are calculated. Second, a 2D CNN model is adopted to extract deep features from the outer products and to predict successes and failures of clinical trials.

FIGURE 1. A workflow of the proposed OPCNN classifier for predicting successes and failures of clinical trials. Given an outer product of two representative feature vectors as an input, 2D CNN is used to learn features. The architecture of OPCNN consists of three residual blocks and five fully connected (FC) layers. Each residual block has three convolution layers. (A) OPCNN classifier (B) Residual block.
The process of calculating the outer product is as follows. The chemical feature vector
Here,
Other Deep Multimodal Neural Networks
Classification with multimodal data often occurs in many machine learning applications (Baltrušaitis et al., 2019; Gao et al., 2020). Multimodal learning is an effective approach to combine information from multiple modalities to perform a prediction task. The modalities may be independent or correlated. Fusing multiple modalities is a key issue in any multimodal task. In general, the fusion of multiple modalities can be achieved at three levels: at the level of features or at a lower layer, at the intermediate level, and at the level of decisions. Fusion at the feature level or at a lower layer is called early fusion. On the other hand, fusion at the intermediate layer is called intermediate fusion, whereas fusion at the level of decisions is called late fusion. Because early and late fusions can generally suppress either intra-modality or inter-modality interactions, recent studies have focused on intermediate methods that allow fusion to occur on multiple layers of a deep model.
Figure 2 illustrates a graphical representation for deep multimodal neural network (DMNN) models associated with the early, intermediate, and late fusions used in the study. As seen from Figure 2, each DMNN model consists of several FC layers. The number in parentheses indicates the number of nodes. As in Figure 1, the FC(1) layer employs the sigmoid activation function. Both FC(50) and FC(100) layers employ the ReLU activation function. In the case of early fusion, each modality is first fed into an FC(50) layer before fusion in order to improve performance and to apply several fusion techniques. However, the standard early fusion allows multiple modalities to be directly concatenated to produce a single multimodal vector. In the case of intermediate and late fusions, each modality is fed into an independent deep neural network (DNN) and then fused to be the inputs of higher layers. The final representation is used for the classification task.
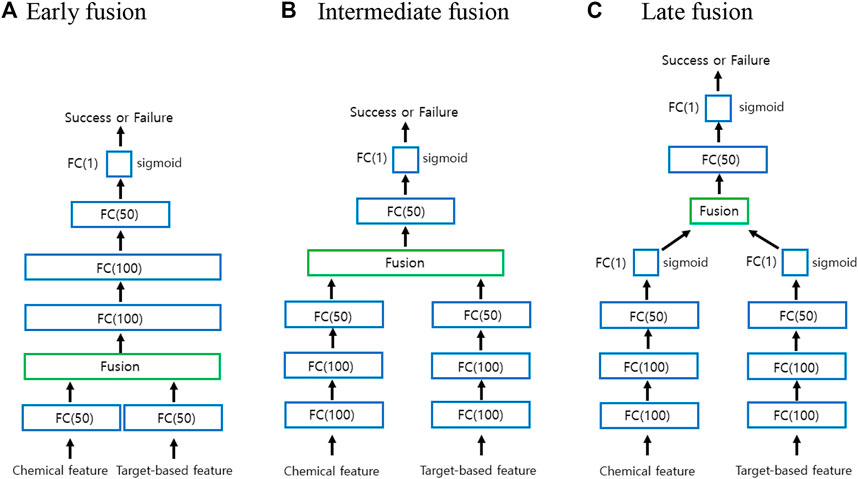
FIGURE 2. Graphical representation for the early, intermediate, and late fusions. (A) Early fusion (B) Intermediate fusion (C) Late fusion.
Based on the literature, five fusion operations are often used to fuse multiple modalities (Feng et al., 2021): Eq. 1 addition, Eq. 2 product, Eq. 3 concatenation, Eq. 4 ensemble, and Eq. 5 mixture of experts. Addition and product operations are performed in terms of elements at the fusion layer. Here, we will consider two more multimodal fusion techniques based on tensor fusion layer (TFL) (Zadeh et al., 2017) and multimodal circulant fusion (MCF) (Wu and Han, 2018) for early and intermediate fusions. When using TFL and MCF for the intermediate fusion, we actually use the DMNN model with FC(100)-FC(50) instead of FC(100)-FC(100)-FC(50) for each modality to improve its performance.
In general, the early fusion approach performs better than individual unimodal classifiers. The ensemble approach called late fusion is to weigh several individual classifiers and combine them to get a classifier that surpasses individual classifiers. In general, ensemble methods provide better results when there are significant differences among the models. Therefore, many ensemble methods try to enhance diversity among the models to be combined. Based on our preliminary studies, the unimodal classifiers using only chemical features perform better than unimodal classifiers using only target-based features. We actually have tried three different ensemble models using support vector machine (SVM) (Vapnik, 1995) and one-dimensional CNN and our DMNN for the late fusion in Figure 2. Note that our DMNN model uses only concatenation technique for late fusion. Since our DMNN ensemble model has shown the best performance, we will only report those results later.
Tensor Fusion Layer and Multimodal Circulant Fusion
We now briefly illustrate TFL and MCF strategies. Element-wise addition and product are used to join features from multiple modalities. Concatenation technique focuses more on learning intra-modality than learning inter-modality. However, both TFL and MCF capture both intra-modality and inter-modality dynamics. TFL also employs the same outer product on the augmented unimodal as in our OPCNN.
We first illustrate the idea of TFL strategy to fuse multimodal data at the tensor level. For our studies, we need to build a TFL that disentangles unimodal and bimodal dynamics. Given representative feature vectors
We now briefly illustrate the idea of MCF strategy which consists of four steps. Given representative feature vectors
where
where
Here,
Here,
Imbalanced Data Learning
Since the ratio of passed drugs to failed drugs in clinical trials is highly imbalanced, the class-imbalance problem occurs. There are generally three types of methods to deal with the imbalance data learning (Wang et al., 2019). We briefly illustrate the methods to be actually used in the study. 1) Sampling method: an intuitive way to cope with the imbalanced distribution of the data is to balance class distributions via resampling, which could oversample the minority class and undersample the majority class. One advanced sampling method called synthetic minority oversampling technique (SMOTE) creates artificial examples through interpolating neighboring data points (Chawla et al., 2002). Several variants of this technique have been proposed. However, oversampling can lead to overfitting due to repeatedly visiting the existing minority samples. On the other hand, undersampling can discard potentially useful information in majority samples. 2) Cost-sensitive learning method: instead of balancing class distributions via sampling methods, this method aims at coping with the abovementioned issues by directly imposing a heavier cost on misclassifying the minority class. However, what types of cost to use in different problem settings is still an open problem. In this study, we use the cost-sensitive learning method using the class weights (CWs)
Classification Evaluation Metrics
To evaluate binary classifications, we can employ various statistical metrics, accordingly to the goal of the experiment we are performing. Accuracy and F1-score have been among the most quintessential metrics for binary classification problems. Accuracy is a valid evaluation metric for classification problems which are well balanced and not skewed or no class imbalance. In general, accuracy can dangerously show overoptimistic inflated results, especially on imbalanced datasets. F1-score is the harmonic mean of precision and recall, and thus F1-score maintains a balance between the precision and recall for classifier. F1-score is a measure of accuracy, which takes both false positives and false negatives into account. F1-score is usually more useful than accuracy especially for imbalanced classification. Precision and recall are two extremely important model evaluation metrics. While precision measures the probability of correct detection of positive values, recall measures the ability to distinguish between the classes. Area under the curve (AUC) of the receiver operating characteristic (ROC) and the area under the precision–recall curve (AUPRC) are ranking order metrics. AUPRC is often used as evaluation metrics for imbalanced classes. AUPRC is preferred over AUC. When comparing performance of classifiers that need to deal with imbalanced data, F1-score, precision–recall, and AUPRC are often used out of convenience (Brabec et al., 2020).
The use of inadequate performance metrics, such as accuracy, lead to poor generalization results because the classifiers tend to predict the largest size class. Matthews correlation coefficient (MCC) is widely used in biomedicine as a performance metric. The MCC is a more reliable statistical measure which produces a high score only if the prediction obtained good results in all of the four confusion matrix categories (true positives, false negatives, true negatives, and false positives), proportional to both the size of positive elements and the size of negative elements in the dataset (Chicco and Jurman, 2020; Ietswaart et al., 2020). MCC is easier to interpret as a correlation coefficient since it takes a value in the interval
The performance of the prediction models of successes and failures of clinical trials is evaluated using the following statistical metrics: TN (true negative), FN (false negative), TP (true positive), FP (false positive), PR (precision), RE (recall), ACC (accuracy), F1-score, MCC, AUC, and AUPRC, which are defined in the following equations:
Experiments and Results
As mentioned before, we use the same dataset as in Gayvert et al. (Gayvert et al., 2016), which consists of 757 passed drugs for positive class and 71 failed drugs for negative class. We notice that the dataset is imbalanced. The imbalance ratio of majority to minority compounds is 10.662. The dataset used may not have enough samples for the use of deep learning. We use 10-fold cross-validation techniques to evaluate classification models. The folds are stratified based on drugs. That is to say, all experiments of a single drug are either completely in the training set or completely in the test set. Thus, a model is expected to predict the clinical outcomes of previously unseen drugs at test time. We conduct these 10-fold cross-validation experiments, randomly splitting ten folds. To obtain reliable performance results, we repeat the cross-validation 20 times for each model on the dataset, and report the mean and standard deviation for each metric.
We select OPCNN as a good model for this particular data. Early experiments with different models did not yield meaningful results. To take into account the class imbalance, we use cost-sensitive learning and hybrid methods. We use binary cross entropy (BCE) as the loss function. We investigate the effect of employing weighted BCE and SMOTE to address the imbalance in our training dataset. Adam optimizer is used for training the neural networks. While the learning rate for Adam optimizer is tuned separately for each model and dataset pair, the same set of hyperparameters is used across the folds. We select hyperparameters such as the number of layers and the number of nodes for OPCNN and DMNN, which provide the best MCC value based on a 10-fold cross-validation.
Deep learning models are likely to overfit the training data since the data used do not have sufficient samples. Therefore, we consider two conventional machine learning models such as SVM and random forest for comparison since these models alleviate overfitting by ensemble and regularization techniques, respectively. 47 input features are first concatenated to be used as inputs of these two models. For the case of SVM, the polynomial kernel of degree 3 and penalty constant
To statistically evaluate the significant improvement of our OPCNN, we utilize the two sided
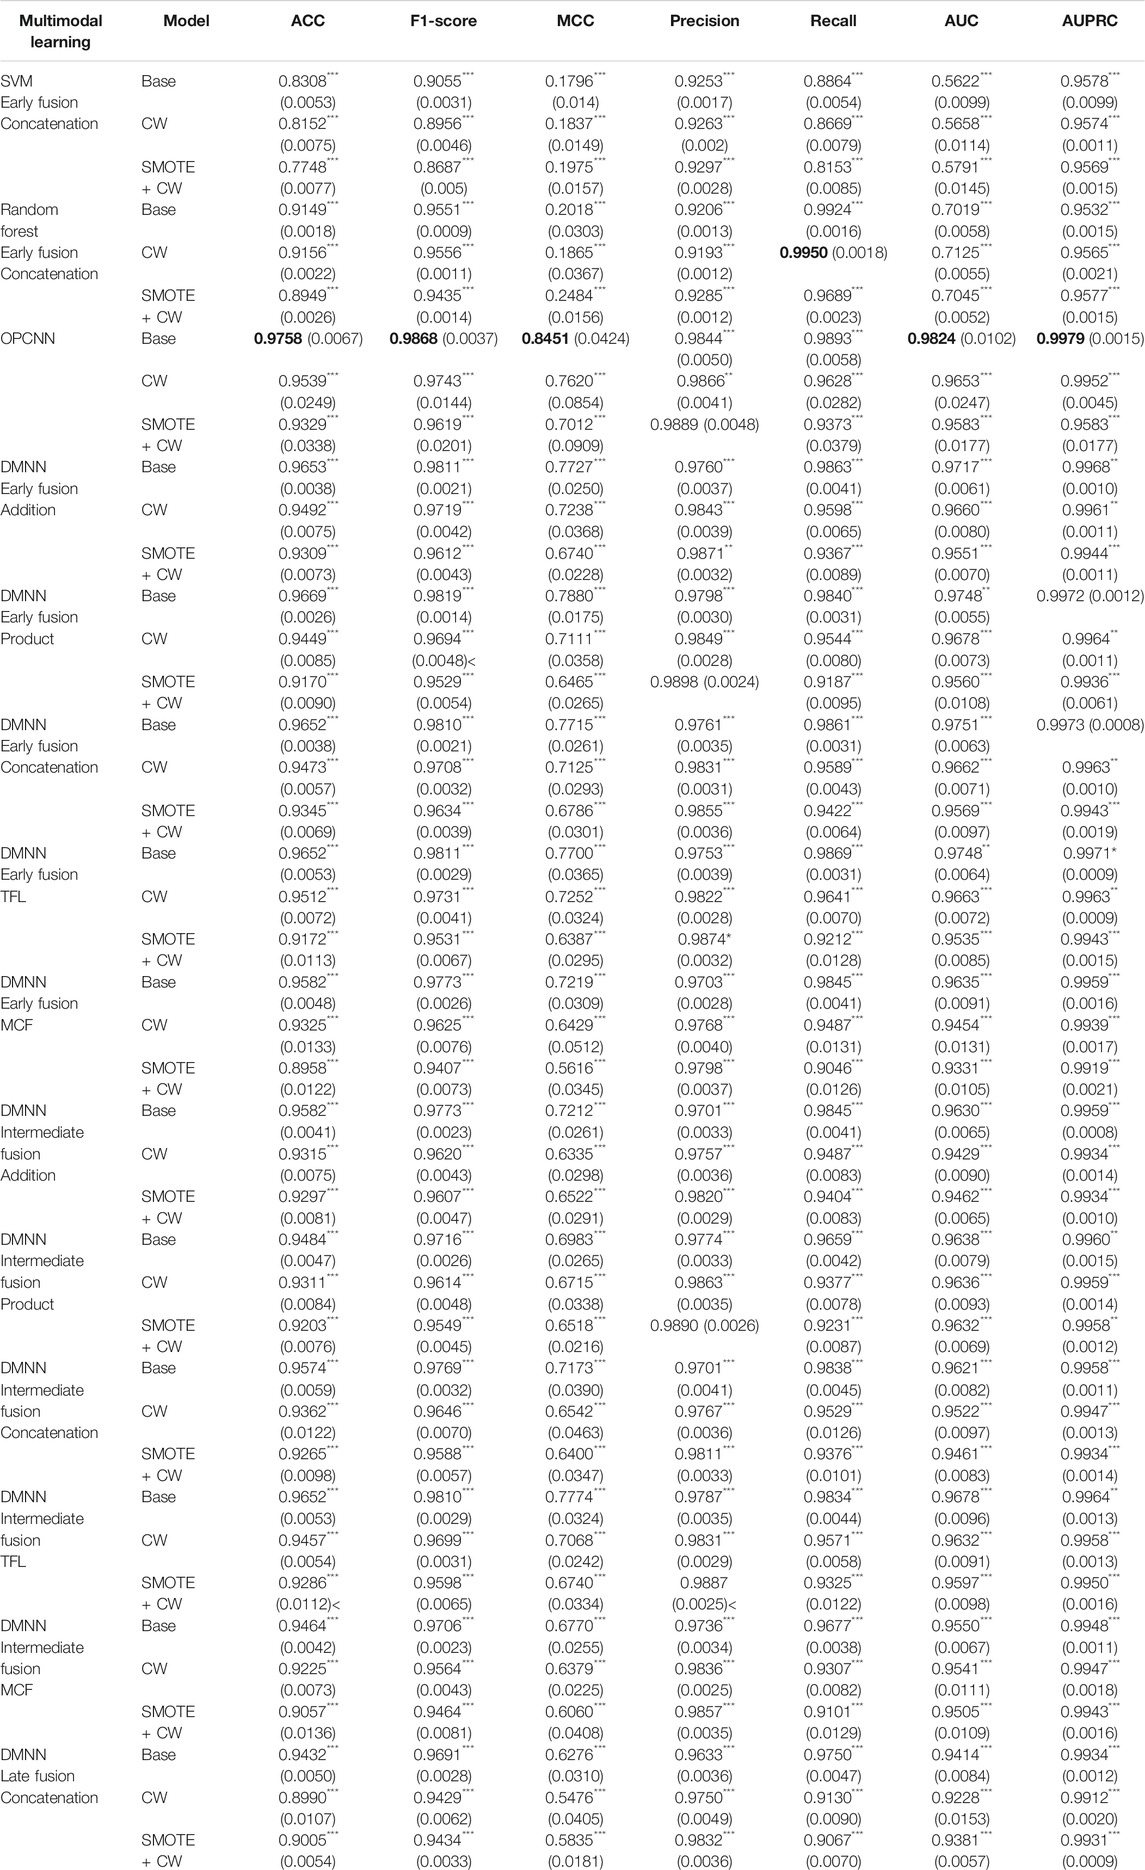
TABLE 1. Classification results for various prediction models via a 10-fold cross-validation.
Table 1 shows the comparison of various prediction models via a 10-fold cross-validation, each of which is trained based on the imbalanced training dataset with or without balancing the class frequencies. We calculate means and standard deviations of the ACC, F1-score, MCC, precision, recall, AUC, and AUPRC. Boldfaced values indicate best performance result. Standard errors are given in parenthesis. As seen from Table 1, OPCNN and DMNN models overall show better results than SVM and RF for all evaluation metrics except recall. The OPCNN base model shows the highest ACC, F1-score, MCC, AUC, and AUPRC averages, which are 0.9758, 0.9868, 0.8451, 0.9824, and 0.9979, respectively. In particular, OPCNN base model significantly outperforms the other models for both F1-score and MCC that are good metrics for the imbalanced classification. Although OPCNN base model does not show the highest precision and recall averages, it still shows evenly high precision and recall averages. The DMNN base model using product operation at the early fusion step shows the second highest ACC, F1-score, and MCC averages, which are 0.9669, 0.9819, and 0.7880, respectively. If classification successes and errors must be considered together, then the MCC arises as the best choice (Luque et al., 2019). Therefore, we prefer to use MCC to assess classification performance in this study. Compared to other models, the OPCNN base model shows a significantly higher MCC average. To conclude, Table 1 shows that OPCNN base model is the best model for predicting successes and failures of clinical trials.
Plotting ROC and precision–recall curves is a popular way for discriminatory accuracy visualization of the binary classification models. Figure 3 shows the graph of ROC curves and precision–recall curves for three best-performing models in terms of AUC and AUPRC, respectively. Since we replicate the cross-validation 20 times for each model, we here show curves only for one replication. Figure 3 shows that the OPCNN base model is a better classifier. By the way, Table 1 illustrates that AUC averages of these three models differ significantly but AUPRC averages of these three models do not differ significantly.
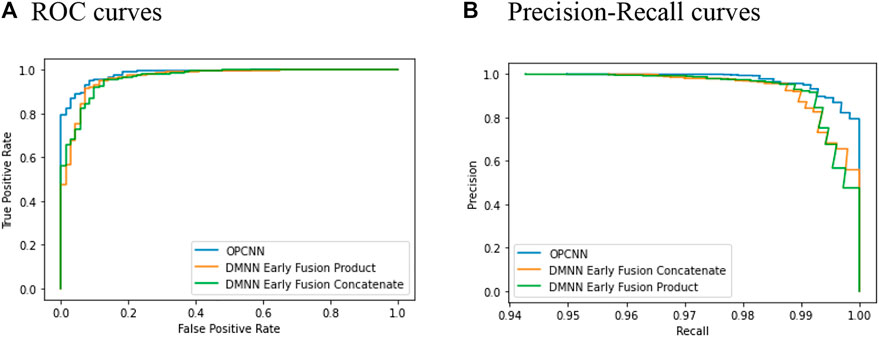
FIGURE 3. ROC and precision–recall curves for 10-fold cross-validation. (A) ROC curves (B) Precision–recall curves.
Conclusion
In this study, to develop the prediction model of the outcomes of clinical trials of drug candidates, we proposed OPCNN model that employs the augmented outer product to join effectively chemical features of drugs and target-based features. The proposed OPCNN model was evaluated via 10-fold cross-validation techniques on dataset used in Gayvert et al. (Gayvert et al., 2016), which consists of 757 approved drugs for positive class and 71 failed drugs for negative class. We observed that the OPCNN base model shows the highest averages of ACC, F1-score, MCC, AUC, and AUPRC. In particular, it is noteworthy that the OPCNN base model showed the highest averages of F1-score, MCC, and AUPRC, which are more reliable metrics for the imbalanced classification. The two-sided
Although we did not report the experimental results, we also conducted experiments on ensemble models based on RFs, extra trees, and weighted least squares SVM. In addition, we performed experiments on a DMNN using a one-dimensional CNN for each individual modality. OPCNN and DMNN models aforementioned performed much better than those of ensemble models for all of five evaluation metrics. The purpose of this study is to develop an efficient predictive model based on the dataset used in Gayvert et al. (Gayvert et al., 2016). The key idea underlying OPCNN is to integrate two modalities using the augmented outer product and to apply CNN to the resulting matrix. We think this idea can be effectively applied to other tasks based on bimodal data and can be extended to multimodal data. The OPCNN model can be further improved by adjusting the architecture of CNN according to the data structure.
A critical issue is that the dataset does not have enough samples for the use of deep learning and particularly has only 71 samples for failure data. Therefore, OPCNN and DMNN could overfit the data since these complex models are likely to detect subtle patterns in the data. Obviously, these patterns will not generalize to new instances. Therefore, we need to apply our OPCNN to a larger dataset and check its efficacy. Furthermore, we need to carefully argue that our OPCNN is an effective approach for predicting successes and failures of clinical trials and can be quite helpful in drug development process.
Data Availability Statement
The dataset and source code for this paper can be downloaded from the Github repository at https://github.com/sawoo9410/Clinical-Trials-with-OPCNN.
Author Contributions
SS and YK performed the experiment. HH, WS, ZH, IS, JS, and CH proposed the problem to tackle. IS, JS, and CH wrote the main manuscript text. All authors reviewed the manuscript.
Funding
This research was supported by the Bio and Medical Technology Development Program of the National Research Foundation (NRF) funded by the Korean government (MSIT) (No. 2019M3E5D4066897). This work was supported by the National Research Foundation of Korea (NRF) grant funded by the Korean government (MSIT) (No. 2020R1F1A1A01061099). This work was supported by the Korea Institute of Energy Technology Evaluation and Planning (KETEP) and the Ministry of Trade, Industry and Energy (MOTIE) of the Republic of Korea (No. 20212020800120).
Conflict of Interest
ZH and IS were employed by the company Arontier.
The remaining authors declare that the research was conducted in the absence of any commercial or financial relationships that could be construed as a potential conflict of interest.
References
Baltrušaitis, T., Ahuja, C., and Morency, L. (2019). Multimodal Machine Learning: A Survey and Taxonomy. IEEE Trans. Pattern Anal. Machine Intelligence 15, 850–863.
Bickerton, G. R., Paolini, G. V., Besnard, J., Muresan, S., and Hopkins, A. L. (2012). Quantifying the Chemical beauty of Drugs. Nat. Chem. 4, 90–98. doi:10.1038/nchem.1243
Brabec, J., Komárek, T., Franc, V., and Machlica, L. (2020). On Model Evaluation under Non-constant Class Imbalance. Available at: https://arxiv.org/pdf/2001.05571.
Chawla, N. V., Bowyer, K. W., Hall, L. O., and Kegelmeyer, W. P. (2002). SMOTE: Synthetic Minority Over-sampling Technique. jair 16, 321–357. doi:10.1613/jair.953
Chicco, D., and Jurman, G. (2020). The Advantages of the Matthews Correlation Coefficient (MCC) over F1 Score and Accuracy in Binary Classification Evaluation. BMC Genomics 21 (1). doi:10.1186/s12864-019-6413-7
Feng, D., Haase-Schuetz, C., Rosenbaum, L., Hertlein, H., Duffhauss, F., Glaeser, C., et al. (2021). Deep Multi-Modal Object Detection and Semantic Segmentation for Autonomous Driving: Datasets, Methods, and Challenges. IEEE Trans. Intell. Transportation Syst. in press.
Gao, J., Li, P., Chen, Z., and Zhang, J. (2020). A Survey on Deep Learning for Multimodal Data Fusion. Neural Comput. 32, 829–864. doi:10.1162/neco_a_01273
Gayvert, K. M., Madhukar, N. S., and Elemento, O. (2016). A Data-Driven Approach to Predicting Successes and Failures of Clinical Trials. Cel. Chem. Biol. 23, 1294–1301. doi:10.1016/j.chembiol.2016.07.023
Ghose, A. K., Viswanadhan, V. N., and Wendoloski, J. J. (1999). A Knowledge-Based Approach in Designing Combinatorial or Medicinal Chemistry Libraries for Drug Discovery. 1. A Qualitative and Quantitative Characterization of Known Drug Databases. J. Comb. Chem. 1, 55–68. doi:10.1021/cc9800071
Hay, M., Thomas, D. W., Craighead, J. L., Economides, C., and Rosenthal, J. (2014). Clinical Development success Rates for Investigational Drugs. Nat. Biotechnol. 32, 40–51. doi:10.1038/nbt.2786
Ietswaart, R., Arat, S., Chen, A. X., Farahmand, S., Kim, B., DuMouchel, W., et al. (2020). Machine Learning Guided Association of Adverse Drug Reactions with In Vitro Target-Based Pharmacology. EBioMedicine 57, 102837. doi:10.1016/j.ebiom.2020.102837
Ledford, H. (2011). Translational Research: 4 Ways to Fix the Clinical Trial. Nature 477, 526–528. doi:10.1038/477526a
Lipinski, C. A. (2004). Lead- and Drug-like Compounds: the Rule-Of-Five Revolution. Drug Discov. Today Tech. 1, 337–341. doi:10.1016/j.ddtec.2004.11.007
Lipinski, C. A., Lombardo, F., Dominy, B. W., and Feeney, P. J. (1997). Experimental and Computational Approaches to Estimate Solubility and Permeability in Drug Discovery and Development Settings. Adv. Drug Deliv. Rev. 23, 3–25. doi:10.1016/s0169-409x(96)00423-1
Liu, A., Walter, M., Wright, P., Bartosik, A., Dolciami, D., Elbasir, A., et al. (2021). Prediction and Mechanistic Analysis of Drug-Induced Liver Injury (DILI) Based on Chemical Structure. Biol. Direct 16, 6. doi:10.1186/s13062-020-00285-0
Lo, A. W., Siah, K. W., and Wong, C. H. (2019). Machine Learning with Statistical Imputation for Predicting Drug Approval. Harv. Data Sci. Rev. 1. doi:10.1162/99608f92.5c5f0525
Luque, A., Carrasco, A., Martín, A., and de las Heras, A. (2019). The Impact of Class Imbalance in Classification Performance Metrics Based on the Binary Confusion Matrix. Pattern Recognition 91, 216–231. doi:10.1016/j.patcog.2019.02.023
Lysenko, A., Sharma, A., Boroevich, K. A., and Tsunoda, T. (2018). An Integrative Machine Learning Approach for Prediction of Toxicity-Related Drug Safety. Life Sci. Alliance 1 (6), e201800098. doi:10.26508/lsa.201800098
Munos, B., Niederreiter, J., and Riccaboni, M. (2020). Improving the Prediction of Clinical success Using Machine Learning. medRxiv preprint. doi:10.1101/2021.02.01.21250864
Scannell, J. W., Blanckley, A., Boldon, H., and Warrington, B. (2012). Diagnosing the Decline in Pharmaceutical R&D Efficiency. Nat. Rev. Drug Discov. 11, 191–200. doi:10.1038/nrd3681
Vapnik, V. (1995). The Nature of Statistical Learning Theory. Springer. doi:10.1007/978-1-4757-2440-0
Veber, D. F., Johnson, S. R., Cheng, H.-Y., Smith, B. R., Ward, K. W., and Kopple, K. D. (2002). Molecular Properties that Influence the Oral Bioavailability of Drug Candidates. J. Med. Chem. 45, 2615–2623. doi:10.1021/jm020017n
Wang, Y., Gan, W., Wu, W., and Yan, J. (2019). Dynamic Curriculum Learning for Imbalanced Data Classification. CoRR abs/ 1901, 06783.
Wu, A., and Han, Y. (2018). Multi-modal Circulant Fusion for Video-To-Language and Backward. Proceedings of the 27th International Joint Conference on Artificial Intelligence, Stockholm, Sweden, July 13–19, 2018, 1029–1035.
Keywords: clinical trial, convolutional neural network, multimodal learning, outer product, imbalance
Citation: Seo S, Kim Y, Han H-J, Son WC, Hong Z-Y, Sohn I, Shim J and Hwang C (2021) Predicting Successes and Failures of Clinical Trials With Outer Product–Based Convolutional Neural Network. Front. Pharmacol. 12:670670. doi: 10.3389/fphar.2021.670670
Received: 23 February 2021; Accepted: 24 May 2021;
Published: 16 June 2021.
Edited by:
Ke-Vin Chang, National Taiwan University Hospital, TaiwanReviewed by:
Tao Huang, Shanghai Institute of Nutrition and Health (CAS), ChinaKhanh N. Q. Le, Taipei Medical University, Taiwan
Giuseppe Jurman, Bruno Kessler Foundation, Italy
Copyright © 2021 Seo, Kim, Han, Son, Hong, Sohn, Shim and Hwang. This is an open-access article distributed under the terms of the Creative Commons Attribution License (CC BY). The use, distribution or reproduction in other forums is permitted, provided the original author(s) and the copyright owner(s) are credited and that the original publication in this journal is cited, in accordance with accepted academic practice. No use, distribution or reproduction is permitted which does not comply with these terms.
*Correspondence: Youngmin Kim, ZHVkYWxzNDA1MUBnbWFpbC5jb20=; Woo Chan Son, d2Nzb25AYW1jLnNlb3VsLmty; Changha Hwang, Y2h3YW5nQGRhbmtvb2suYWMua3I=