- 1Health and Safety Executive, Harpur Hill, Buxton, United Kingdom
- 2European Commission Joint Research Centre, Ispra, Italy
A computational workflow which integrates physiologically based kinetic (PBK) modelling; global sensitivity analysis (GSA), Approximate Bayesian Computation (ABC), Markov Chain Monte Carlo (MCMC) simulation and the Virtual Cell Based Assay (VCBA) for the estimation of the active, free in vitro concentration of chemical in the reaction medium was developed to facilitate quantitative in vitro to in vivo extrapolation (QIVIVE). The workflow was designed to estimate parameter and model uncertainty within a computationally efficient framework. The workflow was tested using a human PBK model for bisphenol A (BPA) and high throughput screening (HTS) in vitro concentration-response data, for estrogen and pregnane X receptor activation determined in human liver and kidney cell lines, from the ToxCast/Tox21 database. In vivo benchmark dose 10% lower confidence limits (BMDL10) for oral uptake of BPA (ng/kg BW/day) were calculated from the in vivo dose-responses and compared to the human equivalent dose (HED) BMDL10 for relative kidney weight change in the mouse derived by European Food Safety Authority (EFSA). Three from four in vivo BMDL10 values calculated in this study were similar to the EFSA values whereas the fourth was much smaller. The derivation of an uncertainty factor (UF) to accommodate the uncertainties associated with measurements using human cell lines in vitro, extrapolated to in vivo, could be useful for the derivation of Health Based Guidance Values (HBGV).
1 Introduction
The modern ecosystem is replete with chemicals of anthropogenic and natural origin. These chemicals are both ubiquitous and diverse and present a considerable health risk assessment challenge. People are exposed in their homes, workplaces, by the use of pharmaceuticals, cosmetics and cleaning products and from the contamination of food. Anthropogenic contaminants found in our food include pesticides, biocides, food and feed additives, pharmaceuticals, air pollutants, persistent organic pollutants, heavy metals, perfluoroalkyl substances, brominated flame retardants, dioxins etc., and those of natural origin (marine biotoxins, mycotoxins etc.).
In the risk assessment of a given chemical, a “critical” toxicity study is one in which a key apical endpoint that is, an observable clinical outcome or pathology indicative of a disease resulting from exposure to the chemical, is identified based on the elicitation and dose-response relationship of an adverse effect in animal studies. Such a dose or concentration, known as the reference point (RP) or point of departure (PoD), is defined as the point on a toxicological dose–response curve established from experimental data that corresponds to an estimated no-observed-adverse-effect-level (NOAEL), lowest-observed-adverse- effect-level (LOAEL) or preferably, a benchmark dose (BMD). PoDs are used as the basis for the derivation of safe levels of human exposure known as Health Based Guidance Values (HBGV) (Ingenbleek L et al., 2021).
The most common RPs or PoDs are the NOAEL and the BMD. The NOAEL approach uses statistical methods to identify the test dose that has no significant effect compared to the control group. The BMD approach, however, fits a dose–response model(s) to a complete dose–response dataset to identify the benchmark dose lower and upper confidence limits (BMDL and BMDU) for a selected observed level of effect, the benchmark response (BMR) (e.g., a 5% response). The BMD is increasingly preferred by regulatory agencies, but its use is often limited by test design (Bokkers and Slob 2005, 2007; European Food Safety 2009; EFSA Scientific Committee et al., 2017b).
However, the reliance on toxicological studies, conducted using laboratory animals for the derivation of RPs and HBGVs, is being challenged. The international scientific community has been involved in considerable research and validation efforts to reduce animal testing and provide alternative-to-animal testing methods. These are known as new approach methods (NAMs).
Alternative-to-animal methods invariably refer to an in vitro bioassay based strategy that ideally uses human cell lines for the determination of a RP. Invariably, in vitro concentration-response data must be converted to in vivo dose-responses to be used in human safety testing of chemicals. This activity is known as quantitative in vitro to in vivo extrapolation (QIVIVE) (Yoon et al., 2012; Bale et al., 2014; Yoon et al., 2015). Examples of QIVIVE increasingly involve the application of physiologically-based kinetic (PBK) modelling-based reverse dosimetry for the translation of in vitro to in vivo responses and the derivation of in vivo BMDs (Louisse et al., 2010; Louisse et al., 2012; Strikwold et al., 2013; Louisse et al., 2016; Boonpawa et al., 2017a, 2017b; Li et al., 2017; Punt et al., 2017; Strikwold et al., 2017; Adam et al., 2019; Zhao et al., 2019; Shi et al., 2020; Zhang et al., 2020). In these studies, all parameters, other than input dose or exposure, are held fixed at central values. An optimisation routine is implemented to minimise the discrepancy between a target in vivo concentration, predicted by the PBK model, and a given in vitro concentration. The dose concentration which corresponds to the target in vitro concentration, is considered a surrogate for the in vivo concentration. However, these studies did not account for structural uncertainty in the PBK model nor parameter value uncertainty. It is known that the amount of biological mechanistic detail described in a PBK model could have a bearing on model output (Rowland et al., 2017). Also, understanding and quantifying the level of uncertainty in each step of a chemical safety assessment with NAMs is important for the development of confidence in this approach (Berggren et al., 2017).
Another limitation of past QIVIVE studies was the use of applied or nominal in vitro concentrations only, that is, no consideration was made of the fate and distribution of the chemical in the reaction vessel. This could be a significant omission because the concentrations of chemical available for interaction with sub-cellular protein receptors and enzymes could be substantially lower than the nominal concentration (Tanneberger et al., 2010; Groothuis et al., 2015; Kramer et al., 2015; Proença et al., 2021). Chemicals have different properties, for instance highly lipophilic chemicals can interact with constituents of the reaction medium as well as reaction vessel geometry and composition. For example, the chemical can migrate and bind to the plastic of the reaction vessel (Proença et al., 2019; Proença et al., 2021). To account for this one can set up in vitro distribution and fate measurements or use in silico tools to predict distribution. Currently, there are several mathematical models that allow calculation of the proportion of the nominal concentration that is free and presumably active and therefore available in the reaction medium to be taken up by the cell (Tanneberger et al., 2010; Armitage et al., 2014; Comenges et al., 2017; Fischer et al., 2017; Fisher et al., 2019). One such model is the Virtual Cell Based Assay (VCBA). This is an algorithm which integrates models for: 1) chemical fate and transport; 2) cell partitioning; 3) cell growth and division; 4) toxicity and effects; and 5) considering the experimental set up (size of well-plate). Ultimately, the VCBA can simulate the active, free concentration of chemical in the medium, which can be used on its own to design and interpret in vitro experiments, and in combination with PBK models to perform in vitro to in vivo extrapolation (Comenges et al., 2017; Bell et al., 2018).
In order to address the issues of PBK model structure uncertainty, parameter value uncertainty and the calculation of free concentration of chemical in vitro, the VCBA was used in combination with an algorithm, described in detail previously, which was developed to extrapolate in vitro concentration-response to in vivo dose-response relationships (McNally and Loizou 2015; McNally et al., 2018; Loizou et al., 2021). The latter applies a rigorous statistical framework for the accommodation of uncertainty in both PBK model parameters, the quality of fit to measured biological monitoring data, and a consideration of how this affects an in vivo dose response relationship in the context of QIVIVE (Judson et al., 2011).
The workflow uses global sensitivity analysis (GSA), PBK modelling, Approximate Bayesian Computation (ABC) and Markov Chain Monte Carlo (MCMC) simulation to convert in vitro concentration-response data to in vivo dose-response data (McNally et al., 2018; Loizou et al., 2021). There are several advantages regarding exposure or dose reconstruction provided by this probabilistic approach. Firstly, defining informative prior distributions around parameters converts a deterministic model to a population model which can account for inter-individual variability. Secondly, the application of GSA is appropriate for systems where tissue dose is not necessarily linearly related to external exposure. Finally, this combination can extract population variability and multiple routes of exposure information integrated within pharmacokinetic data (McNally et al., 2012; McNally and Loizou 2015; McNally et al., 2018; Loizou et al., 2021). In this report we present the results from a study investigating the QIVIVE of bisphenol A (BPA) (4,4'-(propane-2,2-diyl) diphenol).
As emphasised in our previous studies the purpose of this study was not to propose an animal-free risk assessment for BPA, since it is recognised that much work is still needed to demonstrate in vitro to in vivo concordance for systemic, chronic exposures to environmental xenobiotics (McNally and Loizou 2015; McNally et al., 2018; Loizou et al., 2021). Therefore, the selection of in vitro concentration-response data for use in this study was not predicated on seeking consistency with the apical endpoint used to calculate a BMDL10 by a regulatory agency, in this case EFSA, or whether the data were consistent with an adverse outcome pathway (AOL) for BPA. Our purpose was to investigate the behaviour of BPA, as a structurally dissimilar chemical to perfluorooctanoic acid (PFOA) (Loizou, et al., 2021) and ethylene glycol monoethyl ether (EGME) (McNally, et al., 2018) studied previously and to demonstrate the utility of: 1) freely available concentration-response data, 2) the importance of using free in vitro concentrations, and 3) a computational workflow which quantifies uncertainty and variability by integrating PBK modelling, the VCBA, GSA, ABC and MCMC simulation for QIVIVE.
2 Materials and Methods
2.1 PBK Model
The biokinetics of bisphenol A following single oral doses were described using a PBK model previously developed for the plasticizer DPHP (McNally et al., 2021), with adaptions to model structure made, as necessary. The final model described entry of BPA through ingestion with absorption of BPA from the stomach and intestines and a simple model of the lymphatic system describing uptake of BPA via the lacteals in the small intestine and entering venous blood after bypassing the liver. The dose that entered the lymphatic system was coded as a fraction of the administered dose; a fraction of administered dose was coded as entering the liver via the portal vein; a fraction of the administered dose of BPA passed through the intestine without being absorbed and was coded as administered dose minus the lymphatic and hepatic dose components. The model described the metabolism of BPA-to-BPA glucuronide (BPAG) and BPA sulphate (BPAS) in both liver and gut. Sub-models were included to describe the kinetics of BPAG and BPAS, with the models for BPA and the two metabolites connected via gut and liver. Binding of BPA, BPAG and BPAS was coded from arterial blood, with the consequence that only the unbound fraction in blood was available for distribution to organs and tissues, metabolism, and elimination. However, the bound and unbound fractions of BPA in blood are in equilibrium such that the bound fraction is gradually removed to become unbound as the existing unbound fraction is excreted.
The model structures for BPA and the two metabolites differed only in the coding of uptake required for BPA (including the simplified description of a lymphatic compartment). BPA and metabolite models had a stomach and intestine draining into the liver. Adipose, blood, kidney, and slowly and rapidly perfused compartments were included. Elimination of BPA, BPAG and BPAS was coded through the kidney compartment, with first order elimination rates, proportional to kidney tissue concentration, coded in each case. Both BPA and metabolite models included the transport process of enterohepatic recirculation. Uptake of BPA and metabolites from the liver into bile was modelled as a first order uptake process with a delay of 4 hours (to represent transport in bile) before BPA (and metabolites) appeared in the small intestine and were available for reabsorption. First order elimination rates for each substance were coded to account for fractions of recirculated BPA and metabolites that were eliminated in faeces rather than reabsorbed from the small intestine. As a consequence of coding enterohepatic recirculation, the PBPK model was solved as a system of delay differential equations (DDEs).
The final structure of the model described above followed the iterative model development process (incorporating uncertainty and sensitivity analysis) documented in McNally et al. (2021). Table 1 lists a glossary of parameters name and abbreviations. A schematic representation of the model is shown in Figure 1.
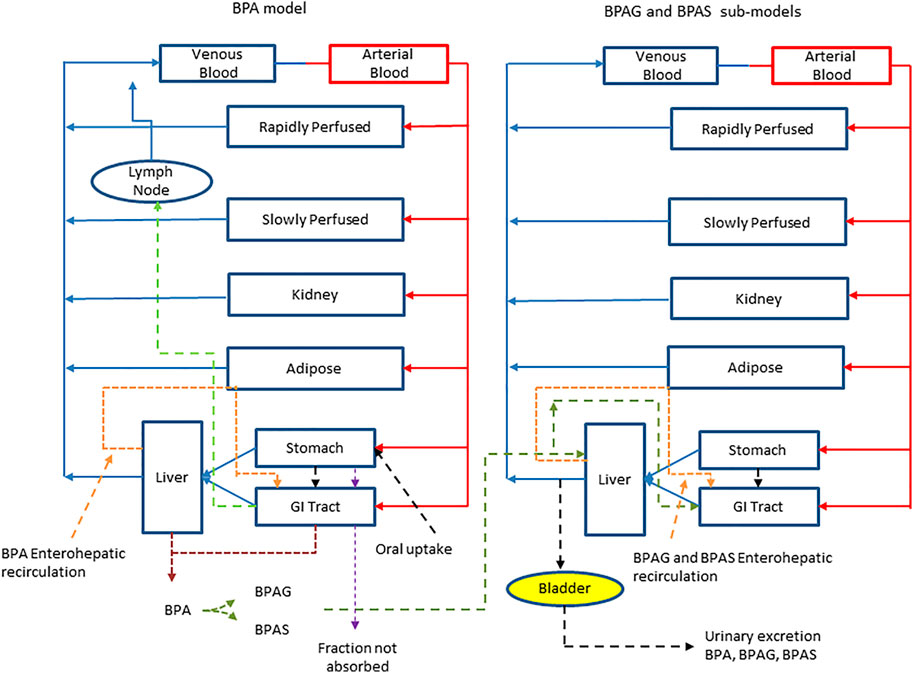
FIGURE 1. A schematic of the model for BPA and sub-model for BPAG and BPAS. The main model contained a lymphatic compartment (

2.1.1 Parameterisation
Baseline estimates of organ and tissue masses and regional blood flows were taken from Brown et al. (1997) and (ICRP 2002). The mass of the lymphatic system was obtained from Offman et al. (2016). The method of Schmitt (2008), which was developed to predict the tissue distribution of chemicals with an octanol: water partition coefficient, (Log Pow) <5.17 used to predict the PCs of BPA, BPAG and BPAS (Table 2).
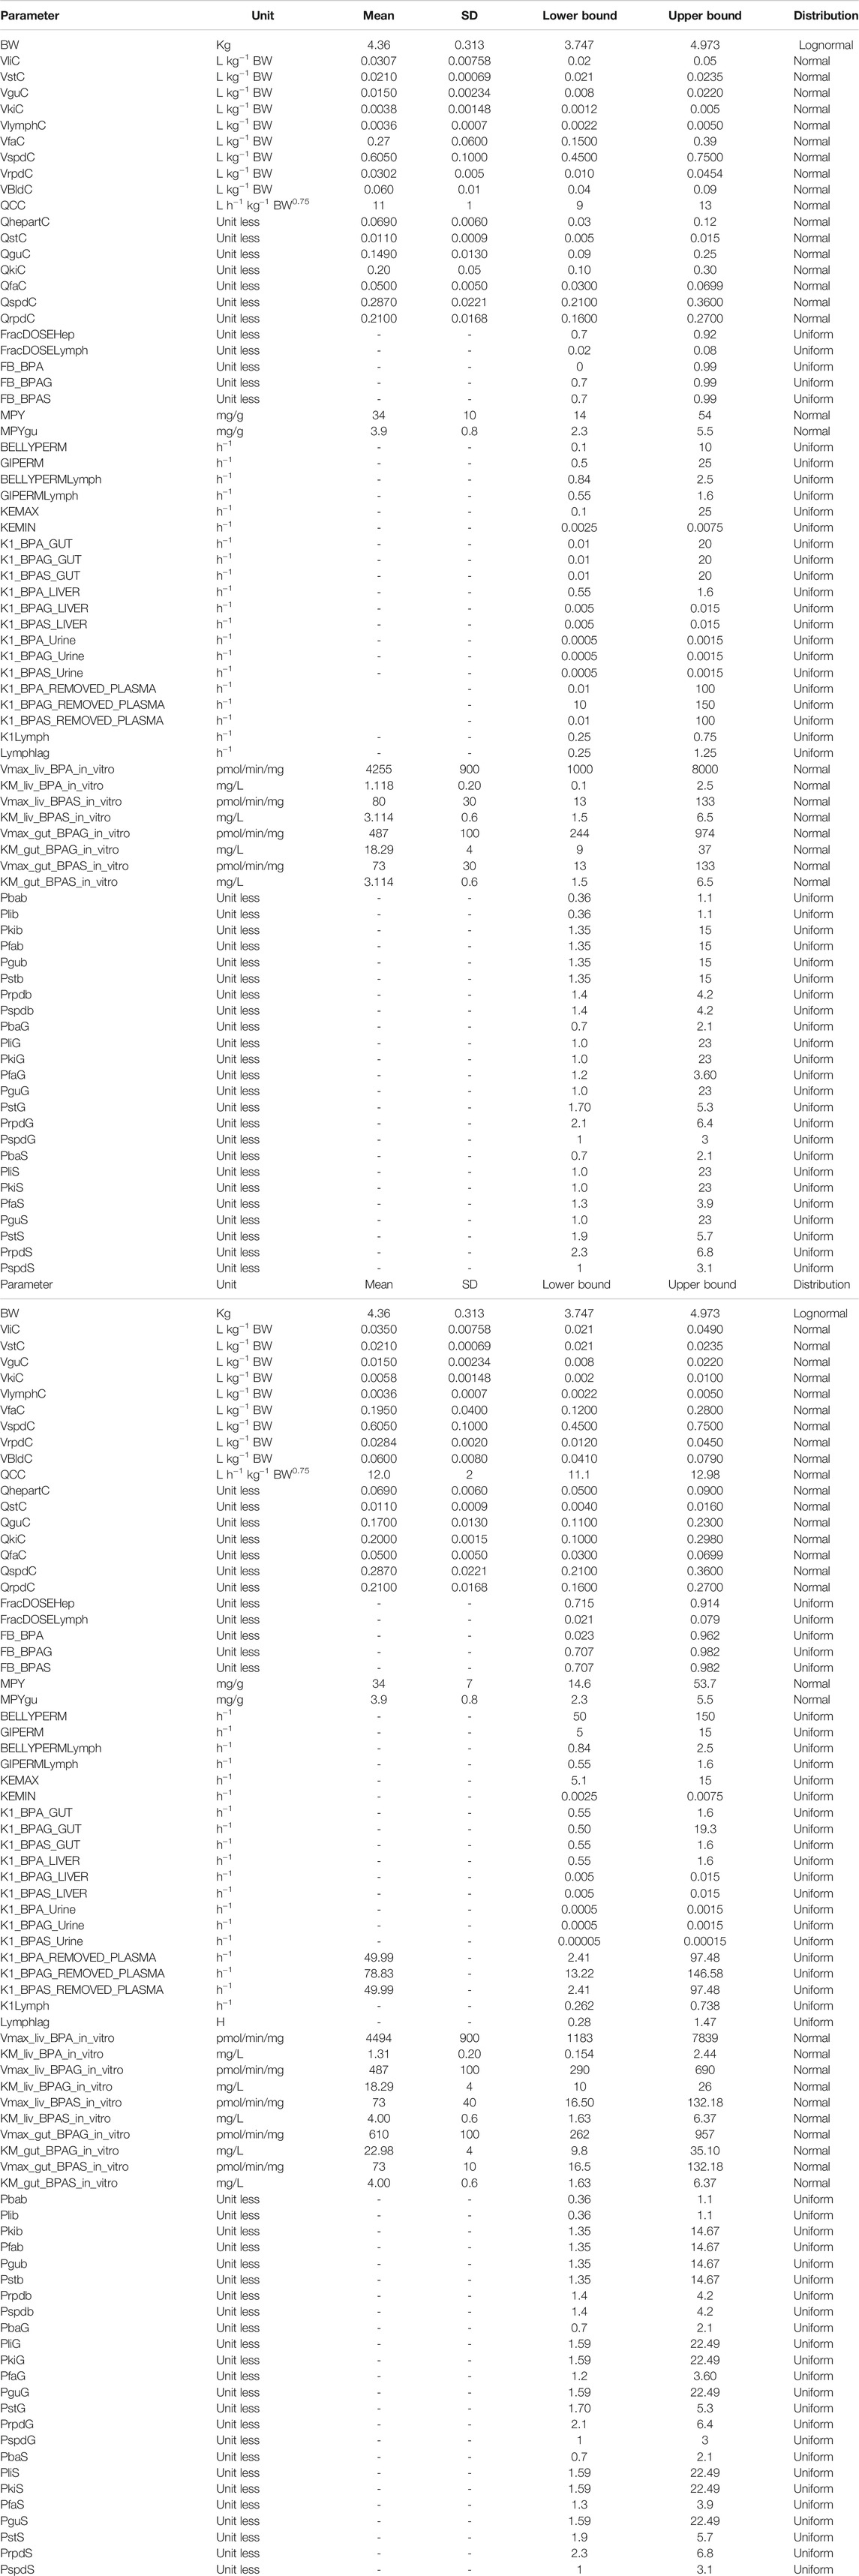
TABLE 2. Default probability distributions (and upper and lower bounds) ascribed to PBPK model parameters.
The in vitro metabolic rate constants for the biotransformation of BPA to BPAG and BPA to BPAS were taken from (Mazur et al., 2010) and scaled to whole liver and gut using the microsomal protein yield (Pacifici et al., 1988; Soars et al., 2002) and mass of the liver or gut. Default values for uptake and elimination rate parameters were based on corresponding terms in McNally et al. (2021) and subsequently refined through tuning parameters to better represent the trends in data from the human volunteer study reported in Thayer et al. (2015). The default model assumed 80% of the administered BPA was absorbed through the hepatic route, with a further 5% absorbed through the lymphatic route with the complementary 15% passing through unabsorbed (Thayer et al., 2015).
The baseline model was subsequently refined using an iterative model development process, as outlined in QIVIVE Workflow and in Supplementary Material, in order to better represent the trends in BM (blood) data from the human volunteer study reported in Thayer et al. (2015). Technical details on the process of model development and refinement are provided in Supplementary Material.
2.2 Experimental Data
2.2.1 Human Biological Monitoring Data
The pharmacokinetics of BPA in humans following a single oral dose of 100 µg/kg body weight (in a vanilla wafer cookie after fasting from the previous midnight) was studied in fourteen, healthy men (n = 6) and non-pregnant women (n = 8), 26–45 years of age (Thayer et al., 2015). The cohort comprised seven African American and seven non-Hispanic whites with average BMIs of 28.6 and 26.1 for the males and females, respectively. The body weights of individuals 1 to 14 were, 94, 69, 118, 72, 86, 61, 91, 75, 73, 68, 102, 95, 68 and 79 kg. The study was approved by the Research in Human Subjects Committee of the U.S. Food and Drug Administration (Thayer et al., 2015). The biological monitoring data were kindly provided by Dr. Xiaoxia Yang of the Division of Biochemical Toxicology of the U.S. Food and Drug Administration. Plasma concentrations of BPA, BPAG and BPAS were used to calibrate the PBK model.
2.2.2 In vitro Data
In vitro concentration-response data were obtained from the ToxCast/Tox21 database available from the Bioactivity section of the United States Environmental Protection Agency Chemistry Dashboard. Appropriate datasets were obtained by first filtering to retain only those that were active (positive hit-call) i.e., had an AC50 (concentration at which 50% maximum activity was observed) derived from the Hill or Gain-Loss model where both the modelled and observed maximum responses met or exceeded an efficacy cut-off (Filer et al., 2014) and had no warning signs (flags). Two of the selected datasets were generated using HepG2 cells, a human liver cell line and two using HEK293T cells, a human kidney cell line. Datasets with the lowest AC50 value were selected. The rationale adopted was analogous to the process followed by regulatory agencies where generally, the lowest NOAEL or BMD value is identified and used for the safety assessment of any given chemical. Four datasets selected for study; none were associated with an Adverse Outcome Pathway (AOP) in the information available from the US EPA Chemistry Dashboard1. However, mechanistic and epigenetic effect studies support the conclusion that BPA is an endocrine disruptor and has been associated with an AOP (Carvaillo et al., 2019). It affects several receptor-dependent and independent signalling pathways which perturb hormone homeostasis and gene expression leading to cytogenetic and epigenetic effects. Although, it is emphasised that existence of an AOP is not of importance to the aim of this study. Overall, the primary objective in data selection was the availability of a useful concentration-response profile, not the association of an in vitro endpoint consistent with an in vivo endpoint.
1) Estrogen receptor activation. (Assay name: ATG_ERE_CIS_up, AC50 = 0.1 µM). No flags.
2) Pregnane X receptor. (Assay name: ATG_PXR_TRANS_up, AC50 = 0.72 µM). No flags.
3) Estrogen receptor activation. (Assay name: OT_ER_ERaERb_0480, AC50 = 0.32 µM). No flags.
4) Estrogen receptor activation. (Assay name: OT_ER_ERaERa_1440, AC50 = 4.31 µM). No flags.
Assays 1-2 were conducted in 24-well plates using human liver HepG2 cells and dimethyl sulfoxide the dilution solvent. Assays 3-4 were conducted using human kidney HEK293T cells in 384-well plates and dimethyl sulfoxide the dilution solvent.
2.3 QIVIVE Workflow
The aim of the QIVIVE workflow was to estimate a distribution of ingested concentrations of BPA that was consistent with target tissue concentrations, for comparison against in vitro data. In vivo hepatic tissue BPA concentrations (CVli) and in vivo kidney tissue BPA concentrations (CVki) were selected as suitable target tissue concentrations because HepG2 cells are derived from the human liver and HEK293T cells from the human kidney, respectively and are considered in vitro surrogates for the liver and kidney in vivo, respectively.
The key to the approach described below is the recognition that the PBK model is an imperfect approximation to reality. Exact matching of the chosen PBK model response to an in vitro concentration suggests a higher degree of belief in the model than is warranted and is thus not desirable. By accepting a discrepancy between the two, within a specified threshold, model uncertainty is thus accommodated, and an error term is created that can be exploited by efficient sampling techniques. The modelling framework was adapted from Loizou et al., 2021, with the addition of the application of the VCBA for the estimation of the in vitro free concentration of BPA. Figure 2 shows a schematic of the workflow. The steps were:
1) Probability distributions for tissue volumes, expressed as a fraction of body weight, and tissue blood flows, expressed as a fraction of cardiac output were estimated using a virtual population generated using PopGen (McNally et al., 2014). Specifically, a US population of 10,000 individuals comprised of 2500 Caucasian males; 2500 Caucasian females, 2500 African American males and 2500 African American females, aged 25–45 and with BMI ranging from 19–35 was generated (which captured the characteristics of the human volunteer study population). Probability distributions for tissue volumes and fractional blood flows were based upon statistical analysis of this model output. For other parameters, such as partition coefficients and rate parameters, uniform distributions were ascribed based upon author’s judgement to represent conservative yet credible bounds and refined through the model development process. The probability distributions used in the reported uncertainty and sensitivity analyses and parameter calibrations are given in Supplementary Table SA1 Supplementary Material.
2) Refinement of the parameter ranges through calibration, using the HBM data of Thayer et al. (2015). A statistical model was specified to link predicted concentrations of BPA, BPAG and BPAS in plasma to corresponding HBM data. A Gaussian error model was assumed with calibration achieved using Markov Chain Monte Carlo (MCMC), implemented in GNU MCSim. Technical details on calibration are provided in Supplementary Material. Refined parameter ranges, based upon results from calibration, were used in subsequent steps of the workflow.
3) Elementary effects screening using the Morris Test was conducted to determine the parameters that the model outputs of interest, AUC of hepatic and kidney tissue concentrations of BPA, CVli, and CVki, respectively, were insensitive to. A simulation of 5 h was used, a time period which represented the maximum range of model output variance.
4) The top ranked parameters from the Morris screening were further examined using eFAST, a variance-based sensitivity analysis. The parameters determined by the Morris Test to which the outputs were insensitive were held fixed at default values in this second phase of sensitivity analysis. A reduced parameter set was taken through into subsequent steps in the workflow following the two-phased GSA.
5) Estimation of the bioavailable or “free” in vitro concentration of BPA using the Virtual Cell Based Assay (VCBA). The raw data downloaded from the Chemistry dashboard are generally expressed as Log10 µM against the corresponding responses as Log2 fold induction or percentage activity. Calculation of the bioavailable or “free” in vitro concentrations of BPA were estimated using the VCBA (Comenges et al., 2017; Paini et al., 2017; Worth et al., 2017; Proença et al., 2019). The algorithm, written in R syntax and available in the Supplementary Material of Proença et al. (2019) was run in RStudio (Version 1.2.1335). The bioavailable fraction was calculated for each in vitro dose concentration and used in step 6.
6) Estimation of the distribution of oral dose (PORALDOSE) corresponding to target tissue concentration (the bioavailable fraction of each of the experimental in vitro concentrations) whilst accounting for model structure and parameter value uncertainty. This was achieved using a two-step Approximate Bayesian Computation (ABC) approach. In the first phase, 5000 parameter sets were drawn for sensitive parameters from uniform distributions based upon the refined limits resulting from calibration. These were paired with samples drawn for PORALDOSE. The PBK model was run for each of these 5000 parameters sets. The parameter sets that corresponded to predictions of CVli and CVki within ±7.5% of the target in vitro concentration were retained and the covariance matrix of the parameters calculated. In the second phase, a more efficient parameter space search was conducted using ABC MCMC. A proposed move was accepted if within ±5% of the target concentration. Four chains were run, each for 50,000 iterations. The above approach was repeated for each of the dose concentrations. Technical details of the approach are given in McNally et al., 2018 and Loizou et al., 2021.
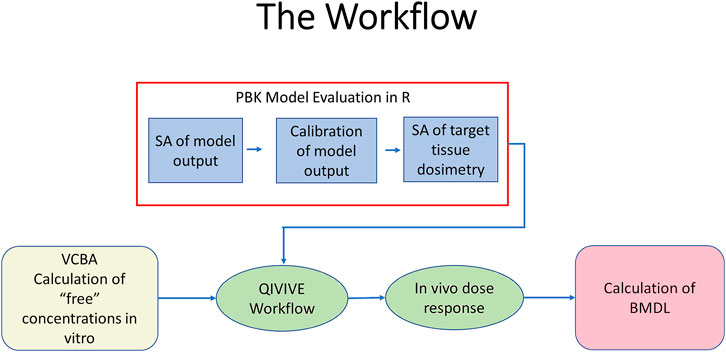
FIGURE 2. The workflow. PBPK model evaluation was conducted using R (blue fill). This comprised sensitivity analysis of blood BPA following oral uptake, identification of marginal distributions using rejection sampling, calibration of model output using measured blood BPA concentrations followed by sensitivity analysis of in vivo target tissue dosimetry of liver (CVli) and kidney (CVki). Free concentrations of BPA in vitro were estimated from nominal concentrations using the VCBA (beige fill). Free BPA concentrations and the calibrated PBK model were input in the QIVIVE workflow to estimate in vivo dose responses (pale green fill). The latter were used to calculate a BMDL10 using PROAST (pink fill).
Finally, a PoD, the BMDL10 lower bound in the in vivo dose response relationship was estimated (see section Calculation of in vivo benchmark dose).
2.4 Calculation of in vivo Benchmark Dose
The dose-response curves were predicted by calculating the AUC of the liver (CVli) or kidney (CVki) tissue concentrations versus fold induction or percentage activity. The first 3 h of the 24-h simulation period captured the maximum AUC for both tissues (data not shown). The mean, 2.5 and 97.5% of the credible interval values were calculated for the most sensitive parameters identified by GSA that determined CVli and CVki variability whilst also estimating the oral exposure concentration (PORALDOSE). PORALDOSE was estimated in µg/kg BW/day for direct comparison with the temporary Tolerable Daily Intake (t_TDI) of 4 μg/kg bw per day for BPA used in the risk assessment conducted by EFSA.
The BMD, BMDL and BMDU were estimated for the 10% BMRs compared to controls from the 90% confidence interval around the mean in vivo concentrations and corresponding fold inductions or percentage activities. The 10% BMR was calculated for direct comparison with the value used by EFSA. BMD values were calculated by model averaging from four fitted models for continuous (value for each individual) response data.
2.5 Software
The model was coded in the GNU MCSim language (version 6.1.0.)2 and run under Windows 10 Pro using RStudio (RStudio Team 2016). Files for running MCSim under windows, tools and instructions for installation are available from Github3. All plots were created using R version 4.0.2 and ggplot2 (R Development Core Team 2008; Wickham 2016).
In order to perform probabilistic simulations the model code was further modified to ensure that logical constraints on mass balance and blood flow to the tissues were met by adopting the re-parameterizations described by (Gelman et al., 1996).
The PBK model was evaluated using RVis, an open access PBK modelling platform4 which provides an intuitive user-friendly interface with which to interact with MCSim and the R platform5. The model equations were solved using MCSim which writes an output file in Tab Separated Values (TSV) format which is then input into the R environment and read by the R packages required for the various analyses. GSA of model outputs (Morris screening test and extended Fourier Amplitude Sensitivity Test (eFAST)) were conducted using the Sensitivity package of R. Reshaping of data and plotting was done using the reshape and ggplot2 packages respectively (Wickham 2007; Pouillot and Delignette-Muller 2010; Soetaert et al., 2010; Pujol et al., 2015). The main effects and total effects (McNally et al., 2011) were computed at each time point and parameter sensitivities were studied over this period using Lowry plots generated as described in McNally et al. (2011).
Benchmark dose values (BMDs) were calculated using PROAST version 69.0 hosted on the EFSA Open Analytics web site6.
The PBPK model is provided in Supplementary Material. R scripts for interacting with the model and replicating various stages of the analysis are available from the authors on request.
2.6 Hardware
A Dell Precision M4800 with an Intel(R) Core™ i7-4800MQ Q1BVQDIuNzA= GHz with 32.0 GB RAM running Windows 10 Pro was used for this study.
3 Results
3.1 Refinement of Exposure Assessment
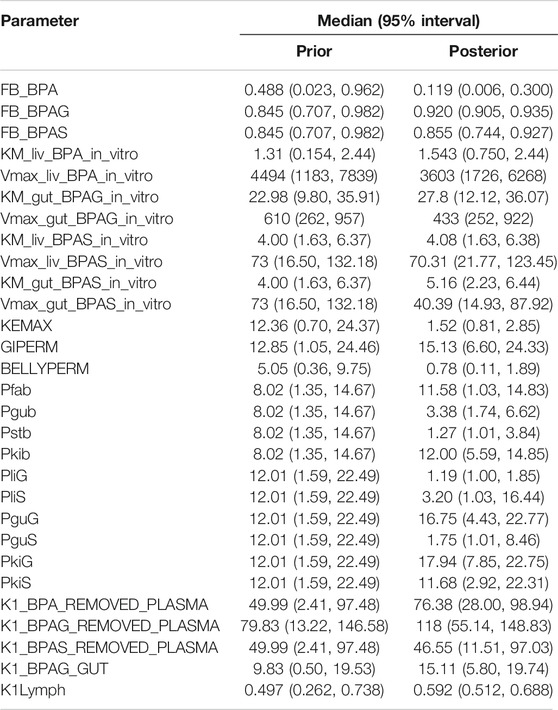
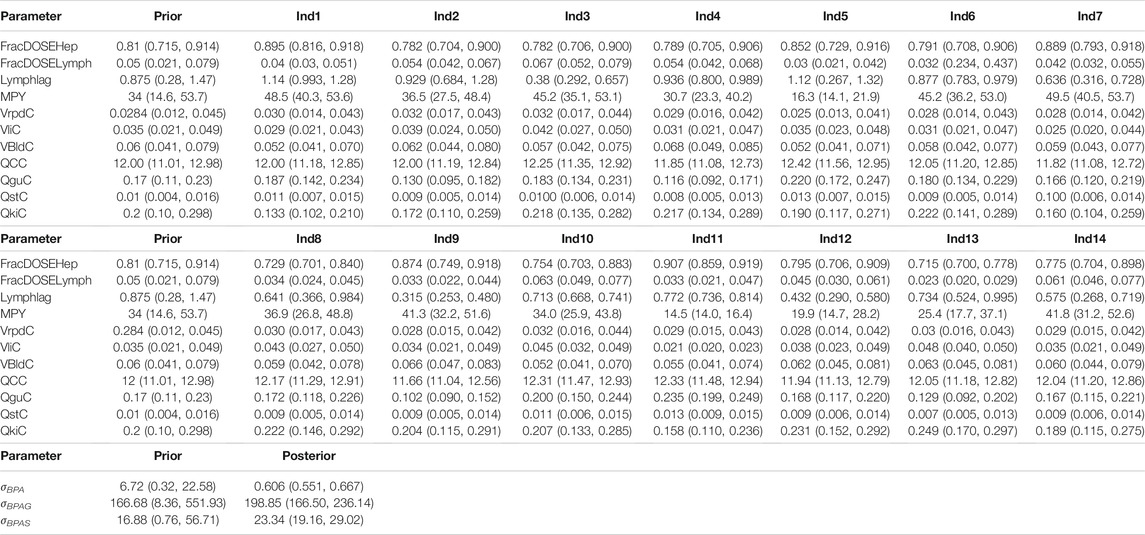
The parameter ranges for global and individual-specific parameters were refined through calibration of the model using the plasma BPA, BPAG and BPAS data of Thayer et al. (2015). Detailed results from calibration are provided in Supplementary Material; however, a summary of the key results is presented below. The simulations for three individuals only are shown in Figure 3: this subset of results demonstrates the range of behaviour that the calibrated model was able to fit and is used to emphasise key points from the results. Good fits to the plasma data of Thayer et al. (2015) were obtained for all 14 volunteers and the fits to the unique trends of BPA, BPAG and BPAS in plasma from each volunteer are shown in the three panels of Supplementary Figures S2–S12 of Supplementary Material. Summary statistics, that is, prior and refined (posterior) parameter distributions for global (i.e., common to all 14 individuals) and individual-specific parameters, are listed in Table 3 and Table 4.
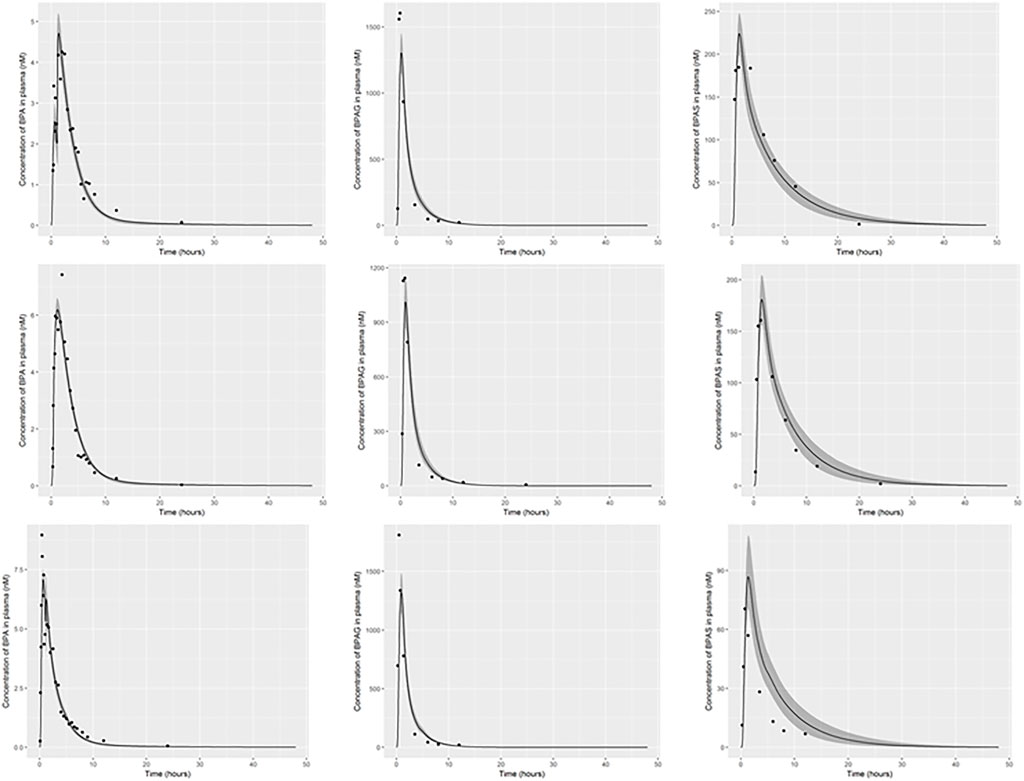
FIGURE 3. PBK model for BPA was evaluated by simulating the data of Thayer et al. (2015). The panels show serum BPA, BPAG and BPAS from left to right for individual 1, body weight, 94 kg (upper panel), individual 3, body weight, 118 kg (middle panel) and individual 5, body weight, 86 kg (lower panel). The solid lines represent the posterior mode-fit and the shaded bands bounding the posterior mode-fit correspond to a numerically derived 95% credible interval.
Three individual-specific parameters governed variability in the uptake of BPA: the fraction of administered BPA that was available for hepatic uptake; the fraction taken up into the lymphatic system; and a lag term (Lymphlag) which determined the time duration before BPA entered venous blood (at the thoracic duct). Results from calibration (Table 4) showed the majority fraction of BPA, between 70 and 90% of administered BPA, was taken up in the gut and entered hepatic circulation with substantial differences in central estimates and credible intervals between volunteers. This majority fraction was subject to first pass metabolism in gut and liver, with simulations indicating that metabolism was rapid, with little BPA entering systemic circulation from this route. In contrast the fraction entering the lymphatic system was small – between 2 and 7% of administered BPA (with differences in central estimates and credible intervals between volunteers) - however this small fraction was not subject to first pass metabolism. Whilst only a small fraction, consideration of lymphatic uptake was important for successfully fitting 1) the peak of BPA in plasma occurring at later time point compared to metabolites BPAG and BPAS; 2) the double peak of BPA seen in individuals one and five (discussed below); 3) accounting for a slower clearance of BPA from plasma. The influence of the lymphatic component is evident in the plasma BPA data from individuals 1 and 5 (Figure 3) where the double peak fitted for these individuals is a consequence of the fraction entering the lymphatic system. For some participants (Figure 3, participant 3) there was no double peak – this behaviour corresponded to small values of Lymphlag. It is interesting to note that the double peak (characterised by the very rapid decrease and rapid increase at approximately 1.5 h) in individual one occurs during the uptake phase whereas it is in the distribution phase (at approximately 2.5 h) in individual five. This is consistent with a more rapid removal of BPA through metabolism (to BPAG and BPAS) due to the much higher estimated MPY in individual 1 compared to individual 5.
Comparison of the two sets of summary statistics indicates a broad consistency, with modest changes to the medians following calibration, but with a consistent narrowing of credible intervals. This was not true, however, for the following partition coefficients; Pgub, Pstb, PliG, PliS and PguS. For these parameters uniform priors over wide ranges were specified, reflecting the a priori uncertainty in partition coefficients predicted using an in-silico algorithm. Following calibration much narrower marginal posterior distributions were associated with these parameters, reflecting that good fits to HBM data could only be achieved within a much narrower range of parameter space. Similarly, there was a very substantial narrowing of the posteriors for KEMAX, BELLYPERM and GIPERM compared with priors.
3.2 GSA
The AUC tissue concentrations for CVli and CVki were studied with sensitivity analysis. The parameter ranges ascribed to model parameters were the refined limits following parameter calibration – for participant specific parameters, the minimum and maximum values were taken over the summary statistics for the 14 individuals. Due to the stochastic nature of the Morris test, parameter rankings were derived by identifying the mode for each parameter over six simulations. The ten parameters to which each of the outputs were most sensitive were selected from the entire set of 74 model parameters for the second phase of sensitivity analysis using the variance-based eFAST method. The outputs were judged to be insensitive to the other parameters; these were held fixed at default values in the second phase of sensitivity analysis. Table 5 lists the parameters following elementary effects screening that had the most significant impact on CVli and CVki tissue concentrations and are ranked according to eFAST.
Figure 4 shows the GSA for tissue concentrations of CVli and CVki as a Lowry plot (McNally et al., 2011). The Lowry plot shows the total effect of a parameter ST, which is comprised of the main effect SM (green bar) and any interactions with other parameters Si (brown bar) given as a proportion of variance (range 0 – 1 on y axis) (McNally, et al., 2011). The ribbon (light blue), representing variance due to parameter interactions, is bounded by the cumulative sum of the SM (lower bound) and the minimum of the cumulative sum of the ST (upper bound). The most significant parameters that contributed to variance throughout the 24-h simulation period range from left to right. The 10 most significant parameters dominated from 0 to 5 h and remained in that order throughout that period whereas some swapping of order was observed for the other less important parameters. Furthermore, the ST for the top three parameters for CVli (upper panel), and CVki (lower panel) accounted for 61 and 55% of variance, respectively. Parameter sensitivities from 0 to 5 h, the period of maximum variance and the period for which the AUC was calculated for use in QIVIVE, remained at similar proportions of variance throughout the simulation period of 24 h. To reduce simulation time, the top eight parameters for CVli and CVki listed in Table 5 were used in ABC MCMC.
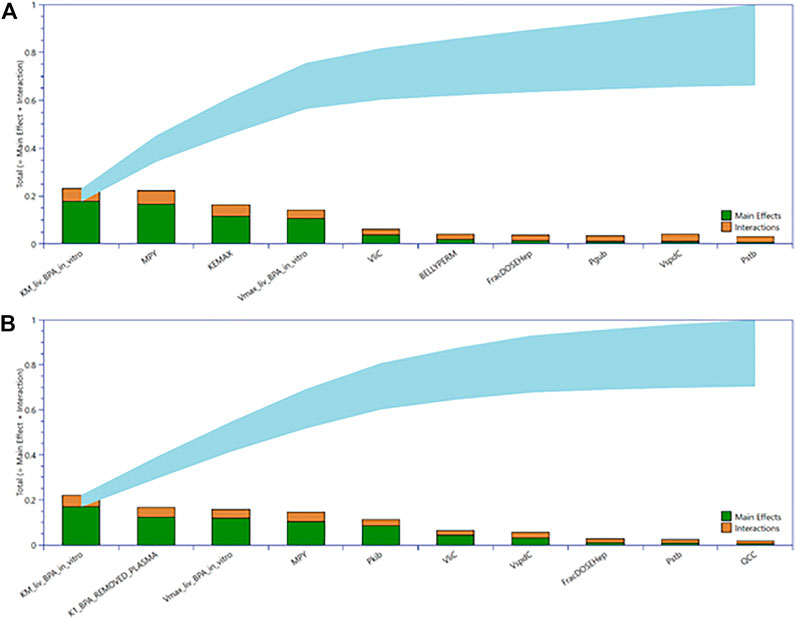
FIGURE 4. Lowry plots of the most influential parameters governing tissue BPA in liver (CVli) (A) and kidney (CVki) (B). The Lowry plot shows the total effect of a parameter ST, which is comprised the main effect SM (green bar) and any interactions with other parameters Si (brown bar) given as a proportion of variance. The ribbon (light blue), representing variance due to parameter interactions, is bounded by the cumulative sum of the SM (lower bound) and the minimum of the cumulative sum of the ST (upper bound). The ST for top three parameters for CVli (upper panel), and CVki (lower panel) accounted for 61 and 55% of variance, respectively.
Similar observations were made for plasma BPA, BPAG and BPAS where the top ten parameters shown in Table 5 accounted for 54, 82 and 66% variance, respectively.
3.3 In vitro Bioavailable Concentrations
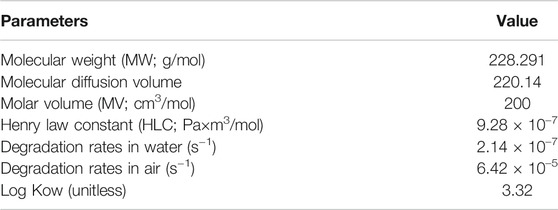
The physicochemical parameters required to run the VCBA for BPA are listed in Table 6. The raw data from the Chemistry dashboard alongside the transformed nominal and calculated free in vitro concentrations and the ratios of free to nominal concentrations for all assays using the VCBA are presented in Table 7 and Table 8. The bioavailable concentrations of BPA were predicted to be around 48–49% of the nominal concentration (in the presence of 5% serum) for all the selected assays.
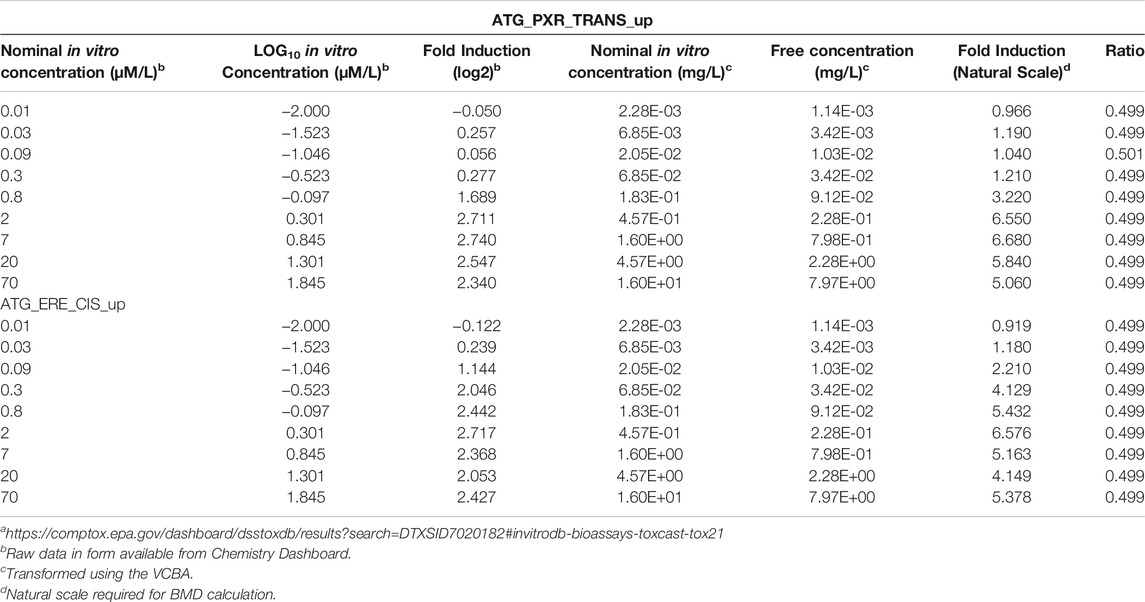
TABLE 7. Concentration-response data from Chemistry Dashboarda
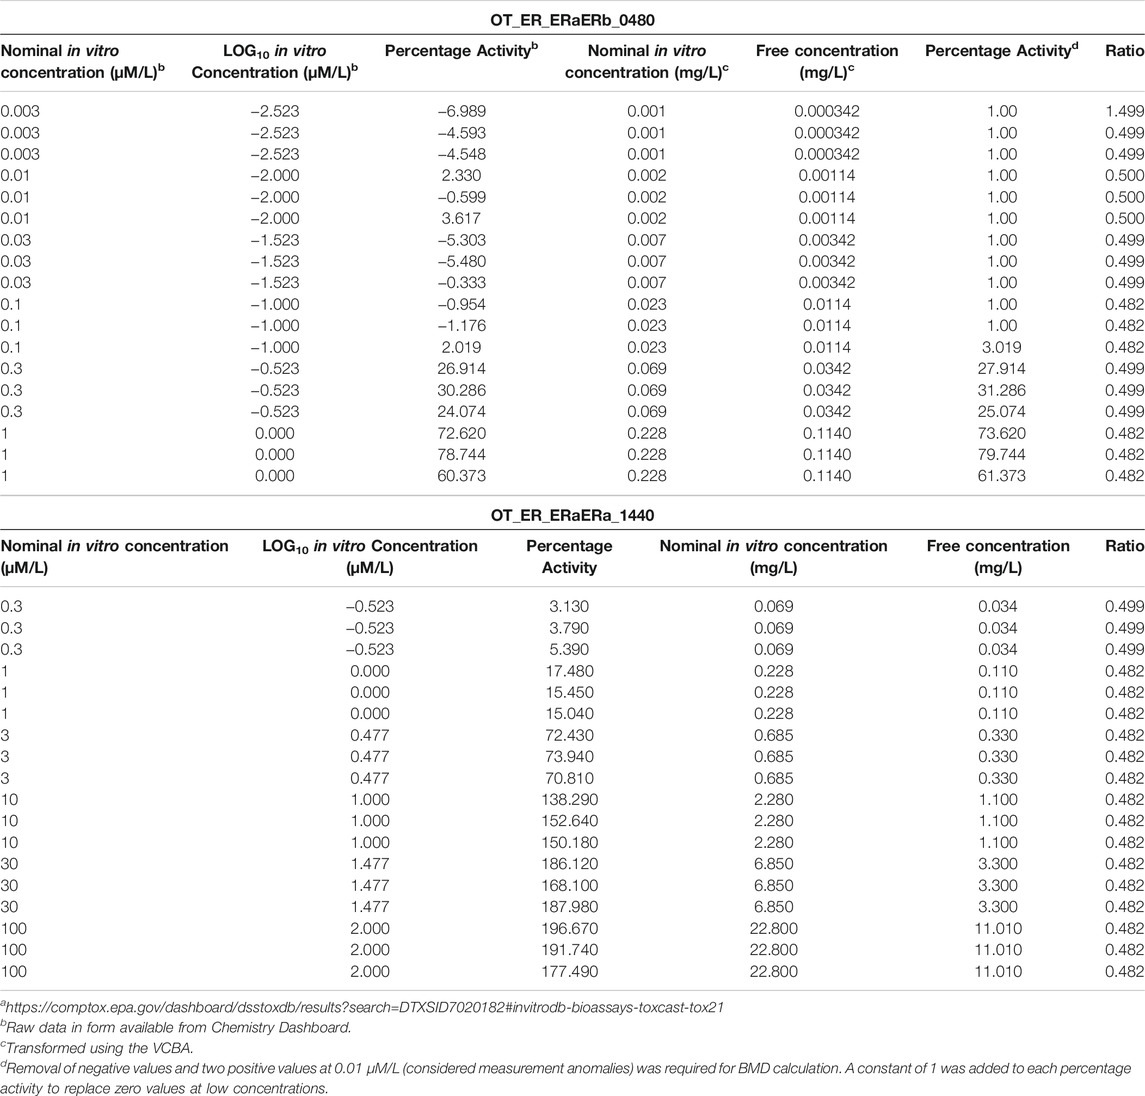
TABLE 8. Concentration-response data from Chemistry Dashboard and estimates of free concentrationsa
3.4 Quantitative in vitro in vivo Extrapolation
The percentage activity measure of response for assay OT_ER_ERaERb_0480 included 9 negative and two positive values at the lowest in vitro concentrations (Table 8). This occurs when activities are normalised using controls. This is a range of minimal activity associated with controls where the mean was assigned to zero. In most ToxCast assays a threshold point based on all controls is assigned and activity below the threshold is not considered to indicate anything about the test chemical. Therefore, values in this range were assigned zero on the assumption that the interpretation of this dataset does not change (Filer et al., 2014) (Dr. John Wambaugh, personal communication). A constant of one was then added to the entire range of percentage activities which was required for BMD analysis which assumes a lognormal distribution.
As described in the Materials and Methods and in previous reports (McNally et al., 2018; Loizou et al., 2021), a two-stage approach was used to sample PORALDOSE that was consistent with the free in vitro experimental data and a modest degree of model uncertainty. The latter was accounted for through accepting simulations within 5% of the target in vivo concentration. The first phase involves rejection sampling and is illustrated in Figure 5. Panel A of Figure 5 typically illustrates concentration-response profiles from 5,000 simulations, whereas panel B shows the concentration-response profiles from the retained simulations that were within 7.5% of the target concentration (0.011 mg/L, in this example). Plots like these were obtained for each in vitro concentration for each of the four assays listed in Tables 7, 8. In the second phase an ABC MCMC algorithm was applied for more efficient sampling of parameter space, in this case within a tighter threshold of 5%, consistent with a given in vitro target concentration. This two-stage process was repeated for each in vitro concentration with acceptance rates between 7.5 and 35%. Subsequent analysis was based upon results from the retained samples and pooled over the four chains run for QIVIVE for each in vitro concentration.
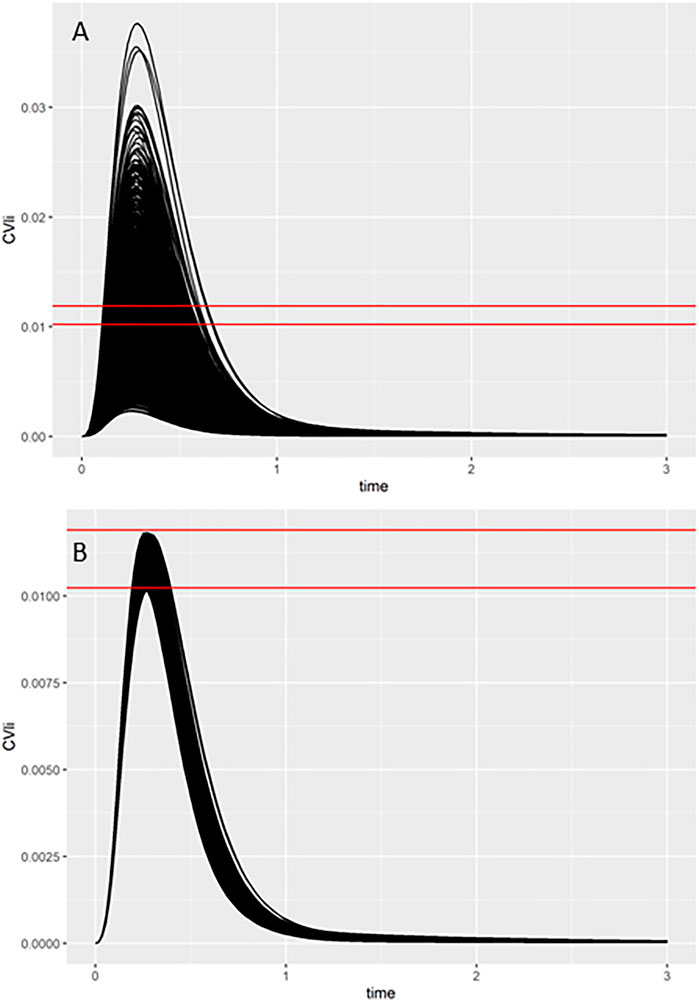
FIGURE 5. Comparisons of concentration-time response profiles simulated in the rejection phase were run for each concentration. A typical example shows the target concentration of 0.011 mg/L bounded by two red lines representing the 7.5% range above and below the target concentration. (A) 5000 concentration-response profiles (upper panel), and (B) retained samples within a relative error of 7.5% (lower panel).
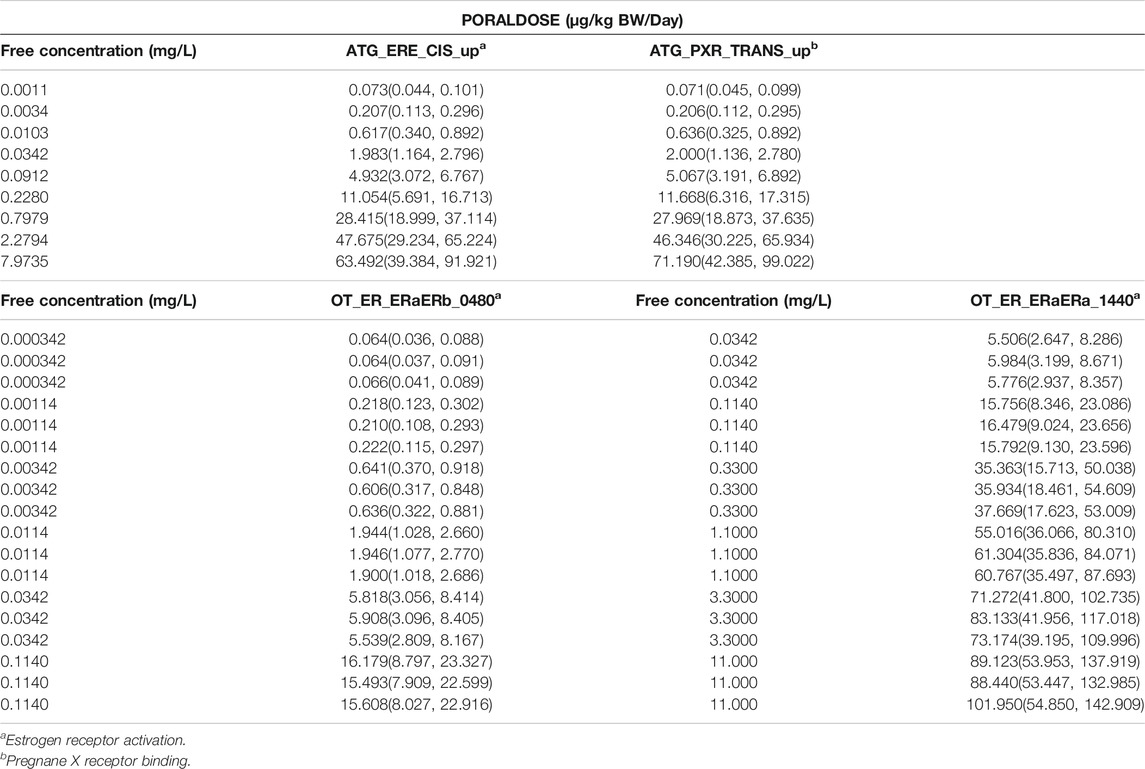
The posterior means and 95% credible interval for the in vivo dose-response relationships for PORALDOSE (µg/kg BW/Day) are provided in Table 9 for each target concentration in the assay.
The summary statistics for PORALDOSE were extrapolated from hepatic tissue concentrations (CVli) estimated from the in vitro concentration-response datasets; ATG_ERE_CIS_up (estrogen receptor activation), ATG_PXR_TRANS_up (pregnane X receptor binding), and from kidney tissue concentrations (CKli) estimated from OT_ER_ERaERb_0480 (estrogen receptor activation) and OT_ER_ERaERa_1440 (estrogen receptor activation).
3.5 Benchmark Dose Analysis
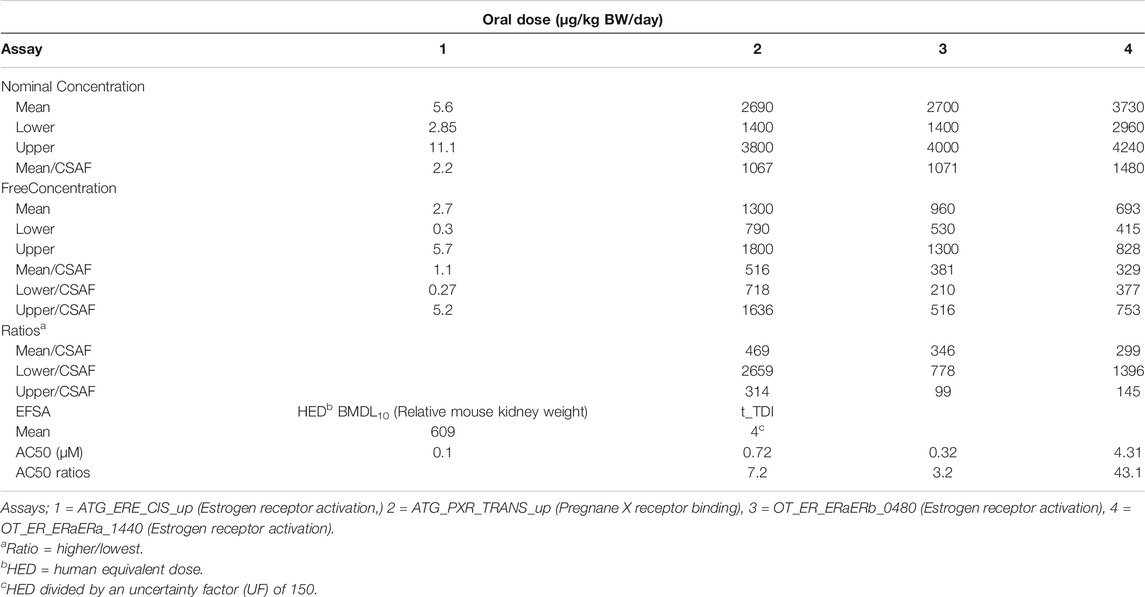
The mean in vivo dose responses shown in Table 9 were used to calculate a BMDL10 (lower limit of the 95% confidence interval on the BMR equivalent to a 10% effect size) for each in vitro assay (Figure 6). The mean, 2.5 and 97.5% percentile BMDL10 values calculated for PORALDOSE were compared with the HED adjusted BMDL10 and t_TDI values calculated by EFSA for relative kidney weight change in the mouse (Table 10). The mean BMDL10 values for PORALDOSE showed 48-fold variability, ranging from 2.7 to 1300 µg/kg BW/day (Table 10). However, these BMDL10 values may justifiably be adjusted by dividing with a chemical specific adjustment factor (CSAF) for inter-individual variability in pharmacokinetics (Bhat et al., 2017). Such a CSAF can be calculated by dividing the posterior 97.5% quantile by the median for a parameter that is responsible for the greatest variability in each output. In this case, the CSAF calculated for the fraction of BPA bound to plasma proteins, FB_BPA, is 2.52 (Table 3). The BMDL10 of 516 µg/kg BW/day for the ATG_PXR_TRANS_up was similar to the HED adjusted BMDL10 derived by EFSA. The BMDL10 of 329 µg/kg BW/day is about 54% the HED adjusted BMDL10 derived by EFSA. The application of an additional UF to an in vivo BMDL10 calculated using an isolated human cell line to derive a t_TDI is a matter for discussion but could reduce these values further.
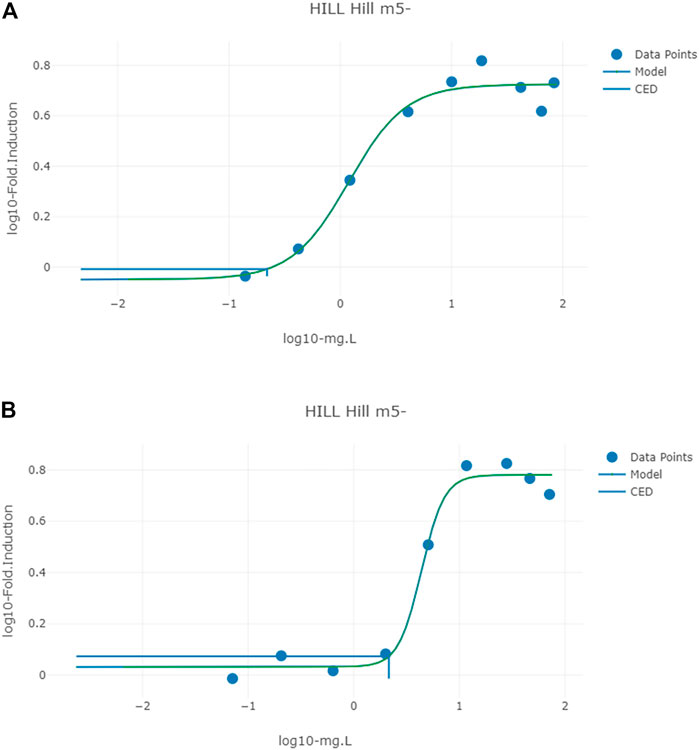
FIGURE 6. Typical predicted in vivo dose-response curves for PORALDOSE extrapolated from hepatic tissue concentration (CVli) for the in vitro datasets ATG_ERE_CIS_up (estrogen receptor activation) (A) and pregnane X receptor binding ATG_PXR_TRANS_up (B). The curves for the means only are shown. Benchmark dose values were calculated from such curves for lower and upper bounds (2.5 and 97.5%) of the credible intervals (Table 10).
The BMDL10 of 1.07 µg/kg BW/day with application of the CSAF or 2.7 µg/kg BW/day, without application of the CSAF, derived from the ATG_ERE_CIS_up assay was similar to the EFSA t_TDI of 4 µg/kg BW/day.
The mean in vivo BMDL10 values for BPA calculated for the four ToxCast assays is considerable, ranging from 2.7 to 1300 µg/kg BW/day or 1.1–516 µg/kg BW/day with application of a CSAF of 2.52. The ratios of the higher to the lowest values of the latter (i.e., 516/1.1, 381/1.1 and 329/1.1) ranged from 299 to 469-fold which were far higher than the differences in the in vitro AC50 values which ranged from 3.2 to 43.1-fold (Table 10).
Also, the ratios of BMDL10 calculated from free versus nominal concentrations were 0.48 for three of the four assays. Therefore, the ratio of free to nominal BMDL10 is consistent with the ratio of in vitro free to nominal concentrations in three from four assays.
Typical predicted in vivo dose-response curves for PORALDOSE extrapolated from hepatic tissue concentration (CVli) for the in vitro datasets ATG_ERE_CIS_up (estrogen receptor activation), pregnane X receptor binding ATG_PXR_TRANS_up, and kidney tissue concentration (CVki) for the in vitro datasets OT_ER_ERaERb_0480 (estrogen receptor activation) and OT_ER_ERaERa_1440 (estrogen receptor activation) are shown in Figures 6 and 7.
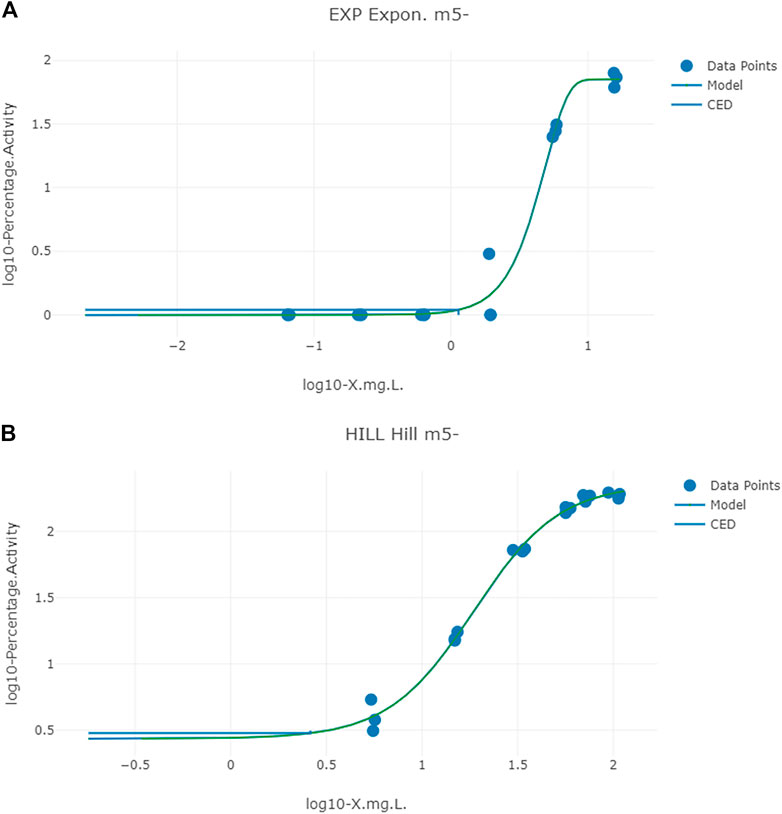
FIGURE 7. Typical predicted in vivo dose-response curves for PORALDOSE extrapolated from kidney tissue concentration (CVki) for the in vitro datasets OT_ER_ERaERb_0480 (estrogen receptor activation) (A) and OT_ER_ERaERa_1440 (estrogen receptor activation) (B). The curves for the means only are shown. Benchmark dose values were calculated from such curves for lower and upper bounds (2.5 and 97.5%) of the credible intervals (Table 10).
4 Discussion
As we noted in the introduction, numerous groups have used PBK modelling to translate in vitro concentration-response data into in vivo concentration-response data, and thus to estimate a PoD. A “dose matching” approach was utilised by these groups, whereby model parameters, except dose, are held at fixed values and external dose is varied in order to minimise the discrepancy between model prediction and target concentration (corresponding to in vitro dose). Such an approach considers neither parameter value uncertainty, nor model uncertainty. Whilst an optimisation procedure may well have been deployed in order to determine the baseline model parameters (that are subsequently held fixed), the optimal parameter set will depend upon the assumptions in the optimisation procedure applied, and furthermore a subset of parameter space typically provides a similar quality of fit to calibration data. Without a consideration of parameter value uncertainty, the sensitivity of the calculated PoD to the choice of baseline parameters is not assessed. Model uncertainty is also important, since the PBK model is an imperfect surrogate for the human (or animal) and results could furthermore depend upon the fidelity of the model. When a single value such as AUC or a maximum concentration is being extracted from PBK model output for direct use in hazard assessment, it implies a greater belief in the adequacy of the surrogate model than is justified.
Understanding and quantifying the level of uncertainty in each step of a chemical safety assessment with NAMs is important for the development of confidence in this approach (Berggren et al., 2017). In our previous studies, we demonstrated a computationally efficient workflow for model evaluation (utilising techniques for uncertainty and sensitivity analysis as a critical part of model development and evaluation), and accounted for parameter value and model error when conducting QIVIVE, thus accounting for two significant sources of uncertainty.
In this study a further significant refinement of the approach has been made as we investigated another area of potentially significant uncertainty - the effect of calculating in vivo BMDL10 from free versus nominal concentrations. Preliminary estimations using the VCBA of the free to nominal in vitro concentrations for perfluorooctanoic acid and chlorpyrifos predict ratios of 0.037 and 9.3%, respectively. These are both significantly lower than the 48% for BPA. These ratios suggest that significantly erroneous HBGV could be derived if based on nominal in vitro concentrations.
The mean in vivo BMDL10 values calculated from free in vitro concentrations for assays 1 to 3 were approximately 48% of the mean in vivo BMDL10 calculated from nominal in vitro concentrations. The free to nominal BMDL10 ratio for assay 4 was approximately 19%. That is, the ratio of free to nominal in vitro concentrations were consistent with the calculated BMDL10 ratios for three from four assays. It may be inferred that the relationship between in vivo tissue concentrations and nominal in vitro concentrations was linear in three from four assays but not for the fourth. Without further investigation the reason for this difference is unclear and would require a detailed analysis of the curve-fitting mathematical models used to analyse the data.
The differences in mean in vivo BMDL10 values for the various assays exceeded the concomitant differences in in vitro AC50 values. The increased variability of in vivo BMDL10 values is likely due to intra-individual variations in organ and tissue masses, regional blood flow rates, and metabolism which is not considered in the in vitro assays. The differences are even higher for the lower in vivo BMDL10 values ranging from 1396 to 2659-fold which may be due to increased biological variability at the extreme tails of the lower confidence intervals. These observations provide further support for the use of probabilistic rather than deterministic models in QIVIVE.
The European Food Safety Authority (EFSA) panel on food contact materials, enzymes, flavourings and processing aids (CEF) set a temporary Tolerable Daily Intake (t_TDI) of 4 μg/kg bw per day for BPA using a weight of evidence approach (EFSA Panel on Food Contact Materials and Aids 2015). The latter involved ascribing a “likelihood” level for the occurrence of potential critical toxicological endpoint(s) for the derivation of a HBGV (EFSA Scientific Committee et al., 2017a). The hazard characterisation of BPA was based on increases in liver and kidney weights in rats and mice as likely critical endpoints, with the likelihood of immunotoxic, cardiovascular and metabolic effects classified as “as likely as not” and genotoxicity and carcinogenicity as “unlikely”. A benchmark dose 10% lower confidence limit (BMDL10) of 8 960 μg/kg bw per day was calculated for changes in the mean relative kidney weight in a two-generation toxicity study in mice. With the availability of human and animal toxicokinetic data and the use of PBK modelling this value was converted to a human equivalent dose (HED) of 609 μg/kg bw per day. Briefly, the BMDL10 of 8 960 was multiplied by a Human Equivalent Dose Factor (HEDF) of 0.068 calculated from the area-under-the curve (AUC) of plasma unconjugated BPA concentrations in mice and humans, (HEDF = AUCMice/AUCHuman) following a standard oral dose of 100 μg/kg bw per day. Finally, the HED was divided by an overall UF of 150 to obtain the t_TDI of 4 μg/kg bw per day.
The use of hormone binding assays such as, human liver pregnane X and kidney estrogen receptor activation in vitro in the risk assessment of BPA may be justified by observations from an occupational exposure study conducted on 3394 subjects (40 years or older) of a Chinese population. In this study high urinary BPA concentrations were correlated with an increased concentration of free triiodothyronine and a decreased concentration of thyroid stimulating hormone (Wang et al., 2013). The authors concluded that there was an association between BPA exposure and altered thyroid hormones. However, this study was not considered by the CEF because it did not meet its geographical origin criteria (EFSA Panel on Food Contact Materials and Aids 2015).
In addition, mechanistic and epigenetic effect studies support the conclusion that BPA is an endocrine disruptor which affects several receptor-dependent and independent signalling pathways which perturb hormone homeostasis and gene expression leading to cytogenetic and epigenetic effects (Rochester 2013; EFSA Panel on Food Contact Materials and Aids 2015; Mesnage et al., 2017). In vitro studies have shown that BPA affects not only the estrogenic system but also the functions of androgens, prolactin, insulin and thyroid hormones (Wetherill et al., 2007; Fenichel et al., 2013). Therefore, it is not surprising that BPA has been screened under the Endocrine Disruptor Screening Program for the 21st Century7 and the Toxicity Forecaster (ToxCast) Program8. A range of in vitro concentration-response assays for thousands of chemicals are available from the ToxCast/Tox21 database on the United States Environmental Protection Agency Chemistry Dashboard9.
ToxCast was created as a screening program which is reflected in the assay design. It was not intended for the identification of molecular initiating events (MIEs) in the development of Adverse Outcome Pathways (AOPs). The purpose of the program was to maximise throughput, minimise false negatives and facilitate data processing for computational exercises and modelling to identify patterns (Ryan 2017).
The mean CSAF adjusted BMDL10 for liver pregnane X receptor (ATG_PXR_TRANS_up) and kidney estrogen receptor activation (OT_ER_ERaERb_0480 and OT_ER_ERaERa_1440) at approximately at 85, 62 and 54% of the HED BMDL10 derived by EFSA were similar in magnitude. EFSA applied an UF of 150 for inter- and intra-species differences and uncertainty in mammary gland, reproductive, neurobehavioural, immune and metabolic system effects to establish a t_TDI of 4 µg/kg bw per day. Application of an UF for in vitro to in vivo extrapolation, which is yet to be determined, in addition to the proposed CSAF used in this study could reduce the BMDL10 to values similar to the EFSA t_TDI for three of the four assays.
Finally, the ABC algorithm in combination with the VCBA represents an in silico infrastructure that may be successfully and effectively used to translate in vitro concentration-response data for environmental pollutants from the Tox21 and ToxCast high-throughput in vitro screening programs and any in vitro concertation-response data in general. This algorithm is consistent with the workflow proposed by Bell et al. (2018) and could be an effective tool in a NAMs based chemical risk assessment strategy.
Data Availability Statement
The original contributions presented in the study are included in the article/Supplementary Material, further inquiries can be directed to the corresponding author.
Author Contributions
GL, KM, and AH modified and further developed the PBK model and ABC algorithm, analysed and interpreted the data. AP applied the VCBA, analysed and interpreted the data and provided the background and context for application of the data to chemical risk assessment. All authors made significant contributions to the manuscript.
Funding
This work was supported by The Company Members of the European Partnership For Alternative Approaches to Animal Testing (EPAA).
Conflict of Interest
The authors declare that the research was conducted in the absence of any commercial or financial relationships that could be construed as a potential conflict of interest.
Publisher’s Note
All claims expressed in this article are solely those of the authors and do not necessarily represent those of their affiliated organizations, or those of the publisher, the editors and the reviewers. Any product that may be evaluated in this article, or claim that may be made by its manufacturer, is not guaranteed or endorsed by the publisher.
Acknowledgments
The authors gratefully acknowledge the intellectual support provided to this study by the members of the EPAA and to Dr. John Wambaugh, of the US EPA and co-leader of the ExpoCast project for his advice regarding the transformation of ToxCast data. The contents of this paper, including any opinions and/or conclusions expressed, are those of the authors alone and do not necessarily reflect HSE or European Commission policy.
Supplementary Material
The Supplementary Material for this article can be found online at: https://www.frontiersin.org/articles/10.3389/fphar.2021.754408/full#supplementary-material
Footnotes
1https://comptox.epa.gov/dashboard/dsstoxdb/results?search=DTXSID7020182#invitrodb-bioassays-toxcast-tox21 (as on 27/09/2021)
2https://www.gnu.org/software/mcsim/
3https://github.com/GMPtk/MCSimViaRtools
4http://cefic-lri.org/toolbox/r-vis-open-access-pbpk-modelling-platform/
5https://github.com/GMPtk/RVis/releases
6https://efsa.openanalytics.eu/
7https://www.epa.gov/endocrine-disruption/endocrine-disruptor-screening-program-edsp-overview
8https://www.epa.gov/chemical-research/toxicity-forecasting
9https://comptox.epa.gov/dashboard
References
Adam, A. H. B., Zhang, M., de Haan, L. H. J., van Ravenzwaay, B., Louisse, J., and Rietjens, I. M. C. M. (2019). The In Vivo developmental toxicity of diethylstilbestrol (des) in rat evaluated by an alternative testing strategy. Arch. Toxicol. 93 (7), 2021–2033. doi:10.1007/s00204-019-02487-6
Armitage, J. M., Wania, F., and Arnot, J. A. (2014). Application of Mass Balance Models and the Chemical Activity Concept to Facilitate the Use of In Vitro Toxicity Data for Risk Assessment. Environ. Sci. Technol. 48 (16), 9770–9779. doi:10.1021/es501955g
Bale, A. S., Kenyon, E., Flynn, T. J., Lipscomb, J. C., Mendrick, D. L., Hartung, T., et al. (2014). Correlating In Vitro Data to In Vivo Findings for Risk Assessment. ALTEX 31 (1), 79–90. doi:10.14573/altex.1310011
Bell, S. M., Chang, X., Wambaugh, J. F., Allen, D. G., Bartels, M., Brouwer, K. L. R., et al. (2018). In Vitro to In Vivo Extrapolation for High Throughput Prioritization and Decision Making. Toxicol. Vitro 47, 213–227. doi:10.1016/j.tiv.2017.11.016
Berggren, E., White, A., Ouedraogo, G., Paini, A., Richarz, A. N., Bois, F. Y., et al. (2017). Ab Initio chemical Safety Assessment: A Workflow Based on Exposure Considerations and Non-animal Methods. Comput. Toxicol. 4, 31–44. doi:10.1016/j.comtox.2017.10.001
Bhat, V. S., Meek, M. E. B., Valcke, M., English, C., Boobis, A., and Brown, R. (2017). Evolution of Chemical-specific Adjustment Factors (Csaf) Based on Recent International Experience; Increasing Utility and Facilitating Regulatory Acceptance. Crit. Rev. Toxicol. 47 (9), 729–749. doi:10.1080/10408444.2017.1303818
Bokkers, B. G., and Slob, W. (2005). A Comparison of Ratio Distributions Based on the Noael and the Benchmark Approach for Subchronic-To-Chronic Extrapolation. Toxicol. Sci. 85 (2), 1033–1040. doi:10.1093/toxsci/kfi144
Bokkers, B. G., and Slob, W. (2007). Deriving a Data-Based Interspecies Assessment Factor Using the Noael and the Benchmark Dose Approach. Crit. Rev. Toxicol. 37 (5), 355–373. doi:10.1080/10408440701249224
Boonpawa, R., Spenkelink, A., Punt, A., and Rietjens, I. M. C. M. (2017a). In Vitro-In Silico-based Analysis of the Dose-dependent In Vivo Oestrogenicity of the Soy Phytoestrogen Genistein in Humans. Br. J. Pharmacol. 174 (16), 2739–2757. doi:10.1111/bph.13900
Boonpawa, R., Spenkelink, A., Punt, A., and Rietjens, I. M. C. M. (2017b). Physiologically Based Kinetic Modeling of Hesperidin Metabolism and its Use to Predict In Vivo Effective Doses in Humans. Mol. Nutr. Food Res. 61 (8), 1600894. doi:10.1002/mnfr.201600894
Brown, R. P., Delp, M. D., Lindstedt, S. L., Rhomberg, L. R., and Beliles, R. P. (1997). Physiological Parameter Values for Physiologically Based Pharmacokinetic Models. Toxicol. Ind. Health 13 (4), 407–484. doi:10.1177/074823379701300401
Carvaillo, J. C., Barouki, R., Coumoul, X., and Audouze, K. (2019). Linking Bisphenol S to Adverse Outcome Pathways Using a Combined Text Mining and Systems Biology Approach. Environ. Health Perspect. 127 (4), 47005. doi:10.1289/EHP4200
Comenges, J. M. Z., Joossens, E., Benito, J. V. S., Worth, A., and Paini, A. (2017). Theoretical and Mathematical Foundation of the Virtual Cell Based Assay - A Review. Toxicol. Vitro 45, 209–221. doi:10.1016/j.tiv.2016.07.013
EFSA Panel on Food Contact Materials and Aids (2015). Scientific Opinion on the Risks to Public Health Related to the Presence of Bisphenol a (Bpa) in Foodstuffs. EFSA J. 13 (1), 3978.
EFSA Scientific Committee Hardy, A., Hardy, A., Benford, D., Halldorsson, T., Jeger, M. J., Knutsen, H. K., et al. (2017a). Guidance on the Use of the Weight of Evidence Approach in Scientific Assessments. EFSA J. 15 (8), e04971. doi:10.2903/j.efsa.2017.4971
EFSA Scientific Committee Hardy, A., Hardy, A., Benford, D., Halldorsson, T., Jeger, M. J., Knutsen, K. H., et al. (2017b). Update: Use of the Benchmark Dose Approach in Risk Assessment. EFSA J. 15 (1), e04658. doi:10.2903/j.efsa.2017.4658
European Food Safety, A. (2009). Guidance of the Scientific Committee on Use of the Benchmark Dose Approach in Risk Assessment. EFSA J. 7 (6), 1150.
Fenichel, P., Chevalier, N., and Brucker-Davis, F. (2013). Bisphenol a: An Endocrine and Metabolic Disruptor. AnnEndocrinol. 74, 211–220. doi:10.1016/j.ando.2013.04.002
Filer, D. L., Kothiya, P., Setzer, W. R., Judson, R. S., and Martin, M. T. (2014). The Toxcast Analysis Pipeline: An R Package for Processing and Modeling Chemical Screening Data. US Environmental Protection Agency. Available at: http://www epa gov/ncct/toxcast/files/MySQL% 20Database/Pipeline_Overview pdf.
Fischer, F. C., Henneberger, L., König, M., Bittermann, K., Linden, L., Goss, K. U., et al. (2017). Modeling Exposure in the Tox21 In Vitro Bioassays. Chem. Res. Toxicol. 30 (5), 1197–1208. doi:10.1021/acs.chemrestox.7b00023
Fisher, C., Siméon, S., Jamei, M., Gardner, I., and Bois, Y. F. (2019). Vivd: Virtual In Vitro Distribution Model for the Mechanistic Prediction of Intracellular Concentrations of Chemicals in In Vitro Toxicity Assays. Toxicol. Vitro 58, 42–50. doi:10.1016/j.tiv.2018.12.017
Gelman, A., Bois, F., and Jiang, J. (1996). Physiological Pharmacokinetic Analysis Using Population Modeling and Informative Prior Distributions. J. Am. Stat. Assoc. 91 (436), 1400–1412. doi:10.1080/01621459.1996.10476708
Groothuis, F. A., Heringa, M. B., Nicol, B., Hermens, J. L., Blaauboer, B. J., and Kramer, N. I. (2015). Dose Metric Considerations in In Vitro Assays to Improve Quantitative In Vitro-In Vivo Dose Extrapolations. Toxicology 332, 30–40. doi:10.1016/j.tox.2013.08.012
ICRP (2002). Basic Anatomical and Physiological Data for Use in Radiological protection: Reference Values. Pergamon.
Ingenbleek, L., Lautz, L., Dervilly, G., Darney, K., Astuto, M. C., Tarazona, J., et al. (2021). Risk Assessment of Chemicals in Food and Feed: Principles, Applications and Future Perspectives. Cambridge: Royal Society of Chemisry.
Judson, R. S., Kavlock, R. J., Setzer, R. W., Hubal, E. A., Martin, M. T., Knudsen, T. B., et al. (2011). Estimating Toxicity-Related Biological Pathway Altering Doses for High-Throughput Chemical Risk Assessment. Chem. Res. Toxicol. 24 (4), 451–462. doi:10.1021/tx100428e
Kramer, N. I., Di Consiglio, E., Blaauboer, B. J., and Testai, E. (2015). Biokinetics in Repeated-Dosing In Vitro Drug Toxicity Studies. Toxicol. Vitro 30 (1 Pt A), 217–224. doi:10.1016/j.tiv.2015.09.005
Li, H., Zhang, M., Vervoort, J., Rietjens, I. M., van Ravenzwaay, B., and Louisse, J. (2017). Use of Physiologically Based Kinetic Modeling-Facilitated Reverse Dosimetry of In Vitro Toxicity Data for Prediction of In Vivo Developmental Toxicity of Tebuconazole in Rats. Toxicol. Lett. 266 (Suppl. C), 85–93. doi:10.1016/j.toxlet.2016.11.017
Loizou, G. D., McNally, K., Dorne, J-L., and Hogg, A. (2021). Derivation of a Human In Vivo Benchmark Dose for Perfluorooctanoic Acid from Toxcast In Vitro Concentration Response Data Using a Computational Workflow for Probabilistic Quantitative In Vitro to In Vivo Extrapolation. Front. Pharmacol. 12, 570. doi:10.3389/fphar.2021.630457
Louisse, J., Beekmann, K., and Rietjens, I. M. (2017). Use of Physiologically Based Kinetic Modeling-Based Reverse Dosimetry to Predict In Vivo Toxicity from In Vitro Data. Chem. Res. Toxicol. 30 (1), 114–125. doi:10.1021/acs.chemrestox.6b00302
Louisse, J., de Jong, E., van de Sandt, J. J., Blaauboer, B. J., Woutersen, R. A., Piersma, A. H., et al. (2010). The Use of In Vitro Toxicity Data and Physiologically Based Kinetic Modeling to Predict Dose-Response Curves for In Vivo Developmental Toxicity of Glycol Ethers in Rat and Man. Toxicol. Sci. 118 (2), 470–484. doi:10.1093/toxsci/kfq270
Louisse, J., Verwei, M., Woutersen, R. A., Blaauboer, B. J., and Rietjens, I. M. (2012). Toward In Vitro Biomarkers for Developmental Toxicity and Their Extrapolation to the In Vivo Situation. Expert Opin. Drug Metab. Toxicol. 8 (1), 11–27. doi:10.1517/17425255.2012.639762
Mazur, C. S., Kenneke, J. F., Hess-Wilson, J. K., and Lipscomb, J. C. (2010). Differences between Human and Rat Intestinal and Hepatic Bisphenol a Glucuronidation and the Influence of Alamethicin on In Vitro Kinetic Measurements. Drug Metab. Dispos. 38 (12), 2232–2238. doi:10.1124/dmd.110.034819
McNally, K., Cotton, R., Cocker, J., Jones, K., Bartels, M., Rick, D., et al. (2012). Reconstruction of Exposure to M-Xylene from Human Biomonitoring Data Using Pbpk Modelling, Bayesian Inference, and Markov Chain Monte Carlo Simulation. J. Toxicol. 2012, 760281. doi:10.1155/2012/760281
McNally, K., Cotton, R., Hogg, A., and Loizou, G. (2014). Popgen: A Virtual Human Population Generator. Toxicology 315 (0), 70–85. doi:10.1016/j.tox.2013.07.009
McNally, K., Cotton, R., and Loizou, G. D. (2011). A Workflow for Global Sensitivity Analysis of Pbpk Models. Front. Pharmacol. 2, 31–21. doi:10.3389/fphar.2011.00031
McNally, K., Hogg, A., and Loizou, G. (2018). A Computational Workflow for Probabilistic Quantitative In Vitro to In Vivo Extrapolation. Front. Pharmacol. 9 (508), 508. doi:10.3389/fphar.2018.00508
McNally, K., and Loizou, G. D. (2015). A Probabilistic Model of Human Variability in Physiology for Future Application to Dose Reconstruction and Qivive. Front. Pharmacol. 6, 213. doi:10.3389/fphar.2015.00213
McNally, K., Sams, C., Hogg, A., Lumen, A., and Loizou, G. (2021). Development, Testing, Parameterisation and Calibration of a Human Pbpk Model for the Plasticiser, Di-(2-propylheptyl) Phthalate (Dphp) Using In Silico, In Vitro and Human Biomonitoring Data. Front. Pharmacol. 12 (2264), 692442. doi:10.3389/fphar.2021.692442
Mesnage, R., Phedonos, A., Arno, M., Balu, S., Corton, J. C., and Antoniou, M. N. (2017). Editor's Highlight: Transcriptome Profiling Reveals Bisphenol A Alternatives Activate Estrogen Receptor Alpha in Human Breast Cancer Cells. Toxicol. Sci. 158 (2), 431–443. doi:10.1093/toxsci/kfx101
Offman, E., Phipps, C., and Edginton, A. N. (2016). Population Physiologically-Based Pharmacokinetic Model Incorporating Lymphatic Uptake for a Subcutaneously Administered Pegylated Peptide. Silico Pharmacol. 4 (3), 3–14. doi:10.1186/s40203-016-0018-5
Pacifici, G. M., Franchi, M., Bencini, C., Repetti, F., Di Lascio, N., and Muraro, G. B. (1988). Tissue Distribution of Drug-Metabolizing Enzymes in Humans. Xenobiotica 18 (7), 849–856. doi:10.3109/00498258809041723
Paini, A., Sala Benito, J. V., Bessems, J., and Worth, A. P. (2017). From In Vitro to In Vivo: Integration of the Virtual Cell Based Assay with Physiologically Based Kinetic Modelling. Toxicol. Vitro 45 (2), 241–248. doi:10.1016/j.tiv.2017.06.015
Pouillot, R., and Delignette-Muller, M. L. (2010). Evaluating Variability and Uncertainty Separately in Microbial Quantitative Risk Assessment Using Two R Packages. Int. J. Food Microbiol. 142 (3), 330–340. doi:10.1016/j.ijfoodmicro.2010.07.011
Proença, S., Escher, B. I., Fischer, F. C., Fisher, C., Grégoire, S., Hewitt, N. J., et al. (2021). Effective Exposure of Chemicals in In Vitro Cell Systems: A Review of Chemical Distribution Models. Toxicol. Vitro, 105133.
Proença, S., Paini, A., Joossens, E., Benito, J. V. S., Berggren, E., Worth, A., et al. (2019). Insights into In Vitro Biokinetics Using Virtual Cell Based Assay Simulations. ALTEX-Alternatives Anim. Experimentation 36 (3), 447–461.
Pujol, G., Iooss, B., Fruth, J., Gilquin, L., Guillaume, J., Touati, T., et al. 2015. With contributions from sebastien da veiga sensitivity: Sensitivity Analysis, R package version. 1(1).
Punt, A., Peijnenburg, A. A., Hoogenboom, R. L., and Bouwmeester, H. (2017). Non-animal Approaches for Toxicokinetics in Risk Evaluations of Food Chemicals. Altex 34, 501–514. doi:10.14573/altex.1702211
R Development Core Team, (2008). R: A Language and Environment for Statistical Computing. Vienna. Available at: http://www.R-project.org: R Foundation for Statistical Computing.
Rochester, J. R. (2013). Bisphenol a and Human Health: A Review of the Literature. Reprod. Toxicol. 42, 132–155. doi:10.1016/j.reprotox.2013.08.008
Rowland, M. A., Perkins, E. J., and Mayo, M. L. (2017). Physiological Fidelity or Model Parsimony? the Relative Performance of Reverse-Toxicokinetic Modeling Approaches. BMC Syst. Biol. 11 (1), 35. doi:10.1186/s12918-017-0407-3
Ryan, N. (2017). A User's Guide for Accessing and Interpreting Toxcasttm Data. Bayer. Available at: https://lri.Americanchemistry.Com/users-guide-for-accessing-and-interpreting-toxcast-data.Pdf.
Schmitt, W. (2008). General Approach for the Calculation of Tissue to Plasma Partition Coefficients. Toxicol. Vitro 22 (2), 457–467. doi:10.1016/j.tiv.2007.09.010
Shi, M., Bouwmeester, H., Rietjens, I. M. C. M., and Strikwold, M. (2020). Integrating In Vitro Data and Physiologically Based Kinetic Modeling-Facilitated Reverse Dosimetry to Predict Human Cardiotoxicity of Methadone. Arch. Toxicol. 94, 2809–2827. doi:10.1007/s00204-020-02766-7
Soars, M. G., Burchell, B., and Riley, R. J. (2002). In Vitro analysis of Human Drug Glucuronidation and Prediction of In Vivo Metabolic Clearance. J. Pharmacol. Exp. Ther. 301 (1), 382–390. doi:10.1124/jpet.301.1.382
Soetaert, K., Petzoldt, T., and Setzer, R. W. (2010). Solving Differential Equations in R. Package Desolve 33 (9), 25. doi:10.32614/rj-2010-013
Strikwold, M., Spenkelink, B., Woutersen, R. A., Rietjens, I. M., and Punt, A. (2013). Combining In Vitro Embryotoxicity Data with Physiologically Based Kinetic (Pbk) Modelling to Define In Vivo Dose-Response Curves for Developmental Toxicity of Phenol in Rat and Human. Arch. Toxicol. 87 (9), 1709–1723. doi:10.1007/s00204-013-1107-4
Strikwold, M., Spenkelink, B., Woutersen, R. A., Rietjens, I. M. C. M., and Punt, A. (2017). Development of a Combined In Vitro Physiologically Based Kinetic (Pbk) and Monte Carlo Modelling Approach to Predict Interindividual Human Variation in Phenol-Induced Developmental Toxicity. Toxicol. Sci. 157 (2), 365–376. doi:10.1093/toxsci/kfx054
Tanneberger, K., Rico-Rico, A., Kramer, N. I., Busser, F. J., Hermens, J. L., and Schirmer, K. (2010). Effects of Solvents and Dosing Procedure on Chemical Toxicity in Cell-Based In Vitro Assays. Environ. Sci. Technol. 44 (12), 4775–4781. doi:10.1021/es100045y
Thayer, K. A., Doerge, D. R., Hunt, D., Schurman, S. H., Twaddle, N. C., Churchwell, M. I., et al. (2015). Pharmacokinetics of Bisphenol a in Humans Following a Single Oral Administration. Environ. Int. 83, 107–115. doi:10.1016/j.envint.2015.06.008
Wang, T., Lu, J., Xu, M., Xu, Y., Li, M., Liu, Y., et al. (2013). Urinary Bisphenol a Concentration and Thyroid Function in Chinese Adults. Epidemiology 24, 295–302. doi:10.1097/EDE.0b013e318280e02f
Wetherill, Y. B., Akingbemi, B. T., Kanno, J., McLachlan, J. A., Nadal, A., Sonnenschein, C., et al. (2007). In Vitro molecular Mechanisms of Bisphenol a Action. Reprod. Toxicol. 24 (2), 178–198. doi:10.1016/j.reprotox.2007.05.010
Wickham, H. (2007). Reshaping Data with the Reshape Package. J. Stat. Softw. 21 (12), 1–20. doi:10.18637/jss.v021.i12
Worth, A. P., Louisse, J., Macko, P., Sala Benito, J. V., and Paini, A. (2017). Virtual Cell Based Assay Simulations of Intra-mitochondrial Concentrations in Hepatocytes and Cardiomyocytes. Toxicol. Vitro 45, 222–232. doi:10.1016/j.tiv.2017.09.009
Yoon, M., Blaauboer, B. J., and Clewell, H. J. (2015). Quantitative In Vitro to In Vivo Extrapolation (Qivive): An Essential Element for In Vitro-based Risk Assessment. Toxicology 332, 1–3. doi:10.1016/j.tox.2015.02.002
Yoon, M., Campbell, J. L., Andersen, M. E., and Clewell, H. J. (2012). Quantitative In Vitro to In Vivo Extrapolation of Cell-Based Toxicity Assay Results. Crit. Rev. Toxicol. doi:10.3109/10408444.2012.692115
Zhang, M., van Ravenzwaay, B., and Rietjens, I. M. (2020). Development of a Generic Physiologically Based Kinetic Model to Predict In Vivo Uterotrophic Responses Induced by Estrogenic Chemicals in Rats Based on In Vitro Bioassays. Toxicol. Sci. 173 (1), 19–31.
Zhao, S., Kamelia, L., Boonpawa, R., Wesseling, S., Spenkelink, B., and Rietjens, I. M. C. M. (2019). Physiologically Based Kinetic Modelling-Facilitated Reverse Dosimetry to Predict In Vivo Red Blood Cell Acetylcholinesterase Inhibition Following Exposure to Chlorpyrifos in the Caucasian and Chinese Population. Toxicol. Sci. 171 (1), 69–83. doi:10.1093/toxsci/kfz134
Keywords: PBK, in silico, in vitro, QIVIVE, BPA (bisphenol A)
Citation: Loizou G, McNally K, Paini A and Hogg A (2022) Derivation of a Human In Vivo Benchmark Dose for Bisphenol A from ToxCast In Vitro Concentration Response Data Using a Computational Workflow for Probabilistic Quantitative In Vitro to In Vivo Extrapolation. Front. Pharmacol. 12:754408. doi: 10.3389/fphar.2021.754408
Received: 06 August 2021; Accepted: 15 November 2021;
Published: 11 February 2022.
Edited by:
Albert P. Li, In Vitro ADMET Laboratories, United StatesReviewed by:
Alberto Mantovani, National Institute of Health (ISS), ItalyNan-Hung Hsieh, California Department of Pesticide Regulation, United States
Copyright © 2022 Loizou, McNally, Paini and Hogg. This is an open-access article distributed under the terms of the Creative Commons Attribution License (CC BY). The use, distribution or reproduction in other forums is permitted, provided the original author(s) and the copyright owner(s) are credited and that the original publication in this journal is cited, in accordance with accepted academic practice. No use, distribution or reproduction is permitted which does not comply with these terms.
*Correspondence: George Loizou, Z2VvcmdlLkxvaXpvdUBoc2UuZ292LnVr
 George Loizou
 Kevin McNally
 Alicia Paini
 Alex Hogg1
