Abstract
Background: Several risk factors have been identified for CCA, however, whether such associations were causal remains unknown.
Methods: Mendelian randomization (MR) has been applied to examine the causal relationship between 26 putative risk factors and CCA. The genetic variants for each risk factor were extracted from their corresponding genome-wide association study (GWAS) if they reached the genome-wide significance (p-value < 5 × 10⁻⁸). The genetic associations with CCA were obtained from the publicly available GWAS with the largest sample size. Mainly, inverse-variance weighted (IVW) has been adopted to estimate the causal effect on CCA. Both multivariable and mediation MR analyses were carried out to detect independent factors.
Results: Three putative risk factors can causally elevate the risk of CCA after FDR correction, including liver fat content (LFC), non-alcoholic fatty liver disease (NAFLD), and cholelithiasis. The odds of CCA would increase per 1-SD increase in the liver fat content (LFC) (OR = 2.12 [1.66, 2.71]) and logOR of NAFLD. The genetic liability to cholelithiasis would increase the risk of CCA as well (OR = 2.17 [1.47, 3.20]). They were still significant in other methods. The multivariable MR analysis indicated that genetically-elevated LFC should increase the risk of CCA independently of cholelithiasis (OR = 1.88 [1.39, 2.55]). In the mediation MR analysis, the indirect effect was not significant when treating cholelithiasis as the mediator (indirect OR = 0.95 [0.85, 1.07]).
Conclusion: This MR study identified that gallstone and liver fat accumulation are two independent risk factors of CCA, suggesting two modifiable ways of preventing CCA.
Introduction
Cholangiocarcinoma (CCA) is an aggressive malignancy of the bile duct and its incidence and mortality rates are increasing globally (Banales et al., 2020). CCAs are often diagnosed in the advanced stages as they usually display few symptoms in the early stage, suggesting a poor prognosis (Banales et al., 2016). The mainstream therapeutics of unresectable or metastatic CCAs are palliative chemotherapies, while the median overall survival (OS) is far from satisfactory (11.7 months) (Banales et al., 2016; Abou-Alfa et al., 2020). Even with only the approved CCA-targeted drugs, pemigatinib-targeting fibroblast growth factor receptor (FGFR) fusion and ivosidenib-targeting isocitrate dehydrogenase (IDH)-1 mutation, the median OS still represents less than 22 months in advanced CCA patients (Abou-Alfa et al., 2020; Zhu et al., 2021). Thus, it is important to identify modifiable risk factors of CCA. Recently, the consensus statement of CCA summarized its potential risk factors (Banales et al., 2020), and the majority of them are derived from a meta-analysis that systematically scrutinized 13 risk factors of CCA (Clements et al., 2020). These risk factors include primary sclerosing cholangitis (PSC), cysts and stones in the bile duct, cirrhosis, liver fluke, chronic hepatitis B or C viruses, non-alcoholic fatty liver disease (NAFLD), chronic pancreatitis, type 2 diabetes mellitus (T2DM), obesity, hypertension, inflammatory bowel disease (IBD), hemochromatosis, smoking, and alcohol consumption. It should be noted that most of these risk factors were determined based on case-control studies and whether such associations are causal are largely unknown.
Classical case-control studies based on observational data can only delineate the associations between the risk factors and targeted outcomes while failing to judge whether such associations are causal due to the existence of confounders (D'Onofrio et al., 2020). Mendelian randomization (MR) is a rising method of causal inference in genetic epidemiology using genetic variants as instrumental variables (IV) and has made substantial contributions to medical research (Emdin et al., 2017). For example, Voight et al. ruled out the protective effect of HDL cholesterol on myocardial infarction, correcting the mindset that HDL-C is a “good lipid” (Voight et al., 2012). As germline genetic variants are randomly allocated at conception, they should be free of potential confounders and MR can be a proxy for randomized control trials (RCT) (Smith and Ebrahim, 2003). Furthermore, MR can usually be performed based on observational data and is a cost-effective and time-saving method compared to RCT.
Until now, no studies have examined the causal relationship between the risk factors and CCA yet and it can be ascribed to the lack of a genome-wide association study (GWAS) on CCA. Several MR studies examined the causal risk factors of gallbladder cancer (GBC) where they identified that gallstones should be a common risk factor of GBC in Chileans (Barahona Ponce et al., 2021), Chinese (Pang et al., 2021), and Indians (Mhatre et al., 2021). However, the causal effect of the body mass index (BMI) on GBC was inconsistent as there was a positive causal effect in Chileans (Barahona Ponce et al., 2021) while it attenuated to zero in Europeans (Fang et al., 2021), suggesting that ethnical specificity should be taken into account. The germline genetic variants of CCA have been established in the genomic feature analysis of Japanese and Italian populations (Wardell et al., 2018) and it is rational to examine the causal effects of putative risk factors on it. Here, we hope to leverage the published GWAS summary statistics to identify the causal risk factors of CCA using the MR method.
Materials and methods
Data source description
The GWAS summary statistics of predefined risk factors were obtained from several large GWAS consortia and can be divided into six categories, including hepatobiliary diseases and their associated indices, obesity-related traits, diabetes and its associated traits, blood lipids, blood pressure, and smoking and drinking. Since their GWAS summary statistics are unavailable, the cystic diseases of the bile duct were not included as the exposures.
The hepatobiliary diseases consisted of cholelithiasis, chronic pancreatitis, non-alcoholic fatty liver disease (NAFLD), primary biliary cholangitis (PBC), primary sclerosing cholangitis (PSC), and liver cirrhosis. As an essential index for NAFLD, liver fat content was also incorporated into this modality. The cases of cholelithiasis from Iceland were denoted according to the International Classification of Disease (ICD) codes (ICD-10 K80 and ICD-9 574) and those from the United Kingdom Biobank (UKB) were determined based on the self-reported non-cancer illness (Data-Field 20002) and ICD diagnoses (ICD-9 code 574 or ICD-10 code K80) (Ferkingstad et al., 2018). The chronic pancreatitis cases were diagnosed by the ICD-10 code K11 and the cases of liver cirrhosis were selected using a broad definition as previously described by Emdin et al. (2020). All NAFLD cases were confirmed in both CT-proven and biopsy-proven steatoses (Speliotes et al., 2011). Considering that liver fat content (LFC) is an essential indicator for liver steatosis, the genetic proxies for LFC were obtained as well (Liu et al., 2021). All PBC cases were selected using a self-reported method (Cordell et al., 2015) and the cases of PSC were diagnosed by using standard clinical, biochemical, cholangiographic, and histological criteria (Ji et al., 2017).
The obesity-associated traits include the body mass index (BMI) (Locke et al., 2015), waist-to-hip ratio (WHR) (Shungin et al., 2015), and body fat percentage (BFP) (Lu et al., 2016). Type 2 diabetes mellitus (T2DM) (Mahajan et al., 2014) and its associated indices were included as putative risk factors, namely fasting insulin, fasting glucose, glycated hemoglobin (HbA1c), and 2-h oral glucose tolerance testing (2-h OGTT) (Chen et al., 2021a). Furthermore, other putative risk factors included total cholesterol (TC), triglycerides (TG), low-density lipoprotein cholesterol (LDL-C), high-density lipoprotein cholesterol (HDL-C) (Willer et al., 2013), systolic blood pressure (SBP), and diastolic blood pressure (DBP) (Evangelou et al., 2018). As for smoking and drinking, they were all continuous variables where the average number of cigarettes smoked per day represents smoking and the average number of drinks each week was drinking.
The GWAS of CCA was performed in 635,710 participants, including 476,091 Europeans (832 cases) and 159,619 East Asians (418 cases), adjusting for age, age2, sex, age × sex, age2 × sex, and the first 20 genetic principal components, using SAIGE (v.0.37) to control for the case–control imbalance (Zhou et al., 2018; Sakaue et al., 2021). The genomic control has been applied to each GWAS and details are displayed in Table 1. The IV information can be found in Supplementary Table S1.
TABLE 1
| Risk factor | Consortium | Ancestry | Sample size | I2 | NSNP | R2 (%) | F statistic | Covariate | Unit | PMID |
|---|---|---|---|---|---|---|---|---|---|---|
| Cholelithiasis | Iceland + UKB | European | 764,012 | 0.99 | 27 | 0.37 | 103.95 | - | 1 unit in logOR | 30504769 |
| Cirrhosis | FinnGen | European | 218,792 | 0.96 | 25 | 0.37 | 32.46 | age, sex, 10 PCs and genotyping batch | 1 unit in logOR | - |
| PBC | - | European | 13,239 | 0.98 | 26 | 13.88 | 81.87 | principal components | 1 unit in logOR | 26394269 |
| PSC | IPSCSG | Mixed | 24,751 | 0.99 | 28 | 19.78 | 217.65 | principal components and genotyping batch | 1 unit in logOR | 27992413 |
| Chronic pancreatitis | FinnGen | European | 196,811 | 0.94 | 23 | 0.35 | 30.00 | age, sex, 10 PCs and genotyping batch | 1 unit in logOR | - |
| NAFLD | GOLD | European | 7,176 | 0.99 | 5 | 6.14 | 93.84 | age, age squared, sex, alcohol consumption, and first 10 principal components | 1 unit in logOR | 21423719 |
| LFC | UKB | European | 32,858 | 0.99 | 13 | 5.13 | 136.70 | age at imaging visit, age squared, sex, imaging center, scan date, scan time, and genotyping batch | SD | 34128465 |
| HDL-C | GLGC | Mixed | 188,577 | 0.97 | 125 | 7.01 | 113.73 | age, age2, and sex | SD | 24097068 |
| LDL-C | GLGC | Mixed | 188,577 | 0.98 | 99 | 7.11 | 145.74 | age, age2, and sex | SD | 24097068 |
| Total cholesterol | GLGC | Mixed | 188,577 | 0.98 | 117 | 7.29 | 126.65 | age, age2, and sex | SD | 24097068 |
| Triglycerides | GLGC | Mixed | 188,577 | 0.98 | 71 | 5.09 | 142.45 | age, age2, and sex | SD | 24097068 |
| T2DM | DIAGRAM | Mixed | 110,452 | 0.98 | 26 | 1.97 | 85.46 | study-specific components | 1 unit in logOR | 24509480 |
| 2-h glucose | MAGIC | European | 281,416 | 0.98 | 14 | 0.32 | 64.67 | study-specific covariates | SD | 34059833 |
| Fasting glucose | MAGIC | European | 281,416 | 0.99 | 16 | 0.73 | 129.21 | study-specific covariates | SD | 34059833 |
| Fasting insulin | MAGIC | European | 281,416 | 0.98 | 43 | 0.78 | 51.74 | study-specific covariates | SD | 34059833 |
| HbA1c | MAGIC | European | 281,416 | 0.99 | 94 | 3.16 | 97.68 | study-specific covariates | SD | 34059833 |
| SBP | ICBP | European | 757,601 | 0.98 | 761 | 6.67 | 71.04 | sex, age, age2, BMI and genotyping chip | SD | 30224653 |
| DBP | ICBP | European | 757,601 | 0.98 | 788 | 7.16 | 74.03 | sex, age, age2, BMI and genotyping chip | SD | 30224653 |
| IBD | - | Mixed | 59,957 | 0.98 | 130 | 16.02 | 87.76 | first ten principal components | 1 unit in logOR | 28067908 |
| Ulcerative colitis | - | Mixed | 45,975 | 0.99 | 69 | 11.41 | 85.67 | first ten principal components | 1 unit in logOR | 28067908 |
| Crohn’s disease | - | Mixed | 40,266 | 0.99 | 106 | 20.53 | 97.87 | first ten principal components | 1 unit in logOR | 28067908 |
| BMI | GIANT | European | 234,069 | 0.90 | 95 | 1.61 | 40.40 | sex, age, age squared, and principal components | SD | 25673413 |
| WHR | GIANT | European | 210,088 | 0.92 | 33 | 0.46 | 29.64 | age, age square, and study-specific covariates | SD | 25673412 |
| BFP | - | European | 65,831 | 0.98 | 10 | 0.67 | 44.60 | sex, age, age squared, and study-specific covariates | SD | 26833246 |
| Smoking | GSCAN | European | 249,752 | 0.99 | 28 | 1.03 | 92.79 | age, sex, age × sex interaction, and the first 10 genetic principle components | SD | 30643251 |
| Drinking | GSCAN | European | 335,394 | 0.99 | 39 | 0.54 | 46.37 | age, sex, age × sex interaction, and the first 10 genetic principle components | SD | 30643251 |
Summarized GWAS information of each putative risk factor.
Notes: GWAS, genome-wide association study; Risk factor, the name of putative risk factors; Consortium, the name of GWAS, consortium; Ancestry, the ethnical background of samples in GWAS; Sample size, the sample size of GWAS; I2, the I square to appraise the violation of “No Measurement Error” assumption; NSNP, the number of included single nucleotide polymorphism (SNP); R2(%), the proportion of variance in the risk factor explained by SNP; F statistic, the F statistic to appraise weak instrument bias; Covariate, the included covariates of GWAS; Unit, the unit of risk factor; PMID, the publication ID, in the PubMed of GWAS; PBC, primary biliary cholangitis; PSC, primary sclerosing cholangitis; NAFLD, nonalcoholic fatty liver disease; LFC, liver fat content; HDL-C, high-density lipoprotein cholesterol; LDL-C, low-density lipoprotein cholesterol; T2DM, type 2 diabetes mellitus; HbA1c, glycated hemoglobin; SBP, systolic blood pressure; DBP, diastolic blood pressure; IBD, inflammatory bowel disease; BMI, body mass index; WHR, waist-to-hip ratio; BFP, body fat percentage; UKB, United Kingdom Biobank; IPSCSG, International PSC Study Group; GOLD, Genetics of Obesity-related Liver Disease; GLGC, Global Lipids Genetics Consortium; DIAGRAM, DIAbetes Genetics Replication And Meta-analysis consortium; MAGIC, the Meta-Analyses of Glucose and Insulin-related traits Consortium; ICBP, International Consortium of Blood Pressure; GIANT, Genetic Investigation of ANthropometric Traits; GSCAN, GWAS and Sequencing Consortium of Alcohol and Nicotine use; OR, odds ratio; SD, standard deviation.
Study design and IV selection
Mendelian randomization is implemented on three principal assumptions (Banales et al., 2020) relevance: the genetic variant, usually single nucleotide polymorphism (SNP), should be closely associated with the exposure; (Banales et al., 2016) independence: the genetic variant should not be associated with any potential confounders that might affect the exposure–outcome association; (Abou-Alfa et al., 2020) exclusion restriction: the genetic variant should not be associated with the outcome except via the way of exposure (Emdin et al., 2017) (Figure 1A). Furthermore, linearity and no interaction between exposure and mediators should also be satisfied (Lawlor et al., 2008). Initially, a two-sample MR analysis was applied to estimate the causal effect between each pair of exposure–outcome associations. For significant risk factors derived from the two-sample MR, the multivariable MR analysis was performed to judge whether these causal risk factors are independent of each other (Sanderson et al., 2019) (Figure 1B). Considering cholelithiasis as a direct and strong risk factor, we further hypothesized it to be the mediator and tested this hypothesis using mediation analysis (Carter et al., 2021) (Figure 1C). Preliminarily, SNPs reaching the genome-wide significance (p-value < 5 × 10⁻⁸) were selected as IVs and they were further clumped based on the genomic region (up-/downstream 1 Mb) and linkage disequilibrium (LD, r2 = 0.01). If the number of IVs is below 3, a less stringent genome-wide significant threshold would be adopted (p-value < 1 × 10⁻⁵) (liver cirrhosis and chronic pancreatitis, Table 1).
FIGURE 1
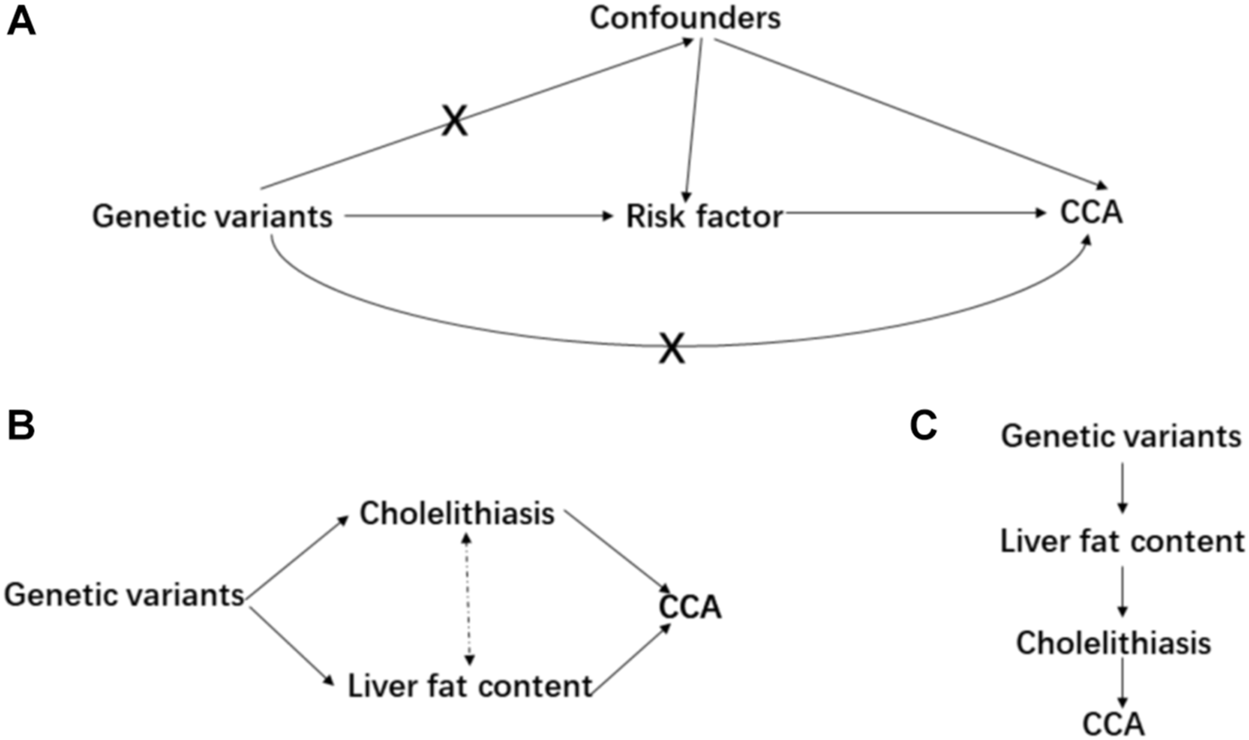
Main design of this study. (A) consists of the basic assumptions of the Mendelian randomization; (B) is the design of multivariable MR; and (C) is the design of mediation MR.
Statistical methods
For each exposure, the F statistic was calculated to appraise the weak instrument bias (Burgess and Thompson, 2011) (Table 1). Also, to judge whether the genetic variants firstly alter the exposure level and then affect the CCA via exposure, the MR Steiger directionality test was performed (Hemani et al., 2017). An inverse-variance weighted method was used as the main method and the fixed-effects model was adopted if there was no heterogeneity. If heterogeneity existed, a multiplicative random-effects model would be used. Then, we used the weighted median estimator (Bowden et al., 2016a), a method that can provide valid estimates even when up to 50% of the included SNPs are invalid instruments (Bowden et al., 2016a), and the MR-Egger regression (Bowden et al., 2015), a method generally considered to be conservative under violations of IV assumptions, was adopted in the presence of horizontal pleiotropy (Slob and Burgess, 2020). In MR-Egger, I square statistic (IGX2) was used to appraise the violation of the “No Measurement Error” (NOME) assumption (Bowden et al., 2016b) (Table 1). An IVW-based method was used in the multivariable MR analysis (Sanderson et al., 2019) and another regression-based method was adopted as well where we regress the residuals of the outcome, which were obtained from the regression model on the other exposures, on the coefficients of each exposure (Burgess and Thompson, 2015). In the mediation MR analysis, two methods were adopted called the “Product of coefficients method” and “Difference in coefficients method”, and a bootstrap method was used to obtain the 95% confidence interval (Carter et al., 2021).
Sensitivity analysis
In further sensitivity analyses, the leave-one-out sensitivity analysis and MR-PRESSO methods were used to detect outliers that could distort or drive the main results (Liu et al., 2019). We also performed the weighted mode-based estimation method, which provides the strongest estimates when the most common causal effect estimate is a consistent estimate of the true causal effect, even if the majority of instruments are invalid (Hartwig et al., 2017). The false discovery rate (FDR) was applied to control the false–positive rate in multiple comparisons. The “TwoSampleMR”, “MRPRESSO”, and “MVMR” packages were used in the analytic processes (Verbanck et al., 2018; Walker et al., 2019; Sanderson et al., 2021). Furthermore, we appraised the statistical power (https://cnsgenomics.shinyapps.io/mRnd/) (Brion et al., 2013) and sample overlapping bias (https://sb452.shinyapps.io/overlap/) (Burgess et al., 2016).
Results
Brief description of the selected IV
The smallest F statistic of all 26 risk factors was 30, greater than the empirical threshold of 10, and it suggested there should be less weak instrument bias in the analyses (Table 1). The number of included IVs ranged from 5 to 788 and each IV’s F statistic was above 10. The MR Steiger directionality test indicated that all directions are true, meaning the IV estimates are less likely to be biased by reversal causation. The NOME assumption is well satisfied as all IGX2 statistics are greater than 0.9. All these aforementioned factors guaranteed that the selected IVs are valid.
Main results of two-sample MR
Mainly, three risk factors are significant after FDR correction, namely LFC, cholelithiasis, and NAFLD. Furthermore, LDL-C and TC are marginally, causally associated with CCA where a marginal causal association was defined to be the original p-value < 0.1 while failing to pass the FDR correction.
The odds of CCA would increase with per 1-SD increase in genetically-determined LFC (OR = 2.12 [1.66, 2.71], p-value = 1.43 × 10⁻⁹). The genetic predisposition to cholelithiasis and NAFLD should also elevate the risk of CCA with per unit increase in logOR (cholelithiasis: OR = 2.17 [1.47, 3.20], p-value = 9.17 × 10⁻⁵; NAFLD: OR = 1.53 [1.18, 1.97], p-value = 0.001). Two marginally associated risk factors are LDL-C (OR = 0.84 [0.71, 0.99], p-value = 0.040) and TC (OR = 0.84 [0.71, 1.01], p-value = 0.060); however, genetically elevated LDL-C and TC might decrease the risk of CCA.
It should be noted that other metabolic exposures were not causally associated with CCA, including obesity-related indices (WHR: OR = 1.68 [0.91, 3.11], p-value = 0.096; BMI: OR = 1.31 [0.92, 1.88], p-value = 0.139; BFP: OR = 1.59 [0.70, 3.61], p-value = 0.270), T2DM (OR = 1.03 [0.86, 1.22], p-value = 0.773), and blood pressure (DBP: 0.99 [0.97, 1.01], p-value = 0.523; SBP: OR = 1.00 [0.99, 1.02], p-value = 0.533). Furthermore, no obvious causal association was detected between the other putative risk factors and CCA, even for those factors in strong association with CCA in the previous meta-analysis, such as PSC (OR = 1.03 [0.98, 1.08], p-value = 0.201) and liver cirrhosis (OR = 1.06 [0.96, 1.18], p-value = 0.245) (Figure 2).
FIGURE 2
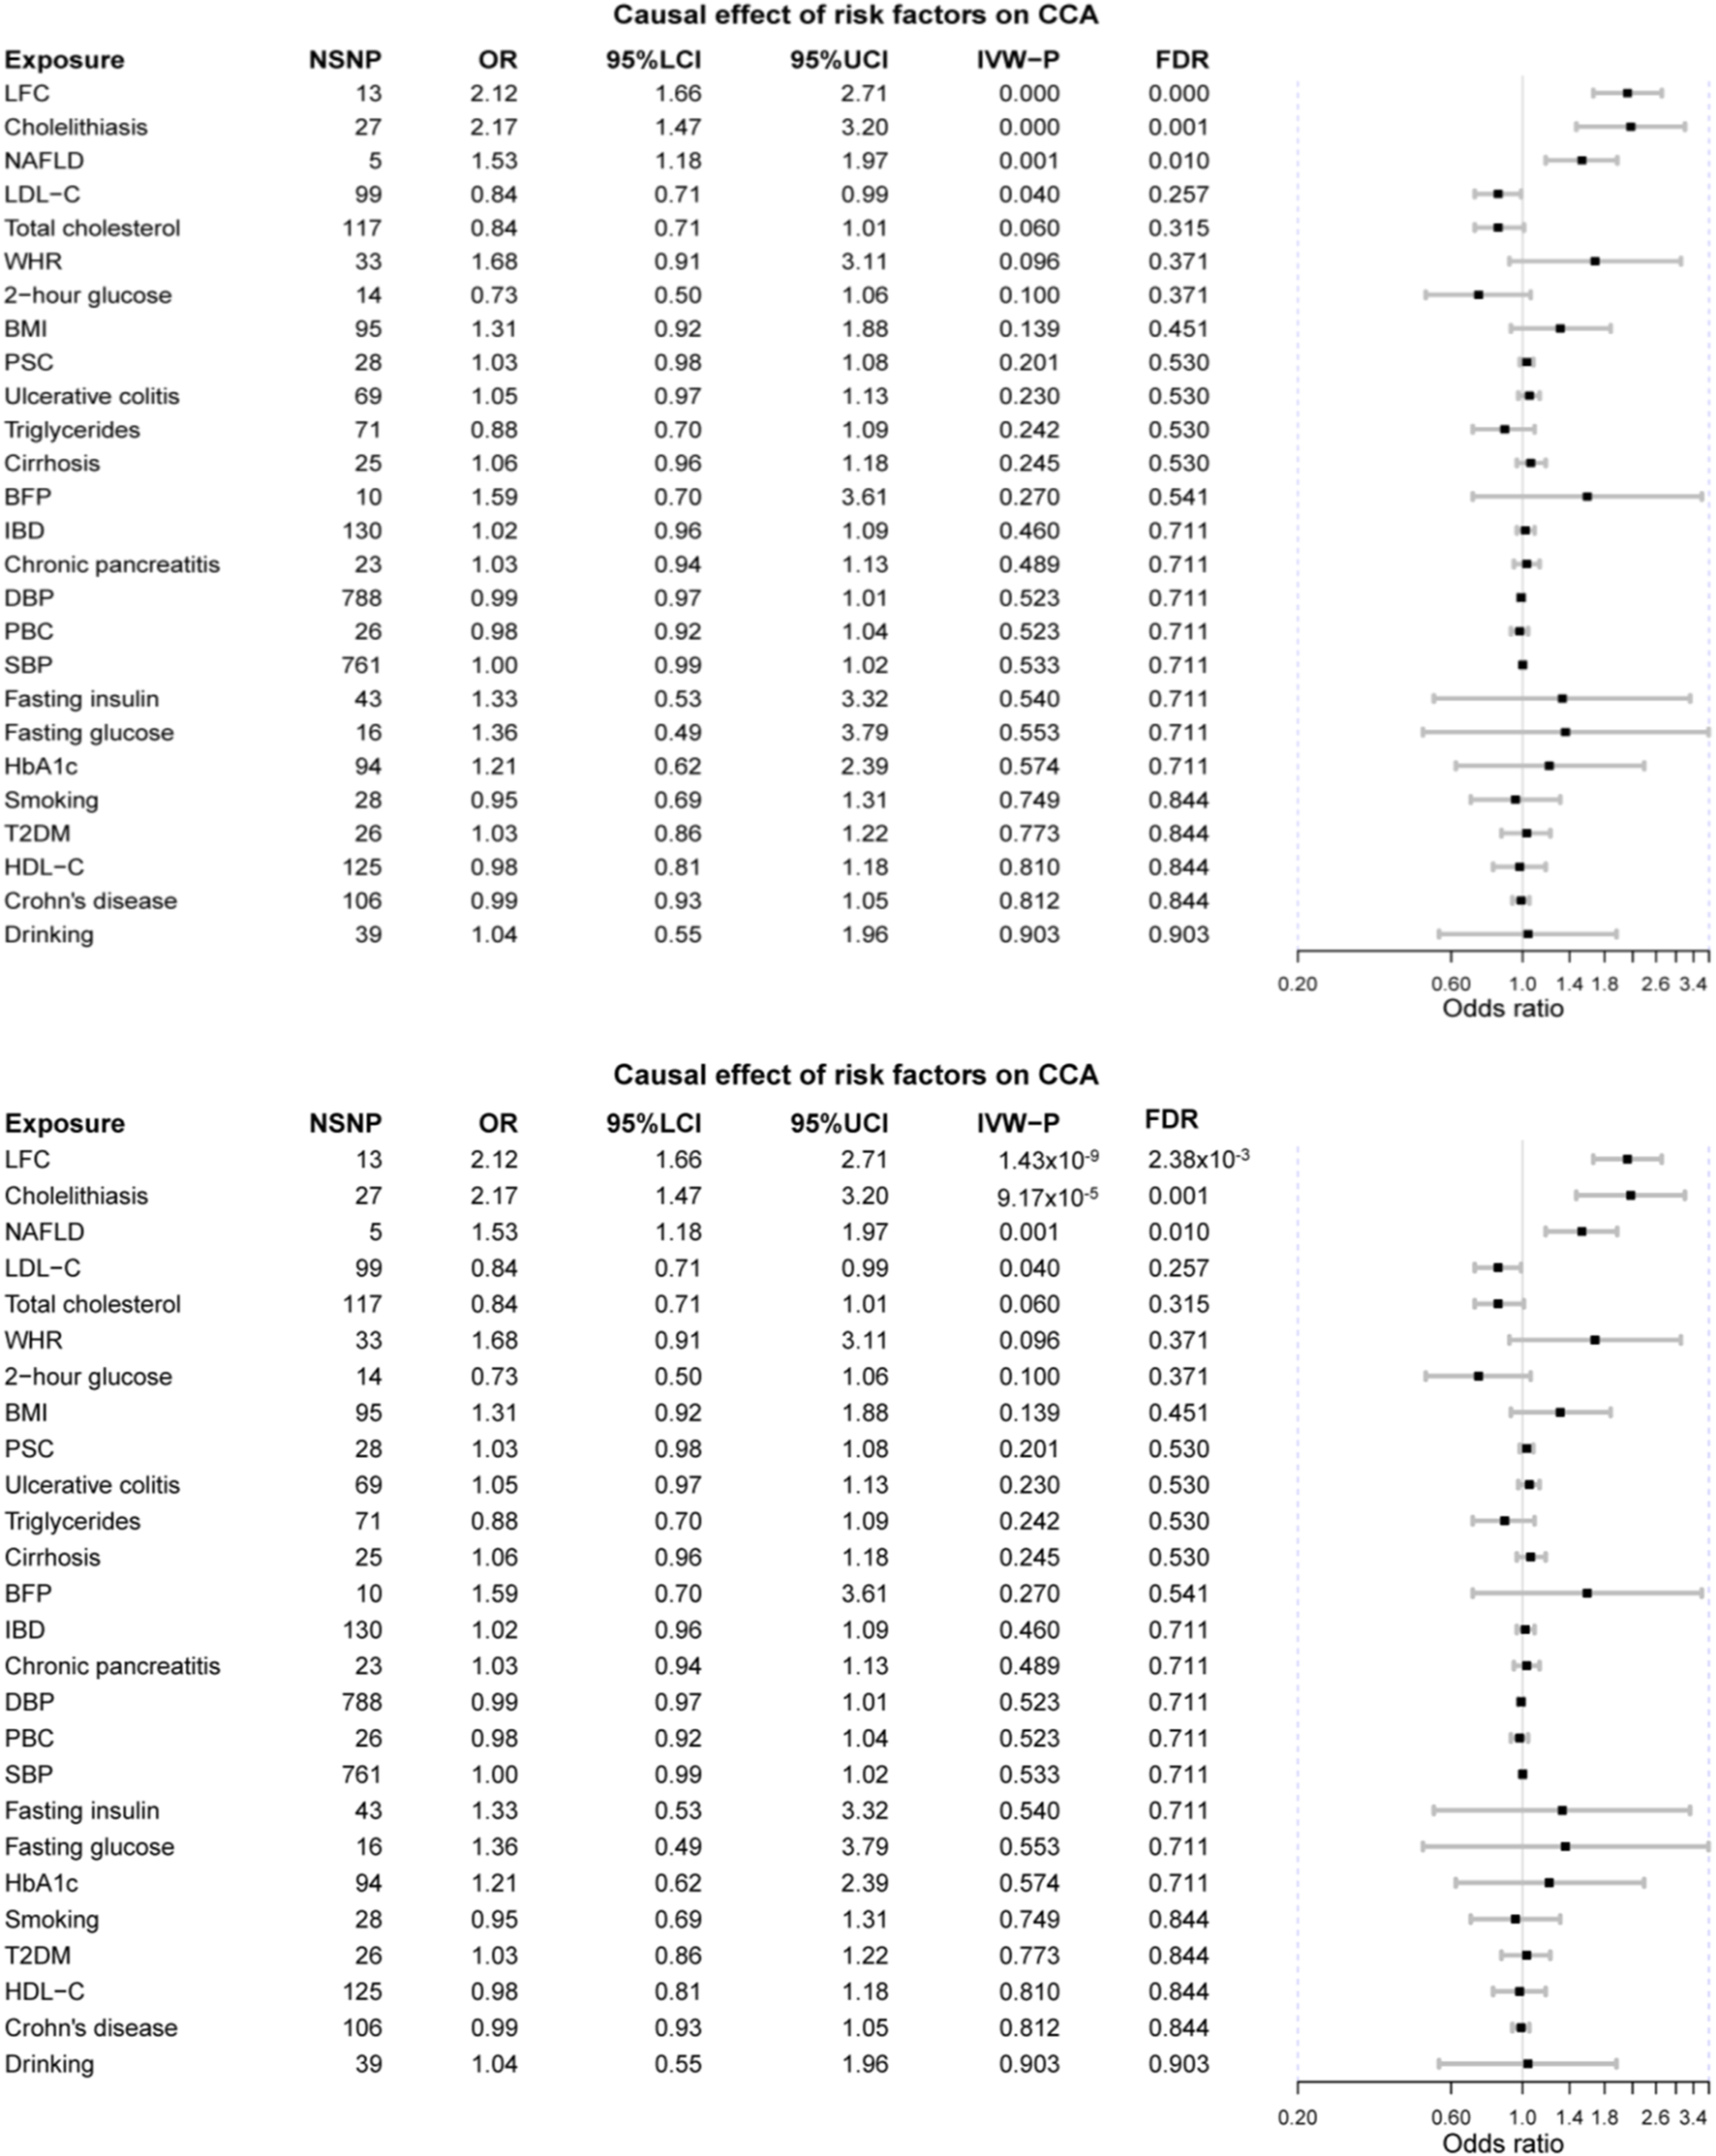
The forest plot of MR results. LFC, liver fat content; NAFLD, non-alcoholic fatty liver disease; LDL-C, low-density lipoprotein cholesterol; WHR, waist-to-hip ratio; BMI, body mass index; PSC, primary sclerosing cholangitis; BFP, body fat percentage; IBD, inflammatory bowel disease; DBP, diastolic blood pressure; PBC, primary biliary cholangitis; SBP, systolic blood pressure; HbA1c, glycated hemoglobin; T2DM, type 2 diabetes mellitus; HDL-C, high-density lipoprotein cholesterol.
The MR-PRESSO method detected outliers that might distort the MR results for LFC, cholelithiasis, and NAFLD, and the causal estimates were still significant after the removal of these outliers (LFC OR = 1.91 [1.28, 2.84], p-value = 0.009; cholelithiasis OR = 1.82 [1.17, 2.84], p-value = 0.014; NAFLD = 1.91 [1.33, 2.75], p-value = 0.039). The MR-Egger intercepts of them were not different from zero, suggesting there might be no horizontal pleiotropy in the MR analyses. Additionally, there was no heterogeneity after the removal of the outliers detected by MR-PRESSO. The MR estimates of these three risk factors were significant in weighted-median and weighted-mode methods (Table 2). No outliers were detected for LDL-C and TC. Either heterogeneity or horizontal pleiotropy was found for TC while a slight heterogeneity was found in LDL-C (Table 2). The statistical powers of LFC and NAFLD were 100% and that of cholelithiasis was 75%, suggesting sufficient statistical power in our study. Considering the proportion of overlapped samples should be less than 30% and its type 1 error rate is less than 0.05 suggests that our MR results were robust.
TABLE 2
| Exposure | IVW-MRE | MR-Egger | Weighted median | Weighted mode | |||||||||||||||
|---|---|---|---|---|---|---|---|---|---|---|---|---|---|---|---|---|---|---|---|
| NSNP | OR | 95% LCI | 95% UCI | p | OR | 95% LCI | 95% UCI | p | OR | 95% LCI | 95% UCI | p | OR | 95% LCI | 95% UCI | p | Pheterogeneity | Ppleiotropy | |
| 2-h glucose | 14 | 0.73 | 0.50 | 1.05 | 0.088 | 0.47 | 0.18 | 1.27 | 0.165 | 0.66 | 0.39 | 1.10 | 0.110 | 0.63 | 0.35 | 1.16 | 0.163 | 0.518 | 0.376 |
| BFP | 10 | 1.59 | 0.46 | 5.49 | 0.465 | 3.05 | 0.01 | 1224.44 | 0.724 | 1.70 | 0.50 | 5.77 | 0.395 | 2.01 | 0.34 | 11.81 | 0.458 | 0.015 | 0.832 |
| BMI | 95 | 1.31 | 0.90 | 1.92 | 0.162 | 0.89 | 0.35 | 2.26 | 0.804 | 1.22 | 0.64 | 2.34 | 0.549 | 1.33 | 0.56 | 3.16 | 0.522 | 0.199 | 0.372 |
| Cholelithiasis | 27 | 2.17 | 1.35 | 3.49 | 0.001 | 2.22 | 0.96 | 5.12 | 0.073 | 2.07 | 1.14 | 3.74 | 0.016 | 1.95 | 1.12 | 3.40 | 0.025 | 0.053 | 0.950 |
| Chronic pancreatitis | 23 | 1.03 | 0.95 | 1.12 | 0.418 | 1.08 | 0.92 | 1.26 | 0.342 | 1.11 | 0.97 | 1.28 | 0.143 | 1.09 | 0.92 | 1.29 | 0.316 | 0.814 | 0.493 |
| Cirrhosis | 25 | 1.06 | 0.92 | 1.23 | 0.404 | 1.28 | 0.96 | 1.70 | 0.105 | 1.01 | 0.86 | 1.19 | 0.860 | 0.99 | 0.75 | 1.30 | 0.945 | 0.004 | 0.159 |
| Crohn’s disease | 106 | 0.99 | 0.93 | 1.06 | 0.818 | 0.94 | 0.79 | 1.11 | 0.466 | 0.98 | 0.90 | 1.08 | 0.695 | 1.02 | 0.88 | 1.19 | 0.783 | 0.279 | 0.488 |
| DBP | 788 | 0.99 | 0.97 | 1.01 | 0.519 | 0.99 | 0.94 | 1.05 | 0.782 | 1.00 | 0.97 | 1.03 | 0.998 | 1.03 | 0.93 | 1.13 | 0.620 | 0.649 | 0.977 |
| Drinking | 39 | 1.04 | 0.53 | 2.04 | 0.910 | 1.19 | 0.48 | 2.96 | 0.716 | 1.23 | 0.56 | 2.68 | 0.608 | 1.18 | 0.56 | 2.52 | 0.665 | 0.251 | 0.673 |
| Fasting glucose | 16 | 1.36 | 0.36 | 5.18 | 0.650 | 1.34 | 0.11 | 16.55 | 0.823 | 1.52 | 0.43 | 5.32 | 0.514 | 1.31 | 0.33 | 5.19 | 0.703 | 0.043 | 0.987 |
| Fasting insulin | 43 | 1.33 | 0.50 | 3.51 | 0.563 | 1.91 | 0.10 | 35.44 | 0.666 | 1.59 | 0.43 | 5.91 | 0.490 | 1.03 | 0.10 | 10.56 | 0.981 | 0.266 | 0.798 |
| HbA1c | 94 | 1.21 | 0.60 | 2.47 | 0.592 | 0.45 | 0.11 | 1.78 | 0.256 | 0.88 | 0.31 | 2.49 | 0.808 | 0.79 | 0.25 | 2.49 | 0.687 | 0.236 | 0.103 |
| HDL-C | 125 | 0.98 | 0.81 | 1.19 | 0.816 | 1.13 | 0.78 | 1.62 | 0.523 | 0.94 | 0.70 | 1.27 | 0.696 | 1.11 | 0.77 | 1.58 | 0.581 | 0.292 | 0.367 |
| IBD | 130 | 1.02 | 0.96 | 1.09 | 0.466 | 1.05 | 0.94 | 1.17 | 0.404 | 0.99 | 0.87 | 1.12 | 0.848 | 1.02 | 0.91 | 1.15 | 0.678 | 0.411 | 0.609 |
| LDL-C | 99 | 0.84 | 0.68 | 1.02 | 0.083 | 0.82 | 0.60 | 1.12 | 0.209 | 0.85 | 0.63 | 1.13 | 0.255 | 0.87 | 0.66 | 1.15 | 0.331 | 0.005 | 0.859 |
| LFC | 13 | 2.12 | 1.34 | 3.36 | 0.001 | 3.15 | 1.57 | 6.31 | 0.008 | 2.10 | 1.55 | 2.85 | <0.001 | 2.08 | 1.52 | 2.86 | 0.001 | <0.001 | 0.177 |
| NAFLD | 5 | 1.53 | 0.93 | 2.51 | 0.095 | 1.93 | 0.68 | 5.45 | 0.302 | 1.56 | 1.11 | 2.19 | 0.010 | 2.06 | 1.40 | 3.03 | 0.021 | 0.005 | 0.637 |
| PBC | 26 | 0.98 | 0.92 | 1.04 | 0.511 | 0.94 | 0.77 | 1.16 | 0.594 | 1.00 | 0.92 | 1.09 | 0.999 | 0.98 | 0.87 | 1.10 | 0.692 | 0.547 | 0.721 |
| PSC | 28 | 1.03 | 0.98 | 1.09 | 0.267 | 1.02 | 0.93 | 1.11 | 0.727 | 1.02 | 0.96 | 1.09 | 0.536 | 1.02 | 0.96 | 1.09 | 0.438 | 0.121 | 0.691 |
| SBP | 761 | 1.00 | 0.99 | 1.02 | 0.539 | 1.01 | 0.98 | 1.05 | 0.405 | 1.00 | 0.98 | 1.02 | 0.891 | 1.01 | 0.97 | 1.06 | 0.577 | 0.282 | 0.519 |
| Smoking | 28 | 0.95 | 0.62 | 1.45 | 0.809 | 0.62 | 0.29 | 1.33 | 0.229 | 0.82 | 0.50 | 1.33 | 0.423 | 0.82 | 0.51 | 1.31 | 0.412 | 0.010 | 0.201 |
| T2DM | 26 | 1.03 | 0.85 | 1.23 | 0.789 | 1.81 | 0.97 | 3.39 | 0.075 | 1.11 | 0.86 | 1.42 | 0.439 | 1.29 | 0.91 | 1.82 | 0.170 | 0.259 | 0.076 |
| Total cholesterol | 117 | 0.84 | 0.70 | 1.01 | 0.071 | 0.76 | 0.56 | 1.03 | 0.081 | 0.83 | 0.59 | 1.15 | 0.263 | 0.77 | 0.55 | 1.08 | 0.128 | 0.257 | 0.401 |
| Triglycerides | 71 | 0.88 | 0.68 | 1.13 | 0.315 | 0.59 | 0.40 | 0.87 | 0.009 | 0.85 | 0.60 | 1.21 | 0.367 | 0.71 | 0.50 | 0.99 | 0.050 | 0.026 | 0.011 |
| Ulcerative colitis | 69 | 1.05 | 0.97 | 1.13 | 0.215 | 1.07 | 0.89 | 1.28 | 0.500 | 1.00 | 0.90 | 1.12 | 0.971 | 0.97 | 0.79 | 1.17 | 0.725 | 0.624 | 0.834 |
| WHR | 33 | 1.68 | 0.76 | 3.72 | 0.199 | 7.24 | 0.34 | 154.14 | 0.214 | 1.67 | 0.63 | 4.40 | 0.303 | 2.06 | 0.43 | 9.82 | 0.370 | 0.009 | 0.340 |
Mendelian randomization results of the other applied methods.
Notes: IVW-MRE, inverse variance weighted-multiplicative random effects; NSNP, the number of single nucleotide polymorphism used in the analysis; OR, the odds ratio; 95% LCI, the lower limit of 95% confidence interval; 95% UCI, the upper limit of 95% confidence interval; p, the p-value of OR; Pheterogeneity, the p-value of heterogeneity test; Ppleiotropy, the p-value of horizontal pleiotropy test; PBC, primary biliary cholangitis; PSC, primary sclerosing cholangitis; NAFLD, nonalcoholic fatty liver disease; LFC, liver fat content; HDL-C, high-density lipoprotein cholesterol; LDL-C, low-density lipoprotein cholesterol; T2DM, type 2 diabetes mellitus; HbA1c, glycated hemoglobin; SBP, systolic blood pressure; DBP, diastolic blood pressure; IBD, inflammatory bowel disease; BMI, body mass index; WHR, waist-to-hip ratio; BFP, body fat percentage.
Main results of the multivariable MR and mediation analyses
Since NAFLD and LFC are extremely similar and LFC is a continuous variable, we would only include LFC and cholelithiasis in the multivariable and mediation analyses (Carter et al., 2021). In the multivariable MR analysis, the F statistics of LFC and cholelithiasis were 29.13 and 67.49, respectively. The multivariable MR suggested cholelithiasis (OR = 1.16 [1.01, 1.34], p-value = 0.043) and LFC (OR = 1.88 [1.39, 2.55], p-value = 1.53 × 10⁻⁴). However, the Q-statistic for instrument validity was 80.26 (p-value = 0.009), suggesting the original estimates can be susceptible to weak instruments caused by a pleiotropic bias. In another complementary regression analysis based on residuals, the previously observed significant results still held while cholelithiasis (OR = 1.26 [1.13, 1.41], p-value = 2.66 × 10⁻⁵) appeared more significant than LFC (OR = 1.71 [1.22, 2.39], p-value = 0.002). The two different analytic methods suggested that LFC and cholelithiasis are two independent risk factors for CCA.
The mediation MR analyses consisted of two methods, namely the “product of coefficients method” and the “difference in coefficients method”. The results reached convergent with iterations of bootstrap over 3,000. Therein, the indirect effect size of LFC on CCA that might be mediated by cholelithiasis was not significant in the “product of coefficients method” (OR = 0.95 [0.85, 1.06], p-value = 0.806). Also, the results of the indirect effect remained insignificant in “difference in coefficients method” (OR = 0.95 [0.85, 1.07], p-value = 0.828).
The results of multivariable and mediation MR analyses suggested a genetic predisposition to higher LFC and cholelithiasis are two independent risk factors of CCA and the effect of LFC on CCA might not be mediated by cholelithiasis.
Discussion
Our Mendelian randomization systematically examined the causal relationship between previously-established risk factors and CCA. The results suggested that the genetic predispositions to higher LFC, NAFLD, and cholelithiasis were causal risk factors of CCA, and LFC and cholelithiasis were two independent ones. The genetically-lowered serum TC and LDL-C might increase the risk of CCA marginally. Furthermore, it should be noted that some strong risk factors derived from the observational studies were not significant in our study, especially for liver cirrhosis and PSC.
An American study suggested that NAFLD was associated with CCAs (Petrick et al., 2017), which is also confirmed in a recent Korean cohort study demonstrating that the adjusted hazard ratio was 1.33 (Park et al., 2021a), relatively smaller than the MR estimate (MR OR = 1.53). Although there is a lack of direct evidence pointing to the association between LFC and CCA from previous studies, it is reasonable to consider LFC and NAFLD together since the LFC was quantified by the magnetic resonance imaging-derived proton density fat fraction (MRI-PDFF) in UKB and MRI-PDFF has been a recommended indicator for the NAFLD diagnosis (Caussy et al., 2018). As CCA was often initiated by biliary inflammation and cholestasis and it can be categorized into “inflammation” and “proliferation” based on the transcriptomic profile, NAFLD may elevate the risk of CCA by causing the inflammation response via the IL6-STAT3 signaling pathway and promoting cell growth via the receptor tyrosine kinase (RTK) signaling pathway (Wieckowska et al., 2008; Michelotti et al., 2013; Banales et al., 2020). Chronic inflammation caused by NAFLD can elevate the DNA mutation rate via reactive oxygen stress and DNA damage, and damaged biliary epithelial cells, thereby contributing to tumorigenesis (Yang et al., 2019). Recently, researchers used a gene knockout mice model to simulate cholangitis-associated liver cancer where after being fed with a high-fat diet, the mice developed severer cholangitis as well as an increased number of HCC and CCA, indicating a causal relationship between NAFLD and CCA (Maeda et al., 2021). However, the mechanisms involved in NAFLD promoting extrahepatic CCA (eCCA) remain unclear.
Another established risk factor in our study is cholelithiasis, and it also has been identified as a prominent CCA risk factor, especially for eCCA (extrahepatic CCA) in many studies (Cai et al., 2015; Clements et al., 2020; Barner-Rasmussen et al., 2021) and a possible explanation for its CCA-promoting mechanism should be the continuous chronic inflammation of bile duct caused by gallstones (Brindley et al., 2021). Furthermore, its risk effect on CCA might decline with time after cholecystectomy (Nordenstedt et al., 2012), which equals to removing the chronic inflammatory stimulus. Intriguingly, the effect of cholelithiasis on CCA is independent of that of LFC and it does not mediate the effect of LFC on CCA as well, suggesting that cholelithiasis and LFC can affect CCA via distinct mechanisms and the common chronic inflammation process cannot explain it. There was little overlap between NAFLD-associated and cholelithiasis-associated SNPs, suggesting the substantial difference in genetic determinants between NAFLD and cholelithiasis might help account for the independent effects. Further research should be carried out to clarify it. Additionally, cholelithiasis can elevate the risk of chronic pancreatitis, and the observed association of chronic pancreatitis with CCA can be biased by cholelithiasis as no direct causation was detected in this MR study (Yuan et al., 2021).
However, we did not observe the casual effect of PSC on CCA, which was in contrast to the previously observed results. The reported prevalence of CCA was estimated to be 7% while that of cholelithiasis was approximately 25% in PSC patients (Karlsen et al., 2017), suggesting that a previously observed association between PSC and CCA can be confounded by cholelithiasis, a confirmed causal risk factor in this study. Also, the incidence of CCA should vary among different types of PSC patients where those with dominant strictures are at the highest risk (up to 76% being perihilar), whereas small duct PSC patients are at a lower risk (Dyson et al., 2018). However, the used GWAS did not categorize PSC and CCA, and the derived null results might be dominated by the null association between specific types. Further investigations should consider cholelithiasis when exploring the relationship between PSC and CCA, and a detailed stratification of PSC and CCA is encouraged as well.
IBD has been associated with CCA while such an association was not confirmed in this MR study. Such results can be explained by the subtypes of CCA and the existing confounders as well. Liver cirrhosis is considered a decisive factor of CCA, especially for iCCA (Razumilava and Gores, 2014). However, we did not observe such a causation and at least two reasons can account for it (Banales et al., 2020). The NAFLD-drive CCA might be a driver, mechanistically distinct from cirrhosis-driven CCA and the observed association between cirrhosis and CCA should be biased by NAFLD (Foerster et al., 2021; Banales et al., 2016); the liver cirrhosis can mainly promote iCCA but not for eCCA and the MR estimate was null since the CCA GWAS encompassed both iCCA and eCCA (Abou-Alfa et al., 2020); the liver cirrhosis is a complex disease caused by different risk factors like HBV and HCV while there is a lack of stratified GWAS for cirrhosis based on risk factors. Thus, it is a necessity to perform GWAS for iCCA and eCCA separately, together with a stratified GWAS for liver cirrhosis, and the evidence would be more convincing with a sophisticated stratification.
Whether obesity can elevate the risk of CCA is still inconsistent and the current evidence appears to endorse a more established association with Europeans than Asians (Osataphan et al., 2021). Our MR analysis supported that there was no direct causation between obesity and CCA since none of the obesity-related indices can contribute to the CCA risk (BMI, WHR, and BFP). Considering that obesity can alter levels of adipokines, pro-tumorigenic lipids, and metabolites, and since lipid accumulation is an established causal risk factor in our study, it might be reasonable that the previously observed association between obesity and CCA, especially for iCCA, could be mediated by LFC (Osataphan et al., 2021). The circumstances of T2DM and its associated indices are similar to that of obesity where the MR analysis suggested a null association. At the same time, most of the observational studies reported that T2DM and impaired fasting glucose were associated with increased risk of both iCCA and eCCA (Clements et al., 2020; Petrick et al., 2018; Park et al., 2021b). Like obesity, the crosstalk in T2DM and NAFLD should help to explicate such circumstances since NAFLD can promote both diabetes and obesity (Liu et al., 2020). The largest meta-analysis did not find an association between hypertension and CCA and our MR analysis supported it. Furthermore, these MR analyses displayed that genetically-elevated blood LDL-C and TC could reduce the risk of CCA marginally, which might be explained by the risk-lowering effect of genetically elevated blood LDL-C and TC on cholelithiasis (Chen et al., 2021b).
The largest meta-analysis indicated that both smoking and drinking were risk factors for CCA (5) while our results suggested that such associations should not be directly causal. Previous studies suggested that smoking can increase the risk of NAFLD and cholelithiasis and it is no surprise that there existed an association between smoking and CCA (Chen et al., 2021b; Jung et al., 2019). Additionally, it has been well established that alcohol intake can damage the liver and cause lipid accumulation. Thus, there might be no direct causal link between alcohol intake and CCA.
This MR study fills the gap of the empirical risk factors of CCA between basic research and clinical observation to some extent. It has several strengths as follows: (Banales et al., 2020): the large sample size of CCA GWAS; (Banales et al., 2016); the MR design can help to infer causation using observational data; (Abou-Alfa et al., 2020); the utility of genetic variants can help free this study from undetectable confounders. However, the limitations should be pointed out as well (Banales et al., 2020). Horizontal pleiotropy is a natural flaw of Mendelian and it can distort the MR estimates despite the application of various methods to minimize it (Banales et al., 2016); most of the included samples are Europeans and the generalizability of our conclusions should be limited (Abou-Alfa et al., 2020); the subtypes of CCA were not taken into consideration due to the unavailability of individual-level data (Zhu et al., 2021); the exposures in the MR analysis are genetically determined and are not equal to the observed exposures in epidemiological studies, and MR results cannot overwhelm the traditional epidemiological studies. Anyway, our MR study gave novel insights into the causal risk factors of CCA where NAFLD can increase the risk of CCA independent of cholelithiasis.
Briefly, this MR study confirmed two causal risk factors of CCA, including NAFLD (LFC) and cholelithiasis. However, other established risk factors have not been confirmed. Mainly, three reasons can help to explain it (Banales et al., 2020): previous observed associations between unconfirmed risk factors and CCA should be confounded or mediated by cholelithiasis/NAFLD (Banales et al., 2016); the unconfirmed risk factors should have an impact on the different subtypes of CCA and the casual estimates might attenuate to 0 if analyzing CCA without stratification. Considering the latter, we cannot eradicate the potential causal relationship between these unconfirmed risk factors and CCA, especially for PSC. Furthermore, a more sophisticated and well-elaborated clinical design is recommended to clarify the unsettled questions with an enlarged sample size where the GWAS focused on stratified CCA (iCCA and eCCA) should be carried out since the two types should have different biological mechanisms according to previous literature. Due to the relatively small sample size for both types, we had to combine them to get enough statistical power in this study. However, with an enlarged sample size and CCA stratification, we might be able to gain deep insights into the pathogenesis of CCA. Furthermore, we would explore the independent mechanisms of NAFLD-associated CCA and cholelithiasis-associated CCA and find potential therapeutics for them.
Conclusion
This MR study examined the causal relationship between putative risk factors and CCA, confirming the hazardous effect of NAFLD and cholelithiasis on it. Our study provides promising modifiable ways of preventing CCA.
Statements
Data availability statement
Publicly available datasets were analyzed in this study. These data can be found here: https://www.ebi.ac.uk/gwas/.
Ethics statement
We used publicly available GWAS summary statistics and each GWAS was approved by its Ethical Review Committee. All participants have given consent to each GWAS. The patients/participants provided their written informed consent to participate in this study.
Author contributions
GL and LC gave the idea and designed the research. LC collected GWAS data and performed the main data analysis. ZF curated the data and checked the statistical analysis. LC and ZF wrote the draft of the manuscript. XS and WQ were responsible for reviewing and substantially revising the manuscript. WM visualized the results and revised the manuscript. KC and YC were responsible for reviewing the statistical methods. GW provided necessary advice and revised the manuscript. GL supervised the whole research and claimed the integrity of the data analysis. All authors have given consent to the publication of this study.
Funding
The work is supported by National Natural Science Foundation of China (Grant No. 81602059) and the Financial Department of Jilin Province (Grant No. 2018SCZWSZX-042; Grant No. JLSWSRCZX 2021-026; Grant No. JLSWSRCZX 2020-045).
Acknowledgments
We would like to thank all investigators that made all GWAS summary statistics publicly available.
Conflict of interest
The authors declare that the research was conducted in the absence of any commercial or financial relationships that could be construed as a potential conflict of interest.
Publisher’s note
All claims expressed in this article are solely those of the authors and do not necessarily represent those of their affiliated organizations, or those of the publisher, the editors, and the reviewers. Any product that may be evaluated in this article, or claim that may be made by its manufacturer, is not guaranteed or endorsed by the publisher.
Supplementary material
The Supplementary Material for this article can be found online at: https://www.frontiersin.org/articles/10.3389/fphar.2022.900424/full#supplementary-material.
Glossary
- CCA
cholangiocarcinoma
- MR
Mendelian randomization
- GWAS
genome-wide association study
- IVW
inverse-variance weighted
- LFC
liver fat content
- NAFLD
nonalcoholic fatty liver disease
- FGFR
fibroblast growth factor receptor
- IDH
isocitrate dehydrogenase
- PSC
primary sclerosing cholangitis
- T2DM
type 2 diabetes mellitus
- IBD
inflammatory bowel disease
- IV
instrumental variable
- RCT
randomized control trial
- GBC
gallbladder cancer
- PBC
primary biliary cholangitis
- UKB
United Kingdom Biobank
- ICD
international classification of diseases
- GOLD
the Genetics of Obesity-Related Liver Disease
- BMI
body mass index
- WHR
waist-to-hip ratio
- BFP
body fat percentage
- HbAa1c
glycated hemoglobin
- OGTT
oral glucose tolerance testing
- GLGC
the Global Lipids Genetics Consortium
- TC
total cholesterol
- TG
triglycerides
- LDL-C
low-density lipoprotein cholesterol
- HDL-C
high-density lipoprotein cholesterol (HDL-C)
- SBP
systolic blood pressure; diastolic blood pressure
- SNP
single nucleotide polymorphism
- NOME
No Measurement Error
- FDR
false discovery rate
- MRI-PDFF
magnetic resonance imaging-derived proton density fat fraction
- eCCA
extrahepatic cholangiocarcinoma
- iCCA
intrahepatic cholangiocarcinoma
References
1
Abou-Alfa G. K. Sahai V. Hollebecque A. Vaccaro G. Melisi D. Al-Rajabi R. et al (2020). Pemigatinib for previously treated, locally advanced or metastatic cholangiocarcinoma: A multicentre, open-label, phase 2 study. Lancet. Oncol.21, 671–684. 10.1016/S1470-2045(20)30109-1
2
Banales J. M. Cardinale V. Carpino G. Marzioni M. Andersen J. B. Invernizzi P. et al (2016). Expert consensus document: Cholangiocarcinoma: Current knowledge and future perspectives consensus statement from the European network for the study of cholangiocarcinoma (ENS-CCA). Nat. Rev. Gastroenterol. Hepatol.13, 261–280. 10.1038/nrgastro.2016.51
3
Banales J. M. Marin J. J. G. Lamarca A. Rodrigues P. M. Khan S. A. Roberts L. R. et al (2020). Cholangiocarcinoma 2020: The next horizon in mechanisms and management. Nat. Rev. Gastroenterol. Hepatol.17, 557–588. 10.1038/s41575-020-0310-z
4
Barahona Ponce C. Scherer D. Brinster R. Boekstegers F. Marcelain K. Gárate-Calderón V. et al (2021). Gallstones, body mass index, C-reactive protein, and gallbladder cancer: Mendelian randomization analysis of Chilean and European genotype data. Hepatology73, 1783–1796. 10.1002/hep.31537
5
Barner-Rasmussen N. Pukkala E. Hadkhale K. Färkkilä M. (2021). Risk factors, epidemiology and prognosis of cholangiocarcinoma in Finland. United Eur. Gastroenterol. J.9, 1128–1135. 10.1002/ueg2.12154
6
Bowden J. Davey Smith G. Burgess S. (2015). Mendelian randomization with invalid instruments: Effect estimation and bias detection through egger regression. Int. J. Epidemiol.44, 512–525. 10.1093/ije/dyv080
7
Bowden J. Davey Smith G. Haycock P. C. Burgess S. (2016). Consistent estimation in mendelian randomization with some invalid instruments using a weighted median estimator. Genet. Epidemiol.40, 304–314. 10.1002/gepi.21965
8
Bowden J. Del Greco M. F. Minelli C. Davey Smith G. Sheehan N. A. Thompson J. R. (2016). Assessing the suitability of summary data for two-sample mendelian randomization analyses using MR-egger regression: The role of the I2 statistic. Int. J. Epidemiol.45, 1961–1974. 10.1093/ije/dyw220
9
Brindley P. J. Bachini M. Ilyas S. I. Khan S. A. Loukas A. Sirica A. E. et al (2021). Nat. Rev. Dis. Prim.7, 65. 10.1038/s41572-021-00300-2
10
Brion M. J. Shakhbazov K. Visscher P. M. (2013). Calculating statistical power in Mendelian randomization studies. Int. J. Epidemiol.42, 1497–1501. 10.1093/ije/dyt179
11
Burgess S. Davies N. M. Thompson S. G. (2016). Bias due to participant overlap in two-sample Mendelian randomization. Genet. Epidemiol.40, 597–608. 10.1002/gepi.21998
12
Burgess S. Thompson S. G. (2011). Avoiding bias from weak instruments in Mendelian randomization studies. Int. J. Epidemiol.40, 755–764. 10.1093/ije/dyr036
13
Burgess S. Thompson S. G. (2015). Multivariable mendelian randomization: The use of pleiotropic genetic variants to estimate causal effects. Am. J. Epidemiol.181, 251–260. 10.1093/aje/kwu283
14
Cai H. Kong W. T. Chen C. B. Shi G. M. Huang C. Shen Y. H. et al (2015). Cholelithiasis and the risk of intrahepatic cholangiocarcinoma: A meta-analysis of observational studies. BMC Cancer15, 831. 10.1186/s12885-015-1870-0
15
Carter A. R. Sanderson E. Hammerton G. Richmond R. C. Davey Smith G. Heron J. et al (2021). Mendelian randomisation for mediation analysis: Current methods and challenges for implementation. Eur. J. Epidemiol.36, 465–478. 10.1007/s10654-021-00757-1
16
Caussy C. Reeder S. B. Sirlin C. B. Loomba R. (2018). Noninvasive, quantitative assessment of liver fat by MRI-PDFF as an endpoint in NASH trials. Hepatology68, 763–772. 10.1002/hep.29797
17
Chen J. Spracklen C. N. Marenne G. Varshney A. Corbin L. J. Luan J. et al (2021). The trans-ancestral genomic architecture of glycemic traits. Nat. Genet.53, 840–860. 10.1038/s41588-021-00852-9
18
Chen L. Yang H. Li H. He C. Yang L. Lv G. (2021). Insights into modifiable risk factors of cholelithiasis: A mendelian randomization study. Hepatology75, 785–796. 10.1002/hep.32183
19
Clements O. Eliahoo J. Kim J. U. Taylor-Robinson S. D. Khan S. A. (2020). Risk factors for intrahepatic and extrahepatic cholangiocarcinoma: A systematic review and meta-analysis. J. Hepatol.72, 95–103. 10.1016/j.jhep.2019.09.007
20
Cordell H. J. Han Y. Mells G. F. Li Y. Hirschfield G. M. Greene C. S. et al (2015). International genome-wide meta-analysis identifies new primary biliary cirrhosis risk loci and targetable pathogenic pathways. Nat. Commun.6, 8019. 10.1038/ncomms9019
21
D'Onofrio B. M. Sjölander A. Lahey B. B. Lichtenstein P. Öberg A. S. (2020). Accounting for confounding in observational studies. Annu. Rev. Clin. Psychol.16, 25–48. 10.1146/annurev-clinpsy-032816-045030
22
Dyson J. K. Beuers U. Jones D. E. J. Lohse A. W. Hudson M. (2018). Primary sclerosing cholangitis. Lancet391, 2547–2559. 10.1016/S0140-6736(18)30300-3
23
Emdin C. A. Haas M. E. Khera A. V. Aragam K. Chaffin M. Klarin D. et al (2020). A missense variant in Mitochondrial Amidoxime Reducing Component 1 gene and protection against liver disease. PLoS Genet.16, e1008629. 10.1371/journal.pgen.1008629
24
Emdin C. A. Khera A. V. Kathiresan S. (2017). Mendelian randomization. Jama318, 1925–1926. 10.1001/jama.2017.17219
25
Evangelou E. Warren H. R. Mosen-Ansorena D. Mifsud B. Pazoki R. Gao H. et al (2018). Genetic analysis of over 1 million people identifies 535 new loci associated with blood pressure traits. Nat. Genet.50, 1412–1425. 10.1038/s41588-018-0205-x
26
Fang Z. Song M. Lee D. Giovannucci E. L. (2021). The role of mendelian randomization studies in deciphering the effect of obesity on cancer. J. Natl. Cancer Inst.114, 361–371. 10.1093/jnci/djab102
27
Ferkingstad E. Oddsson A. Gretarsdottir S. Benonisdottir S. Thorleifsson G. Deaton A. M. et al (2018). Genome-wide association meta-analysis yields 20 loci associated with gallstone disease. Nat. Commun.9, 5101. 10.1038/s41467-018-07460-y
28
Foerster F. Gairing S. J. Müller L. Galle P. R. (2021). NAFLD-driven HCC: Safety and efficacy of current and emerging treatment options. J. Hepatol.76, 446–457. 10.1016/j.jhep.2021.09.007
29
Hartwig F. P. Davey Smith G. Bowden J. (2017). Robust inference in summary data Mendelian randomization via the zero modal pleiotropy assumption. Int. J. Epidemiol.46, 1985–1998. 10.1093/ije/dyx102
30
Hemani G. Tilling K. Davey Smith G. (2017). Orienting the causal relationship between imprecisely measured traits using GWAS summary data. PLoS Genet.13, e1007081. 10.1371/journal.pgen.1007081
31
Ji S. G. Juran B. D. Mucha S. Folseraas T. Jostins L. Melum E. et al (2017). Genome-wide association study of primary sclerosing cholangitis identifies new risk loci and quantifies the genetic relationship with inflammatory bowel disease. Nat. Genet.49, 269–273. 10.1038/ng.3745
32
Jung H. S. Chang Y. Kwon M. J. Sung E. Yun K. E. Cho Y. K. et al (2019). Smoking and the risk of non-alcoholic fatty liver disease: A cohort study. Am. J. Gastroenterol.114, 453–463. 10.1038/s41395-018-0283-5
33
Karlsen T. H. Folseraas T. Thorburn D. Vesterhus M. (2017). Primary sclerosing cholangitis - a comprehensive review. J. Hepatol.67, 1298–1323. 10.1016/j.jhep.2017.07.022
34
Lawlor D. A. Harbord R. M. Sterne J. A. Timpson N. Davey Smith G. (2008). Mendelian randomization: Using genes as instruments for making causal inferences in epidemiology. Stat. Med.27, 1133–1163. 10.1002/sim.3034
35
Liu M. Jiang Y. Wedow R. Li Y. Brazel D. M. Chen F. et al (2019). Association studies of up to 1.2 million individuals yield new insights into the genetic etiology of tobacco and alcohol use. Nat. Genet.51, 237–244. 10.1038/s41588-018-0307-5
36
Liu Y. Basty N. Whitcher B. Bell J. D. Sorokin E. P. van Bruggen N. et al (2021). Genetic architecture of 11 organ traits derived from abdominal MRI using deep learning. Elife, e65554. 10.7554/eLife.65554
37
Liu Z. Zhang Y. Graham S. Wang X. Cai D. Huang M. et al (2020). Causal relationships between NAFLD, T2D and obesity have implications for disease subphenotyping. J. Hepatol.73, 263–276. 10.1016/j.jhep.2020.03.006
38
Locke A. E. Kahali B. Berndt S. I. Justice A. E. Pers T. H. Day F. R. et al (2015). Genetic studies of body mass index yield new insights for obesity biology. Nature518, 197–206. 10.1038/nature14177
39
Lu Y. Day F. R. Gustafsson S. Buchkovich M. L. Na J. Bataille V. et al (2016). New loci for body fat percentage reveal link between adiposity and cardiometabolic disease risk. Nat. Commun.7, 10495. 10.1038/ncomms10495
40
Maeda S. Hikiba Y. Fujiwara H. Ikenoue T. Sue S. Sugimori M. et al (2021). NAFLD exacerbates cholangitis and promotes cholangiocellular carcinoma in mice. Cancer Sci.112, 1471–1480. 10.1111/cas.14828
41
Mahajan A. Go M. J. Zhang W. Below J. E. Gaulton K. J. Ferreira T. et al (2014). Genome-wide trans-ancestry meta-analysis provides insight into the genetic architecture of type 2 diabetes susceptibility. Nat. Genet.46, 234–244. 10.1038/ng.2897
42
Mhatre S. Richmond R. C. Chatterjee N. Rajaraman P. Wang Z Zhang H. et al (2021). The role of gallstones in gallbladder cancer in India: A mendelian randomization study. Cancer Epidemiol. Biomarkers Prev.30, 396–403. 10.1158/1055-9965.EPI-20-0919
43
Michelotti G. A. Machado M. V. Diehl A. M. (2013). NAFLD, NASH and liver cancer. Nat. Rev. Gastroenterol. Hepatol.10, 656–665. 10.1038/nrgastro.2013.183
44
Nordenstedt H. Mattsson F. El-Serag H. Lagergren J. (2012). Gallstones and cholecystectomy in relation to risk of intra- and extrahepatic cholangiocarcinoma. Br. J. Cancer106, 1011–1015. 10.1038/bjc.2011.607
45
Osataphan S. Mahankasuwan T. Saengboonmee C. (2021). Obesity and cholangiocarcinoma: A review of epidemiological and molecular associations. J. Hepatobiliary. Pancreat. Sci.28, 1047–1059. 10.1002/jhbp.1001
46
Pang Y. Lv J. Kartsonaki C. Guo Y. Yu C. Chen Y. et al (2021). Causal effects of gallstone disease on risk of gastrointestinal cancer in Chinese. Br. J. Cancer124, 1864–1872. 10.1038/s41416-021-01325-w
47
Park J. H. Hong J. Y. Kwon M. Lee J. Han K. Han I. W. et al (2021). Association between non-alcoholic fatty liver disease and the risk of biliary tract cancers: A south Korean nationwide cohort study. Eur. J. Cancer150, 73–82. 10.1016/j.ejca.2021.03.024
48
Park J. H. Hong J. Y. Park Y. S. Kang G. Han K. Park J. O. (2021). Association of prediabetes, diabetes, and diabetes duration with biliary tract cancer risk: A nationwide cohort study. Metabolism.123, 154848. 10.1016/j.metabol.2021.154848
49
Petrick J. L. Thistle J. E. Zeleniuch-Jacquotte A. Zhang X. Wactawski-Wende J. Van Dyke A. L. et al (2018). Body mass index, diabetes and intrahepatic cholangiocarcinoma risk: The liver cancer pooling project and meta-analysis. Am. J. Gastroenterol.113, 1494–1505. 10.1038/s41395-018-0207-4
50
Petrick J. L. Yang B. Altekruse S. F. Van Dyke A. L. Koshiol J. Graubard B. I. et al (2017). Risk factors for intrahepatic and extrahepatic cholangiocarcinoma in the United States: A population-based study in SEER-medicare. PLoS One12, e0186643. 10.1371/journal.pone.0186643
51
Razumilava N. Gores G. J. (2014). Lancet383, 2168–2179. 10.1016/S0140-6736(13)61903-0
52
Sakaue S. Kanai M. Tanigawa Y. Karjalainen J. Kurki M. Koshiba S. et al (2021). A cross-population atlas of genetic associations for 220 human phenotypes. Nat. Genet.53, 1415–1424. 10.1038/s41588-021-00931-x
53
Sanderson E. Davey Smith G. Windmeijer F. Bowden J. (2019). An examination of multivariable Mendelian randomization in the single-sample and two-sample summary data settings. Int. J. Epidemiol.48, 713–727. 10.1093/ije/dyy262
54
Sanderson E. Spiller W. Bowden J. (2021). Testing and correcting for weak and pleiotropic instruments in two-sample multivariable Mendelian randomization. Stat. Med.40, 5434–5452. 10.1002/sim.9133
55
Shungin D. Winkler T. W. Croteau-Chonka D. C. Ferreira T. Locke A. E. Mägi R. et al (2015). New genetic loci link adipose and insulin biology to body fat distribution. Nature518, 187–196. 10.1038/nature14132
56
Slob E. A. W. Burgess S. (2020). A comparison of robust Mendelian randomization methods using summary data. Genet. Epidemiol.44, 313–329. 10.1002/gepi.22295
57
Smith G. D. Ebrahim S. (2003). Mendelian randomization': Can genetic epidemiology contribute to understanding environmental determinants of disease?Int. J. Epidemiol.32, 1–22. 10.1093/ije/dyg070
58
Speliotes E. K. Yerges-Armstrong L. M. Wu J. Hernaez R. Kim L. J. Palmer C. D. et al (2011). Genome-wide association analysis identifies variants associated with nonalcoholic fatty liver disease that have distinct effects on metabolic traits. PLoS Genet.7, e1001324. 10.1371/journal.pgen.1001324
59
Verbanck M. Chen C. Y. Neale B. Do R. (2018). Detection of widespread horizontal pleiotropy in causal relationships inferred from Mendelian randomization between complex traits and diseases. Nat. Genet.50, 693–698. 10.1038/s41588-018-0099-7
60
Voight B. F. Peloso G. M. Orho-Melander M. Frikke-Schmidt R. Barbalic M. Jensen M. K. et al (2012). Plasma HDL cholesterol and risk of myocardial infarction: A mendelian randomisation study. Lancet380, 572–580. 10.1016/S0140-6736(12)60312-2
61
Walker V. M. Davies N. M. Hemani G. Zheng J. Haycock P. C. Gaunt T. R. et al (2019). Using the MR-Base platform to investigate risk factors and drug targets for thousands of phenotypes. Wellcome Open Res.4, 113. 10.12688/wellcomeopenres.15334.2
62
Wardell C. P. Fujita M. Yamada T. Simbolo M. Fassan M. Karlic R. et al (2018). Genomic characterization of biliary tract cancers identifies driver genes and predisposing mutations. J. Hepatol.68, 959–969. 10.1016/j.jhep.2018.01.009
63
Wieckowska A. Papouchado B. G. Li Z. Lopez R. Zein N. N. Feldstein A. E. (2008). Increased hepatic and circulating interleukin-6 levels in human nonalcoholic steatohepatitis. Am. J. Gastroenterol.103, 1372–1379. 10.1111/j.1572-0241.2007.01774.x
64
Willer C. J. Schmidt E. M. Sengupta S. Peloso G. M. Gustafsson S. Kanoni S. et al (2013). Discovery and refinement of loci associated with lipid levels. Nat. Genet.45, 1274–1283. 10.1038/ng.2797
65
Yang Y. M. Kim S. Y. Seki E. (2019). Inflammation and liver cancer: Molecular mechanisms and therapeutic targets. Semin. Liver Dis.39, 26–42. 10.1055/s-0038-1676806
66
Yuan S. Giovannucci E. L. Larsson S. C. (2021). Gallstone disease, diabetes, calcium, triglycerides, smoking and alcohol consumption and pancreatitis risk: Mendelian randomization study. NPJ Genom. Med.6, 27. 10.1038/s41525-021-00189-6
67
Zhou W. Nielsen J. B. Fritsche L. G. Dey R. Gabrielsen M. E. Wolford B. N. et al (2018). Efficiently controlling for case-control imbalance and sample relatedness in large-scale genetic association studies. Nat. Genet.50, 1335–1341. 10.1038/s41588-018-0184-y
68
Zhu A. X. Macarulla T. Javle M. M. Kelley R. K. Lubner S. J. Adeva J. et al (2021). Final overall survival efficacy results of ivosidenib for patients with advanced cholangiocarcinoma with IDH1 mutation: The phase 3 randomized clinical ClarIDHy trial. JAMA Oncol.7, 1669–1677. 10.1001/jamaoncol.2021.3836
Summary
Keywords
cholangiocarcinoma, cholelithiasis, NAFLD, risk factors, Mendelian randomization
Citation
Chen L, Fan Z, Sun X, Qiu W, Mu W, Chai K, Cao Y, Wang G and Lv G (2022) Examination on the risk factors of cholangiocarcinoma: A Mendelian randomization study. Front. Pharmacol. 13:900424. doi: 10.3389/fphar.2022.900424
Received
20 March 2022
Accepted
26 July 2022
Published
26 August 2022
Volume
13 - 2022
Edited by
Mounir Tilaoui, Waterford Institute of Technology, Ireland
Reviewed by
Cheryl D. Cropp, Samford University, United States
Sirui Zhou, McGill University, Canada
Updates
Copyright
© 2022 Chen, Fan, Sun, Qiu, Mu, Chai, Cao, Wang and Lv.
This is an open-access article distributed under the terms of the Creative Commons Attribution License (CC BY). The use, distribution or reproduction in other forums is permitted, provided the original author(s) and the copyright owner(s) are credited and that the original publication in this journal is cited, in accordance with accepted academic practice. No use, distribution or reproduction is permitted which does not comply with these terms.
*Correspondence: Guoyue Lv, lvgy@jlu.edu.cn
†These authors have contributed equally to this work
This article was submitted to Pharmacogenetics and Pharmacogenomics, a section of the journal Frontiers in Pharmacology
Disclaimer
All claims expressed in this article are solely those of the authors and do not necessarily represent those of their affiliated organizations, or those of the publisher, the editors and the reviewers. Any product that may be evaluated in this article or claim that may be made by its manufacturer is not guaranteed or endorsed by the publisher.