 Sukyong Yoon
 Jinju Guk1,2†
 Sang-Guk Lee
 Dongwoo Chae
 Jeong-Ho Kim
 Kyungsoo Park
- 1Department of Pharmacology, Yonsei University College of Medicine, Seoul, Republic of Korea
- 2Brain Korea 21 Plus Project for Medical Science, Yonsei University, Seoul, Republic of Korea
- 3Department of Laboratory Medicine, Yonsei University College of Medicine, Seoul, Republic of Korea
Introduction: While vancomycin remains a widely prescribed antibiotic, it can cause ototoxicity and nephrotoxicity, both of which are concentration-associated. Overtreatment can occur when the treatment lasts for an unnecessarily long time. Using a model-informed precision dosing scheme, this study aims to develop a population pharmacokinetic (PK) and pharmacodynamic (PD) model for vancomycin to determine the optimal dosage regimen and treatment duration in order to avoid drug-induced toxicity.
Methods: The data were obtained from electronic medical records of 542 patients, including 40 children, and were analyzed using NONMEM software. For PK, vancomycin concentrations were described with a two-compartment model incorporating allometry scaling.
Results and discussion: This revealed that systemic clearance decreased with creatinine and blood urea nitrogen levels, history of diabetes and renal diseases, and further decreased in women. On the other hand, the central volume of distribution increased with age. For PD, C-reactive protein (CRP) plasma concentrations were described by transit compartments and were found to decrease with the presence of pneumonia. Simulations demonstrated that, given the model informed optimal doses, peak and trough concentrations as well as the area under the concentration-time curve remained within the therapeutic range, even at doses smaller than routine doses, for most patients. Additionally, CRP levels decreased more rapidly with the higher dose starting from 10 days after treatment initiation. The developed R Shiny application efficiently visualized the time courses of vancomycin and CRP concentrations, indicating its applicability in designing optimal treatment schemes simply based on visual inspection.
1 Introduction
Vancomycin is a glycopeptide antibiotic used to treat infections caused by vancomycin susceptible bacterial species, especially methicillin-resistant Staphylococcus aureus (Levine, 2008). It is also indicated for the treatment of infections caused by Gram-positive bacteria in patients with allergies to beta-lactam antibiotics or cephalosporins (Rybak M. et al., 2009). Due to its various indications, vancomycin has been increasingly used in many countries since it was approved (Kirst et al., 1998) and it remains a widely prescribed treatment agent for various bacterial infectious diseases.
Vancomycin, however, can cause severe toxicities such as ototoxicity and nephrotoxicity, which can lead to treatment failure if not carefully used. In past years, it was believed that the toxicity was associated with impurities rather than its concentration (Moellering, 1984). Subsequently, with the introduction of newer manufacturing processes, ototoxicity has almost disappeared and nephrotoxicity has also decreased significantly (Brummett, 1981; Farber and Moellering, 1983).
Regarding nephrotoxicity, antioxidants have shown a nephroprotective effect against vancomycin associated nephrotoxicity. In a study assessing the nephroprotective role of ascorbic acid against vancomycin associated nephrotoxicity, co-administration of ascorbic acid with vancomycin preserved renal function and reduced the absolute risk of nephrotoxicity by 20.3%“ (Hesham El-Sherazy et al., 2021). Investigating the correlation between nephrotoxicity and different antibiotic regimens, a comparison was made between once-daily dosing and individualized multiple daily dosing of gentamicin and amikacin in terms of clinical and bacteriological efficacy. The study assessed the incidence of nephrotoxicity associated with both regimens and found a non-significant difference between the two dosing regimens” (Abdel-Bari et al., 2011).
Contrary to past understanding, it has been found that high doses of vancomycin can also increase toxicity (Hidayat et al., 2006). Recent studies have investigated the relationship between concentration and nephrotoxicity, as well as the potential nephrotoxicity when vancomycin is administered with aminoglycoside antibiotics (Elyasi et al., 2012; Gelfand and Cleveland, 2013).
Vancomycin treatment failure can also occur in bacterial-resistant infections (Centers for Disease Control and Prevention (CDC). Antibiotic Resistance Threats in the United States, 2019. Atlanta, GA: U.S. Department of Health and Human Services, Centers for Disease Control and Prevention, 2019). Since vancomycin-resistant enterococci (VRE) was reported in 1980s, six resistance patterns have been identified (Kim et al., 2000; Murray, 2000; Depardieu et al., 2003) Various strategies to mitigate resistance have been introduced (Chong and Lee, 2000), including the administration of vancomycin to achieve AUC/MIC = 400 (Martin et al., 2010), with AUC denoting the area under the concentration-time curve and MIC denoting the minimum inhibitory concentration, defined as the lowest concentration capable of inhibiting bacterial growth. However, for bacteria strains with relatively high MICs, the AUC/MIC = 400 requirement may be inadequate for effective treatment.
Given that avoiding toxicity and resistance is crucial for the success of vancomycin therapy, efforts have been made to investigate factors affecting drug exposure and to adjust the dose accordingly. Early efforts in this direction include a dosing interval nomogram to achieve target peak and trough concentrations, adjusted based on body weight and renal function (Matzke et al., 1984). Additionally, a consensus review by American academic societies recommended weight-normalized loading and maintenance doses to achieve target trough concentrations or target AUC/MIC ratios (Rybak M. J. et al., 2009).
However, these early descriptions of vancomycin plasma concentrations did not utilize a nonlinear mixed-effects (NLME) population pharmacokinetic (PK) model, which is now a standard model for drug concentrations. This model distinguishes inter-individual variability from intra-individual or residual variability, producing more reliable results in PK analyses and dose selection. Dose optimization based on a NLME population PK model falls under the category of model-informed precision dosing (MIPD). Numerous works have demonstrated the novelty of MIPD in achieving vancomycin dose optimization (Frymoyer et al., 2020; Ter Heine et al., 2020; Hughes et al., 2021; Uster et al., 2021; Aljutayli et al., 2022; Heus et al., 2022; Matsumoto et al., 2022). These works include model averaging and selection algorithms to improve predictive performance (Uster et al., 2021; Heus et al., 2022), the application of published models for prospective validation (Ter Heine et al., 2020), continuous learning approaches in pediatric patients (Hughes et al., 2021), clinical decision support tools for individualized dosing in pediatric patients (Frymoyer et al., 2020), application in Japanese patients (Matsumoto et al., 2022), and the importance of Bayesian approaches for faster and reliable monitoring (Aljutayli et al., 2022). While there are works related to MIPD in vancomycin treatment for Asian patients other than Japanese populations (Purwonugroho et al., 2012; Deng et al., 2013; Vu et al., 2019; Munir et al., 2021; Belavagi et al., 2022; Wei et al., 2022), in the Korean population, a study has been conducted in neonatal patients only (Lee et al., 2021).
In addition to dose optimization to avoid toxicity and resistance, an important aspect of vancomycin treatment is knowing when to stop dosing to avoid unnecessarily prolonged treatment (Rhee et al., 2020). This can be done by developing a pharmacodynamic (PD) model to predict the time course of anti-bacterial effects. While bacterial eradiation would be the most meaningful PD endpoint for that purpose, in routine clinical care settings where such information is usually not available, an alternative endpoint could be C-reactive protein (CRP). CRP plasma concentration, which is maintained between 1 and 10 mg/L, increases up to 100-fold within 2 h of the onset of inflammation and peaks almost within 48 h (Kindmark, 1972; Lelubre et al., 2013).
With this background, this study aims to i) develop a vancomycin population PK model and determine the optimal individualized dosage regimen within the MIPD framework, ii) develop a vancomycin PD model to identify the optimal treatment time, and iii) develop a web-based tool to visualize vancomycin PK and PD profiles for a selected dosage regimen applicable in clinical practice. Figure 1 illustrates the flow chart of this study.
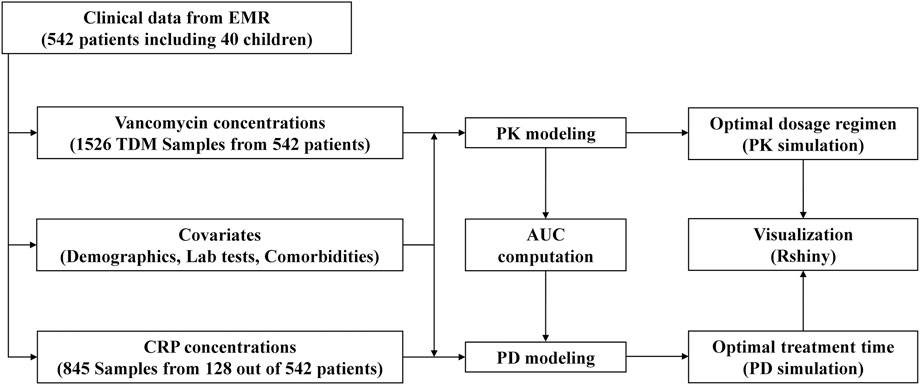
FIGURE 1. Study flow chart.
2 Methods
2.1 Data collection
This was a retrospective study for PK and PD properties of vancomycin in 542 patients including 40 pediatric patients (<20 years), who received vancomycin intravenous IV) infusion at Severance Hospital in Seoul, Republic of Korea. The data were extracted from electronic medical records. The study encompassed patients who were treated with vancomycin and underwent Therapeutic Drug Monitoring (TDM) services. Patients lacking dosing history and concentration sampling time information were excluded from the analysis. Demographic information, laboratory test results such as creatinine and blood urea nitrogen (BUN), and comorbidity details were collected as potential covariates, as well as drug concentrations with 3 measurements per patient on average for PK analysis and CRP concentrations for PD analysis. PK and PD analyses were performed using NONMEM software version 7.5 (ICON Development Solutions, Dublin, Ireland) and exploratory data analysis was conducted using R software version 4.2.2.
2.2 Bioanalysis
Serum vancomycin levels were assessed using the kinetic interaction of microparticles in solution (KIMS) method on the Roche Cobas c702 analyzer (Roche, Basel, Switzerland). A competitive reaction takes place between the vancomycin-macromolecule conjugate and vancomycin in the serum to bind with the vancomycin antibody on the microparticles. The turbidity induced by the binding of the vancomycin conjugate to the antibody on the microparticles is measured photometrically, and this measurement is inhibited by the presence of vancomycin in the sample. The resulting turbidity is indirectly proportional to the amount of vancomycin present in the sample. The lower limit of quantitation for vancomycin is 4.0 μg/mL, determined as the lowest concentration that meets a total error goal of 20%.
CRP concentrations were determined through a particle-enhanced immunoturbidimetric assay on the Roche Cobas c702 as well. Serum creatinine levels were measured by a rate-blanked compensated kinetic Jaffe method on the Atellica CH 930 Analyzer (Siemens Healthcare Diagnostics, Marburg, Germany).
2.3 Basic PK model building
One- and two-compartment disposition models were tested for basic structural model since sparse samples near peak and trough concentrations were taken, where trough and peak concentrations were concentrations at the start and the end of IV infusion within one dosing interval, respectively. Systemic and inter-compartmental clearance and central and peripheral volume of distribution were parameterized using allometry scaling (N. H. Holford, 1996) as the following equations
where WT is body weight, TVV and TVCL denote population typical value of volume of distribution (V) and clearance (CL), and
2.4 Covariate model building
Assuming vancomycin clearance is affected by age-related renal function factor (
where
where for the
On the other hand,
where PMA50 denotes PMA where maturation reaches 50% of the adult clearance and γ is a steepness factor of sigmoid function.
After integrating these into clearance, potential covariates such as age, gender, BUN, and the history of hypertension, diabetes, renal diseases, cardiovascular disease, hematological diseases, pleural effusion and edema, and sepsis were tested based on pharmacological and physiological plausibility, as denoted by
2.5 PD model building
To characterize the dynamics of CRP for the time delay between infection and biomarker level change in the plasma, a semi-mechanistic model with proliferation and transit compartments was attempted which was formulated as below:
Prol is the proliferation compartment, with Kin and Kout denoting production and degradation rate constant, respectively, which was assumed to be Kin = Kout =
AUC obtained from the developed PK model,
2.6 Model evaluation
To select the final model, the tested models were compared based on OFV or AIC values and the precision of parameter estimates. The selected model was then evaluated with goodness-of-fit plots such as observation versus model prediction (PRED), and conditional weighted residual (CWRES) versus PRED. Subsequently, a visual predicted check (VPC) was conducted for the validation of the selected model, ensuring that collected drug concentrations fall within the 95% confidence interval of the 2.5th percentile, median, and 97.5th percentile of predicted drug concentrations.
2.7 Simulation for optimal dosage regimen
Using the final PK model, simulations were conducted to explore optimal dosage regimens for sub-populations stratified by selected covariates. To achieve this, for the m selected covariates, the range from the minimum to the maximum values for each covariate i was divided into equi-spaced intervals
These scenarios were simulated using typical values for intravenous administration four times a day (QID). The objective was to determine the optimal dosage regimen that meets the criteria of achieving a trough concentration closest to the target value, which was set at 7 mg/L for children under the age of 4, 10 mg/L for those aged 4 to 19, and 15 mg/L for adults. Additionally, the peak concentrations were required to remain below the toxic level of 40 mg/L across all age groups. These criteria were based on findings from previous studies (Rybak M. et al., 2009; Rybak et al., 2020).
2.8 Simulation for the time course of anti-bacterial effects
Using the developed PD model and the selected covariates, the time course of CRP plasma concentrations was simulated by varying the dose, infusion rate, and inter-dose interval in order to predict the optimal time to discontinue treatment and prevent unnecessary overtreatment.
2.9 Development of a web-based tool
A web-based application was developed using R Shiny to visualize the simulated time course of plasma concentrations of vancomycin and CRP, which is based on the developed PK-PD model and the selected dosage regimen. This application allows users to visualize the predicted individual PK-PD profile for a specific dosage regimen.
3 Results
3.1 Patient information
A total of 542 hospitalized patients were included in the PK model building, with 22 aged under 4, 18 aged 4 to 19, and 502 adults. Among them, 128 patients were eligible for the PD analysis. Vancomycin was administered at doses ranging from 500 to 1,500 mg, with dose intervals ranging from 6 to 24 h. The patient population spanned from neonates to the elderly, and 40 pediatric patients were included in both PK and PD analyses. The average length of hospital stay was 20 days, with a minimum of 2 days and a maximum of 113 days. The hospitalization of up to 113 days was due to a secondary infection caused by pneumonia, which necessitated the extension of vancomycin treatment. Detailed demographic information for the patients can be found in Tables 1, 2.
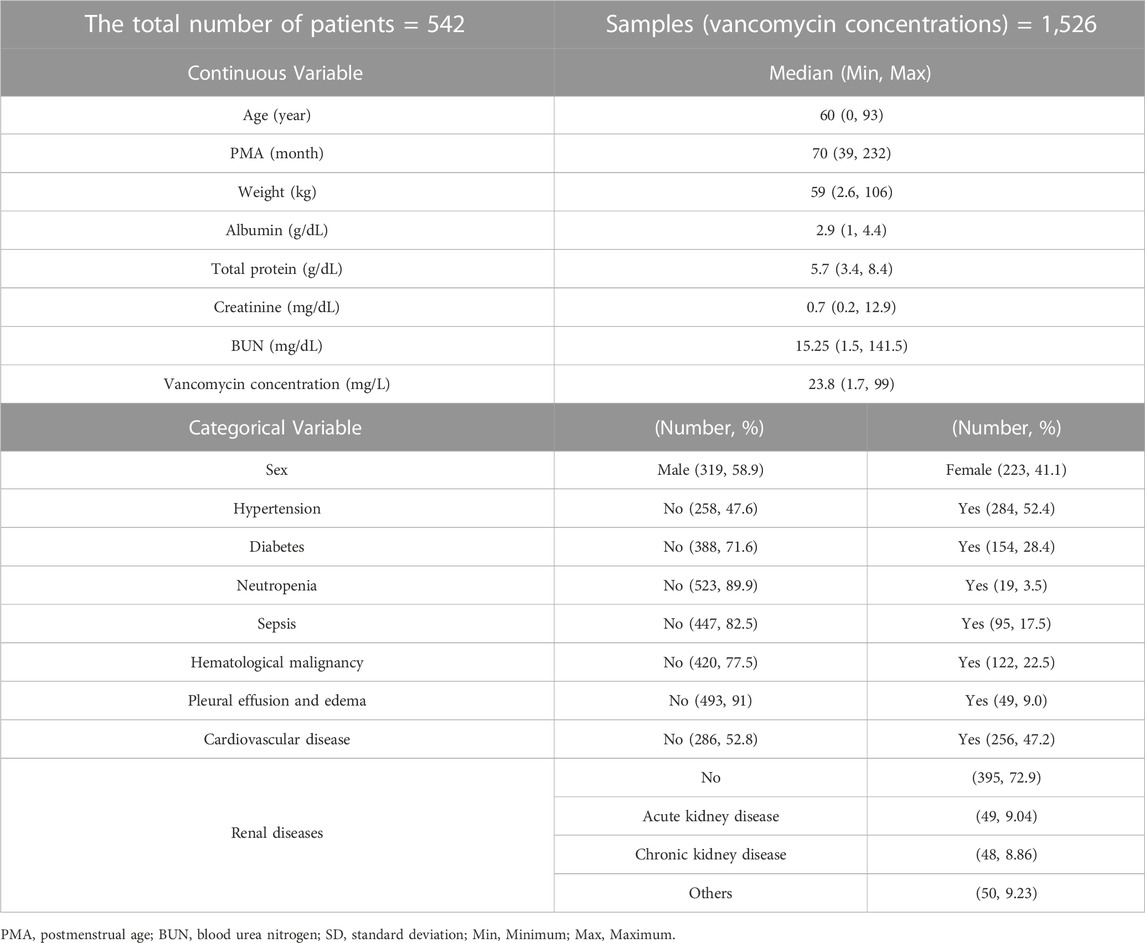
TABLE 1. Demographic of patients who were included in the PK analysis.
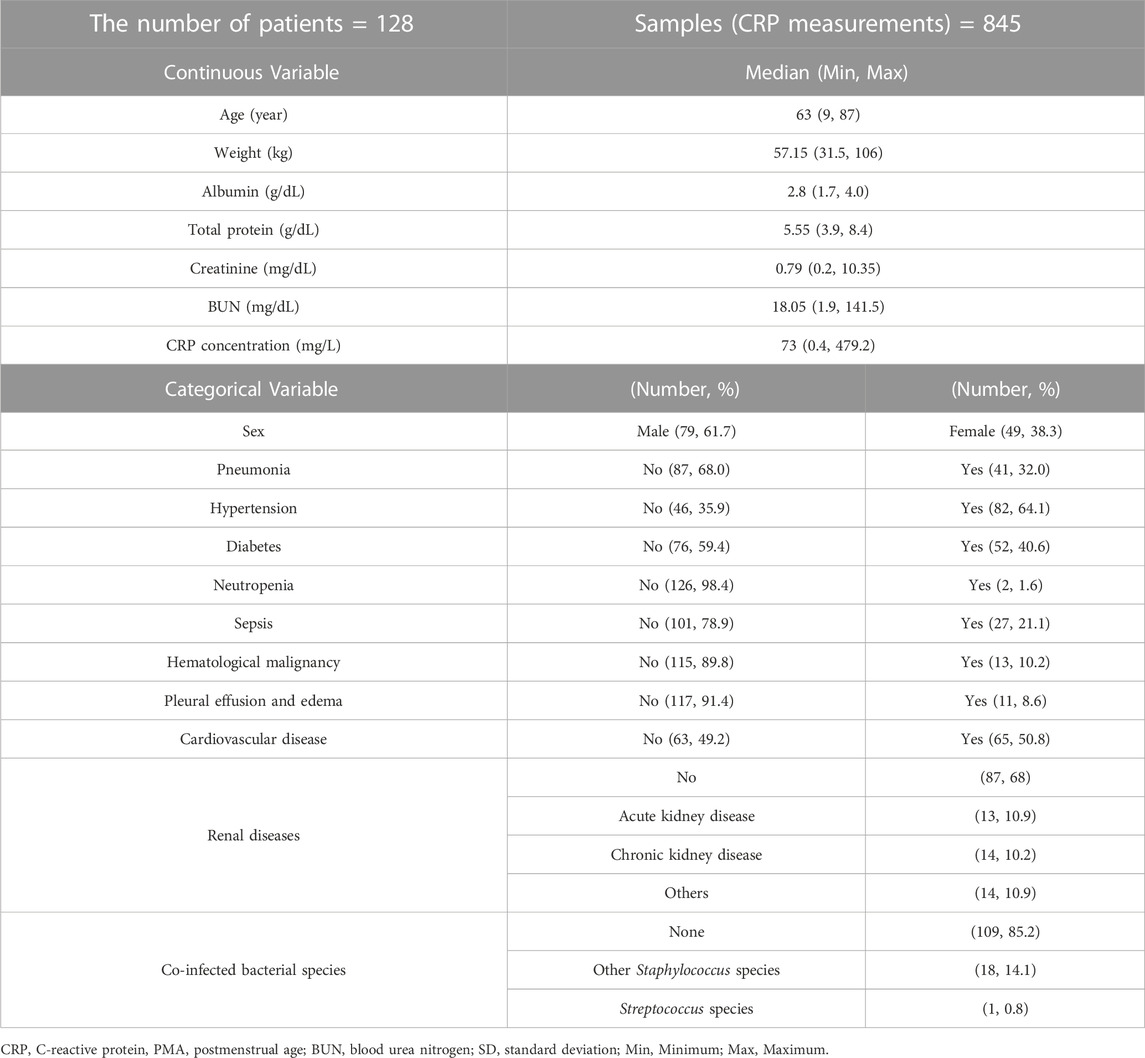
TABLE 2. Demographic of patients who were included in the PD analysis.
3.2 PK model
Various models were tested using the collected vancomycin concentration data, and a 2-compartment model incorporating allometry scaling was selected as the basic model based on the OFV value. For covariates, gender, BUN, and the history of diabetes and renal disease were selected for
where
The incorporation of vancomycin-induced nephrotoxicity
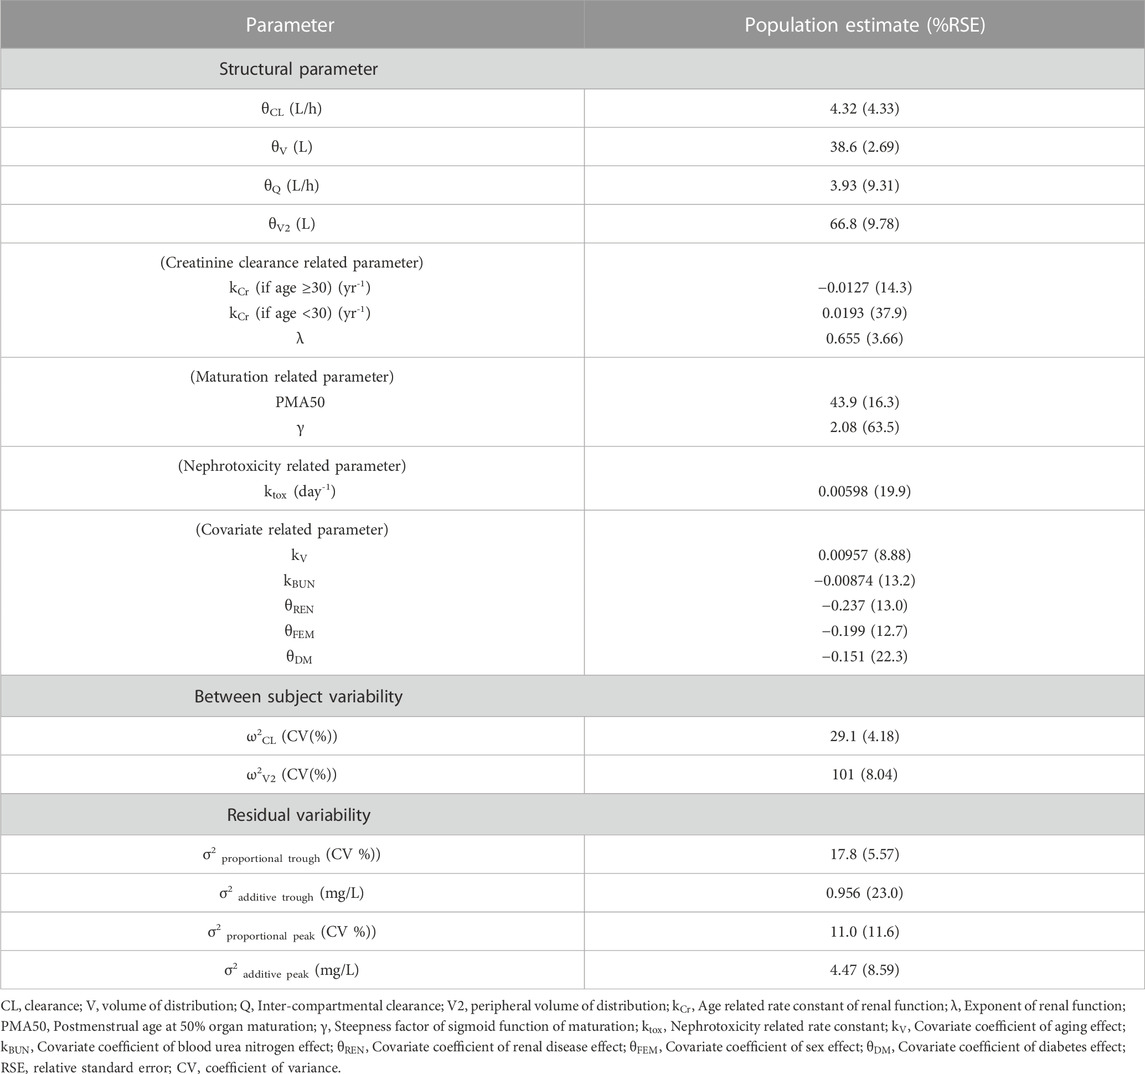
TABLE 3. Parameter estimates of the final pharmacokinetic model.
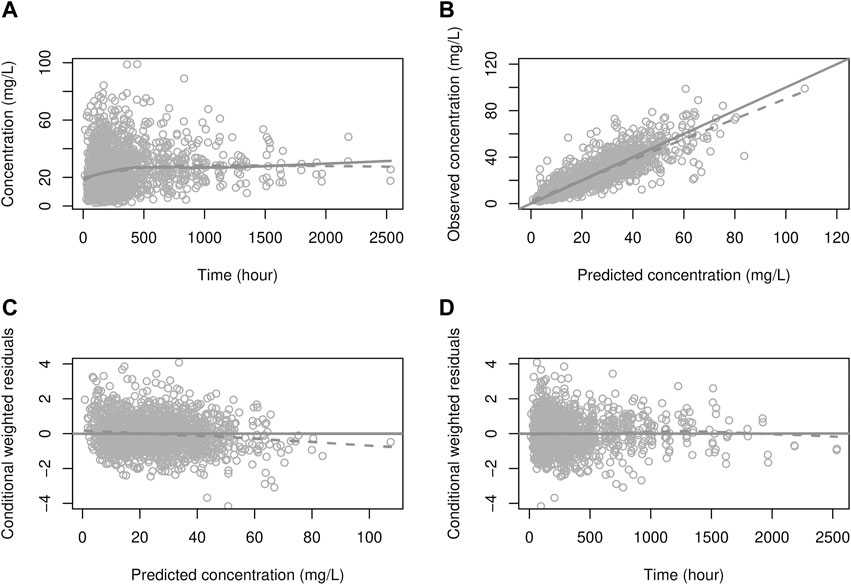
FIGURE 2. Goodness-of-fit plot for the PK model (A) solid line: prediction; dots: observations, dashed line: smooth (of observations), (B) solid line: identity line; dashed line: smooth, (C, D) solid line: zero residual line; dashed line: smooth.
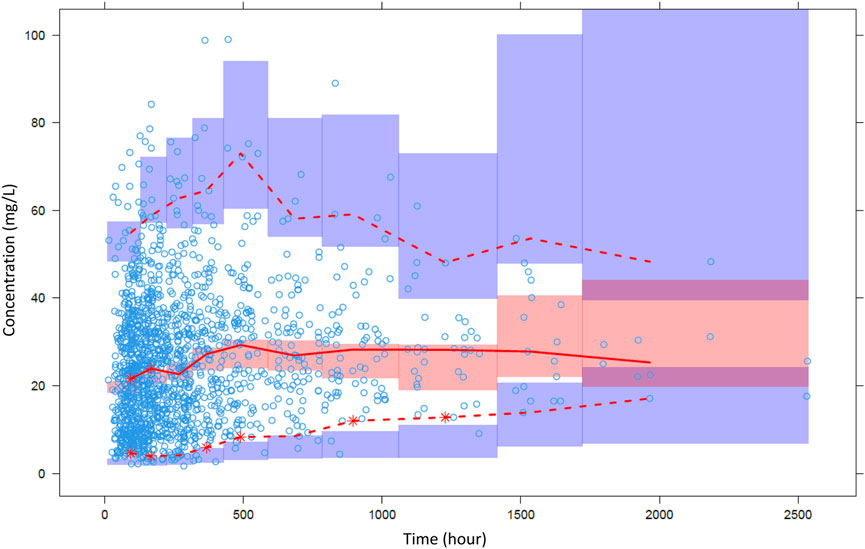
FIGURE 3. Visual predictive check of the final pharmacokinetic model. Open circles are observations and lines are 2.5th, median and 97.5th percentiles of observations. Colored area means confidence interval of each prediction percentile.
3.3 PD model
A semi-mechanistic model with one proliferation compartment and two transit compartments was selected as the structural model. Among the covariates, the presence of pneumonia had a significant effect on the transit rate constant as in the following equation, where PNE = 1 indicates pneumonia and 0 indicates no pneumonia.
The final parameter estimates are presented in Table 4. Except for
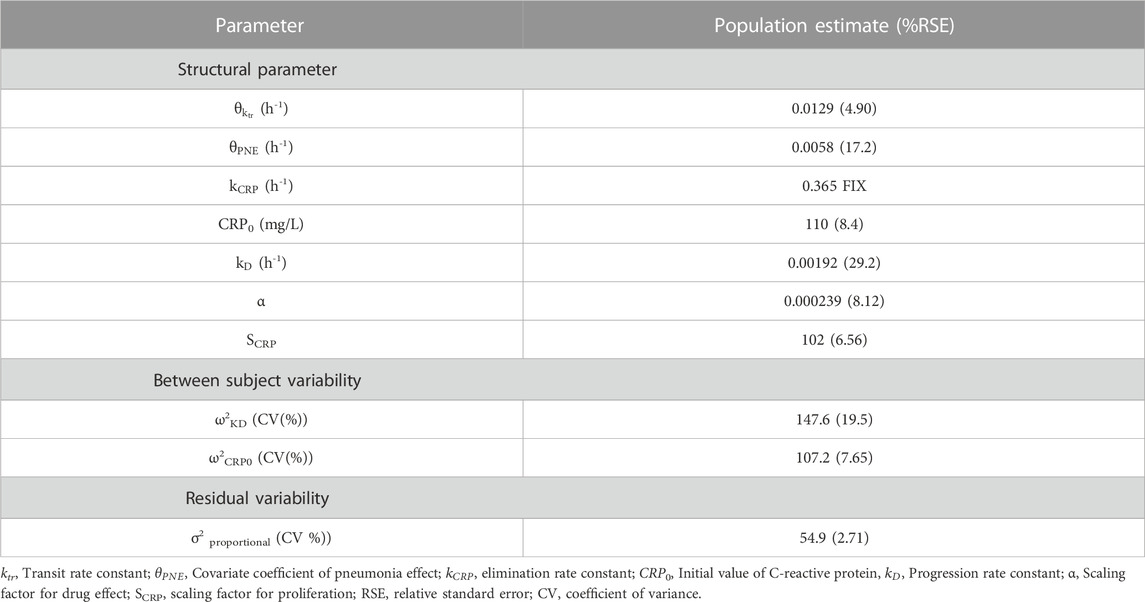
TABLE 4. Parameter estimates of the final pharmacodynamic model.
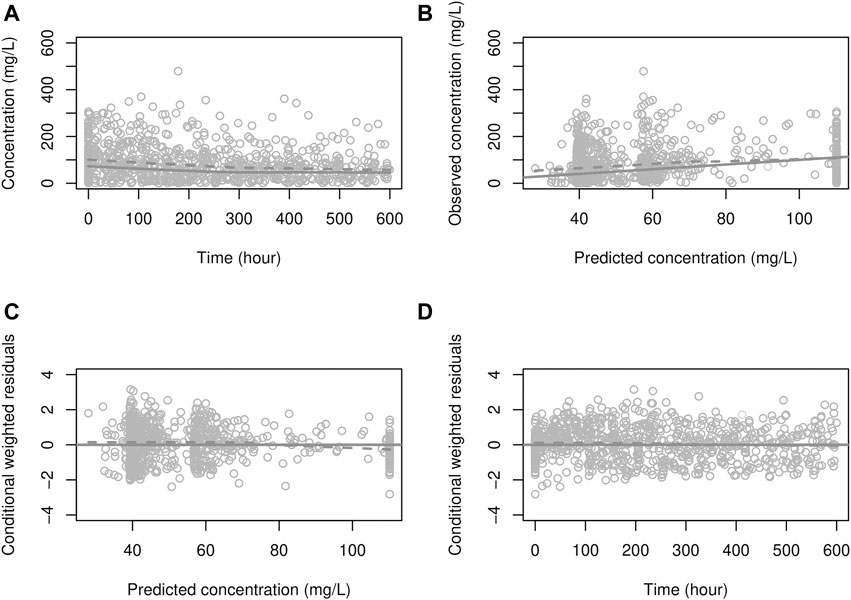
FIGURE 4. Goodness-of-fit plot for the PD model. (A) solid line: prediction; dots: observations, dashed line: smooth (of observations), (B) solid line: identity line; dashed line: smooth, (C, D) solid line: zero residual line; dashed line: smooth.
3.4 Simulation for optimal dosage regimen
Considering the range of covariates observed in the collected data, a total of 384 scenarios were simulated for adult patients, using 4 Cr levels, 4 BUN levels, 4 age levels, and 6 body weight (WT) levels. For pediatric patients, a total of 656 scenarios were simulated. Among these, 336 scenarios were designed for patients aged 4 years or younger, incorporating 7 PMA levels, 3 WT levels, 4 Cr levels, and 4 BUN levels. An additional 320 scenarios were created for patients aged over 4 years, employing 4 age levels, 5 WT levels, 4 Cr levels, and 4 BUN levels.
Daily doses were explored in increments of 0.2 g (0.05 g per dose; QID) for adults, and in increments of 5 mg/kg (1.25 mg/kg per dose; QID) for pediatrics. Detailed results are presented in Table 5 for adults, Table 6 for pediatric patients and Table 7 for those aged under 4. The MIPDs were provided for each combination of covariate values, and the shading increased with the dose. For precision dosing presented in the tables, the covariate model for
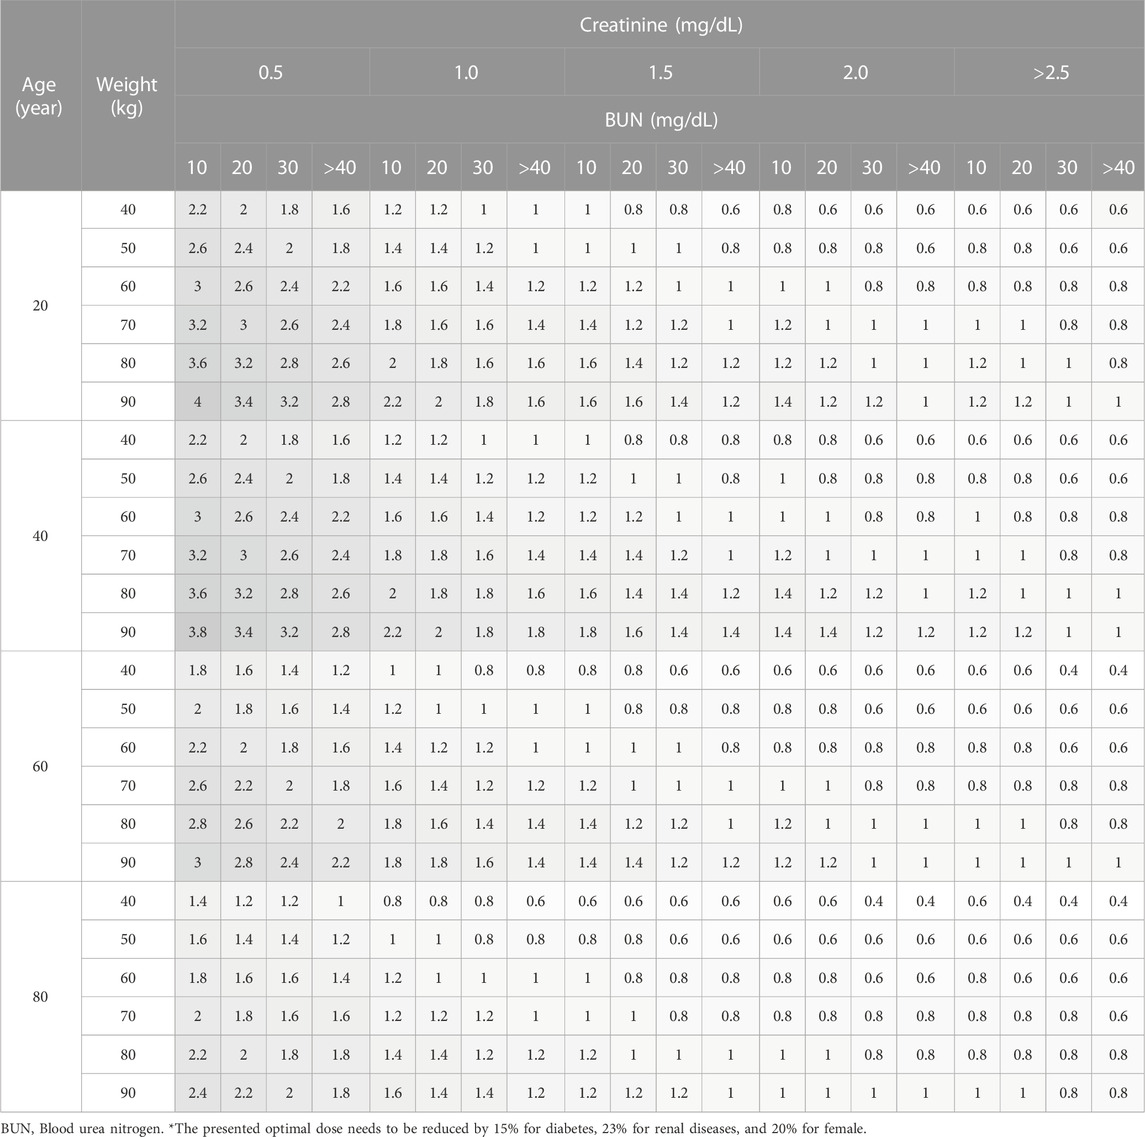
TABLE 5. Simulation results for optimal daily dose in adults (g/day).
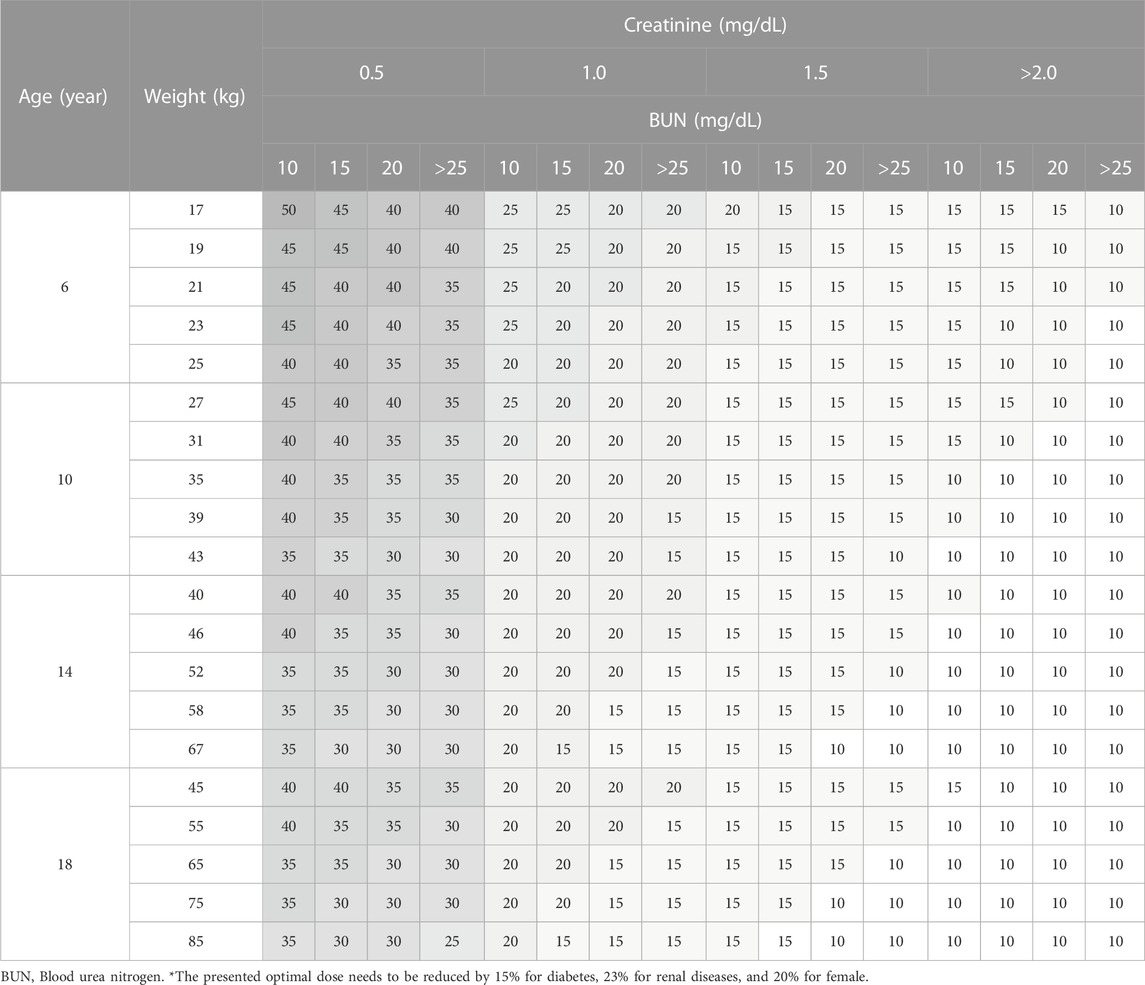
TABLE 6. Simulation results for optimal weight-normalized daily dose in pediatrics (mg/kg/day).
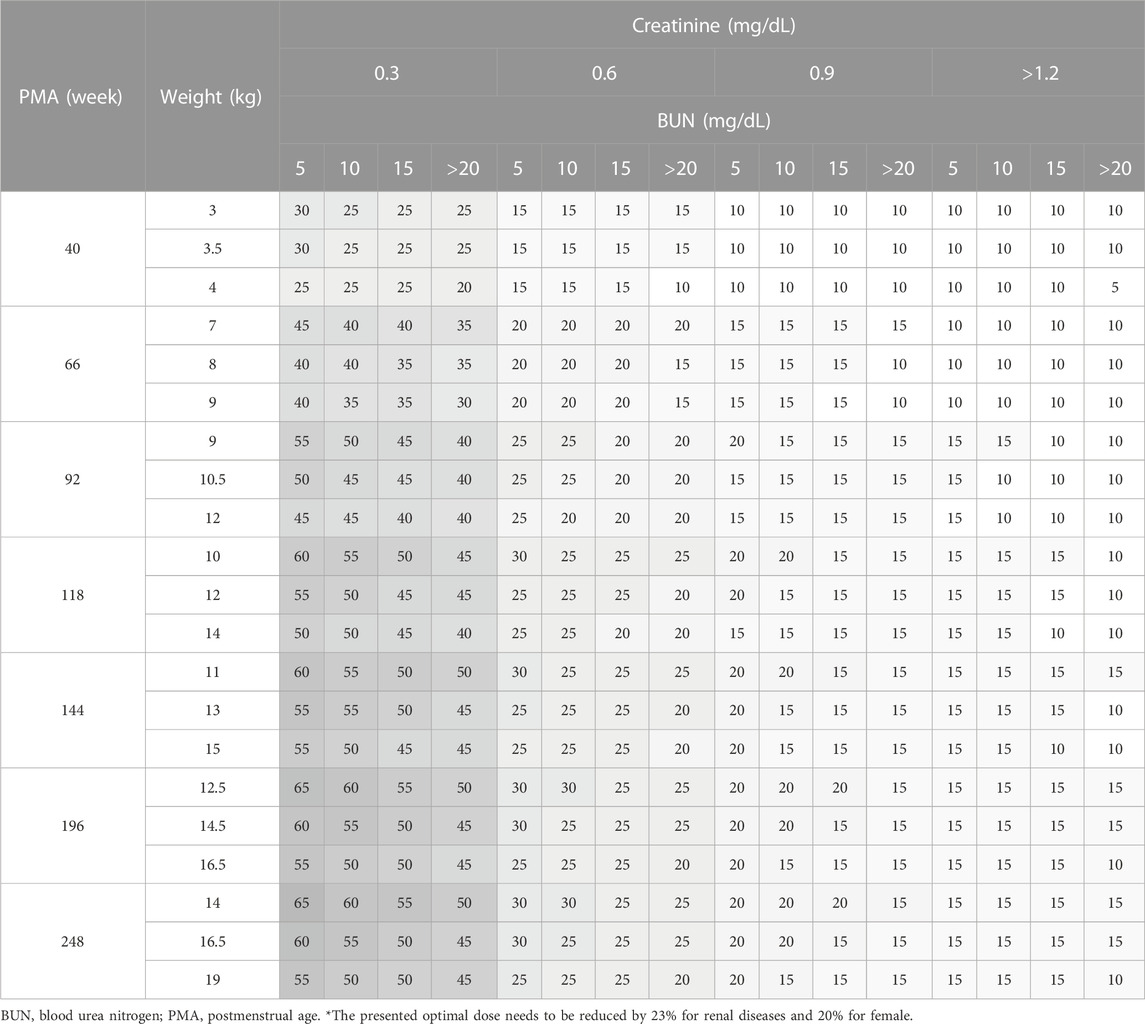
TABLE 7. Simulation results for optimal weight-normalized daily dose in pediatrics aged under 4 (mg/kg/day).
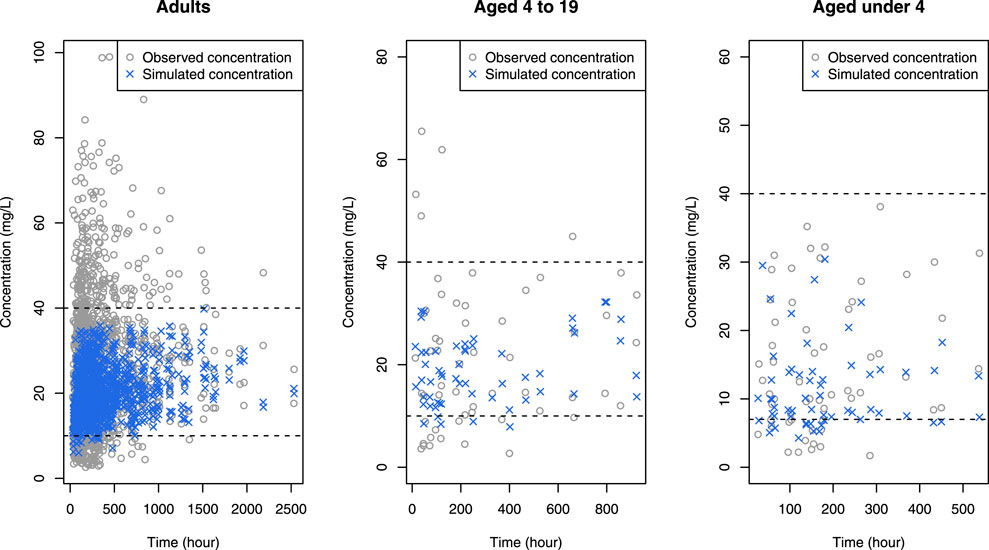
FIGURE 5. Simulated concentrations (blue crosses) obtained when the optimal dose was given to each patient in the data, superimposed by observed concentrations (gray open circles), where black horizontal dashed lines mean upper and lower limit of therapeutic range.
3.5 Simulation for the time course of anti-bacterial effects
The influence of dose and pneumonia on CRP concentration-time profile is illustrated in Figure 6. No dose-dependent differences were observed up to approximately 240 h or 10 days. However, after this point, CRP levels exhibited a faster decline with higher doses, returning to the normal range of 1–10 mg/L at around 1,100 h or 46 days with the recommended dose. This suggests that discontinuing vancomycin treatment at 46 days is viable to prevent unnecessary overtreatment. It is worth noting that the extended time required for CRP levels to normalize can be attributed to the prolonged hospitalization period experienced by the study patients.
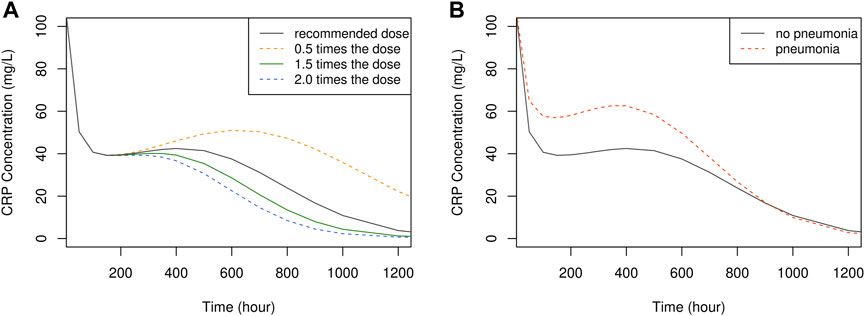
FIGURE 6. The time course of simulated CRP concentration, plotted by dose (A) and the presence of pneumonia (B).
3.6 Development of a web-based tool
The interface of the developed R Shiny tool for vancomycin dose optimization is showcased in Figure 7. This tool offers the capability to optimize the necessary dose for a patient to attain the desired drug concentration based on their individual covariates, achieved through the adjustment of the dose and/or dosing interval. By providing visualizations of drug concentration-time profiles, this tool serves as an alternative to the nomogram approach detailed in Tables 5–7. In addition to simulating drug concentrations, the application also facilitates the visualization of simulated CRP plasma concentrations that correspond to the employed dose, dosing rate, and covariates utilized in the PK simulation.
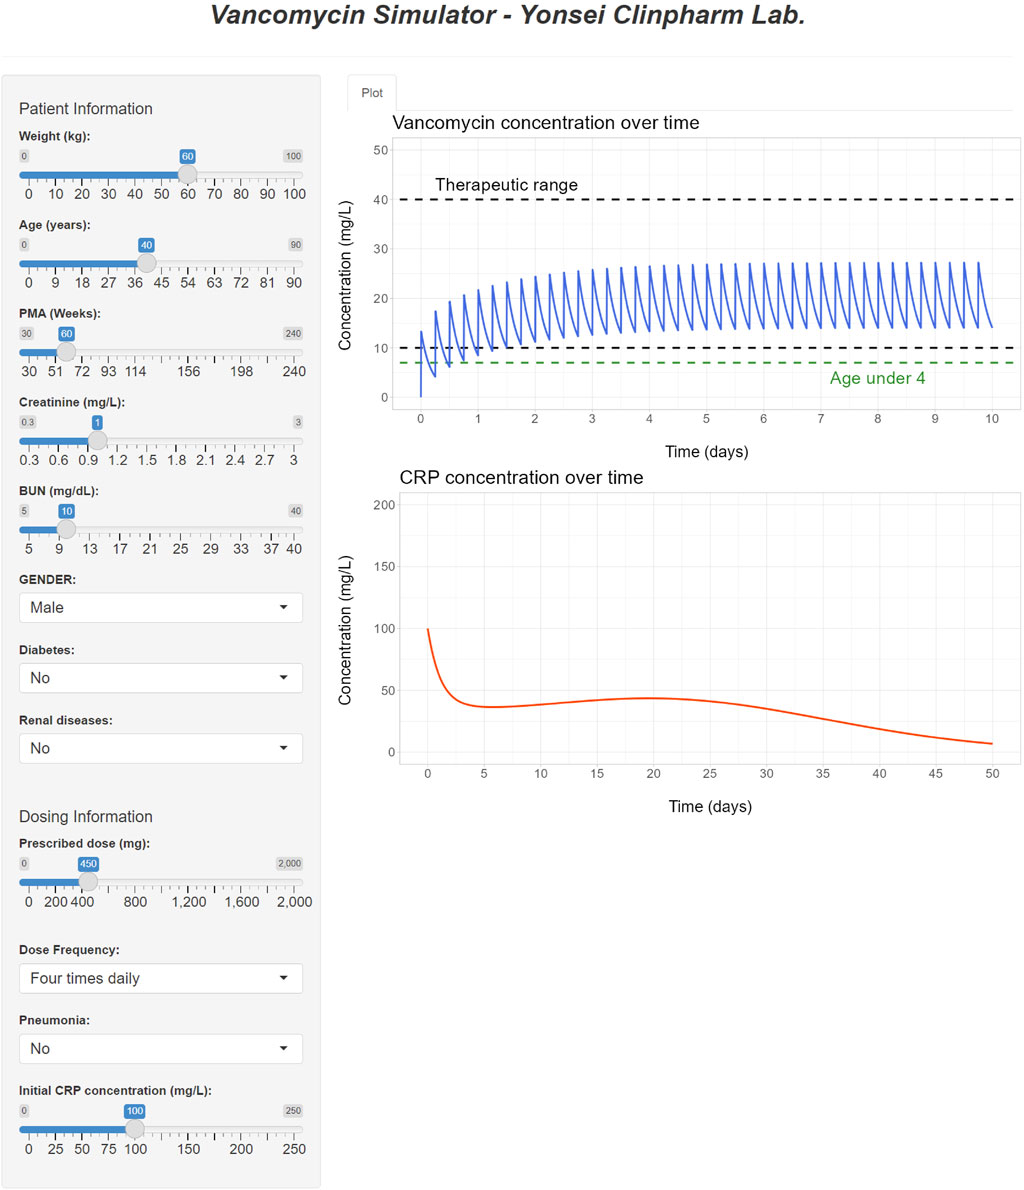
FIGURE 7. R Shiny application for vancomycin dose optimization and visualization of simulated PK and PD profiles.
4 Discussion
The primary objective of this study was to present the optimal dosage regimen and treatment duration for Korean patients undergoing vancomycin treatment by utilizing a PK-PD model. Prior research within the framework of vancomycin dose adjustment using TDM has provided dosing guidelines based on peak and trough concentrations, considering factors such as AUC, MIC, and patient covariates (Rybak et al., 2020). However, these simplistic TDM-based approaches often fall short of offering truly personalized vancomycin therapy tailored to individual patient characteristics. In light of this limitation, PK model-based studies have delved into dose optimization (Anderson et al., 2007; Yamamoto et al., 2009; Deng et al., 2013; Abdel Hadi et al., 2016; Goti et al., 2018). However, it is a challenge to come across model-based endeavors that systematically develop optimal dosage regimens spanning all age groups and encompassing a diverse range of covariate effects.
Our PK model introduced
With regard to vancomycin-induced nephrotoxicity, highlighted in earlier studies (Rybak M. J. et al., 2009; Elyasi et al., 2012; Gelfand and Cleveland, 2013), our work revealed that creatinine clearance, formulated to decrease with time, resulted in improved model predictions. This finding suggests that prolonged therapy may lead to a reduction in renal function (Pritchard et al., 2010). However, the influence of other risk factors like concomitant treatments and extended hospitalization requires further exploration due to limited data availability. Consequently, additional research is necessary to comprehensively understand vancomycin-induced nephrotoxicity.
For model parameter estimates, PMA50 was obtained to be 43.9 weeks, consistent with the timeline of glomerular function maturation, which nearly reaches adult levels a year after birth (Rhodin et al., 2009; Iacobelli and Guignard, 2021). The substantial RSE for γ might be attributed to an imbalanced distribution of PMA within the <4 years group, where approximately 40% of patients exhibited PMA values between 30 and 50 weeks (data not shown), leading to numerical difficulty in estimating the steepness factor of the sigmoid maturation function (as outlined in the Methods section). Our model indicated that central volume of distribution increased by approximately 1% per year after the age of 40, a trend in line with prior research demonstrating increased volume of distribution in the elderly (Cutler et al., 1984; Guay et al., 1993). The estimated values for clearance and central volume of distribution fell within the range of values reported in earlier studies concerning Korean patients (Bae et al., 2019; Chung et al., 2013; D. J; Kim et al., 2019), and the clearance value was closely aligned with literature values for Korean neonates (Lee et al., 2021). It is noteworthy that vancomycin pharmacokinetics have been reported to be similar across Japanese, Chinese and Caucasian patient populations (Tsai et al., 2015).
Simulations demonstrated that for adults within the normal creatinine concentration range (1.0 mg/dL), certain patient groups exceeded the optimal dose limit recommended in the label (2 g/day). Nevertheless, this higher dose is deemed acceptable, considering that individualized maintenance doses of up to 4.5 g have been suggested for certain patients, including obese patients (Rybak et al., 2020). For pediatric patients, all sub-groups proposed optimal doses below the maximum dose (3 g/day) advised in recent studies (Rybak et al., 2020). In comparison with actual administered doses in the data, the optimal dose was generally lower (data not shown), a pattern reinforced by Figure 5 where concentrations for optimal doses were consistently below those for actual doses.
In our study, peak and trough concentrations were selected as indices for optimal dosage regimen design evaluation because they are conveniently available in the routine clinic, requiring only two blood samples (i.e., peak and trough samples) whereas other indices such as AUC necessitate additional blood samples and computational effort. Nevertheless, to assess the generality of our results, we simulated AUC values using the optimal doses reported in Tables 5–7 and a target AUC of 400–600 mg/L h with MIC = 1 mg/L, considering that AUC/MIC is another widely used endpoint. The resulting figure (Figure 8) indicated that around 90% of adults achieved AUC levels within the target range, and nearly all pediatric patients met the target, affirming the appropriateness of the optimal doses proposed by our study.
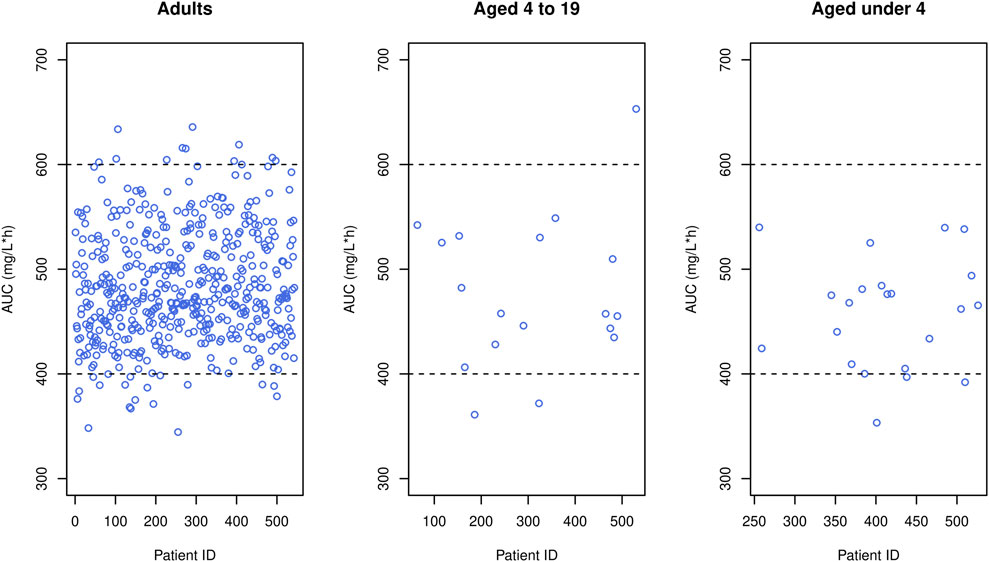
FIGURE 8. Simulated AUC (blue circles) obtained when the optimal dose was given to each patient in the data, where black horizontal dashed lines mean upper and lower limit of therapeutic range.
While other biomarkers for bacterial infection such as procalcitonin (PCT) and absolute neutrophil count (ANC) are available (Stol et al., 2019), CRP was used in our study due to its cost-effectiveness and swift test result confirmation compared to PCT and ANC, making it useful for acute infection (Escadafal et al., 2020). Despite certain limitations and potential confounders associated with CRP elevation in various conditions, its widespread use as a biomarker remains due to its practicality.
In our PD model, it was assumed that CRP proliferation increased with disease severity (D) as previously reported (Hohenthal et al., 2009; Haran et al., 2012). However, since our data lacked the requisite detail to capture the potential nonlinear relationship between CRP and D, we opted for a simple model where the production rate constant (Kin) was multiplied by a linear function of D.
Regarding PD simulation, no discernible differences were identified in the initial response (CRP0) across different doses. This could be attributed to limitations in accurately predicting high CRP values and difficulties in isolating vancomycin’s pure effects from potential confounding factors. Nevertheless, this model exhibited trends in CRP concentration shifts based on dose and selected covariate, furnishing the optimal treatment discontinuation point at 1,100 h or 46 days. It is worth mentioning that for most adult patients, treatment was concluded around the 1100-h mark, signifying a suitable treatment duration (Figure 6).
Given the retrospective nature of this study, several limitations warrant consideration. Firstly, the information concerning medication history, including concomitant medications, was unavailable for inclusion in model building. Secondly, because laboratory tests were not performed in all patients in a clinical practice setting, CRP was only measured in 128 out of 542 patients, leading to only a limited subset of patients included in PD analysis. Lastly, the lack of follow-up data hindered the incorporation of information regarding infection recovery, relapse rates, and mortality rates.
In summation, this study established a comprehensive PK-PD model for vancomycin across all age groups and recommended optimal doses for each sub-population. Simulations underscored that most study patients’ concentrations would fall within the therapeutic range with doses smaller than usual. The R Shiny application developed herein not only facilitates identification of the optimal dose but also aids in pinpointing the optimal treatment duration by providing visual insights into simulated concentration and CRP profiles. The findings of this study are anticipated to equip clinicians with tools for achieving precise vancomycin treatment tailored to their patients.
Data availability statement
Data supporting reported results are available from the corresponding author upon approval of a written request by Severance Hospital. Requests to access these datasets should be directed to KP, a3NwYXJrQHl1aHMuYWM=.
Ethics statement
The study involving humans was approved by the Institutional Review Board of Yonsei University Severance Hospital, Seoul, Korea. The study was conducted in accordance with the local legislation and institutional requirements. The ethics committee/institutional review board waived the requirement of written informed consent for participation from the participants or the participants' legal guardians/next of kin because: Patient consent was waived due to it being a retrospective study.
Author contributions
JG and KP conceived the study. S-GL and J-HK collected the data. SY, JG, DC, and KP evaluated the data and built the model. SY, JG, and KP drafted the manuscript. SY and KP reviewed and edited the manuscript. All authors contributed to the article and approved the submitted version.
Acknowledgments
This study was supported by a grant from the Brain Korea 21 Plus Project for Medical Science, Yonsei University. We thank Severance hospital for providing electronic medical records of the dataset used in this study. We thank the pharmacometrics team of our laboratory for their helpful discussion.
Conflict of interest
The authors declare that the research was conducted in the absence of any commercial or financial relationships that could be construed as a potential conflict of interest.
Publisher’s note
All claims expressed in this article are solely those of the authors and do not necessarily represent those of their affiliated organizations, or those of the publisher, the editors and the reviewers. Any product that may be evaluated in this article, or claim that may be made by its manufacturer, is not guaranteed or endorsed by the publisher.
References
Abdel Hadi, O., Al Omar, S., Nazer, L. H., Mubarak, S., and Le, J. (2016). Vancomycin pharmacokinetics and predicted dosage requirements in pediatric cancer patients. J. Oncol. Pharm. Pract. 22, 448–453. doi:10.1177/1078155215591386
Abdel-Bari, A., Mokhtar, M. S., Sabry, N. A., El-Shafi, S. A., and Bazan, N. S. (2011). Once versus individualized multiple daily dosing of aminoglycosides in critically ill patients. Saudi Pharm. J. 19, 9–17. doi:10.1016/j.jsps.2010.11.001
Aljutayli, A., Thirion, D. J. G., Bonnefois, G., and Nekka, F. (2022). Pharmacokinetic equations versus Bayesian guided vancomycin monitoring: Pharmacokinetic model and model-informed precision dosing trial simulations. Clin. Transl. Sci. 15, 942–953. doi:10.1111/cts.13210
Anderson, B. J., Allegaert, K., Van den Anker, J. N., Cossey, V., and Holford, N. H. (2007). Vancomycin pharmacokinetics in preterm neonates and the prediction of adult clearance. Br. J. Clin. Pharmacol. 63, 75–84. doi:10.1111/j.1365-2125.2006.02725.x
Bae, S. H., Yim, D. S., Lee, H., Park, A. R., Kwon, J. E., Sumiko, H., et al. (2019). Application of pharmacometrics in pharmacotherapy: Open-source software for vancomycin therapeutic drug management. Pharmaceutics 11, 224. doi:10.3390/pharmaceutics11050224
Belavagi, D., Bhandari, R. K., Shafiq, N., Gota, V., Patil, A., Pandey, A. K., et al. (2022). A study to explore the appropriateness of dosing regimen of vancomycin in critically ill patients in a tertiary care unit of India. Germs 12, 238–252. doi:10.18683/germs.2022.1326
Bjork, J., Nyman, U., Larsson, A., Delanaye, P., and Pottel, H. (2021). Estimation of the glomerular filtration rate in children and young adults by means of the CKD-EPI equation with age-adjusted creatinine values. Kidney Int. 99, 940–947. doi:10.1016/j.kint.2020.10.017
Brummett, R. E. (1981). Effects of antibiotic-diuretic interactions in the Guinea pig model of ototoxicity. Rev. Infect. Dis. 3, S216–S223. suppl. doi:10.1093/clinids/3.supplement_2.s216
Centers for Disease Control and Prevention (Cdc), (2019). Antibiotic resistance Threats in the United States, 2019. Atlanta, GA: U.S. Department of Health and Human Services, CDC.
Chong, Y., and Lee, K. (2000). Present situation of antimicrobial resistance in Korea. J. Infect. Chemother. 6, 189–195. doi:10.1007/s101560070001
Chung, J. Y., Jin, S. J., Yoon, J. H., and Song, Y. G. (2013). Serum cystatin C is a major predictor of vancomycin clearance in a population pharmacokinetic analysis of patients with normal serum creatinine concentrations. J. Korean Med. Sci. 28, 48–54. doi:10.3346/jkms.2013.28.1.48
Cockcroft, D. W., and Gault, M. H. (1976). Prediction of creatinine clearance from serum creatinine. Nephron 16, 31–41. doi:10.1159/000180580
Cutler, N. R., Narang, P. K., Lesko, L. J., Ninos, M., and Power, M. (1984). Vancomycin disposition: The importance of age. Clin. Pharmacol. Ther. 36, 803–810. doi:10.1038/clpt.1984.260
Deng, C., Liu, T., Zhou, T., Lu, H., Cheng, D., Zhong, X., et al. (2013). Initial dosage regimens of vancomycin for Chinese adult patients based on population pharmacokinetic analysis. Int. J. Clin. Pharmacol. Ther. 51, 407–415. doi:10.5414/CP201842
Depardieu, F., Bonora, M. G., Reynolds, P. E., and Courvalin, P. (2003). The vanG glycopeptide resistance operon from Enterococcus faecalis revisited. Mol. Microbiol. 50, 931–948. doi:10.1046/j.1365-2958.2003.03737.x
Elyasi, S., Khalili, H., Dashti-Khavidaki, S., and Mohammadpour, A. (2012). Vancomycin-induced nephrotoxicity: Mechanism, incidence, risk factors and special populations. A literature review. Eur. J. Clin. Pharmacol. 68, 1243–1255. doi:10.1007/s00228-012-1259-9
Escadafal, C., Incardona, S., Fernandez-Carballo, B. L., and Dittrich, S. (2020). The good and the bad: using C reactive protein to distinguish bacterial from non-bacterial infection among febrile patients in low-resource settings. BMJ Glob. Health 5, e002396. doi:10.1136/bmjgh-2020-002396
Farber, B. F., and Moellering, R. C. (1983). Retrospective study of the toxicity of preparations of vancomycin from 1974 to 1981. Antimicrob. Agents Chemother. 23, 138–141. doi:10.1128/AAC.23.1.138
Frymoyer, A., Schwenk, H. T., Zorn, Y., Bio, L., Moss, J. D., Chasmawala, B., et al. (2020). Model-informed precision dosing of vancomycin in hospitalized children: Implementation and adoption at an academic children's hospital. Front. Pharmacol. 11, 551. doi:10.3389/fphar.2020.00551
Gelfand, M. S., and Cleveland, K. O. (2013). Vancomycin-induced nephrotoxicity. Antimicrob. Agents Chemother. 57, 2435. doi:10.1128/AAC.00253-13
Goti, V., Chaturvedula, A., Fossler, M. J., Mok, S., and Jacob, J. T. (2018). Hospitalized patients with and without hemodialysis have markedly different vancomycin pharmacokinetics: A population pharmacokinetic model-based analysis. Ther. Drug Monit. 40, 212–221. doi:10.1097/FTD.0000000000000490
Guay, D. R., Vance-Bryan, K., Gilliland, S., Rodvold, K., and Rotschafer, J. (1993). Comparison of vancomycin pharmacokinetics in hospitalized elderly and young patients using a Bayesian forecaster. J. Clin. Pharmacol. 33, 918–922. doi:10.1002/j.1552-4604.1993.tb01922.x
Haran, J. P., Suner, S., and Gardiner, F. (2012). Correlation of C-reactive protein to severity of symptoms in acute influenza A infection. J. Emerg. Trauma Shock 5, 149–152. doi:10.4103/0974-2700.96484
Hesham El-Sherazy, N., Samir Bazan, N., Mahmoud Shaheen, S., and N, A. S. (2021). Impact of ascorbic acid in reducing the incidence of vancomycin associated nephrotoxicity in critically ill patients: A preliminary randomized controlled trial. F1000Res 10, 929. doi:10.12688/f1000research.55619.1
Heus, A., Uster, D. W., Grootaert, V., Vermeulen, N., Somers, A., In't Veld, D. H., et al. (2022). Model-informed precision dosing of vancomycin via continuous infusion: A clinical fit-for-purpose evaluation of published PK models. Int. J. Antimicrob. Agents 59, 106579. doi:10.1016/j.ijantimicag.2022.106579
Hidayat, L. K., Hsu, D. I., Quist, R., Shriner, K. A., and Wong-Beringer, A. (2006). High-dose vancomycin therapy for methicillin-resistant Staphylococcus aureus infections: Efficacy and toxicity. Arch. Intern Med. 166, 2138–2144. doi:10.1001/archinte.166.19.2138
Hohenthal, U., Hurme, S., Helenius, H., Heiro, M., Meurman, O., Nikoskelainen, J., et al. (2009). Utility of C-reactive protein in assessing the disease severity and complications of community-acquired pneumonia. Clin. Microbiol. Infect. 15, 1026–1032. doi:10.1111/j.1469-0691.2009.02856.x
Holford, N. H. (1996). A size standard for pharmacokinetics. Clin. Pharmacokinet. 30, 329–332. doi:10.2165/00003088-199630050-00001
Holford, N., Heo, Y. A., and Anderson, B. (2013). A pharmacokinetic standard for babies and adults. J. Pharm. Sci. 102, 2941–2952. doi:10.1002/jps.23574
Hughes, J. H., Tong, D. M. H., Lucas, S. S., Faldasz, J. D., Goswami, S., and Keizer, R. J. (2021). Continuous learning in model-informed precision dosing: A case study in pediatric dosing of vancomycin. Clin. Pharmacol. Ther. 109, 233–242. doi:10.1002/cpt.2088
Iacobelli, S., and Guignard, J. P. (2021). Maturation of glomerular filtration rate in neonates and infants: An overview. Pediatr. Nephrol. 36, 1439–1446. doi:10.1007/s00467-020-04632-1
Kim, D. J., Lee, D. H., Ahn, S., Jung, J., Kiem, S., Kim, S. W., et al. (2019). A new population pharmacokinetic model for vancomycin in patients with variable renal function: Therapeutic drug monitoring based on extended covariate model using CKD-EPI estimation. J. Clin. Pharm. Ther. 44, 750–759. doi:10.1111/jcpt.12995
Kim, M. N., Pai, C. H., Woo, J. H., Ryu, J. S., and Hiramatsu, K. (2000). Vancomycin-intermediate Staphylococcus aureus in Korea. J. Clin. Microbiol. 38, 3879–3881. doi:10.1128/JCM.38.10.3879-3881.2000
Kindmark, C. O. (1972). The concentration of C-reactive protein in sera from healthy individuals. Scand. J. Clin. Lab. Invest. 29, 407–411. doi:10.3109/00365517209080258
Kirst, H. A., Thompson, D. G., and Nicas, T. I. (1998). Historical yearly usage of vancomycin. Antimicrob. Agents Chemother. 42, 1303–1304. doi:10.1128/AAC.42.5.1303
Lee, S. M., Yang, S., Kang, S., and Chang, M. J. (2021). Population pharmacokinetics and dose optimization of vancomycin in neonates. Sci. Rep. 11, 6168. doi:10.1038/s41598-021-85529-3
Lelubre, C., Anselin, S., Zouaoui Boudjeltia, K., Biston, P., and Piagnerelli, M. (2013). Interpretation of C-reactive protein concentrations in critically ill patients. Biomed. Res. Int. 2013, 124021. doi:10.1155/2013/124021
Levine, D. P. (2008). Vancomycin: Understanding its past and preserving its future. South Med. J. 101, 284–291. doi:10.1097/SMJ.0b013e3181647037
Martin, J. H., Norris, R., Barras, M., Roberts, J., Morris, R., Doogue, M., et al. (2010). Therapeutic monitoring of vancomycin in adult patients: A consensus review of the American society of health-system pharmacists, the infectious diseases society of America, and the society of infectious diseases pharmacists. Clin. Biochem. Rev. 31, 21–24.
Matsumoto, K., Oda, K., Shoji, K., Hanai, Y., Takahashi, Y., Fujii, S., et al. (2022). Clinical practice guidelines for therapeutic drug monitoring of vancomycin in the framework of model-informed precision dosing: A consensus review by the Japanese society of chemotherapy and the Japanese society of therapeutic drug monitoring. Pharmaceutics 14, 489. doi:10.3390/pharmaceutics14030489
Matzke, G. R., McGory, R. W., Halstenson, C. E., and Keane, W. F. (1984). Pharmacokinetics of vancomycin in patients with various degrees of renal function. Antimicrob. Agents Chemother. 25, 433–437. doi:10.1128/AAC.25.4.433
Michels, W. M., Grootendorst, D. C., Verduijn, M., Elliott, E. G., Dekker, F. W., and Krediet, R. T. (2010). Performance of the Cockcroft-Gault, MDRD, and new CKD-EPI formulas in relation to GFR, age, and body size. Clin. J. Am. Soc. Nephrol. 5, 1003–1009. doi:10.2215/CJN.06870909
Moellering, R. C. (1984). Pharmacokinetics of vancomycin. J. Antimicrob. Chemother. 14, 43–52. Suppl D. doi:10.1093/jac/14.suppl_d.43
Munir, M. M., Rasheed, H., Khokhar, M. I., Khan, R. R., Saeed, H. A., Abbas, M., et al. (2021). Dose tailoring of vancomycin through population pharmacokinetic modeling among surgical patients in Pakistan. Front. Pharmacol. 12, 721819. doi:10.3389/fphar.2021.721819
Murray, B. E. (2000). Vancomycin-resistant enterococcal infections. N. Engl. J. Med. 342, 710–721. doi:10.1056/NEJM200003093421007
Pierrat, A., Gravier, E., Saunders, C., Caira, M. V., Ait-Djafer, Z., Legras, B., et al. (2003). Predicting GFR in children and adults: A comparison of the cockcroft-gault, Schwartz, and modification of diet in renal disease formulas. Kidney Int. 64, 1425–1436. doi:10.1046/j.1523-1755.2003.00208.x
Pritchard, L., Baker, C., Leggett, J., Sehdev, P., Brown, A., and Bayley, K. B. (2010). Increasing vancomycin serum trough concentrations and incidence of nephrotoxicity. Am. J. Med. 123, 1143–1149. doi:10.1016/j.amjmed.2010.07.025
Purwonugroho, T. A., Chulavatnatol, S., Preechagoon, Y., Chindavijak, B., Malathum, K., and Bunuparadah, P. (2012). Population pharmacokinetics of vancomycin in Thai patients. ScientificWorldJournal 2012, 762649. doi:10.1100/2012/762649
Rhee, C., Kadri, S. S., Dekker, J. P., Danner, R. L., Chen, H. C., Fram, D., et al. (2020). Prevalence of antibiotic-resistant pathogens in culture-proven sepsis and outcomes associated with inadequate and broad-spectrum empiric antibiotic use. JAMA Netw. Open 3, e202899. doi:10.1001/jamanetworkopen.2020.2899
Rhodin, M. M., Anderson, B. J., Peters, A. M., Coulthard, M. G., Wilkins, B., Cole, M., et al. (2009). Human renal function maturation: A quantitative description using weight and postmenstrual age. Pediatr. Nephrol. 24, 67–76. doi:10.1007/s00467-008-0997-5
Rybak, M. J., Le, J., Lodise, T. P., Levine, D. P., Bradley, J. S., Liu, C., et al. (2020). Therapeutic monitoring of vancomycin for serious methicillin-resistant Staphylococcus aureus infections: A revised consensus guideline and review by the American society of health-system pharmacists, the infectious diseases society of America, the pediatric infectious diseases society, and the society of infectious diseases pharmacists. Am. J. Health Syst. Pharm. 77, 835–864. doi:10.1093/ajhp/zxaa036
Rybak, M. J., Lomaestro, B. M., Rotschafer, J. C., Moellering, R. C., Craig, W. A., Billeter, M., et al. (2009b). Vancomycin therapeutic guidelines: A summary of consensus recommendations from the infectious diseases society of America, the American society of health-system pharmacists, and the society of infectious diseases pharmacists. Clin. Infect. Dis. 49, 325–327. doi:10.1086/600877
Rybak, M., Lomaestro, B., Rotschafer, J. C., Moellering, R., Craig, W., Billeter, M., et al. (2009a). Therapeutic monitoring of vancomycin in adult patients: A consensus review of the American society of health-system pharmacists, the infectious diseases society of America, and the society of infectious diseases pharmacists. Am. J. Health Syst. Pharm. 66, 82–98. doi:10.2146/ajhp080434
Schold, J. D., Navaneethan, S. D., Jolly, S. E., Poggio, E. D., Arrigain, S., Saupe, W., et al. (2011). Implications of the CKD-EPI GFR estimation equation in clinical practice. Clin. J. Am. Soc. Nephrol. 6, 497–504. doi:10.2215/CJN.04240510
Stol, K., Nijman, R. G., van Herk, W., and van Rossum, A. M. C. (2019). Biomarkers for infection in children: Current clinical practice and future perspectives. Pediatr. Infect. Dis. J. 38, S7–S13. doi:10.1097/INF.0000000000002318
Ter Heine, R., Keizer, R. J., van Steeg, K., Smolders, E. J., van Luin, M., Derijks, H. J., et al. (2020). Prospective validation of a model-informed precision dosing tool for vancomycin in intensive care patients. Br. J. Clin. Pharmacol. 86, 2497–2506. doi:10.1111/bcp.14360
Tsai, D., Jamal, J. A., Davis, J. S., Lipman, J., and Roberts, J. A. (2015). Interethnic differences in pharmacokinetics of antibacterials. Clin. Pharmacokinet. 54, 243–260. doi:10.1007/s40262-014-0209-3
Uster, D. W., Stocker, S. L., Carland, J. E., Brett, J., Marriott, D. J. E., Day, R. O., et al. (2021). A model averaging/selection approach improves the predictive performance of model-informed precision dosing: Vancomycin as a case study. Clin. Pharmacol. Ther. 109, 175–183. doi:10.1002/cpt.2065
Vigushin, D. M., Pepys, M. B., and Hawkins, P. N. (1993). Metabolic and scintigraphic studies of radioiodinated human C-reactive protein in health and disease. J. Clin. Invest. 91, 1351–1357. doi:10.1172/JCI116336
Vu, D. H., Nguyen, D. A., Delattre, I. K., Ho, T. T., Do, H. G., Pham, H. N., et al. (2019). Determination of optimal loading and maintenance doses for continuous infusion of vancomycin in critically ill patients: Population pharmacokinetic modelling and simulations for improved dosing schemes. Int. J. Antimicrob. Agents 54, 702–708. doi:10.1016/j.ijantimicag.2019.09.018
Wei, S., Zhang, D., Zhao, Z., and Mei, S. (2022). Population pharmacokinetic model of vancomycin in postoperative neurosurgical patients. Front. Pharmacol. 13, 1005791. doi:10.3389/fphar.2022.1005791
Yamamoto, M., Kuzuya, T., Baba, H., Yamada, K., and Nabeshima, T. (2009). Population pharmacokinetic analysis of vancomycin in patients with gram-positive infections and the influence of infectious disease type. J. Clin. Pharm. Ther. 34, 473–483. doi:10.1111/j.1365-2710.2008.01016.x
Keywords: vancomycin, pharmacokinetic, pharmacodynamic, NONMEM, C-reactive protein, model-informed precision dosing, optimal dose, R shiny
Citation: Yoon S, Guk J, Lee S-G, Chae D, Kim J-H and Park K (2023) Model-informed precision dosing in vancomycin treatment. Front. Pharmacol. 14:1252757. doi: 10.3389/fphar.2023.1252757
Received: 04 July 2023; Accepted: 11 September 2023;
Published: 09 October 2023.
Edited by:
Joana Alves, Braga Hospital, PortugalReviewed by:
Muhammad Usman, University of Veterinary and Animal Sciences, PakistanBetânia Abreu Faria, Braga Hospital, Portugal
Copyright © 2023 Yoon, Guk, Lee, Chae, Kim and Park. This is an open-access article distributed under the terms of the Creative Commons Attribution License (CC BY). The use, distribution or reproduction in other forums is permitted, provided the original author(s) and the copyright owner(s) are credited and that the original publication in this journal is cited, in accordance with accepted academic practice. No use, distribution or reproduction is permitted which does not comply with these terms.
*Correspondence: Kyungsoo Park, a3NwYXJrQHl1aHMuYWM=
†These authors have contributed equally to this work