 Yufeng Huang
 Mengxian Wang1,2†
 Fan He
- 1Guangdong Provincial Hospital of Chinese Medicine, The Second Affiliated Hospital of Guangzhou University of Chinese Medicine, Guangzhou, Guangdong, China
- 2College of Chinese Medicine, Guangzhou University of Chinese Medicine, Guangzhou, Guangdong, China
- 3Affiliated Hospital of Liaoning University of Traditional Chinese Medicine, Shenyang, Liaoning, China
Background: Prostaglandins play a vital role as crucial metabolites and inflammatory indicators within the arachidonic acid (AA) metabolic pathway. Conventional assays typically focus on a single inflammatory indicator, while multi-index detection entails a large number of samples.
Methods: In this study, an ultra-high-performance liquid chromatography coupled with triple quadrupole mass spectrometry (UHPLC-QQQ-MS/MS) method was newly developed for simultaneous quantitative analysis of nine AA metabolites, including prostaglandin F2β (PGF2β), prostaglandin E2 (PGE2), prostaglandin E1 (PGE1), prostaglandin D1 (PGD1), prostaglandin D2 (PGD2), prostaglandin A2 (PGA2), prostaglandin J2 (PGJ2), prostaglandin B2 (PGB2), and prostaglandin A1 (PGA1), in the supernatant of LPS-induced RAW264.7 cells and the serum samples of adjuvant-induced arthritis (AIA) rats.
Results: The newly established UHPLC-QQQ-MS/MS method successfully and rapidly quantified the contents of the nine prostaglandins simultaneously. The methodology was validated. The levels of PGE2, PGD1, PGD2, PGA2, and PGJ2 in the LPS-induced RAW264.7 cells group were higher than those in blank group. At the same time, the levels of these PGs decreased significantly (p < 0.01 vs. LPS-induced group) after the positive drug (dexamethasone) intervention. On the 14th day of AIA modeling, the paw volume of the AIA rats was significantly enlarged (p < 0.01 vs. blank group), and the serum samples from the AIA group showed significantly increased levels of PGE2, PGD2, and PGA2 (p < 0.01 vs. blank group), suggesting the emergence of arthritis. The levels of other prostaglandins were below the limit of quantification.
Conclusion: The method established in this study for determining nine prostaglandins in the AA metabolic pathway with UHPLC-QQQ-MS/MS embodied the advantages of requiring a low amount of sample, a simple pretreatment process, and the rapid and efficient simultaneous quantification of multiple inflammatory factors. It provided a novel assay method for the pharmacological study of the AA metabolic pathway.
1 Introduction
Prostaglandins (PGs) represent a class of lipid compounds within the arachidonic acid (AA) metabolic pathway, possessing diverse bioactivities. They are intricately involved in crucial processes such as inflammation, pain transmission, and immune regulation, and they play an indispensable role in the pathophysiological mechanisms of numerous diseases, including arthritis, cardiovascular disease, and tumors (Zhang et al., 2020). As depicted in Figure 1, AA, under the catalytic action of cyclooxygenases (COXs), is converted into the intermediate metabolites prostaglandin G2 (PGG2) and prostaglandin H2 (PGH2). Subsequently, these intermediates are rapidly metabolized by distinct downstream prostaglandin synthases, giving rise to a plethora of pro-inflammatory active PGs, such as prostaglandin E2 (PGE2), prostaglandin D2 (PGD2), prostaglandin F2α (PGF2α), and prostaglandin I2 (PGI2) (Wang et al., 2021). Conversely, certain PGs, namely, prostaglandin F2β (PGF2β), prostaglandin E1 (PGE1), prostaglandin D1 (PGD1), and prostaglandin A1 (PGA1), can interact with and modulate the activity of specific proteins, thereby exerting an anti-inflammatory effect (Code et al., 2021; Amagai et al., 2015).
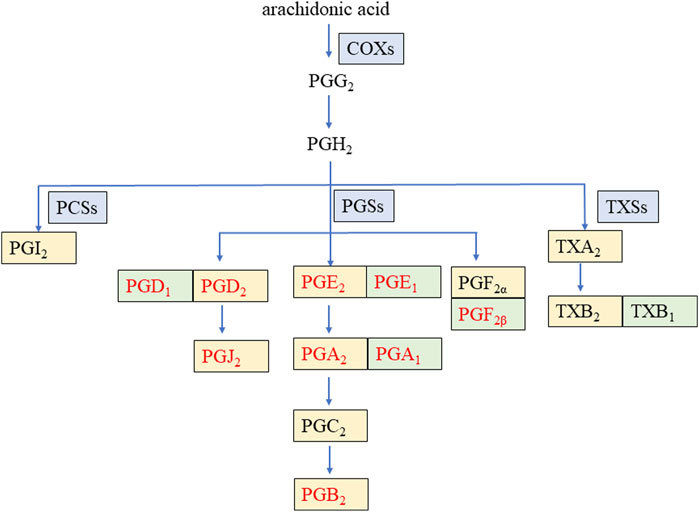
Figure 1. Arachidonic acid metabolic pathway of some prostaglandins during inflammation. COXs: cyclooxygenases, PCSs: prostacyclin synthetases, PGSs: prostaglandin synthetases, TXSs: thromboxane synthases, PG: prostaglandin, TX: thromboxane. The enzyme is on a blue background. The pro-inflammatory factor is on a yellow background. The anti-inflammatory factor is on a green background. The nine PGs detected in this study are in red font.
Currently, in pharmacological research, the detection of pro- and anti-inflammatory factors, such as PGs in the AA metabolic pathway, is predominantly performed by enzyme-linked immunosorbent assay (ELISA), real-time polymerase chain reaction (RT-PCR), and Western blot (WB). Nevertheless, these assays are capable of only detecting one index at a time, with low detection efficiency, high detection cost, and high technical requirements for operators (Yu et al., 2024). The liquid phase combined mass spectrometry (LC-MS) technique serves as a primary tool that is frequently employed in metabolomics to detect endogenous compounds, which has the advantages of high sensitivity, short analysis time, and assay automation (Yang et al., 2023; Wang Y. et al., 2023). It has been reported that the LC-MS methods quantitatively determined the AA and PGE2 in human plasma (Gachet et al., 2015) and PGE2 in acute spinal cord injury samples of rats (Pang et al., 2022), respectively. However, the existing reported LC-MS methods detect only 1–2 metabolites in the AA pathway at a time, which neither comprehensively reflects the changes of most PG metabolites in the metabolic pathway nor utilizes the advantage of LC-MS that can simultaneously determine multiple target components.
Therefore, in this study, a novel, rapid, and sensitive ultra-high-performance liquid chromatography coupled with triple quadrupole mass spectrometry (UHPLC-QQQ-MS/MS) method was developed. This method enabled the simultaneous and successful detection of the contents of nine PGs in samples. In addition, the newly established LC-MS method was applied to preliminarily explore the variation patterns of these nine PGs in two models: the lipopolysaccharide (LPS)-induced RAW264.7 cell model, which is a classical in vitro inflammation model, and the rat adjuvant-induced arthritis (AIA) model, a representative in vivo inflammation model. The developed method offers several advantages, including a low sample requirement, simple sample pretreatment procedures, and the ability to rapidly and efficiently perform simultaneous quantification of multiple PGs. Thus, it provides a novel analytical approach for efficiently investigating the alterations in the metabolite content within the AA metabolic pathway during the inflammation process.
2 Materials and methods
2.1 Chemicals and reagents
Reference compounds, each with a purity of ≥98%, including PGF2β, PGE2, PGE1, PGD1, PGD2, PGA2, PGJ2, PGB2, PGA1, and PGA2-D4 (which served as an internal standard substance, IS), were purchased from Cayman Chemical Company (United States). HPLC-graded formic acid, acetonitrile, and methanol were purchased from Macklin (China), AQA (United States), and Fisher Scientific (United States), respectively. Ultrapure water was generated by a water purification system (RODI-220A1, RSJ, China). Dulbecco’s Modified Eagle Medium (DMEM), fetal bovine serum, and phosphate-buffered saline (PBS) were all purchased from Gibco (United States). LPS was purchased from Sigma-Aldrich (United States). Complete Freund’s adjuvant (CFA) and inactivated mycobacterium tuberculosis (Mtb) were acquired from BD (United States). Mineral oil was bought from Sigma-Aldrich (United States).
2.2 Experimental instrumentation and LC-MS conditions
First, an ultra-high-performance liquid chromatography Agilent 1290 system integrated with Agilent 6495C triple quadrupole mass spectrometer (UHPLC-QQQ-MS/MS, Agilent Technologies, Santa Clara, United States) was employed for mass spectrometry optimization of the nine reference compounds and IS. Subsequently, quantitative detection was carried out.
The analytes in the mixed reference solution and test sample solutions were chromatographically retained on a Waters ACQUITY UPLC HSS T3 column (1.8 μm, 2.1 mm × 100 mm, Waters, Milford, United States). The mobile phases consisted of 0.1% formic acid–water (A) and acetonitrile (B), with a gradient elution program as follows: from 0 to 3 min, the proportion of B was maintained at 40%, and from 3.01 to 8 min, the proportion of B was increased from 40% to 80%. An aliquot of 5 μL of the sample was injected for analysis, and the flow rate was set at 0.30 mL/min.
In the negative ion mode, the multi-reaction monitor (MRM) mode, in combination with an electrospray ionization (ESI) source, was utilized to detect the nine metabolites. The other parameters were as follows: the flow rate of dry gas (N2) was 11.0 L/min, the dry gas temperature was 300°C, the nebulizer was 15 psig, and the capillary voltage was 4,000 V.
2.3 Cells and animals
2.3.1 Establishment of LPS-induced RAW264.7 cells
RAW264.7 cells were purchased from Starfish Biologicals (China). Cell modeling and grouping were carried out according to previous reports in our laboratory (Guo et al., 2023). Briefly, cells in the logarithmic growth phase were laid in 12-well plates, 1.5 × 10⁵/well, and the blank group, model group (100 ng/mL LPS), and positive drug group (0.5 μM dexamethasone, DEX) were set up, with three replicate wells in each group. After the cells were adhered to the wall, the positive drug group was pre-administered with LPS for 1 h before stimulation. The cells were incubated at 37°C with a 5% CO2 incubator, and the cell supernatant of each group was collected for the next experiment after 24 h of incubation. PBS was added to each group of cells for microphotography to determine whether the modeling was successful.
2.3.2 Establishment of the AIA model in rats
A total of 12 male Sprague-Dawley (SD) rats (180 g–220 g) were purchased from Guangdong Province Viton Lihua Laboratory Animal Technology Co., Ltd. The rats were housed in the specific pathogen-free (SPF) Animal Laboratory of Guangdong Provincial Hospital of Chinese Medicine at an ambient temperature of 23°C–25°C, relative humidity of 45%–70%, and 12 h/12 h day/night alternation, with free access to food and water. The Ethics Committee of the Guangdong Provincial Hospital of Chinese Medicine evaluated the animal experiments with ethics No. 2023124.
Six healthy male SD rats were randomly selected for AIA modeling. Rats were immunized by subcutaneous injection at the base of the tail with CFA mixed with Mtb according to the method described by our lab previously (Pan et al., 2019). The six remaining rats were used as a blank group. The blank group was injected with an equal dose of sterile PBS. On the seventh day after the initial immunization, the above procedure was repeated by injecting 0.15 mL of CFA into the root of the rats’ tails. On the 14th day, the modeling of the rat AIA model was completed.
A digital water plethysmometer (LE7500, Panlab, Spain) was used to measure the swelling volume of the hind paws before and after modeling in rats to evaluate whether the modeling was successful.
2.4 Sample pretreatment and methodology
2.4.1 Configuration of the standard solutions
An appropriate amount of PGF2β, PGE2, PGE1, PGD1, PGD2, PGA1, PGA2, PGJ2, and PGB2 was precisely weighed as reference compounds, respectively, and a single reference stock solution with methanol was prepared. Then, a mixed reference solution was formed with the appropriate amount of each single reference stock solution. The content of PGF2β, PGE2, PGE1, PGD1, PGD2, PGA1, PGA2, PGJ2, and PGB2 in the mixed reference solution was 1.07, 1.11, 0.550, 0.400, 1.12, 0.369, 0.100, 0.150, and 0.200 μg/mL, respectively.
2.4.2 Configuration of the internal standard solution
An appropriate amount of PGA2-D4 was taken, methanol was added to form a reserve solution of 0.1 mg/mL, and it was stored at 4°C. Before use, methanol was diluted to 0.1 μg/mL as the internal standard working solution.
2.4.3 Pretreatment of the cell supernatant samples
First, 200 μL of the cell supernatant was pipetted into a 1.5 mL EP tube. Then, 50 μL of PGA2-D4 and 800 μL of acetonitrile were added to the cell supernatant, and the mixture was thoroughly vortex-mixed to ensure homogeneity. Subsequently, the resulting mixture was centrifuged at 4°C at a rotational speed of 14,000 rpm for 10 min. After centrifugation, the supernatant was carefully collected. The collected supernatant was then dried using a nitrogen blower. Following the drying step, the residue was re-dissolved in 100 μL of methanol. Finally, this methanol-based solution was centrifuged again at 4°C at 14,000 rpm for 10 min, and the supernatant obtained was taken for LC-MS determination.
2.4.4 Pretreatment of rat serum samples
On the second day following successful model establishment, the rat blood sample was taken from the abdominal aorta after anesthesia into a 1.5 mL EP tube. The blood was centrifuged at 3,500 rpm for 10 min at 4°C as soon as possible. The supernatant obtained from the centrifugation was carefully collected and reserved for the subsequent experiment. A 200-μL aliquot of the rat serum was then pipetted, and the subsequent preparation process was identical to that described in sections 4.3 and 2.4.3.
2.4.5 Method validation
The LC-MS method validation of the cell supernatant and rat serum samples was conducted according to the bioanalytical method validation guidelines from the US Food and Drug Administration (US Food and Drug Administration, 2018). Method validation was well-studied, including specificity, linearity, precision, recovery, and stability.
2.5 Data analysis
LC-MS data analysis was carried out using MassHunter Workstation software Quantitative Analysis (Agilent Technologies, Santa Clara, United States). The sample concentrations were evaluated via linear regression analysis. Images and data were counted and processed using GraphPad Prism 10.0 software (GraphPad Software, Boston, United States). P < 0.05 was considered a statistically significant difference. All data are expressed as the mean ± standard deviation.
3 Results
3.1 LPS-induced RAW264.7 cells model
LPS-induced RAW cells successfully constructed an in vitro inflammatory model, as judged by the morphology of cell appearance. Microscopic observation showed that RAW264.7 cells were round in the normal state, with smooth cell edges without pseudopods and no vacuoles in the cytoplasm (Figure 2A). After 24 h of LPS stimulation, the surface area of the cells became larger, pseudopods were protruded, and intracytoplasmic vacuoles increased (Figure 2B). The administration of DEX as a positive drug protected the stimulation of the cells (Figure 2C).
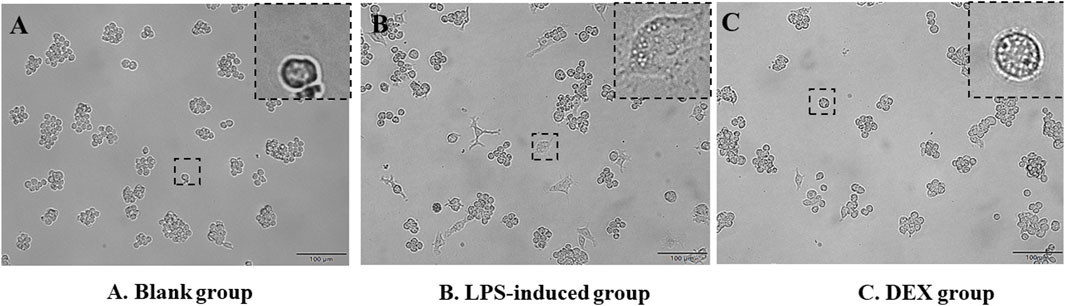
Figure 2. Morphology of RAW264.7 cells’ appearance. (A) RAW264.7 cells as a blank group. (B) LPS-induced RAW264.7 cells as a LPS-induced group. (C) Dexamethasone-pretreated LPS-induced RAW264.7 cells as a DEX group.
3.2 AIA rat model
The results of apparent observation showed that the AIA rat modeling was successful. Since day 7 of modeling, redness and swelling began to appear in the foot extremities of rats in the model group. With the progression of the disease, the redness and swelling gradually expanded after the second booster immunization. The hind paws of the model group (Figure 3B) exhibited apparent redness and swelling, consisting of the characteristics of active arthritis compared with the blank group (Figure 3A). The paw volume of rats in each group was measured by drainage method on day 0, day 7, and day 14. Figure 3C shows that the paw volume in the AIA group was significantly higher than that in the blank group on day 7 and day 14 (p < 0.01).
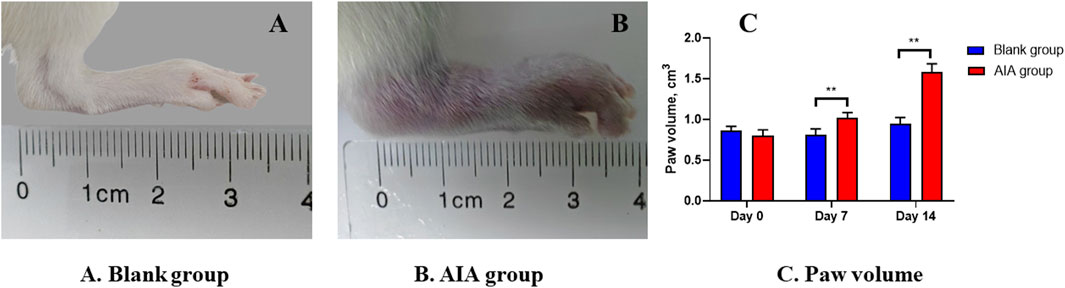
Figure 3. Changes of apparent observation and paw volume of AIA rat modeling. (A) Blank group: the healthy rat did not show hind paw swelling. (B) AIA group: the hind paw of the model rat was obviously red and swollen. (C) Paw volume: on the seventh and 14th day of modeling, the volume of the hind paw in the AIA group was significantly enlarged. Paired t-tests were used for statistical analyses. **P < 0.01, vs. blank group, n = 6.
3.3 Method validation
3.3.1 Method specificity
Under the selected chromatographic conditions in Section 2.2 and Table 1, the target metabolites and IS contained in the biological samples can be entirely separated, with symmetrical peak shapes and no interference from endogenous substances and sample matrix (Supplementary Figures S1, S2).
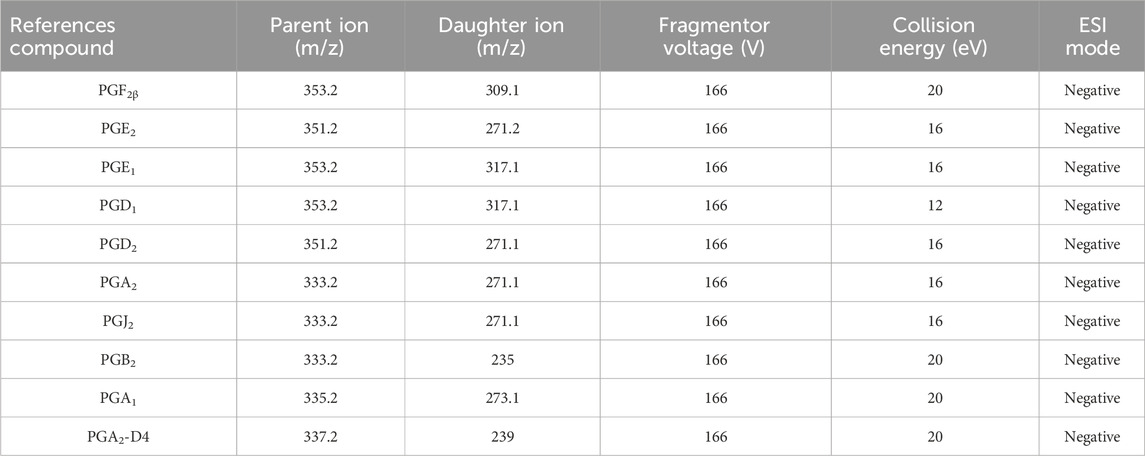
Table 1. Ion optimization conditions of the reference compounds.
3.3.2 Linearity
The linear calibration curves were obtained in the given concentration range of each PGs in samples, respectively. The standard curves were fitted to a first-degree polynomial, Y = aX + b, where Y was the peak area of PG/IS, a and b were constants, and X was the concentration (ng/mL) of the corresponding PG.
The results exhibited good linearity (r > 0.9930) of metabolites in linear ranges. Table 2 shows the linear calibration curve with correlation coefficients (r), linear ranges, the lower limit of detection (LOD), and the lower limit of quantitation (LOQ) of nine PGs both in the cell supernatant and rat serum. The signal of each analyte achieved a signal-to-noise ratio of 3 as its LOD and 10 as LOQ. The nanogram-graded LODs and LOQs indicated the machine’s high sensitivity.
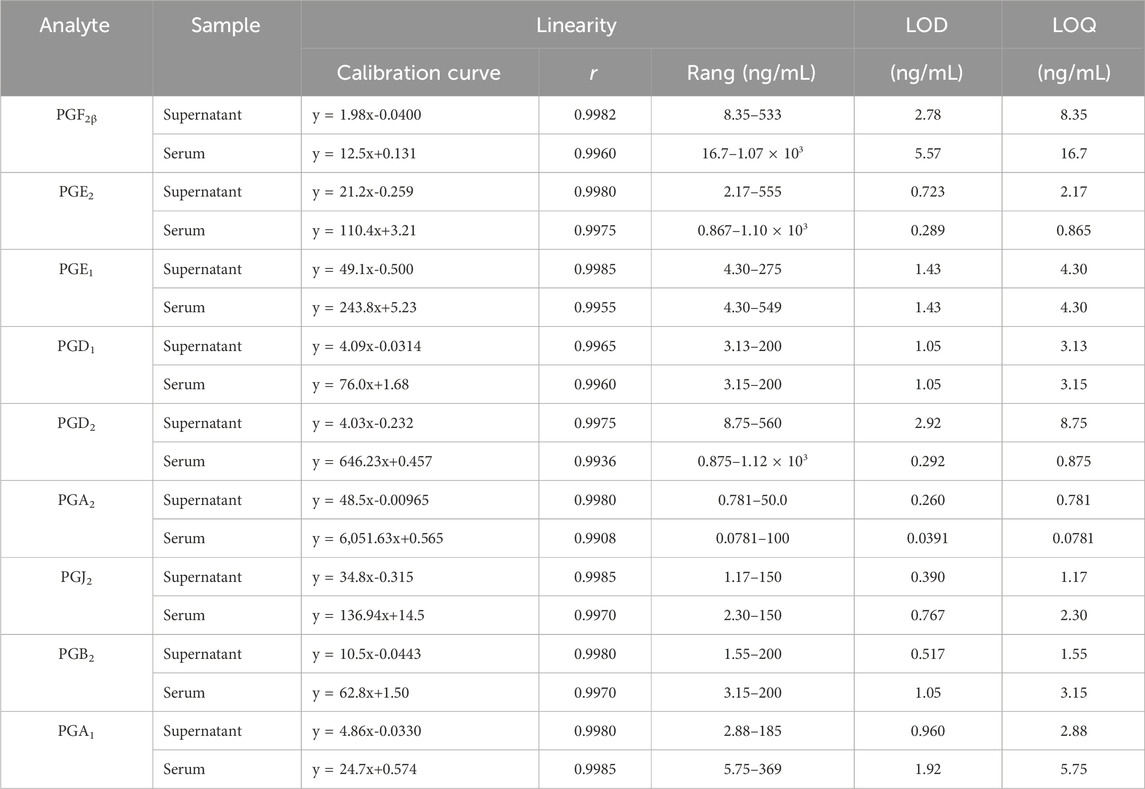
Table 2. Linearity, LODs, and LOQs of the nine prostaglandins (PGs).
3.3.3 Precision and recovery
Precision and recovery investigations were performed to test the same sample at high, medium, and low concentrations. Their corresponding relative standard deviations (RSDs %) of intraday precision and interday precision were less than 15% (Table 3), and the recovery range was between 85% and 105% with RSDs of less than 15% (Table 3). These results indicated that the instrument met the criteria for biological sample analysis.
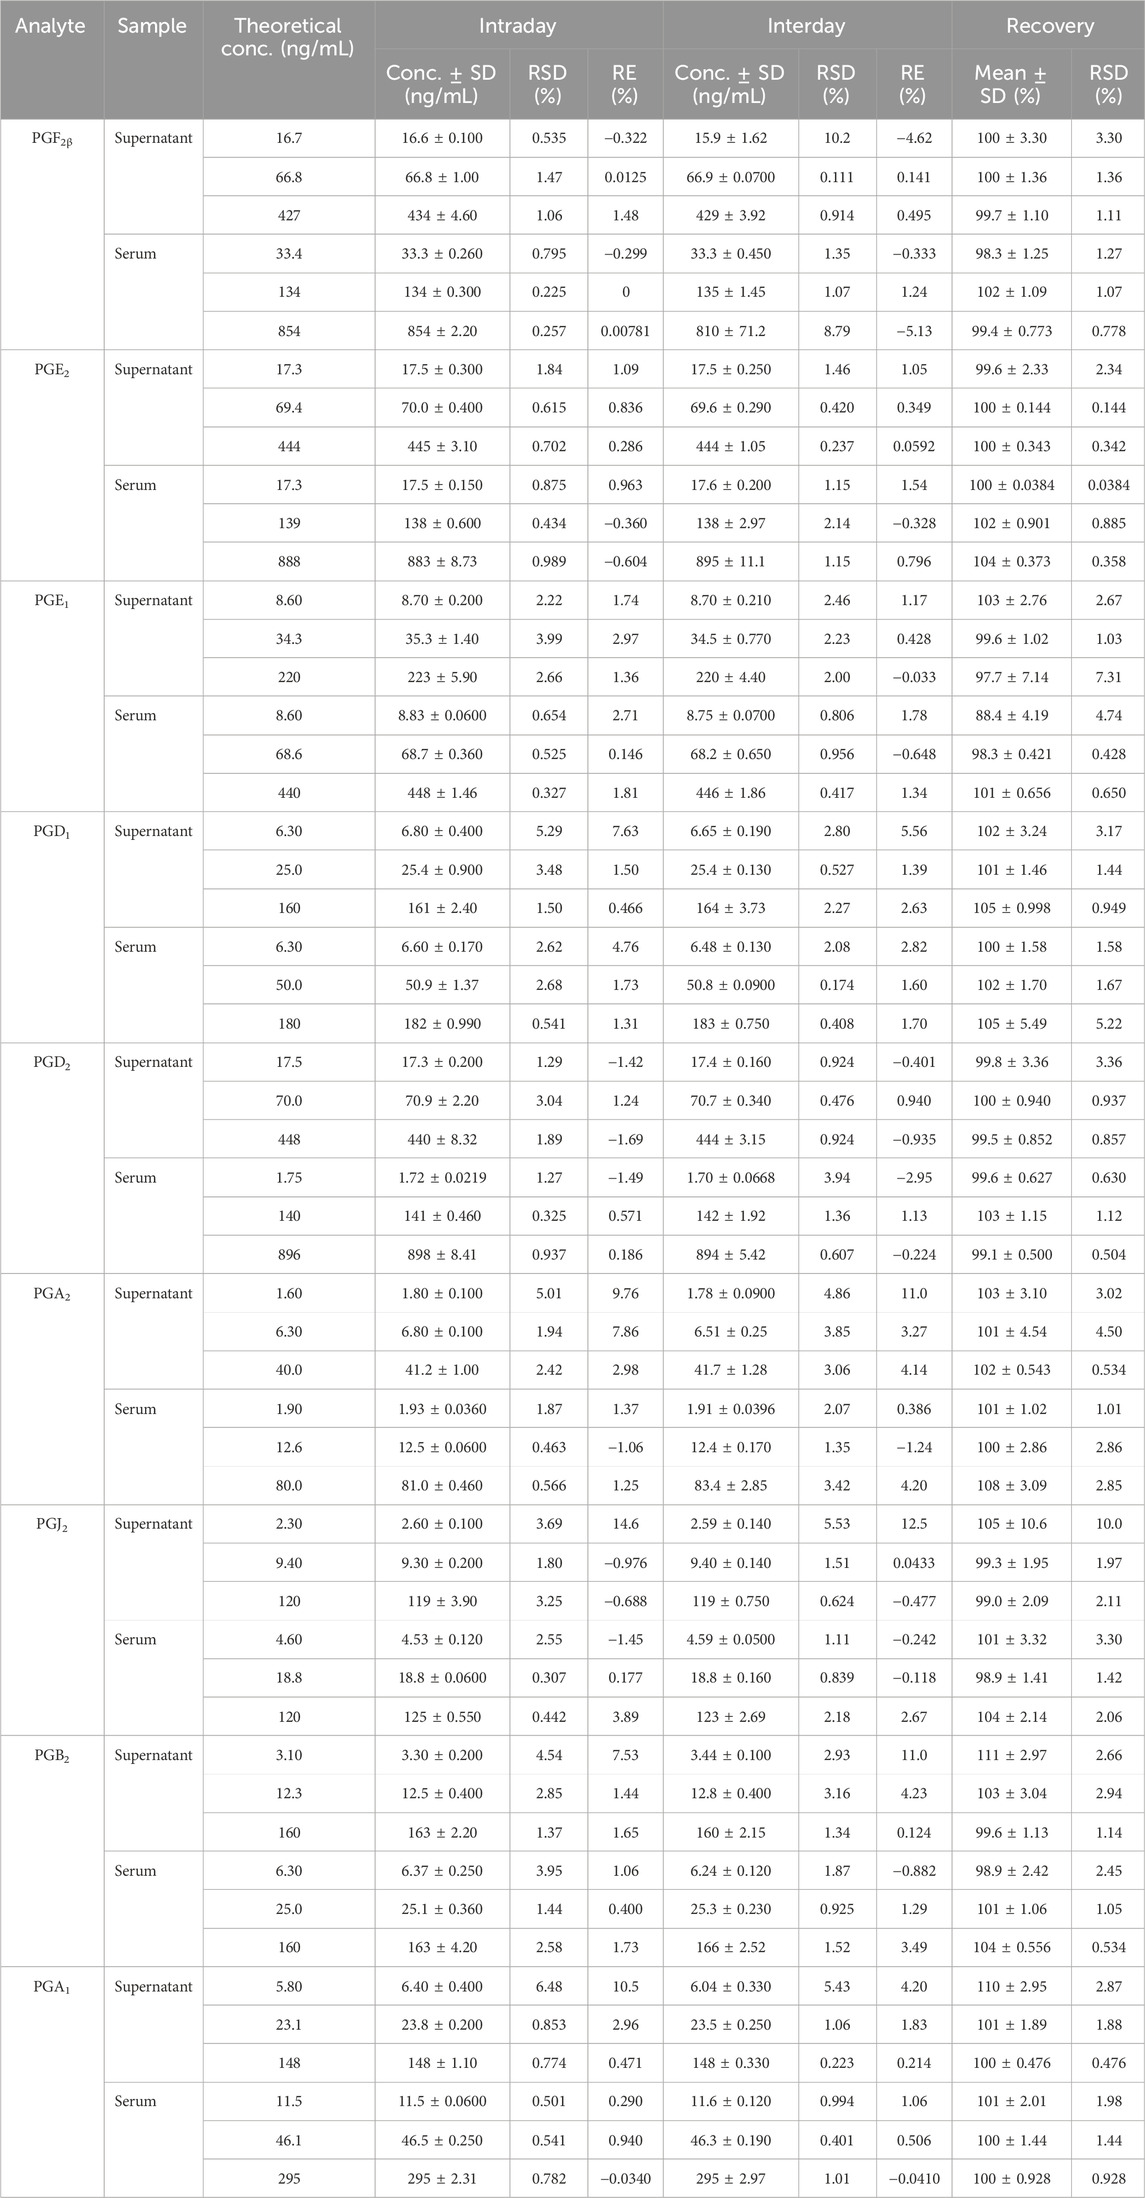
Table 3. Intraday precision, interday precision, and recovery of the nine prostaglandins (PGs).
3.3.4 Stability
The results indicated that biological samples were stable enough for quantitative determination at room temperature, at −20°C, or freeze–thaw cycles. Table 4 shows the RSD results of the nine PGs’ stability, which were less than 15% in the cell supernatant and rat serum samples with high, medium, and low concentrations, respectively.
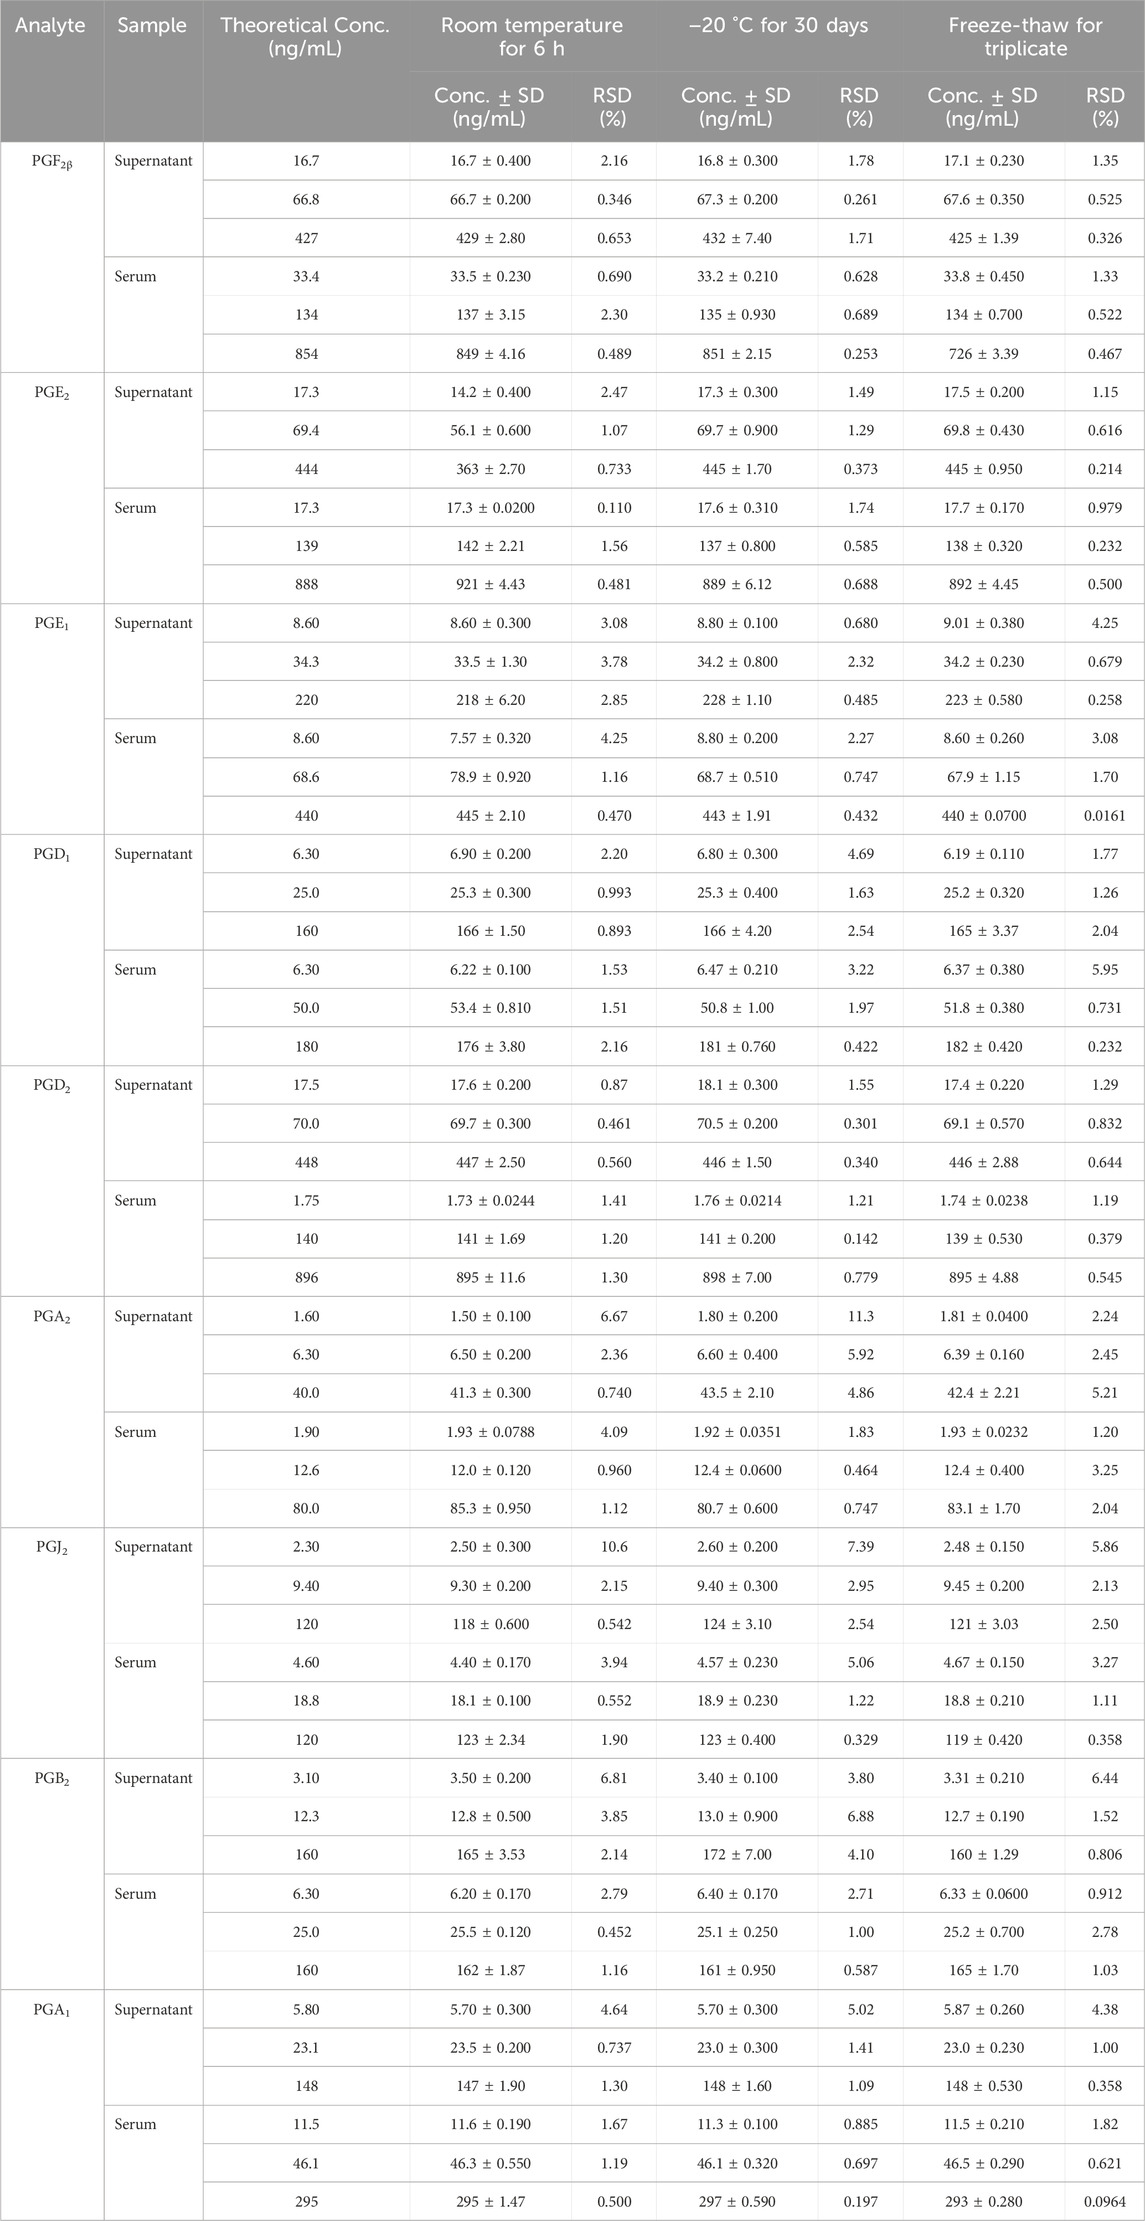
Table 4. Stability of the nine prostaglandins (PGs).
3.4 Contents of PGs in samples
In this study, a novel UHPLC-QQQ-MS/MS method was well-established for the simultaneous quantification of nine PGs in cell supernatant samples and rat serum samples. Figure 4 shows that the levels of PGE2 (2.50 ± 0.253 ng/mL), PGD1 (10.2 ± 0.869 ng/mL), PGD2 (46.7 ± 3.73 ng/mL), PGA2 (0.778 ± 0.0512 ng/mL), and PGJ2 (21.5 ± 1.74 ng/mL) in RAW264.7 cell supernatants were increased after LPS stimulation. At the same time, these levels were significantly decreased by the treatment with an anti-inflammatory drug (p < 0.01). Meanwhile, the PGF2β, PGE1, PGB2, and PGA1 levels in RAW 264.7 cell supernatants were lower than LOQs.
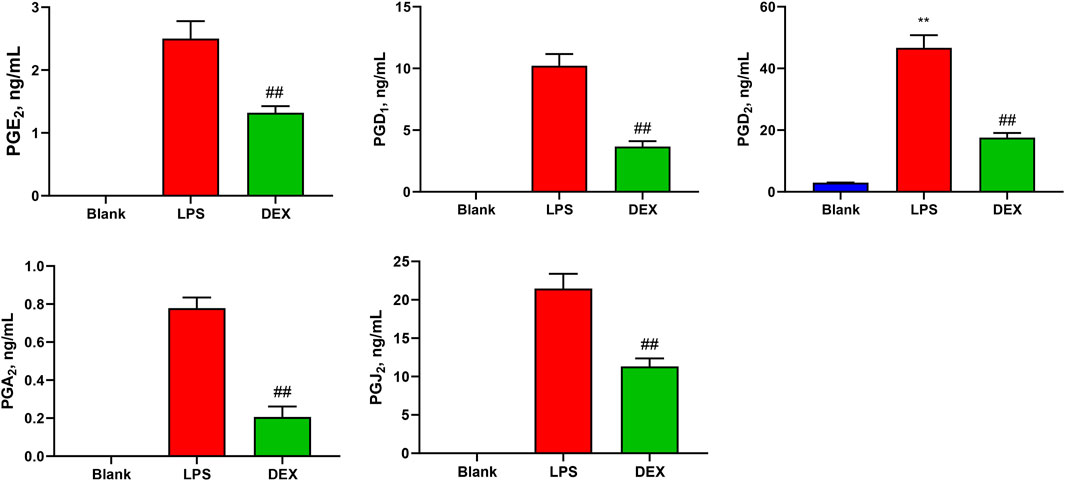
Figure 4. Levels of prostaglandins (PGs) in the samples of cell supernatant. The levels of PGE2, PGD1, PGD2, PGA2, and PGJ2 in RAW264.7 cell supernatants were increased after LPS stimulation, while these levels were significantly decreased after the intervention of the positive drug (dexamethasone). Paired t-tests were used for statistical analyses. ##P < 0.01, vs. LPS group, n = 6.
In addition, Figure 5 shows that the levels of PGE2 (201 ± 66.0 ng/mL), and its metabolite PGA2 (0.345 ± 0.0758 ng/mL), and PGD2 (6.78 ± 3.16 ng/mL) were significantly increased in the serum of AIA rats (p < 0.01). The levels of other PGs were less than those of LOQs in the rat serum.
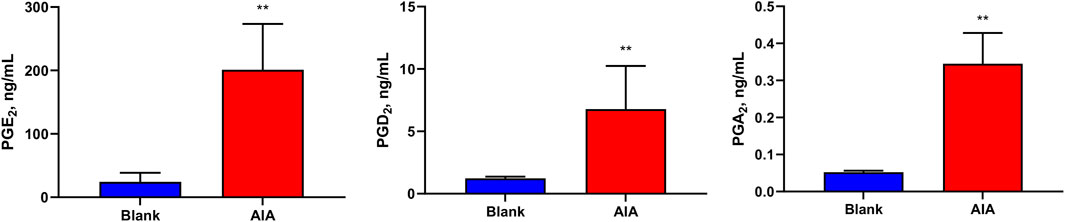
Figure 5. Levels of prostaglandins (PGs) in the samples of rat serum. The levels of PGE2, PGA2, and PGD2 were significantly increased in the serum of AIA rats. Paired t-tests were used for statistical analyses. **P < 0.01, vs. blank group, n = 6.
4 Discussion
In this study, we established an LC-MS method capable of simultaneously determining nine PGs with nanogram-graded sensitivity and successfully applied this method to the classical in vivo and in vitro inflammation models. The advantage of this method lies in its ability to rapidly determine the contents of nine PGs within 8 min simultaneously, which exhibits higher detection efficiency than conventional ELISA and WB methods that take hours.
As all know, RAW264.7 macrophages are commonly utilized as an inflammatory model in vitro. PG activation plays a vital role in the occurrence and development of inflammation and immune response (Yao and Narumiya, 2019; Maseda et al., 2019). cPLA2 expression is increased by LPS in RAW cells, producing AA, which is then converted into PGs through the COXs metabolic pathway (Pan et al., 2022; Zhang et al., 2023). The results of the LC-MS method established in this study showed that PGs were lowly expressed in normal RAW264.7 cells. The PGE2, PGD2, PGA2, and PGJ2 expression was significantly elevated in the cells after LPS induction, which induced inflammatory responses. In contrast, the positive drug (DEX) reduced the levels of these PGs and exerted anti-inflammatory effects. The above results mainly agree with the trend of results reported by conventional ELISA kit assays (Zhou et al., 2021; Baris et al., 2024) and previous studies by UPLC-MS/MS (Wang D. et al., 2023). Interestingly, anti-inflammatory PGs, except PGD1 in vitro, were not detected in both in vivo and in vitro experiments, while pro-inflammatory PGs were decreased in the positive drug group. It is speculated to be related to the anti-inflammatory mechanism of DEX. This is because DEX directly inhibits the activity of upstream COXs and reduces the production of pro-inflammatory PGs rather than interfering with the level of downstream anti-inflammatory PGs (Park et al., 2023).
AIA is a classic model of rheumatoid arthritis (RA), which is characterized by inflammatory cell infiltration and joint bone damage. The AIA model simulates the pathological changes of arthritis mediated by exogenous factors. Due to the structural similarity between a protein molecule of Mycobacterium tuberculosis and a glycoprotein molecule on the synovial membrane of joints, it can be recognized by T-cells, thereby inducing an immune response against joints (Nakamachi et al., 2016; Hegen et al., 2008). An increasing amount of evidence indicates that the inflammation in RA is associated with the release of PGs. PGD2 (Malik et al., 2023), PGE2 (Ballerini et al., 2022), and PGB2 (Carnovale et al., 2022) play a role in promoting inflammatory cell infiltration, synovial hyperplasia, and angiogenesis by regulating the differentiation and maturation of immune cells and the production of cytokines, thereby exacerbating the inflammatory response within the joints. Second, PGE2 (Pujol and Loyau, 1987) and PGA2 (Ohmura et al., 2017) can also be involved in the degradation of articular cartilage and bone resorption processes, which consequently lead to bone destruction in the joints. Furthermore, PGF2β (Quinteiro et al., 2012), PGJ2 (Calder, 2020), and PGE2 (Globig et al., 2025) serve as significant mediators in the regulation of joint pain. Conversely, PGE1 (Braune et al., 2020), PGD1 (Maher et al., 2015), and PGA1 (Lee et al., 2021) reduces inflammation by inhibiting platelet aggregation, neutrophil activation, and the NF-κB pathway.
This study revealed that the levels of PGD2 and PGE2 and its metabolites PGA2 in the serum of AIA rat models were significantly elevated. The increases in the PGs levels contributed to the aggravation of vascular dilation and edema in the model group (Kondeti et al., 2016), which manifested as the paw swelling. This demonstrated that AIA successfully induced arthritis in rats. Moreover, it indicates that the LC-MS method established in this study can effectively detect inflammatory indicators in AIA-induced arthritis rats.
Moreover, the expression levels of different PGs can also reflect the different stages of inflammation. For example, AA is converted into different PGs, from PGE2 in the acute phase to PGD2 in the regression phase (Liu et al., 2023; Montrose et al., 2015). The upregulation of PGE2 accelerated the development of arthritis (Lee et al., 2020), while an increased PGD2 indicates that the inflammation has entered a resolution phase (Kapoor et al., 2007). The phenomenon of elevated PGE2 and PGD2 simultaneously appeared in the model rats, which requires kinetic analysis of PGs in the AIA model to be explored.
Finally, due to the cost and time limitation, this study has some shortcomings, one of which was the failure to use the ELISA method for parallel detection of samples. The results of comparison between the two methods can further support the conclusion of this study. We also did not measure the contents of PGG2, PGH2, PGF2α, and PGC2 in the AA pathway due to the lack of the corresponding reference compounds. Compared with the traditional ELISA, the UHPLC-QQQ-MS/MS method has certain acknowledged limitations, such as in terms of sensitivity. Detecting low-abundance PGs also poses a challenge for the LC-MS method. As a result, PGs in some groups in this experiment could not be detected by this method.
5 Conclusion
In this study, a novel LC-MS method for the simultaneous determination of nine PGs was successfully established, which can quickly and sensitively achieve the concentration of PGs in biological samples within a wide detection range, high specificity and accuracy, and low sample demand. The method has been verified by in vitro and in vivo inflammatory model samples and can provide a new tool for detecting PGs in the AA metabolic pathway.
Data availability statement
The original contributions presented in the study are included in the article/Supplementary Material; further inquiries can be directed to the corresponding author.
Ethics statement
The animal study was approved by the Ethics Committee of the Guangdong Provincial Hospital of Chinese Medicine. The study was conducted in accordance with the local legislation and institutional requirements.
Author contributions
YH: supervision, project administration, investigation, writing – original draft, and funding acquisition. MW: writing – original draft, validation, and data curation. ZY: methodology, formal analysis, and writing – review and editing. XiaW: writing – review and editing, funding acquisition, and conceptualization. XinW: validation, data curation, and writing – review and editing. FH: project administration, writing – review and editing, supervision, and funding acquisition.
Funding
The author(s) declare that financial support was received for the research and/or publication of this article. This project was funded by the National Natural Science Foundation of China (82374139), the Guangdong Provincial Bureau of Traditional Chinese Medicine Research Project (20232037 and 20241149), and Liaoning Province Science and Technology Plan Joint Project (Applied Basic Research Project) (2023JH2/101700219).
Acknowledgments
The authors thank the academician Liu Liang for his support and assistance to the research platform and research work.
Conflict of interest
The authors declare that the research was conducted in the absence of any commercial or financial relationships that could be construed as a potential conflict of interest.
Generative AI statement
The author(s) declare that no Generative AI was used in the creation of this manuscript.
Publisher’s note
All claims expressed in this article are solely those of the authors and do not necessarily represent those of their affiliated organizations, or those of the publisher, the editors and the reviewers. Any product that may be evaluated in this article, or claim that may be made by its manufacturer, is not guaranteed or endorsed by the publisher.
Supplementary material
The Supplementary Material for this article can be found online at: https://www.frontiersin.org/articles/10.3389/fphar.2025.1595059/full#supplementary-material
References
Amagai, Y., Oida, K., Matsuda, A., Jung, K., Kakutani, S., Tanaka, T., et al. (2015). Dihomo-γ-linolenic acid prevents the development of atopic dermatitis through prostaglandin D1 production in NC/Tnd mice. J. Dermatol Sci. 79, 30–37. doi:10.1016/j.jdermsci.2015.03.010
Ballerini, P., Contursi, A., Bruno, A., Mucci, M., Tacconelli, S., and Patrignani, P. (2022). Inflammation and cancer: from the development of personalized indicators to novel therapeutic strategies. Front. Pharmacol. 13, 838079. doi:10.3389/fphar.2022.838079
Baris, E., Arici, M. A., and Tosun, M. (2024). Nicotinic acetylcholine receptor-mediated effects of varenicline on LPS-elevated prostaglandin and cyclooxygenase levels in RAW 264.7 macrophages. Front. Mol. Biosci. 11, 1392689. doi:10.3389/fmolb.2024.1392689
Braune, S., Küpper, J. H., and Jung, F. (2020). Effect of prostanoids on human platelet function: an overview. Int. J. Mol. Sci. 21, 9020. doi:10.3390/ijms21239020
Carnovale, V., Castaldo, A., Di Minno, A., Gelzo, M., Iacotucci, P., Illiano, A., et al. (2022). Oxylipin profile in saliva from patients with cystic fibrosis reveals a balance between pro-resolving and pro-inflammatory molecules. Sci. Rep. 12, 5838. doi:10.1038/s41598-022-09618-7
Code, C., Ebbesen, M. F., Sood, R., and Kinnunen, P. K. J. (2021). Activation of phospholipase A2 by prostaglandin in vitro. Prostagl. Other Lipid Mediat 152, 106500. doi:10.1016/j.prostaglandins.2020.106500
Gachet, M. S., Rhyn, P., Bosch, O. G., Quednow, B. B., and Gertsch, J. (2015). A quantitiative LC-MS/MS method for the measurement of arachidonic acid, prostanoids, endocannabinoids, N-acylethanolamines and steroids in human plasma. J. Chromatogr. B Anal. Technol. Biomed. Life Sci. 976-977, 6–18. doi:10.1016/j.jchromb.2014.11.001
Globig, P., Morakabati, P., Höfer, V., Willmes, D. M., Babina, M., and Worm, M. (2025). Acetylsalicylic acid aggravates anaphylaxis in a PGE2-dependent manner. J. Clin. Invest 135, e175397. doi:10.1172/JCI175397
Guo, X., Yao, Y. D., Kang, J. L., Luo, F. K., Mu, X. J., Zhang, Y. Y., et al. (2023). Iristectorigenin C suppresses LPS-induced macrophages activation by regulating mPGES-1 expression and p38/JNK pathway. J. Ethnopharmacol. 317, 116706. doi:10.1016/j.jep.2023.116706
Hegen, M., Keith, J. C., Collins, M., and Nickerson-Nutter, C. L. (2008). Utility of animal models for identification of potential therapeutics for rheumatoid arthritis. Ann. Rheum. Dis. 67, 1505–1515. doi:10.1136/ard.2007.076430
Kapoor, M., Kojima, F., Yang, L., and Crofford, L. J. (2007). Sequential induction of pro- and anti-inflammatory prostaglandins and peroxisome proliferators-activated receptor-gamma during normal wound healing: a time course study. Prostagl. Leukot. Essent. Fat. Acids 76, 103–112. doi:10.1016/j.plefa.2006.11.006
Kondeti, V., Al-Azzam, N., Duah, E., Thodeti, C. K., Boyce, J. A., and Paruchuri, S. (2016). Leukotriene D4 and prostaglandin E2 signals synergize and potentiate vascular inflammation in a mast cell-dependent manner through cysteinyl leukotriene receptor 1 and E-prostanoid receptor 3. J. Allergy Clin. Immunol. 137, 289–298. doi:10.1016/j.jaci.2015.06.030
Lee, B. R., Paing, M. H., and Sharma-Walia, N. (2021). Cyclopentenone prostaglandins: biologically active lipid mediators targeting inflammation. Front. Physiol. 12, 640374. doi:10.3389/fphys.2021.640374
Lee, S. A., Park, B. R., Moon, S. M., Shin, S. H., Kim, J. S., Kim, D. K., et al. (2020). Cynaroside protects human periodontal ligament cells from lipopolysaccharide-induced damage and inflammation through suppression of NF-κB activation. Arch. Oral Biol. 120, 104944. doi:10.1016/j.archoralbio.2020.104944
Liu, X., Tao, Q., Shen, Y., Liu, X., Yang, Y., Ma, N., et al. (2023). Aspirin eugenol ester ameliorates LPS-induced inflammatory responses in RAW264.7 cells and mice. Front. Pharmacol. 14, 1220780. doi:10.3389/fphar.2023.1220780
Maher, S. A., Birrell, M. A., Adcock, J. J., Wortley, M. A., Dubuis, E. D., Bonvini, S. J., et al. (2015). Prostaglandin D2 and the role of the DP1, DP2 and TP receptors in the control of airway reflex events. Eur. Respir. J. 45, 1108–1118. doi:10.1183/09031936.00061614
Malik, M. N. H., Tahir, M. N., Alsahli, T. G., Tusher, M. M. H., Alzarea, S. I., Alsuwayt, B., et al. (2023). Geraniol suppresses oxidative stress, inflammation, and interstitial collagenase to protect against inflammatory arthritis. ACS Omega 8, 37128–37139. doi:10.1021/acsomega.3c04684
Maseda, D., Ricciotti, E., and Crofford, L. J. (2019). Prostaglandin regulation of T cell biology. Pharmacol. Res. 149, 104456. doi:10.1016/j.phrs.2019.104456
Montrose, D. C., Nakanishi, M., Murphy, R. C., Zarini, S., McAleer, J. P., Vella, A. T., et al. (2015). The role of PGE2 in intestinal inflammation and tumorigenesis. Prostagl. Other Lipid Mediat 116-117, 26–36. doi:10.1016/j.prostaglandins.2014.10.002
Nakamachi, Y., Ohnuma, K., Uto, K., Noguchi, Y., Saegusa, J., and Kawano, S. (2016). MicroRNA-124 inhibits the progression of adjuvant-induced arthritis in rats. Ann. Rheum. Dis. 75, 601–608. doi:10.1136/annrheumdis-2014-206417
Ohmura, T., Tian, Y., Sarich, N., Ke, Y., Meliton, A., Shah, A. S., et al. (2017). Regulation of lung endothelial permeability and inflammatory responses by prostaglandin A2: role of EP4 receptor. Mol. Biol. Cell 28, 1622–1635. doi:10.1091/mbc.E16-09-0639
Pan, H., Guo, R., Ju, Y., Wang, Q., Zhu, J., Xie, Y., et al. (2019). A single bacterium restores the microbiome dysbiosis to protect bones from destruction in a rat model of rheumatoid arthritis. Microbiome 7 (1), 107. doi:10.1186/s40168-019-0719-1
Pan, P., Qin, G., Wang, B., Yu, H., Chen, J., Liu, J., et al. (2022). HDAC5 loss enhances phospholipid-derived arachidonic acid generation and confers sensitivity to cPLA2 inhibition in pancreatic cancer. Cancer Res. 82, 4542–4554. doi:10.1158/0008-5472.CAN-21-4362
Pang, Y., Liu, X., Zhao, C., Shi, X., Zhang, J., Zhou, T., et al. (2022). LC-MS/MS-based arachidonic acid metabolomics in acute spinal cord injury reveals the upregulation of 5-LOX and COX-2 products. Free Radic. Biol. Med. 193, 363–372. doi:10.1016/j.freeradbiomed.2022.10.303
Park, Y. J., Heo, J., Kim, Y., Cho, H., Shim, M., Im, K., et al. (2023). Glucocorticoids alleviate particulate matter-induced COX-2 expression and mitochondrial dysfunction through the Bcl-2/GR complex in A549 cells. Sci. Rep. 13, 18884. doi:10.1038/s41598-023-46257-y
Pujol, J. P., and Loyau, G. (1987). Interleukin-1 and osteoarthritis. Life Sci. 41, 1187–1198. doi:10.1016/0024-3205(87)90196-2
Quinteiro, M. S., Napimoga, M. H., Mesquita, K. P., and Clemente-Napimoga, J. T. (2012). The indirect antinociceptive mechanism of 15d-PGJ2 on rheumatoid arthritis-induced TMJ inflammatory pain in rats. Eur. J. Pain 16, 1106–1115. doi:10.1002/j.1532-2149.2012.00114.x
US Food and Drug Administration (2018). Bioanalytical method validation guidance for industry. Maryland, United States: US Department of Health and Human Services. Available online at: https://www.fda.gov/media/70858/download (accessed on March 10, 2025).
Wang, B., Wu, L., Chen, J., Dong, L., Chen, C., Wen, Z., et al. (2021). Metabolism pathways of arachidonic acids: mechanisms and potential therapeutic targets. Signal Transduct. Target Ther. 6, 94. doi:10.1038/s41392-020-00443-w
Wang, D., Pan, C., Han, J., Zhao, Y., Liu, S., Li, C., et al. (2023b). Involvement of p38 MAPK/cPLA2 and arachidonic acid metabolic pathway in Shengmai injection-induced pseudo-allergic reactions. J. Ethnopharmacol. 309, 116357. doi:10.1016/j.jep.2023.116357
Wang, Y., Luo, Y., Yang, S., Jiang, M., and Chu, Y. (2023a). LC-MS/MS-Based serum metabolomics and transcriptome analyses for the mechanism of augmented renal clearance. Int. J. Mol. Sci. 24, 10459. doi:10.3390/ijms241310459
Yang, M., Liu, X., Tang, X., Sun, W., and Ji, Z. (2023). LC-MS based urine untargeted metabolomic analyses to identify and subdivide urothelial cancer. Front. Oncol. 13, 1160965. doi:10.3389/fonc.2023.1160965
Yao, C., and Narumiya, S. (2019). Prostaglandin-cytokine crosstalk in chronic inflammation. Br. J. Pharmacol. 176, 337–354. doi:10.1111/bph.14530
Yu, X., Jin, Z., Raza, F., Zhang, P., Wu, J., Ren, M., et al. (2024). SIRT6 reduces rheumatoid arthritis injury by inhibiting MyD88-ERK signaling pathway. Front. Biosci. Landmark Ed. 29, 5. doi:10.31083/j.fbl2901005
Zhang, H. J., Chen, Y. T., Hu, X. L., Cai, W. T., Wang, X. Y., Ni, W. F., et al. (2023). Functions and mechanisms of cytosolic phospholipase A2 in central nervous system trauma. Neural Regen. Res. 18, 258–266. doi:10.4103/1673-5374.346460
Zhang, Y., Liu, Y., Sun, J., Zhang, W., Guo, Z., and Ma, Q. (2020)2023). Arachidonic acid metabolism in health and disease. MedComm 4, 4:e363. doi:10.1002/mco2.363
Keywords: arachidonic acid, prostaglandins, PGE2, PGD2, UHPLC-QQQ-MS/MS, inflammation
Citation: Huang Y, Wang M, Yang Z, Wang X, Wang X and He F (2025) Determination of nine prostaglandins in the arachidonic acid metabolic pathway with UHPLC-QQQ-MS/MS and application to in vitro and in vivo inflammation models. Front. Pharmacol. 16:1595059. doi: 10.3389/fphar.2025.1595059
Received: 18 March 2025; Accepted: 30 April 2025;
Published: 30 May 2025.
Edited by:
Bhupinder Kumar, Hemwati Nandan Bahuguna Garhwal University, IndiaReviewed by:
Rohit Bhatia, Indo-Soviet Friendship College of Pharmacy, IndiaAmit Kumar, Chitkara University, India
Copyright © 2025 Huang, Wang, Yang, Wang, Wang and He. This is an open-access article distributed under the terms of the Creative Commons Attribution License (CC BY). The use, distribution or reproduction in other forums is permitted, provided the original author(s) and the copyright owner(s) are credited and that the original publication in this journal is cited, in accordance with accepted academic practice. No use, distribution or reproduction is permitted which does not comply with these terms.
*Correspondence: Fan He, aGVmYW5fNzhAMTI2LmNvbQ==
†These authors have contributed equally to this work