 Lichang Zhang1,2
 Deshi Dong
 Yanna Zhu
 Shilei Yang
- 1Department of Pharmacy, First Affiliated Hospital of Dalian Medical University, Dalian, China
- 2College of Pharmacy, Dalian Medical University, Dalian, China
Objective: Low-dose methotrexate (LD-MTX), a treatment regimen involving weekly doses ≤20 mg, is widely used in rheumatoid arthritis. Methotrexate (MTX) is primarily excreted via the kidneys. However, the assessment protocol for the adverse reaction risk threshold of the LD-MTX dosing regimen in renal impairment remains inadequate. This study aims to use pharmacovigilance analysis and physiologically-based pharmacokinetic (PBPK) model to combine the analysis of the risk of adverse reactions of LD-MTX in patients with renal impairment.
Methods: Collected and analyzed disproportionate signals from adverse reaction reports on MTX in patients with renal impairment from the FDA Adverse Event Reporting System (FAERS) from Q1 2004 to Q3 2024. The restricted cubic spline (RCS) model explored the nonlinear relationship between MTX maximum plasma concentration and dose to derive risk thresholds. The PBPK model was developed and validated using MTX data in healthy adults, and further extended to chronic kidney disease (CKD) populations to simulate dose risks.
Results: FAERS analysis revealed heightened risks of hematological disorders, hepatic impairment, and pulmonary adverse events (AEs) with MTX in renal impairment. The optimized threshold based on RCS and the PBPK model simulation results indicated that the risk of adverse reactions increased starting from CKD stage 2.
Conclusion: LD-MTX confers increased adverse reaction risks in renal impairment, notably from CKD stage 2 or higher, necessitating dose adjustments and vigilant monitoring.
1 Introduction
Low-dose methotrexate (LD-MTX) is typically defined as a therapeutic dose of ≤20 mg/week (Solomon et al., 2020). Methotrexate (MTX) is one of the most commonly used medications for treating rheumatoid arthritis and has been demonstrated to be the most effective and fastest-acting antirheumatic drug (Torres et al., 2022). However, concerns regarding its safety have persisted since its introduction in 1962 (Weinblatt, 2013). The most frequent adverse reactions include: gastrointestinal reactions, liver dysfunction, skin disorders, blood-related disorders, and nephrotoxicity. In some cases, pulmonary toxicity and bone marrow suppression may also occur (Wang et al., 2018; Weinblatt, 1985). A statistical study found that 72.9% of patients experienced at least one adverse reaction when using LD-MTX to treat rheumatoid arthritis (Torres et al., 2022). MTX is primarily excreted via the kidneys after oral absorption. Over 80% of MTX is excreted unchanged in urine, while a small portion of MTX and its metabolites is excreted through the liver and bile (Maksimovic et al., 2020). As a drug primarily excreted by the kidneys, changes in renal function may amplify the risk of these adverse reactions. Multiple studies have demonstrated a significantly increased risk of adverse reactions when MTX is used in patients with renal impairment. In a study involving 5,648 rheumatoid arthritis patients receiving oral MTX, the incidence of hematologic toxicity among patients with chronic kidney disease (CKD) was 37.5% (33/88), whereas the incidence among non-CKD patients was only one-third that of CKD patients (10.7% [594/5,560]) (Mitsuboshi, 2021). Furthermore, according to reports by Muanda et al., the use of LD-MTX in elderly patients with chronic kidney disease carries a higher risk of toxicity (Muanda et al., 2023). Meanwhile, approximately 13.4% of the global population suffers from CKD. Since early-stage CKD is clinically asymptomatic, the actual number of CKD patients may be significantly higher than current statistics indicate (Hill et al., 2016; Obrador and Levin, 2019). Although existing studies have confirmed that LD-MTX increases the risk of adverse reactions in patients with CKD, the assessment protocols for determining the adverse reaction risk thresholds of LD-MTX dosing regimens across different stages of CKD remain inadequate. Therefore, refining the assessment protocols for the risk of adverse reactions associated with LD-MTX use in patients with renal impairment, particularly through evaluating and determining risk thresholds based on dosage and degree of renal impairment, is an urgent issue requiring resolution.
In recent years, research utilizing data mining and pharmacovigilance analysis from the U.S. Food and Drug Administration Adverse Event Reporting System (FAERS) has steadily increased. Its advantages lie in the vast volume of adverse reaction reports and the real-world data on the clinical safety of prescription drugs (Bone and Houck, 2017; Morris et al., 2024). The FAERS database provides MTX-related case data that effectively assesses the correlation between adverse reactions and LD-MTX use in patients with renal impairment. Understanding the pharmacokinetic changes of LD-MTX in patients with renal impairment is crucial for evaluating its safety. Studies indicate that MTX pharmacokinetic alterations are closely associated with adverse reaction risks, particularly in patients with impaired renal function (Grim et al., 2003). Therefore, employing physiologically based pharmacokinetic (PBPK) models to investigate the absorption, distribution, metabolism, and excretion of MTX in humans is an appropriate approach. Concurrently, recent years have seen growing advocacy for utilizing PBPK models to explore the impact of renal impairment on pharmacokinetics (ResearchCenter for Drug Evaluation and, 2024). In this study, we first analyzed MTX cases within the pharmacovigilance database to identify potential adverse reaction signals in patients with renal impairment. Subsequently, we established a PBPK model for MTX to further explore the dose-risk relationship across varying degrees of renal impairment. The combined assessment of pharmacovigilance and PBPK modeling can better elucidate the safety of LD-MTX use in patients with renal impairment and provide a more comprehensive risk assessment approach for clinical practice, as illustrated in Figure 1.
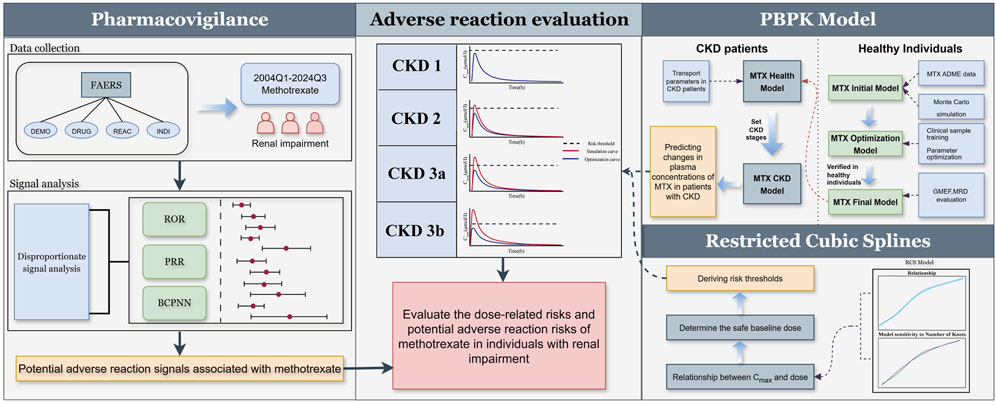
Figure 1. Adverse reaction assessment process for LD-MTX in patients with renal impairment. Through pharmacovigilance data analysis, adverse reaction signals associated with MTX use in patients with renal impairment were identified. Based on existing clinical study results, an MTX PBPK model was established and validated in healthy populations and extended to CKD populations. The relationship between MTX maximum plasma concentration and dose was explored using restricted cubic spline model, and risk thresholds for CKD populations were derived to assess the risks associated with different doses across various stages of CKD.
2 Materials and methods
2.1 Data sources
The FAERS database is a public, free pharmacovigilance database that is updated quarterly with adverse event data. The official portal of the FDA provides data in two formats: ASCII and XML. To improve computational efficiency, we obtained ASCII data files spanning from Q1 2004 through Q3 2024. Pharmacovigilance data can be found here: https://fis.fda.gov/extensions/FPDQDE-FAERS/FPD-QDE-FAERS.html.
The plasma concentration-time curve for MTX was retrieved from a series of published clinical studies involving healthy volunteers and digitized using OriginPro 2024 (OriginLab Corporation, Northampton, MA, United States). Part of the clinical study dataset from healthy volunteers was used to build the PBPK model, while the remainder supported model evaluation and testing. Detailed information is provided in the Electronic Supplementary Material.
2.2 Pharmacovigilance data extraction and analysis
In this study, four datasets (DEMO, DRUG, INDI, REAC) were cleaned and merged. First, AEs in the FAERS database are coded according to the Medical Dictionary for Regulatory Activities (MedDRA) terminology (https://www.meddra.org/). In the INDI file, we used the MedDRA high-level terms “Renal failure and impairment” (Version 26.1, code: 10038443) and “Complications of renal failure” (Version 26.1, code: 10010180) to screen all adverse reaction indications under this term hierarchy. After screening and deduplication, the INDI data is mapped to the REAC file using the PRIMARY ID and CASE ID fields to obtain complete adverse reaction and indication information. For the DRUG dataset, FAERS, as a spontaneous reporting system, may record drug names using multiple names, such as generic names, chemical structure names, brand names, abbreviations, or even incorrect names (Khaleel et al., 2022). Therefore, to standardize drug names, we used the Medical Concept Extraction System for Unstructured Information Management Architecture (MedEx-UIMA) to uniformly map drug names to generic drug names (Jiang et al., 2014). This system enables the extraction and standardized coding of drug names and can map them using RxNorm drug codes to ensure the standardization of drug names. Subsequently, the standardized DRUG dataset was mapped to the cleaned INDI and REAC datasets using PRIMARY ID and CASE ID, followed by deduplication. Finally, the merged dataset from the previous step is mapped against the DEMO dataset using PRIMARY ID and CASE ID to deduplicate, to get the complete adverse reaction cases, rows with missing AE information will be treated as null values and excluded from statistical analysis. According to MedDRA (Version 26.1), all AEs are coded as Preferred term (PT) and classified by System Organ Class (SOC). And PTs unrelated to drug adverse reactions are excluded, including product issues, social environment, various injuries, poisoning, surgical complications, and medical procedures. All the above work was completed using Python 3.11 (Python Software Foundation, Wilmington, United States) and Microsoft Excel (Microsoft Company, Microsoft Build 16.0.17932.20408).
For signal detection, we extracted MTX-related reports and applied the Proportional Reporting Ratio (PRR), Reporting Odds Ratio (ROR), and Bayesian Confidence Propagation Neural Network (BCPNN) to identify adverse reaction signals. PRR estimates relative risk, with a signal detected if frequency ≥3, PRR ≥2, and chi-squared ≥4; however, it is sensitive to false positives with low case numbers. ROR, a less biased estimate of risk ratio, detects a signal if frequency ≥3 and the 95% CI lower limit >1. BCPNN remains stable with small case numbers, detecting a signal if frequency ≥3 and the 95% CI lower limit (IC025) >0 (Noguchi et al., 2021; Trillenberg et al., 2023). Therefore, we combined PRR, ROR, and BCPNN for signal detection. Higher PRR, ROR, or IC values indicate stronger signals. A PT was considered a signal if it met all three methods’ criteria.
2.3 Development of PBPK models for methotrexate in healthy individuals
The methotrexate PBPK model was developed using PK-Sim® (Open Systems Pharmacology Suite 11.3, www.opensystems-pharmacology.org). MTX is metabolized in the liver, but the vast majority of MTX is excreted via the kidneys. Therefore, for establishing the initial model, we primarily considered MTX’s glomerular filtration and tubular secretion in the kidneys. Regarding tubular secretion, it mainly involves basolateral membrane uptake and apical membrane efflux (Grim et al., 2003). Organic anion transporter 1 (OAT1), organic anion transporter 3 (OAT3), and reduced folate carrier 1 (RFC1) in the basolateral membrane of proximal tubule cells transport MTX from blood to renal tubule epithelial cells (Uwai et al., 2004; Takeda et al., 2002; Wang et al., 2001; Wright et al., 2022). Multidrug resistance-associated protein 4 (MRP4) and breast cancer resistance protein (BCRP) mediate the apical membrane efflux of MTX, secreting it from epithelial cells into the renal tubule lumen for excretion (Chen et al., 2025; Huls et al., 2008; Ivanyuk et al., 2017). The detailed mechanism is shown in Figure 2. After determining the preliminary transport mechanism, we optimized multiple parameters simultaneously using PK-Sim®’s parameter identification module to refine uncertain values. And we used the Monte Carlo algorithm to optimize parameters, minimizing the difference between simulated and observed pharmacokinetic data. Sensitivity analysis revealed the contribution of each transport carrier to renal excretion. Based on the preliminary results of the transporter contribution sensitivity analysis, as well as the fact that OAT3 (IC50 = 61.5 μM) has a significantly higher affinity for MTX than OAT1 (IC50 = 998 μM) (Uwai and Iwamoto, 2010). The final hypothesis is that OAT3 and RFC1 mediate absorption in the basolateral membrane of proximal renal tubule cells, while MRP4 and BCRP mediate excretion in the apical membrane of renal tubules, thereby explaining MTX secretion in the renal tubules. At the same time, considering the loss of renal transporters and non-renal clearance effects caused by mapping the model to the CKD population, we introduced partial hepatic clearance to simulate non-renal clearance effects and bile excretion to simulate the metabolic compensation effects of patients with mid-stage CKD (Grim et al., 2003). Finally, MTX’s absorption, distribution, metabolism, and excretion (ADME) data were compiled to optimize model parameters. The PK-Sim® physiological database provided anatomical and physiological data (Kuepfer et al., 2016), with parameters such as age, weight, and height adjusted based on collected demographic data, while others retained default values.
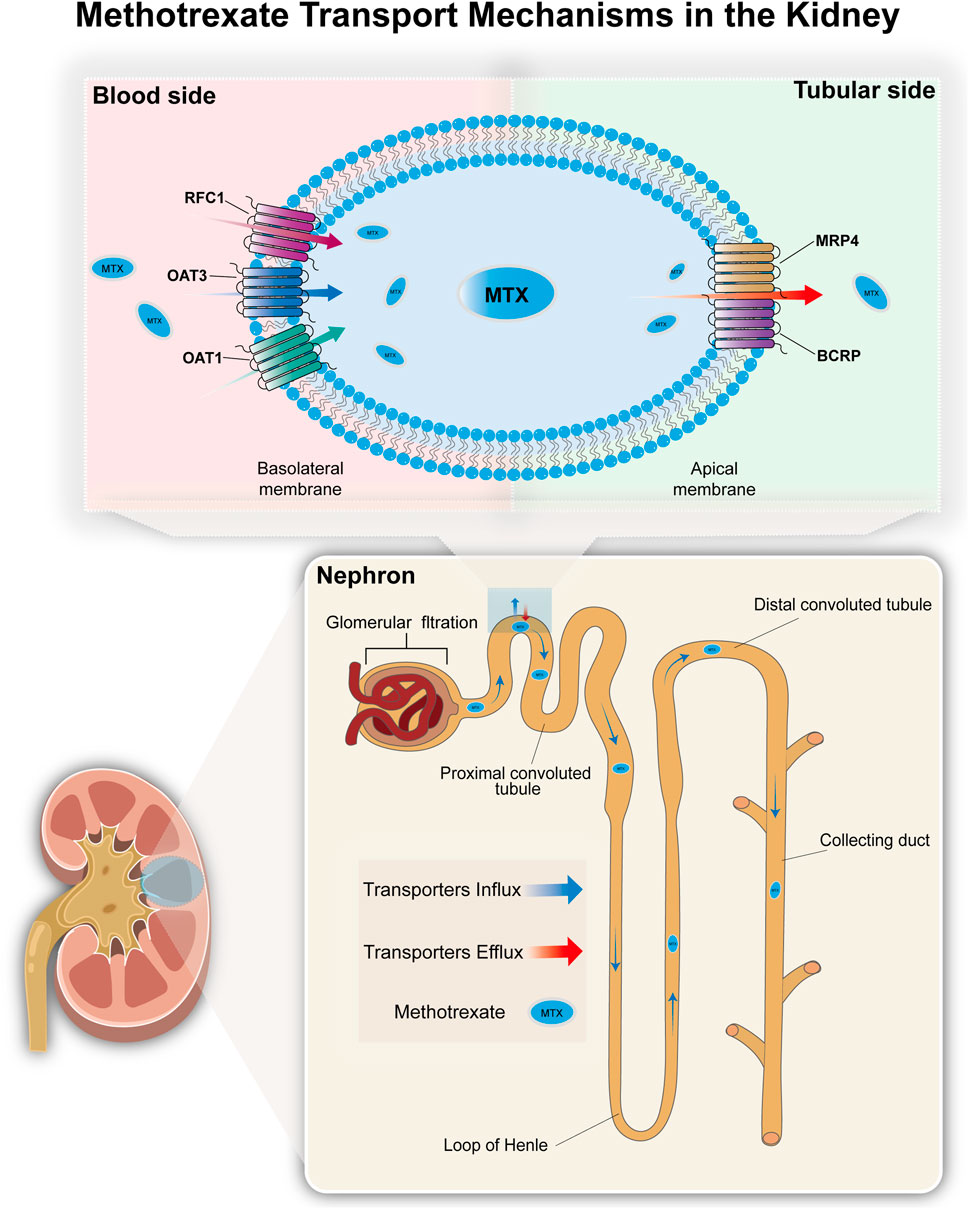
Figure 2. The transport mechanism of methotrexate in the kidneys. Most MTX in the blood enters the renal tubule lumen via glomerular filtration. MTX is actively transported into the proximal tubule epithelial cells via organic anion transporters (OAT1 and OAT3) and reduced folate carri-er (RFC1) located on the basolateral membrane, and then secreted into the renal tubule lumen via efflux transporters (MRP4 and BCRP) located on the apical membrane of the tubule epithelial cells.
2.4 Development of PBPK model for methotrexate in the CKD population
The CKD model for MTX was adjusted based on pathological and physiological changes observed in CKD patients compared to a healthy population model, to accommodate various disease stages (Malik et al., 2020). LD-MTX is contraindicated for patients with advanced CKD (Sparks et al., 2021). We only simulated mild to moderate CKD, generating 1,000 virtual individuals randomly for each stage of CKD (stages 1–3) for the CKD population simulation. Stage 1 estimated glomerular filtration rate (eGFR) is greater than 90 (ml/min/1.73 m2), Stage 2 eGFR is 60–89 (ml/min/1.73 m2), Stage 3a eGFR is 45–59 (ml/min/1.73 m2), and Stage 3b eGFR is 30–44 (ml/min/1.73 m2) (Vaidya and Aeddula, 2025). Additionally, according to the intact nephron hypothesis (INH), the GFR change rate in INH can be used to represent the transporter change rate in mild to moderate CKD, such that eGFR in CKD patients (eGFRCKD) is proportional to the reference eGFR (eGFRref) (Bricker, 1969; Hsueh et al., 2018). The concentration of transport proteins in the CKD virtual population is adjusted according to Equation 1
The eGFRref value is set to 106.78 (ml/min/1.73 m2), which was obtained using PK-Sim® based on the European population (ICRP, 2002) with an average age of 30 years, height of 176 cm, and weight of 73 kg for a virtual healthy male.
2.5 PBPK model evaluation
The evaluation of the PBPK models was conducted using standard metrics, including the average mean relative deviation (MRD) (Equation 2) and the geometric mean fold error (GMFE) (Equation 3), to assess overall model accuracy. Data analysis was conducted using R version 4.4.1 (R Institute for Statistical Computing, Vienna, Austria). MRD was employed to assess the accuracy of plasma concentration predictions, while GMFE was utilized to evaluate the precision of first to the last data point (AUClast), and maximum observed plasma concentration (Cmax)estimates. When MRD and GMFE ≤2, model performance was considered acceptable. Furthermore, goodness-of-fit (GOF) plots were generated to visually compare the predicted concentration-time curves with the observed data from clinical studies, thereby evaluating the consistency between predicted and observed values. These primarily included plasma concentration, Cmax, and AUClast (Britz et al., 2020).
Where CPredicted, i is the predicted plasma concentration, Cobserved, i is the corresponding observed plasma concentration, and m is the number of observations.
Where predicted PK parameteri is the predicted AUClast or Cmax, observed PK parameteri is the corresponding observed AUClast or Cmax, and n is the number of studies.
2.6 Risk threshold for adverse reactions in CKD patients
Research on the risk threshold for related toxicity in CKD patients receiving LD-MTX is currently lacking. According to Yang et al. (2018), renal function is correlated with MTX concentration, and elevated MTX levels can serve as predictors of MTX-related toxicity. Therefore, we hypothesized whether LD-MTX could be used to predict the risk of related toxicity. A study on LD-MTX use in individuals with normal renal function identified a Cmax of 0.16 μmol/L after the first weekly dose as the threshold for MTX-related adverse reactions, with MTX dosage being positively correlated with Cmax (Shoda et al., 2007). However, this value represents a statistical threshold and does not provide the corresponding baseline dose. Given the potential nonlinear relationship between Cmax and dose, we considered using the RCS model to explore this relationship. The RCS model is suitable for this purpose because it allows flexible modeling of complex associations between continuous variables without a predefined functional form (Desquilbet and François, 2010), which enables us to infer the benchmark dose corresponding to 0.16 μmol/L. The RCS model was modified based on the case provided by Discacciati et al. (2025). Since Cmax and dose are both continuous variables, ordinary least squares were used to set the RCS as a linear regression model, with the number of RCS knots defined as four and the knot locations using the default settings. The simulated data for RCS were obtained by further simulating and expanding existing healthy population data (Supplementary Table S7) with a normal distribution. The model sensitivity was assessed using the Akaike Information Criterion, and the nonlinear relationship between Cmax and dose M was obtained through the RCS model (Equation 4). Detailed related parameters are provided in the supplementary material
Where β0 = 0.0636; β1 = 0.0139; β2 = 0.0542; β3 = −0.0912. M represents the administered dose. The nonlinear basis functions f1 and f2 (Equations 5, 6) are defined as:
Where k represents the knot position, which is placed at the 0.05, 0.275, 0.725, and 0.95 percentiles of the dose distribution by default, k1 = 5; k2 = 7.5; k3 = 15; k4 = 22.5.
According to Equation 4, the reference dose corresponding to a Cmax of 0.16 μmol/L was determined. Subsequently, the established PBPK model for healthy individuals was employed to verify whether this reference dose yielded simulation outputs within the expected deviation range of 0.16 μmol/L. By integrating the RCS model outputs with the verification results from the PBPK model, the final reference dose (m0) was identified as 2.3 mg. On this basis, we further extrapolated the toxicity threshold by proportionally scaling the 0.16 μmol/L cutoff according to the dose ratio. In parallel, the degree of renal impairment in the CKD population was incorporated by adjusting for the ratio of GFR in CKD patients relative to that in healthy individuals. The final adjustment equation for the CKD risk threshold is presented in Equation 7.
Where M represents the administered dose, m0 denotes the baseline dose, eGFRCKD denotes the eGFR values for each stage of CKD, and eGFRref equals 106.78, which represents the reference value for eGFR in healthy individuals. This value was obtained using PK-Sim® based on a virtual healthy male with an average age of 30 years, height of 176 cm, and weight of 73 kg, derived from the European population (ICRP, 2002).
3 Results
3.1 Characteristics of methotrexate adverse events in patients with renal impairment
Between Q1 2004 and Q3 2024, 1,529,492 AEs in patients with renal impairment were identified following deduplication, including 2,663 cases associated with MTX. Table 1 presents the clinical baseline characteristics of the 2,663 cases. The gender distribution was 29.29% male and 53.59% female, with 45.59% of patients aged 65 years or older. Regarding MTX dosage, 59.63% of cases had unknown dosages, followed by the most frequent specified dosages: 2.5 mg (11.87%), 10 mg (7.55%), 15 mg (4.96%), and 20 mg (5.33%). The majority of reports originated from Canada (37.36%), the United States (19.79%), and Spain (11.34%), with 65.04% of cases reported between 2019 and 2024.
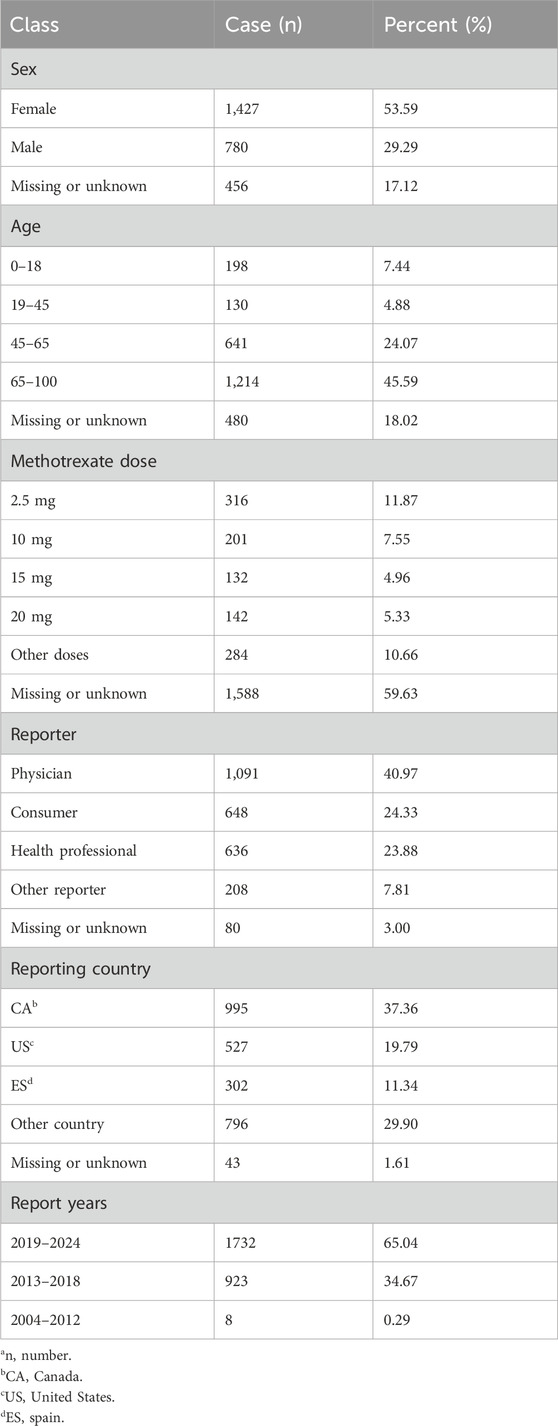
Table 1. Characteristics of patients with renal impairment experiencing adverse events associated with methotrexate (na = 2,663).
3.2 Pharmacovigilance analysis of methotrexate in patients with renal impairment
Further analysis using PRR, ROR, and BCPNN identified a total of 75 AE signals. Based on MedDRA, these 75 signals were classified using SOC, identifying 16 SOCs for all AE signals. As illustrated in Figure 3, the SOCs associated with AE signals in the renal failure population primarily focused on general disorders and administration site conditions (23.91%), musculoskeletal and connective disorders (17.75%), blood and lymphatic system disorders (15.48%), and skin and subcutaneous tissue disorders (11.91%).
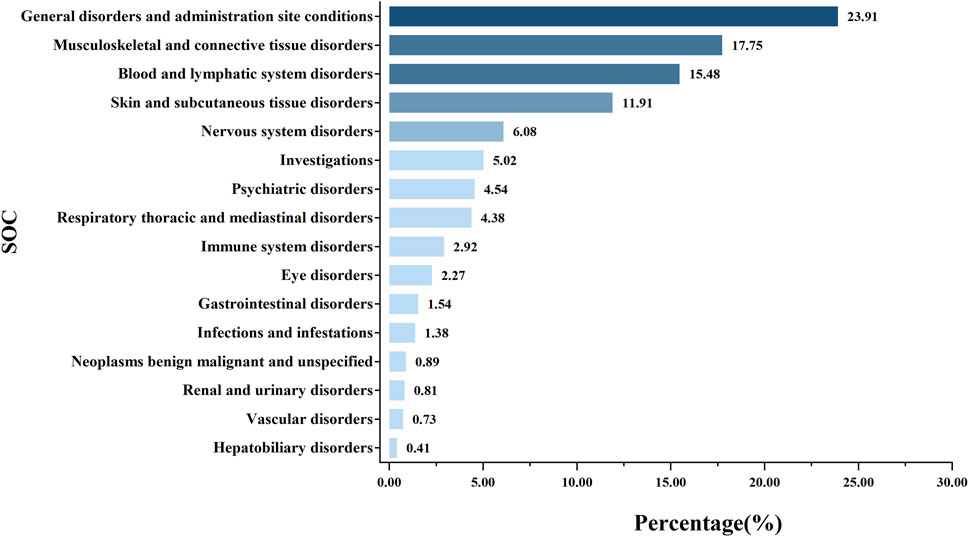
Figure 3. Proportion of systemic adverse events in renal impairment patients following methotrexate use.
The PT signals associated with MTX in patients with renal impairment are listed in Figure 4, ordered by the number of reports. The AEs most commonly associated with MTX include hematological disorders, liver function impairment, and skin disorders. Among these, thrombocytopenia [58 reports, ROR: 6.73, 95% CI: 5.18–8.75], pancytopenia [19 reports, ROR: 5.91, 95% CI: 3.76–9.30], and febrile neutropenia [28 reports, ROR: 5.30, 95% CI: 3.64–7.70] are associated with bone marrow suppression, while transaminases increased [39 reports, ROR: 15.87, 95% CI: 11.52–21.86] are one of the factors contributing to hepatic dysfunction. Additionally, some AEs not mentioned in the MTX package insert but related to skin diseases, such as toxic epidermal necrolysis [29 reports, ROR: 6.04, 95% CI: 4.18–8.73] and erythrodermic psoriasis [28 reports, ROR: 31.37, 95% CI: 21.41–45.98], may represent potential new AE signals. AE signals with high signal strength are primarily pulmonary and joint-related adverse reactions, with pulmonary adverse reaction signals such as rheumatoid lung [12 reports, ROR: 49.72, 95% CI: 27.53–89.77] and pulmonary toxicity [12 reports, ROR: 47.33, 95% CI: 26.24–85.37]. Joint-related adverse reaction signals include hand deformity [12 reports, ROR: 49.36, 95% CI: 27.34–89.12], tenosynovitis [12 reports, ROR: 42.14, 95% CI: 23.42–75.82], and synovitis [14 reports, ROR: 34.78, 95% CI: 20.25–59.72]. Furthermore, AEs with a certain signal strength but not mentioned in the MTX package insert include euphoric mood, B-cell lymphoma, and dry eyes. The complete signal results and signal strength ranking results are available in Supplementary Tables S1 and Supplementary Figure S1.
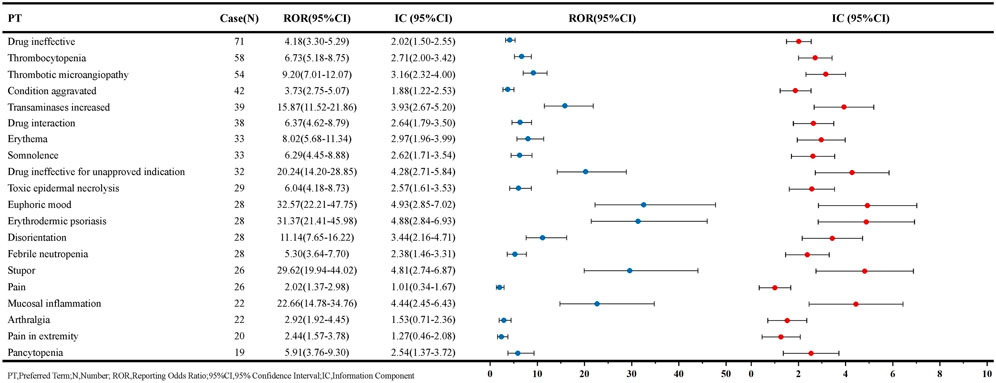
Figure 4. PT signal results based on the top 20 AEs reported in MTX reports.
3.3 Development and validation of PBPK model for methotrexate in healthy individuals
The methotrexate PBPK model for healthy individuals was constructed using different doses and time data for healthy individuals. Figure 5 presents the MTX plasma concentration-time profile. This model can accurately describe the plasma concentration distribution of MTX in healthy individuals at different doses. Supplementary Tables S2 in the supplementary materials provides complete clinical data information for training and testing. Supplementary Tables S3 provides the detailed parameters input into the model, and the results of the parameter sensitivity analysis are detailed in Supplementary Figure S2.
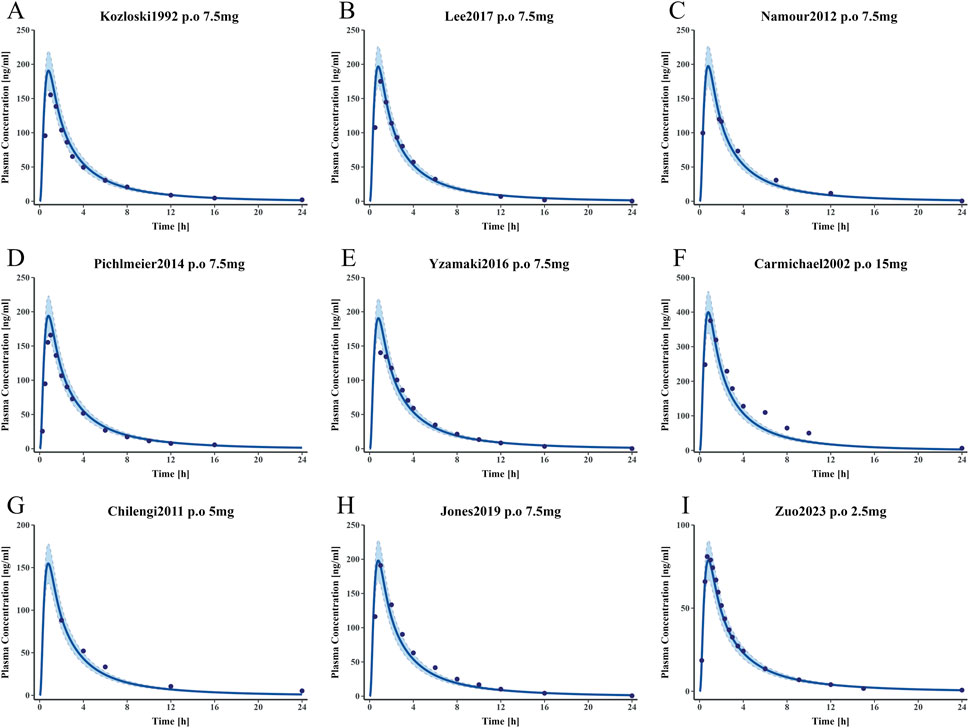
Figure 5. Simulated and observed plasma concentration-time curves of the methotrexate PBPK model in healthy adults (A–E) represent plasma concentration-time curves for the training dataset. (F–I) represent plasma concentration-time curves for the test dataset. Clinically observed data are shown as mean values (dark blue solid points); the dark blue solid line indicates predicted plasma concentrations; the blue shaded area represents the 95% confidence interval.
Figure 6 presents GOF plots for predicted versus observed plasma concentrations, Area under the concentration curve from the AUClast, and Cmax in the training and test groups. The predicted plasma concentration values (98.04%), Cmax (9/9), and AUClast (9/9) fall within a two-fold range of the observed data. Regarding model performance, the average MRD value for this model is 1.50, with GMFE values of 0.99 and 1.04 for AUClast and Cmax, respectively. All these values are less than 2, indicating good model performance. Detailed parameters are available in Supplementary Tables S4–6.
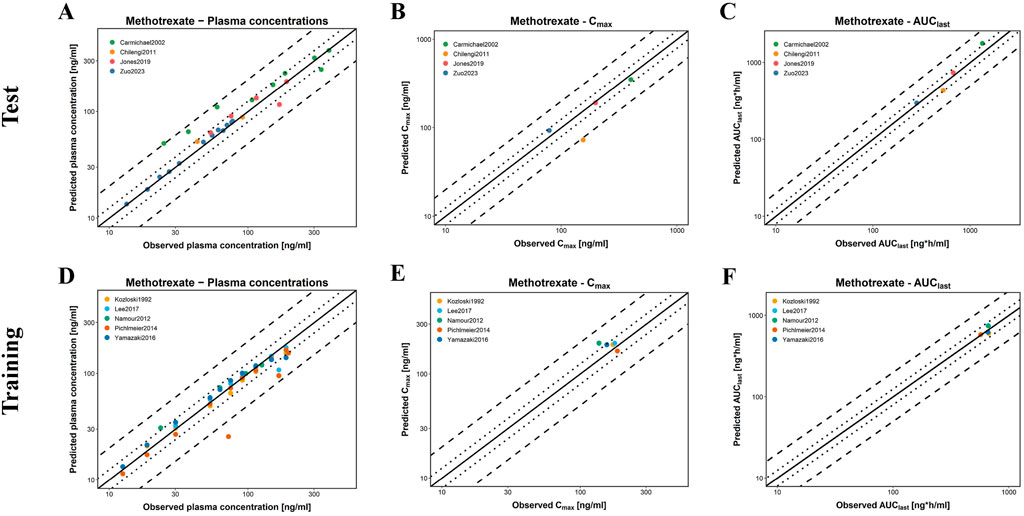
Figure 6. Evaluation of model performance for MTX in healthy individuals. (A–C) are the test groups; (D–F) are the training groups; (A,D) represent the predicted and observed MTX plasma concentrations for all clinical studies; (B,E) represent the predicted and observed Cmax of MTX; (C,F) represent the predicted and observed AUClast of MTX; solid lines indicate the identity line; dotted lines indicate a 1.25-fold deviation; dashed lines indicate a 2-fold deviation.
3.4 Risks of low-dose methotrexate in individuals with CKD
According to the FDA drug label, the LD-MTX dosing regimens are as follows: 1) 7.5 mg once weekly tablet po; 2) 10 mg once weekly tablet po; 3) 15 mg once weekly tablet po; 4) 20 mg once weekly tablet po. Table 2 shows the plasma risk thresholds for individuals with mild to moderate CKD under standard oral dosing regimens. Figure 7 illustrates the plasma concentration-time profile of MTX in individuals with mild to moderate CKD. Simulation results for each stage of CKD indicate that in Stage 1 CKD, plasma concentrations for all four oral dosing regimens remained below the predicted plasma risk threshold. In Stages 2 through 3b of CKD, plasma concentrations for all four dosing regimens exceeded the predicted plasma risk threshold. Additionally, starting from Stage 3a CKD, the plasma concentrations simulated by the PBPK model significantly exceeded the predicted plasma risk threshold, with this phenomenon becoming more pronounced in Stage 3b CKD. These findings suggest that, beginning with Stage 2 CKD, there is a potential risk of adverse reactions associated with the use of LD-MTX in patients with mild to moderate renal impairment.
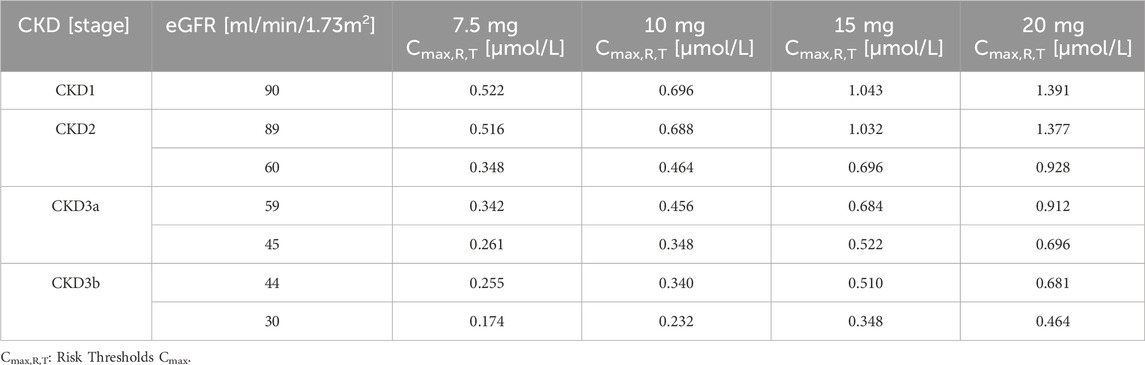
Table 2. Maximum plasma concentration risk thresholds for common oral medication regimens in people with mild to moderate CKD.
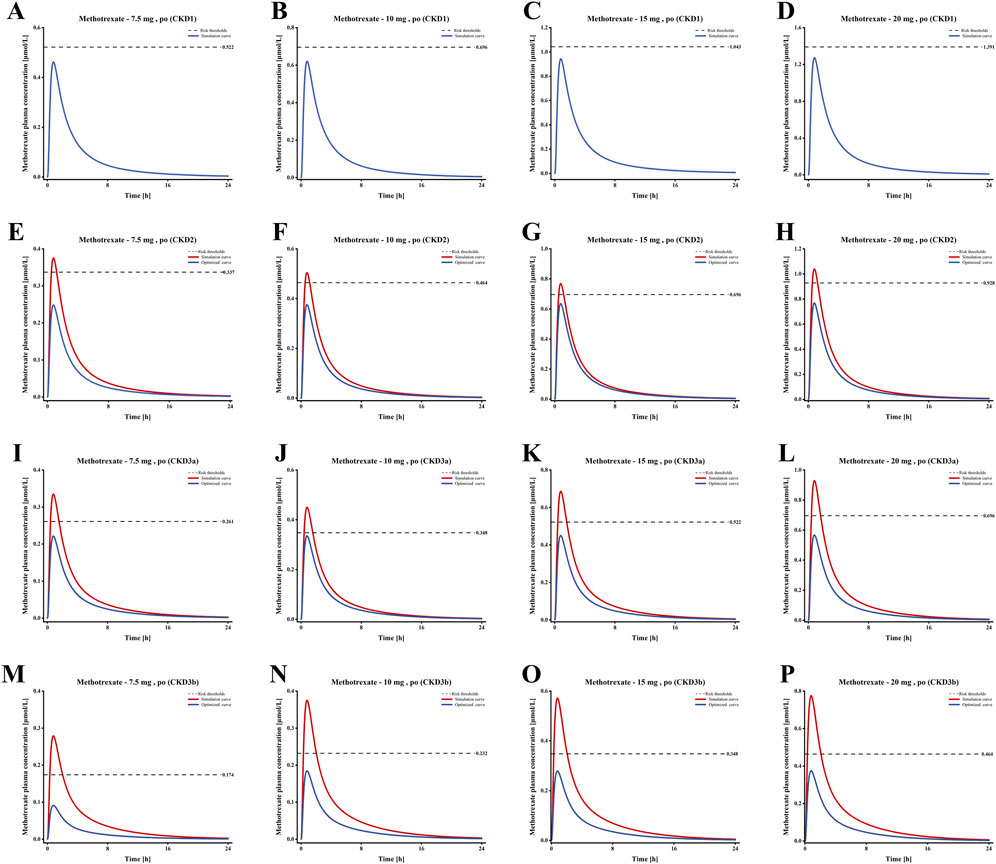
Figure 7. Plasma concentration time profiles of MTX in populations with different Stages of CKD. (A–D) Plasma concentration-time profiles under standard dosing regimens for Stage 1 CKD; (E–H) Plasma concentration-time profiles under standard dosing regimens and optimized dosing regimens for Stage 2 CKD; (I–L) Plasma concentration-time profiles under standard dosing regimens and optimized dosing regimens for Stage 3a CKD; (M–P) Plasma concentration-time profiles under standard dosing regimens and optimized dosing regimens for Stage 3b CKD.
3.5 Optimization of low-dose methotrexate regimens for patients with CKD
Based on the simulation results shown in Figure 7, we optimized the MTX dosage for patients with CKD Stages 2–3b to reduce the risk of adverse reactions. The standard tablet dosage of 2.5 mg, as specified in the drug label, served as the baseline for these optimizations. The blue curve of E-P in Figure 7 shows the optimized blood drug concentration results, Table 3 presents the optimized oral dosage regimen, with the specific optimization details as follows: For patients with CKD Stage 2, the initial dosage was reduced by 2.5 mg (one tablet) to ensure that the maximum plasma concentration remained below the risk threshold; For patients with CKD Stage 3a, the initial regimens of 7.5 mg and 10 mg were adjusted to 5 mg and 7.5 mg, while the 15 mg and 20 mg regimens were modified to 10 mg and 12.5 mg; Similarly, for patients with CKD Stage 3b, the initial 7.5 mg and 10 mg regimens were reduced to 2.5 mg and 5 mg, and the 15 mg and 20 mg regimens to 7.5 mg and 10 mg, to maintain the peak plasma concentration below the risk threshold.
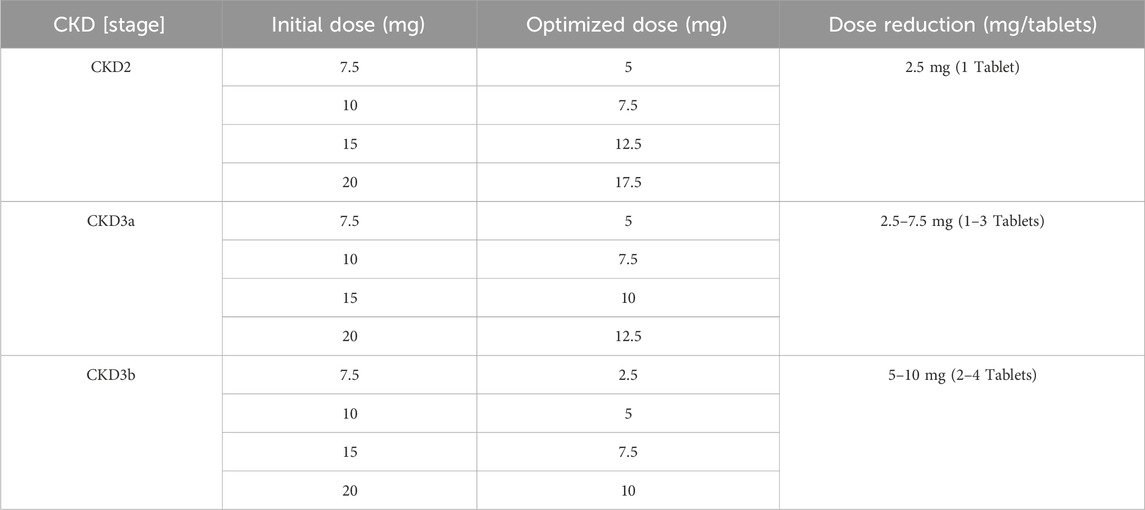
Table 3. Optimal dosage regimen for methotrexate in CKD.
4 Discussion
LD-MTX does not significantly exacerbate renal impairment, but impaired renal function reduces its excretion from the body, thereby increasing the risk of other adverse reactions (Sparks et al., 2021). Despite increasing research on LD-MTX in recent years, comprehensive evaluation protocols for LD-MTX in patients with renal impairment remain scarce, leaving a lack of reference information. By integrating pharmacovigilance data mining with pharmacokinetics based on a PBPK model, we have revealed the adverse reaction risks of LD-MTX in patients with renal impairment. Concurrently, we further explored the pharmacokinetic changes of MTX in renal impairment and proposed dose adjustment strategies. This provides a more precise reference for future clinical adjustments to LD-MTX oral dosage regimens.
A study conducted in 2021 indicated that MTX users with CKD may be at increased risk of hematological toxicity (Mitsuboshi, 2021). In another study of elderly CKD patients, those prescribed LD-MTX had a significantly increased risk of seeking medical attention within 90 days due to myelosuppression, sepsis, pulmonary toxicity, or hepatic toxicity (Muanda et al., 2023). Similarly, our pharmacovigilance signal results also confirmed that LD-MTX is closely associated with the risk of hematological toxicity, pulmonary toxicity, or hepatic toxicity, with renal impairment possibly playing an important role. We observed that since the Kidney Disease: Improving Global Outcomes (KDIGO) updated its clinical assessment guidelines for CKD in 2012 (Andrassy, 2013), there has been a significant increase in reports of adverse reactions to MTX in patients with renal impairment, notably accounting for two-thirds of all cases reported in the last 5 years. Therefore, many patients with MTX adverse reactions before 2012 may have had some degree of renal impairment that went undiagnosed. At the same time, the increase in reports in the past 5 years also reflects that many medical professionals have begun to pay attention to the adverse reactions of LD-MTX in patients with renal impairment. Further analysis of the population characteristics report for MTX revealed that the proportion of unknown doses in the MTX dose report once reached 60%. However, we must consider the inherent limitations of spontaneous reporting system studies. The assessment of MTX in patients with renal impairment usually requires dose adjustment based on the degree of renal impairment. However, the lack of key dose information in FAERS limits the evaluation of the relationship between dose and renal impairment. At the same time, cases of renal impairment identified in adverse reaction reports through diagnostic codes such as MedDRA high-level terms often lack accurate information on the stage of renal impairment, which makes it difficult to determine the relationship between the degree of renal impairment and adverse reactions. In addition, the reliability of case characteristic information is highly dependent on the completeness of the reporter’s records, and the missing dose information observed in this study further emphasizes the importance of completeness of records. Although many reports are submitted by professionals such as medical workers, given the spontaneous nature of the data, the possibility of incomplete or even misidentified information must be taken into account. Finally, even though adverse reaction signals in FAERS can point to potential risk concerns, there’s no corresponding control group data for adverse reactions, so these results need to be explored through rigorously designed confirmatory research to verify the relationship between actual clinical risk characteristics and related factors.
In recent years, while a comprehensive monitoring system exists for high-dose methotrexate adverse reactions (Howard et al., 2016), low-dose methotrexate assessment is frequently overlooked. A study has shown that the monitoring frequency for patients using LD-MTX is significantly lower than the recommended frequency (Mazaud and Fardet, 2021). Meanwhile, when patients present with multiple clinical risk factors, particularly renal impairment, regular monitoring of MTX blood levels is essential; otherwise, even LD-MTX may lead to serious adverse reactions (Yan et al., 2024). MTX is primarily excreted through the kidneys, so changes in kidney function are associated with an increased risk of MTX adverse reactions (Widemann and Adamson, 2006). PBPK models simulate the pharmacokinetic changes of MTX in patients with renal impairment to adjust dosage regimens and reduce adverse reaction risks.Although Wang et al. also developed a PBPK model for MTX use in rheumatoid arthritis patients (Wang et al., 2025), this study did not elaborate on the role of MTX transporters in renal metabolism. Furthermore, studies indicate that adverse reactions to MTX primarily stem from the parent drug rather than its metabolites (Hamed et al., 2025). This is further supported by Buchen et al.'s research, which demonstrated that carboxypeptidase G2 alleviates MTX parent drug toxicity in patients with renal impairment (Buchen et al., 2005). Therefore, elucidating the renal transport mechanisms of MTX is particularly crucial. This study provides a detailed description of the renal transport mechanisms of MTX, which served as the foundation for successfully establishing a PBPK model for MTX. Meanwhile, both the MRD and GMFE values were less than 2, indicating that the model possesses good predictive performance. Research indicates that the vast majority of MTX is excreted unchanged in urine, among which renal tubular secretion accounts for 60%–80% of MTX renal excretion. Through organic anion transporters (OAT3), reduced folate carrier (RFC1) and multidrug resistance-associated proteins (BCRP, MRP4) transport MTX from the blood to the renal tubule lumen. At the same time, renal tubule function plays an important role in the excretion of endogenous substances in CKD patients (Risso et al., 2019; Christophidis et al., 1981). We adjusted the concentrations of tubular-associated proteins based on the INH hypothesis, while incorporating partial hepatic metabolism and biliary excretion to simulate non-renal MTX clearance. Based on a healthy individual model, we supplemented the investigation of dosage risks associated with MTX use in CKD populations by simulating MTX dosing regimens for CKD patients at different stages. Although individuals in different populations may respond differently to LD-MTX, determining a reasonable risk threshold is crucial. Although Shoda et al. inferred that 0.16 μmol/L is the critical concentration for increased adverse reactions to MTX in individuals with normal renal function (Shoda et al., 2007), this threshold is a statistical threshold and cannot be used as a clinical diagnostic criterion. Therefore, defining the risk threshold for LD-MTX remains a significant challenge. Given that KDIGO recommends adjusting the dose of renally excreted drugs based on eGFR, and since MTX primarily relies on renal clearance, we attempted to combine this threshold, drug dose, and CKD stage. We used the RCS model to derive the nonlinear relationship between MTX Cmax and dose (Desquilbet and François, 2010), reverse-engineered the safe baseline dose of 0.16 μmol/L, and then scaled up this threshold by setting a dose ratio based on the baseline dose. We hypothetically set the dynamic risk threshold for CKD (Equation 7), and this threshold was reasonably optimized and adjusted in the PBPK model.The FDA recommends reducing or discontinuing MTX in patients with renal impairment and monitoring blood drug concentrations. However, there is no clear guidance on how to reduce the dose or discontinue the medication. The PBPK simulation results in this study indicate that, starting from stage 2 CKD, the use of LD-MTX at conventional doses carries a certain risk of adverse reactions. Previous reports on adverse reactions caused by LD-MTX in the CKD population support these simulation results (Muanda et al., 2023; Sparks et al., 2021). Additionally, we modified dosage regimens for CKD stages 2–3b using risk thresholds and the PBPK model to mitigate adverse reaction risks. Nevertheless, in practical application, the CKD model in this research still has some aspects that require further attention. Firstly, the model is constructed based on theoretical deduction and has certain theoretical guidance significance. But due to the current lack of sufficient clinical data to comprehensively verify its applicability in the CKD population, we are currently unable to conduct a complete empirical evaluation. Second, the activity and expression levels of transporters may vary significantly among individuals and disease states. For specific transporters (RFC1, MRP4), assessing non-linear declines across CKD stages and accurately simulating MTX pharmacokinetics remain challenging. Therefore, while PBPK models can provide quantitative predictions, their outcomes depend on assumptions and parameters, requiring further experimental and clinical validation. In summary, the pharmacovigilance-PBPK combined analysis in this study indicates that LD-MTX carries a risk of adverse reactions in patients with mild to moderate renal impairment. Blood monitoring and dose adjustment are recommended during its use.
5 Conclusion
In this study, analysis of the FAERS database first indicated that low-dose methotrexate use in patients with renal impairment may lead to hematologic disorders, hepatic impairment, and pulmonary and joint-related adverse reactions. Secondly, the established PBPK model successfully predicted plasma concentration distribution of methotrexate in healthy individuals and further supplemented dose-risk assessment for methotrexate use in CKD populations. PBPK simulation results indicate that conventional oral dosing regimens of methotrexate carry a certain risk of adverse reactions starting from stage 2 CKD. Oral dose optimization based on the drug label is recommended, with the following specific optimization schemes: For CKD stage 2, reduce the initial dose by 2.5 mg across all initial dosing regimens; For CKD stage 3a, the initial 7.5 mg and 10 mg regimens are adjusted to 5 mg and 7.5 mg, and the initial 15 mg and 20 mg regimens are adjusted to 10 mg and 12.5 mg; For CKD stage 3b, the initial 7.5 mg and 10 mg regimens are adjusted to 2.5 mg and 5 mg, and the initial 15 mg and 20 mg regimens are adjusted to 7.5 mg and 10 mg.
Data availability statement
The original contributions presented in the study are included in the article/Supplementary Material, further inquiries can be directed to the corresponding author.
Author contributions
LZ: Conceptualization, Data curation, Formal Analysis, Investigation, Methodology, Software, Supervision, Validation, Writing – original draft, Writing – review and editing. JL: Conceptualization, Investigation, Methodology, Validation, Writing – review and editing. XW: Data curation, Investigation, Methodology, Supervision, Validation, Writing – review and editing. YZ: Formal Analysis, Methodology, Project administration, Supervision, Validation, Writing – review and editing. SG: Formal Analysis, Project administration, Validation, Writing – review and editing. DD: Formal Analysis, Project administration, Resources, Validation, Visualization, Writing – review and editing. YZ: Formal Analysis, Project administration, Resources, Visualization, Writing – review and editing. SY: Conceptualization, Formal Analysis, Investigation, Methodology, Project administration, Resources, Supervision, Validation, Visualization, Writing – original draft, Writing – review and editing.
Funding
The author(s) declare that no financial support was received for the research and/or publication of this article.
Acknowledgements
We would like to acknowledge Bayer Technical Services for providing academic licenses for the PK-Sim® software packages used in this research. We also acknowledge FAERS for providing open data and Discacciati et al. (2025) for providing RCS case support.
Conflict of interest
The authors declare that the research was conducted in the absence of any commercial or financial relationships that could be construed as a potential conflict of interest.
Generative AI statement
The author(s) declare that no Generative AI was used in the creation of this manuscript.
Any alternative text (alt text) provided alongside figures in this article has been generated by Frontiers with the support of artificial intelligence and reasonable efforts have been made to ensure accuracy, including review by the authors wherever possible. If you identify any issues, please contact us.
Publisher’s note
All claims expressed in this article are solely those of the authors and do not necessarily represent those of their affiliated organizations, or those of the publisher, the editors and the reviewers. Any product that may be evaluated in this article, or claim that may be made by its manufacturer, is not guaranteed or endorsed by the publisher.
Supplementary material
The Supplementary Material for this article can be found online at: https://www.frontiersin.org/articles/10.3389/fphar.2025.1703557/full#supplementary-material
References
Andrassy, K. M. (2013). Comments on ‘KDIGO 2012 clinical practice guideline for the evaluation and management of chronic kidney disease. Kidney Int. 84 (3), 622–623. doi:10.1038/ki.2013.243
Bone, A., and Houck, K. (2017). The benefits of data mining. eLife 6 (August), e30280. doi:10.7554/eLife.30280
Bricker, N. S. (1969). On the meaning of the intact nephron hypothesis. Am. J. Med. 46 (1), 1–11. doi:10.1016/0002-9343(69)90053-9
Britz, H., Hanke, N., Taub, M. E., Wang, T., Prasad, B., Fernandez, É., et al. (2020). Physiologically based pharmacokinetic models of probenecid and furosemide to predict transporter mediated drug-drug interactions. Pharm. Res. 37 (12), 250. doi:10.1007/s11095-020-02964-z
Buchen, S., Ngampolo, D., Melton, R. G., Hasan, C., Zoubek, A., Henze, G., et al. (2005). Carboxypeptidase G2 rescue in patients with methotrexate intoxication and renal failure. Br. J. Cancer 92 (3), 480–487. doi:10.1038/sj.bjc.6602337
Chen, Z.-S., Lee, K., Walther, S., Raftogianis, R. B., Kuwano, M., Zeng, H., et al. (2025). Analysis of methotrexate and folate transport by multidrug resistance protein 4 (ABCC4).
Christophidis, N., Louis, W. J., Lucas, I., Moon, W., and Vajda, F. J. (1981). Renal clearance of methotrexate in man during high-dose oral and intravenous infusion therapy. Cancer Chemother. Pharmacol. 6 (1), 59–64. doi:10.1007/BF00253011
Desquilbet, L., and François, M. (2010). Dose-response analyses using restricted cubic spline functions in public health research. Statistics Med. 29 (9), 1037–1057. doi:10.1002/sim.3841
Discacciati, A., Palazzolo, M. G., Park, J.-G., Melloni, G. E. M., Murphy, S. A., and Bellavia, A. (2025). Estimating and presenting non-linear associations with restricted cubic splines. Int. J. Epidemiol. 54 (4), dyaf088. doi:10.1093/ije/dyaf088
Grim, J., Chládek, J., and Martínková, J. (2003). Pharmacokinetics and pharmacodynamics of methotrexate in non-neoplastic diseases. Clin. Pharmacokinet. 42 (2), 139–151. doi:10.2165/00003088-200342020-00003
Hamed, K. M., Dighriri, I. M., Baomar, A. F., Alharthy, B. T., Alenazi, F. E., Alali, G. H., et al. (2025). Overview of methotrexate toxicity: a comprehensive literature review. Cureus 14 (9). doi:10.7759/cureus.29518
Hill, N. R., Fatoba, S. T., Oke, J. L., Hirst, J. A., O'Callaghan, C. A., Lasserson, D. S., et al. (2016). Global prevalence of chronic kidney disease – a systematic review and meta-analysis. PLoS ONE 11 (7), e0158765. doi:10.1371/journal.pone.0158765
Howard, S. C., McCormick, J., Pui, C.-H., Buddington, R. K., and Donald Harvey, R. (2016). Preventing and managing toxicities of high-dose methotrexate. Oncol. 21 (12), 1471–1482. doi:10.1634/theoncologist.2015-0164
Hsueh, C.-H., Hsu, V., Zhao, P., Zhang, L., Giacomini, Km, and Huang, S.-M. (2018). PBPK modeling of the effect of reduced kidney function on the pharmacokinetics of drugs excreted renally by organic anion transporters. Clin. Pharmacol. and Ther. 103 (3), 485–492. doi:10.1002/cpt.750
Huls, M., Brown, C. D. A., Windass, A. S., Sayer, R., van den Heuvel, J. J. M. W., Heemskerk, S., et al. (2008). The breast cancer resistance protein transporter ABCG2 is expressed in the human kidney proximal tubule apical membrane. Kidney Int. 73 (2), 220–225. doi:10.1038/sj.ki.5002645
Ivanyuk, A., Livio, F., Biollaz, J., and Buclin, T. (2017). Renal drug transporters and drug interactions. Clin. Pharmacokinet. 56 (8), 825–892. doi:10.1007/s40262-017-0506-8
Jiang, M., Wu, Y., Shah, A., Priyanka, P., Denny, J. C., and Xu, H. (2014). Extracting and standardizing medication information in clinical text – the MedEx-UIMA system. AMIA Summits Transl. Sci. Proc. 2014 (April) 2014, 37–42.
Khaleel, M. A., Khan, A. H., Ghadzi, S. M. S., Adnan, A. S., and Abdallah, Q. M. (2022). A standardized dataset of a spontaneous adverse event reporting system. Healthcare 10 (3), 420. doi:10.3390/healthcare10030420
Kuepfer, L., Niederalt, C., Wendl, T., Schlender, J. F., Willmann, S., Lippert, J., et al. (2016). Applied concepts in PBPK modeling: how to build a PBPK/PD model. CPT Pharmacometrics and Syst. Pharmacol. 5 (10), 516–531. doi:10.1002/psp4.12134
Maksimovic, V., Pavlovic-Popovic, Z., Vukmirovic, S., Cvejic, J., Mooranian, A., Al-Salami, H., et al. (2020). Molecular mechanism of action and pharmacokinetic properties of methotrexate. Mol. Biol. Rep. 47 (6), 4699–4708. doi:10.1007/s11033-020-05481-9
Malik, P. R. V., Yeung, C. H. T., Ismaeil, S., Advani, U., Djie, S., and Edginton, A. N. (2020). A physiological approach to pharmacokinetics in chronic kidney disease. J. Clin. Pharmacol. 60 (S1), S52–S62. doi:10.1002/jcph.1713
Mazaud, C., and Fardet, L. (2021). Daily practices regarding safety monitoring of low-dose methotrexate and comparison to guidelines: a population-based cohort study. Therapies 76 (5), 425–433. doi:10.1016/j.therap.2019.05.004
Mitsuboshi, S. (2021). Risk of haematological events and preventive effect of folic acid in methotrexate users with chronic kidney disease and rheumatoid arthritis: analysis of the Japanese adverse drug event report database. Br. J. Clin. Pharmacol. 87 (5), 2286–2289. doi:10.1111/bcp.14641
Morris, R., Ali, R., and Cheng, F. (2024). Drug repurposing using FDA adverse event reporting system (FAERS) database. Curr. Drug Targets 25 (7), 454–464. doi:10.2174/0113894501290296240327081624
Muanda, F. T., Blake, P. G., Weir, M. A., Ahmadi, F., McArthur, E., Sontrop, J. M., et al. (2023). Low-dose methotrexate and serious adverse events among older adults with chronic kidney disease. JAMA Netw. Open 6 (11), e2345132. doi:10.1001/jamanetworkopen.2023.45132
Noguchi, Y., Tachi, T., and Teramachi, H. (2021). Detection algorithms and attentive points of safety signal using spontaneous reporting systems as a clinical data source. Briefings Bioinforma. 22 (6), bbab347. doi:10.1093/bib/bbab347
Obrador, G. T., and Levin, A. (2019). CKD hotspots: challenges and areas of opportunity. Seminars Nephrol. 39 (3), 308–314. doi:10.1016/j.semnephrol.2019.02.009
Research, Center for Drug Evaluation and (2024). Pharmacokinetics in patients with impaired renal function — study design, data analysis, and impact on dosing. FDA. Available online at: https://www.fda.gov/regulatory-information/search-fda-guidance-documents/pharmacokinetics-patients-impaired-renal-function-study-design-data-analysis-and-impact-dosing July 29.
Risso, M. A., Sallustio, S., Sueiro, V., Bertoni, V., Gonzalez-Torres, H., and Musso, C. G. (2019). The importance of tubular function in chronic kidney disease. Int. J. Nephrol. Renovascular Dis. 12 (December), 257–262. doi:10.2147/IJNRD.S216673
Shoda, H., Inokuma, S., Yajima, N., Tanaka, Y., Oobayashi, T., and Setoguchi, K. (2007). Higher maximal serum concentration of methotrexate predicts the incidence of adverse reactions in Japanese rheumatoid arthritis patients. Mod. Rheumatol. 17 (4), 311–316. doi:10.1007/s10165-007-0582-y
Solomon, D. H., Glynn, R. J., Karlson, E. W., Lu, F., Corrigan, C., Colls, J., et al. (2020). Adverse effects of low-dose methotrexate: a randomized trial. Ann. Intern. Med. 172 (6), 369–380. doi:10.7326/M19-3369
Sparks, J. A., Vanni, K. M. M., Sparks, M. A., Xu, C., Santacroce, L. M., Glynn, R. J., et al. (2021). Effect of low-dose methotrexate on eGFR and kidney adverse events: a randomized clinical trial. J. Am. Soc. Nephrol. 32 (12), 3197–3207. doi:10.1681/ASN.2021050598
Takeda, M., Khamdang, S., Narikawa, S., Kimura, H., Hosoyamada, M., Cha, S. H., et al. (2002). Characterization of methotrexate transport and its drug interactions with human organic anion transporters. J. Pharmacol. Exp. Ther. 302 (2), 666–671. doi:10.1124/jpet.102.034330
Torres, R. P., Pimentel Santos, F., and Branco, J. C. (2022). Methotrexate: implications of pharmacogenetics in the treatment of patients with rheumatoid arthritis. ARP Rheumatol. 1 (3), 225–229.
Trillenberg, P., Sprenger, A., and Machner, B. (2023). Sensitivity and specificity in signal detection with the reporting odds ratio and the information component. Pharmacoepidemiol. Drug Saf. 32 (8), 910–917. doi:10.1002/pds.5624
Uwai, Y., and Iwamoto, K. (2010). Transport of aminopterin by human organic anion transporters hOAT1 and hOAT3: comparison with methotrexate. Drug Metabolism Pharmacokinet. 25 (2), 163–169. doi:10.2133/dmpk.25.163
Uwai, Y., Taniguchi, R., Motohashi, H., Saito, H., Okuda, M., and Inui, K.-ichi (2004). Methotrexate-loxoprofen interaction: involvement of human organic anion transporters hOAT1 and hOAT3. Drug Metabolism Pharmacokinet. 19 (5), 369–374. doi:10.2133/dmpk.19.369
Vaidya, S. R., and Aeddula, N. R. (2025). “Chronic kidney disease,” in StatPearls (Treasure Island (FL): StatPearls Publishing). Available online at: http://www.ncbi.nlm.nih.gov/books/NBK535404/.
Wang, Y., Zhao, R., Russell, R. G., and Goldman, I. D. (2001). Localization of the murine reduced folate carrier as assessed by immunohistochemical analysis. Biochimica Biophysica Acta (BBA) - Biomembr. 1513 (1), 49–54. doi:10.1016/S0005-2736(01)00340-6
Wang, W., Zhou, H., and Liu, L. (2018). Side effects of methotrexate therapy for rheumatoid arthritis: a systematic review. Eur. J. Med. Chem. 158 (October), 502–516. doi:10.1016/j.ejmech.2018.09.027
Wang, X., Wu, J., Ye, H., Zhao, X., and Zhu, S. (2025). Comprehensive parent-metabolite PBPK/PD modeling insights into methotrexate personalized dosing strategies in patients with rheumatoid arthritis. CPT Pharmacometrics and Syst. Pharmacol. 14 (4), 695–705. doi:10.1002/psp4.13305
Weinblatt, M. E. (1985). Toxicity of low dose methotrexate in rheumatoid arthritis. J. Rheumatology 12 (Suppl. 12), 35–39.
Weinblatt, M. E. (2013). Methotrexate in rheumatoid arthritis: a quarter century of development. Trans. Am. Clin. Climatol. Assoc. 124, 16–25.
Widemann, B. C., and Adamson, P. C. (2006). Understanding and managing methotrexate nephrotoxicity. Oncol. 11 (6), 694–703. doi:10.1634/theoncologist.11-6-694
Wright, N. J., Fedor, J. G., Zhang, H., Jeong, P., Suo, Y., Yoo, J., et al. (2022). Methotrexate recognition by the human reduced folate carrier SLC19A1. Nature 609 (7929), 1056–1062. doi:10.1038/s41586-022-05168-0
Yan, Q., Lei, H., Gong, T., Liu, R., and Xiang, L. (2024). Delayed low-dose methotrexate excretion in a rheumatoid arthritis patient: a case report and literature review. Medicine 103 (4), e37070. doi:10.1097/MD.0000000000037070
Keywords: low-dose methotrexate, pharmacovigilance, physiologically based pharmacokinetic model, renal impairment, chronic kidney disease
Citation: Zhang L, Li J, Wang X, Zhang Y, Gao S, Dong D, Zhu Y and Yang S (2025) Low-dose methotrexate adverse reaction risk in renal impairment: pharmacovigilance and physiological pharmacokinetic model assessment. Front. Pharmacol. 16:1703557. doi: 10.3389/fphar.2025.1703557
Received: 11 September 2025; Accepted: 21 October 2025;
Published: 06 November 2025.
Edited by:
Zhihao Liu, Resolian, United StatesReviewed by:
Alejandra Luquita, Universidad Nacional de Rosario, ArgentinaXiaomei Yang, University of Maryland, United States
Copyright © 2025 Zhang, Li, Wang, Zhang, Gao, Dong, Zhu and Yang. This is an open-access article distributed under the terms of the Creative Commons Attribution License (CC BY). The use, distribution or reproduction in other forums is permitted, provided the original author(s) and the copyright owner(s) are credited and that the original publication in this journal is cited, in accordance with accepted academic practice. No use, distribution or reproduction is permitted which does not comply with these terms.
*Correspondence: Shilei Yang, eWFuZ3NoaV9sZWlAMTYzLmNvbQ==