 Yifei Weng1†
 Rongfeng Qi1†
 Feng Chen2†Jun Ke1,3Qiang Xu1Yuan Zhong1Lida Chen4Jianjun Li2
 Zhiqiang Zhang1*Li Zhang4*
 Guangming Lu1*
- 1Department of Medical Imaging, Jinling Hospital, Medical School of Nanjing University, Nanjing, China
- 2Department of Radiology, People's Hospital of Hainan Province, Haikou, China
- 3Department of Radiology, The First Affiliated Hospital of Suzhou University, Suzhou, China
- 4Key Laboratory of Psychiatry and Mental Health of Hunan Province, Mental Health Institute, Second Xiangya Hospital, National Technology Institute of Psychiatry, Central South University, Changsha, China
The abnormal brain activity is a pivotal condition for the occurrence of posttraumatic stress disorder. However, the dynamic time features of intrinsic brain activities still remain unclearly in PTSD patients. Our study aims to perform the resting-state lag analysis (RS-LA) method to explore potential propagated patterns of intrinsic brain activities in PTSD patients. We recruited 27 drug-naive patients with PTSD, 33 trauma-exposed controls (TEC), and 30 demographically matched healthy controls (HC) in the final data statistics. Both RS-LA and conventional voxel-wise functional connectivity strength (FCS) methods were employed on the same dataset. Then, Spearman correlation analysis was conducted on time latency values of those abnormal brain regions with the clinical assessments. Compared with HC group, the time latency patterns of PTSD patients significantly shifted toward later in posterior cingulate cortex/precuneus, middle prefrontal cortex, right angular, and left pre- and post-central cortex. The TEC group tended to have similar time latency in right angular. Additionally, significant time latency in right STG was found in PTSD group relative to TEC group. Spearman correlation analysis revealed that the time latency value of mPFC negatively correlated to the PTSD checklist-civilian version scores (PCL_C) in PTSD group (r = −0.578, P < 0.05). Furthermore, group differences map of FCS exhibited parts of overlapping areas with that of RS-LA, however, less specificity in detecting PTSD patients. In conclusion, apparent alterations of time latency were observed in DMN and primary sensorimotor areas of PTSD patients. These findings provide us with new evidence to explain the neural pathophysiology contributing to PTSD.
Introduction
Posttraumatic stress disorder (PTSD) is one of the most prevalent psychiatric disorders after suffering from severe traumatic events. The major recurrent symptoms including intrusion, avoidance, and hyper-vigilance may seriously impair the ability to get involved in social activities (1). It has been commonly recognized that the disorganized functional neural system played a crucial role in the impairments of fear learning, threat detection, executive function, and emotional modulation in PTSD patients (2). The human brain is a highly ordered dynamic system with ongoing neural activity and rapidly altered neural interaction. Each brain regions or networks serving different functions tend to be active in turn rather than at the same time (3). In the existent literature, the effects of temporal propagation patterns in PTSD are rarely discussed (4). Accordingly, our further research considering propagation patterns of brain activities would be very instructive for thoroughly understanding the neural substrates of PTSD.
The resting-state functional MRI (rs-fMRI) is a straightforward and efficient technique to measure the brain activities. There was adequate evidence across multi-model rs-fMRI studies demonstrating abnormal brain activity in PTSD patients. The variable results have shown the abnormalities in regional areas (e.g., amygdala, insula, and ventromedial prefrontal cortex) (5, 6), inter-networks (6), and whole-brain topology properties (7, 8). Such conventional approaches, which are based on the assumption that functionally connected brain regions were of temporal synchronization, however, might have overlooked the dynamic information (9, 10). Recently, surveys such as that conducted by Garg (11–13) have observed the intrinsic spatiotemporally structured brain activity in mouse and human. Further researches also pointed out that the rs-fMRI data of human could be separated into several temporal function modes with organized reciprocal propagation patterns (14, 15). With the better understanding of spontaneous brain activities, the methods detecting resting-state functional brain dynamics start to draw the attention of neuroimaging scientists; especially, the clinical values of determining temporal latency changes has been highlighted in several diseases, such as localizing the lesions of stroke (16) and epilepsy patients (17).
The emerging data-driven resting-state lag analysis (RS-LA) method, developed by Mitra et al. (18, 19), could provide us with an efficient technique for analyzing the temporal latency at voxel-wise level. This computational approach has been widely used to delineate the temporal dimension of brain communication in both physiological and pathological conditions, including autism (20), epilepsy (21), asleep or awake adults and infants (22, 23). According to their previous reports, the changes in blood oxygen level dependent (BOLD) signal propagation could reflect neural activities, and the propagation structures are sensitive to reveal physiological changes and neural processes in spontaneous activity (15).
A healthy neural system is expected to accommodate the changes of internal or external conditions in real-time, wherefore shows the greater temporal variability compared with unhealthy one (4). Recent dynamic functional connectivity studies have unveiled the temporal variation reduction in PTSD patients (4, 24). We hypothesized that disordered communication between vulnerable brain regions or networks might contribute to the abnormalities in PTSD patients. Accordingly, it is considerate to take into account the dynamical changes of functional connectivity when investigating the underlying neural pathophysiology of PTSD.
In this study, we introduced RS-LA method to explore the temporal propagation patterns of brain activity in PTSD patients. The conventional rs-fMRI analysis was also applied to the same datasets so that it could provide comparison and supplement to the novel technique. A comprehensive understanding of the neural dynamics would make a difference in revealing the exact neuropathological mechanism of PTSD.
Methods
Subjects
In June 2014, Typhoon Rammasun struck Hainan Province and caused at least 14 deaths. More than a thousand people were trapped and almost drown in the worst hit area. From November 2014 to January 2015, we ultimately recruited 70 trauma-exposed survivors. This study was conducted according to the declaration of Helsinki and was granted permission by the ethics committee of Jinling Hospital, People's Hospital of Hainan Province and the Second Xiangya Hospital. Before the examination, all the participants did not undergo any anti-depressant or psychotherapy. The inclusion criteria of the current study were as followed: age 18–65 years; right-handedness; no use of psychiatric medication or substances abuse; without MR imaging contraindications. Subjects with any history of head trauma, loss of consciousness, long-term significant physical conditions, neurologic or psychiatric disorders except for depression and anxiety should be excluded. After considering the rigid requirements, we totally excluded 10 trauma-exposed subjects for failing to obtain complete imaging data (n = 3), excessive head movement (n = 3), brain infarction (n = 1), denture-artifacts (n = 2), and pregnancy (n = 1). Thirty demographically matched healthy controls (HC) without trauma-exposure were also enrolled in our study. Every participant provided written informed consent prior to MRI scan and neuropsychological assessments.
Psychometric Assessments
All the typhoon survivors were screened with PTSD checklist-civilian version (PCL_C) (25), a 17-item self-report instrument designed to assess symptoms of PTSD (26). Those subjects who PCL_C scored more than 35 were further administrated with Clinician-Administrated PTSD Scale (CAPS) to estimate the frequency and intensity of each sub-symptom including re-experience, avoidance, and hyper-vigilance (27). The remaining subjects scoring <30 were considered as the trauma-exposed controls (TECs). The comorbidities with other psychiatric disorders were confirmed via the Structured Clinical Interview for DSM-IV (28). Additionally, emotional assessments including Self-Rating Anxiety Scale (SAS) (29) and Self-Rating Depression Scale (SDS) (30) were conducted on all participants to estimate emotional status.
Data Acquisition
The resting-state functional MR imaging was acquired with a 3.0 Tesla MR scanner (Skyra, Siemens Medical Solutions, Erlangen, Germany) equipped with the standard head coil. Each subject was instructed to lay supine, rest, and keep his or her eyes closed with the head still during MRI scanning. Firstly, the routine diagnostic T1 weighted image and T2 fluid-attenuated inversion-recovery image acquisitions were conducted to rule out subjects with structural brain lesions. The resting-state fMRI data were then acquired using a single-shot, gradient-recalled echo planar imaging (250 volumes, repetition time [TR]/echo time [TE] = 2,000/30 ms, flip angle = 90°, image matrix = 64 × 64, FOV = 230 × 230 mm2, slice thickness = 3.6 mm, 35 axial slices with no intersection gap). Each volume was whole-brain coverage and aligning along the anterior-posterior commissure. Additionally, high-resolution T1-weighted 3-Dimension anatomical images were obtained in the sagittal orientation using a rapid gradient-echo sequence (TR/TE = 2000/1.97 ms, flip angle = 9°, image matrix = 256 × 256, FOV = 256 × 256 mm2, slice thickness = 1 mm, 176 slices).
Resting-State fMRI Data Preprocessed
Initial data preprocessing was conducted using the Data Processing Assistant for rs-fMRI advanced edition (DPARSFA, http://www.restfmri.net) (31) based on MATLAB (The Math Works, Inc., Natick, MA, USA) platform. The first 10 volumes of each fMRI data were removed for the signal equilibrium. Then, the subsequent procedures were performed on the remaining 240 volumes, including slice timing, realignment, and co-registered with the anatomical scan. The co-registered data was further segmented into gray matter, white matter (WM), and cerebrospinal fluid (CSF) and normalized into standard Montreal Neurological Institute (MNI) space with a final voxel size of 3 × 3 × 3 mm3. Additionally, preprocessing for temporal lagged analysis included spatial smoothing by convolution with an isotropic Gaussian kernel of 8 mm, removal of linear trends to correct for general signal drift and band-pass filtering (0.01–0.08 Hz) to reduce low-frequency noise (32, 33). The final set of nuisance covariates including the six head motion parameters, average signals from WM and CSF, and the time series averaged over the brain (34) were regressed. Moreover, we applied frame censoring to each group by using the DVARS (differentiated rms variance) measure (35) with a threshold of 0.5 % root mean square frame-to-frame intensity change (36). Therefore, the criteria removed 8.10 ± 2.79, 9.93 ± 3.16, and 4.36 ± 1.07% of frames per individual, respectively, in PTSD, TEC, and HC group. Subjects with < 195 frames should be excluded. There were no statistically significant differences in the amount of censored time points between groups. Lastly, de-noising was consequently conducted to improve “cosmetic” using a combination of strategies similar to previous studies (37–40).
Computation of Lag Between BOLD Time Series
Our method for computing lags between time series was according to previously published literature (19). Considering the temporal features of intrinsic brain activity in its latency structure (Supplementary Figure 1), we evaluated the lagged cross-covariance functions according to the following formula (19):
where τ represent the time lag. The value of τ where Cxixj (τ) exhibited an extremum defines the temporal lag between signals xi and xj. T is the interval of integration. BOLD time series are aperiodic (41). Accordingly, it would almost always generate a single, well-defined extremum when calculated by the cross-covariance functions, typically in the range ±1 s.
Voxels were defined by dividing the gray matter mask in atlas space into 6-mm isotropic cubic regions. Given the time series {x1(t), x2(t), …, xn(t)}, extracted from all voxels (n = 5,797 in current study), finding all τi, j corresponding to the extrema of Cxixj (τ) yields the antisymmetric, time-delay (TD) matrix:
Then, group level latency projections were obtained by calculating the projections that computed as the mean across the columns of TD matrix at subject level and then averaging. All the results were represented in three-dimensional image formats using the BrainNet Viewer (http://www.nitrc.org/projects/bnv/).
Besides, we evaluate the voxel-wise whole-brain functional connectivity strength (FCS) to offer a reference for comparison with the results of RS-LA. Conventional FCS was defined by computing the average functional connectivity between a given voxel and all other voxels in the brain (42). The procedures of data preprocessing were almost the same as RS-LA, except that data smoothing was implemented after the Pearson correlation coefficients were converted using Fisher r-to-z transformation. All the processes were calculated by using DPARSFA. Voxels with high FCS (> mean) were identified as functional hubs, which indicated that they were highly connected to the rest of the brain.
Statistical Analysis
SPSS 22.0 (SPSS INC, Chicago, IL, USA) was used to analyze the demographic and clinical data. The Chi-square test was applied to evaluate gender difference among three groups. Normally distributed material expressed as mean ± standard deviation was assessed by one-way analysis variance (ANOVA) and the homogeneity of variance in these data was examined by the Bartlett test. When the ANOVA analysis revealed significant differences, post-hoc analysis was employed for inter-group comparisons.
Due to the group differences in education level, RS-LA and FCS differences among the three groups were analyzed by using ANOVA with educational level as covariates, followed by post-hoc t-test to confirm the between-group differences. Regardless of the trauma effect, we also compared the group differences between PTSD patients and all control subjects with two-sample t test. The above analyses were respectively based on the Statistical non-Parametric Mapping software for RS-LA (SnPM13, http://warwick.ac.uk/snpm) and Statistical Parametric Mapping software for FCS (SPM8, http://www.fil.ion.ucl.ac.uk/spm/). All the maps were multiple compared and corrected with AlphaSim Program, with the threshold set at P < 0.01 and the voxel numbers of the cluster larger than 75, which corresponded to P < 0.05.
Finally, to investigate the association between latency structures and PTSD symptoms, the average latency values extracted from the clusters with significant lagged differences were correlated with the clinical measurements. Spearman correlation analysis with the significant level of P < 0.05 (two-tail test, Bonferroni corrected).
Result
Demographical and Clinical Characteristics
Ultimately, 27 drug-naïve patients with PTSD (48.41 ± 10.32 years; 7 males, 20 females), 33 TEC (48.45 ± 7.48 years, 7 males, 26 females), and 30 HC (49.87 ± 6.11 years, 7 males, 23 females) underwent data analysis. The detailed demographics and clinical characteristics are shown in Table 1. There were no group differences for age and gender distribution. However, the education level of HC group was higher than TEC and HC group. Besides, there were also significant differences of SAS and SDS among the three groups, which the scores in PTSD and TEC groups are much higher than HC group, and the scores of PTSD were also higher than TEC group.
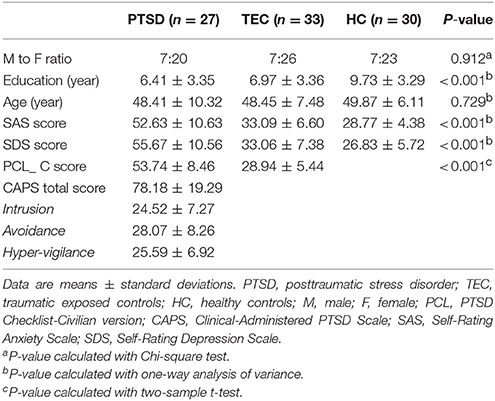
Table 1. Summary of demographic and clinical data.
Resting-State Lag Analysis
Latency projections results obtained from the PTSD, TEC, and HC group are displayed in Figure 1. All group level latency maps span 1 s between the earliest and latest brain regions. It exhibited that time latency pattern of the early and late brain structures were highly symmetrical and spatially distinct in each group. Additionally, we could found significant group differences among the three groups.
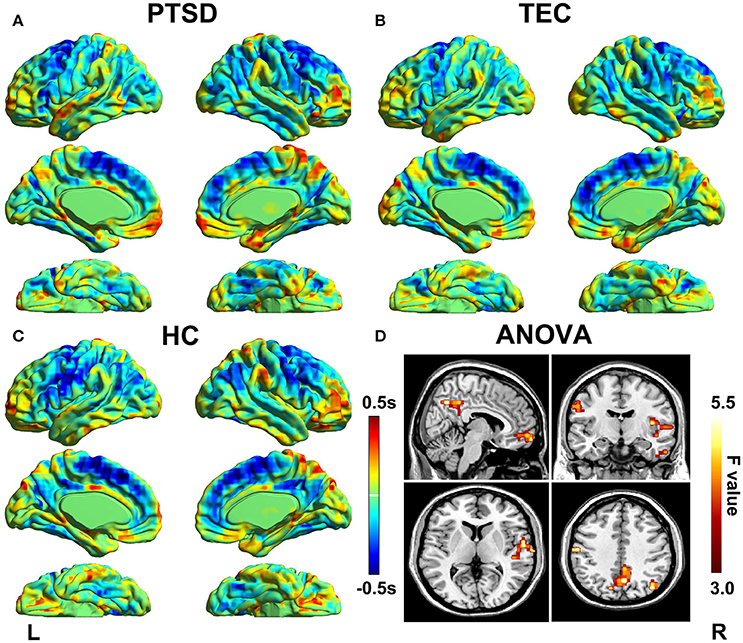
Figure 1. Lag projection maps in PTSD, TEC, and HC group and the ANOVA result. Maps (A–C) show the latency results of each group, which represent whether the cluster is on average earlier or later compared with the rest of the brain. The propagation of BOLD signal is measured on a time scale of ±0.5 s. Map (D) shows group differences in latency results among the three groups. Color in red indicates statistically significant clusters.
The group differences among three groups are showed in Table 2 and Figure 2, The changes in time latency of PTSD patients were the prominent shift toward later in left superior temporal gyrus (STG), posterior cingulate cortex/precuneus (PCC/PCu), middle prefrontal cortex (mPFC), right angular, and left pre- and post-central cortices (Pre/PostCG). Most of these differences could be found when comparing the PTSD group with HC group, while only the STG was the exception as the result of comparison between PTSD and TEC group. Besides, we observed similar time latency in right angular in TEC group compared to HC group. There was no significant difference in brain regions with time latency shifting toward earlier among the two trauma groups.

Table 2. Brain regions show latency differences among the three groups.
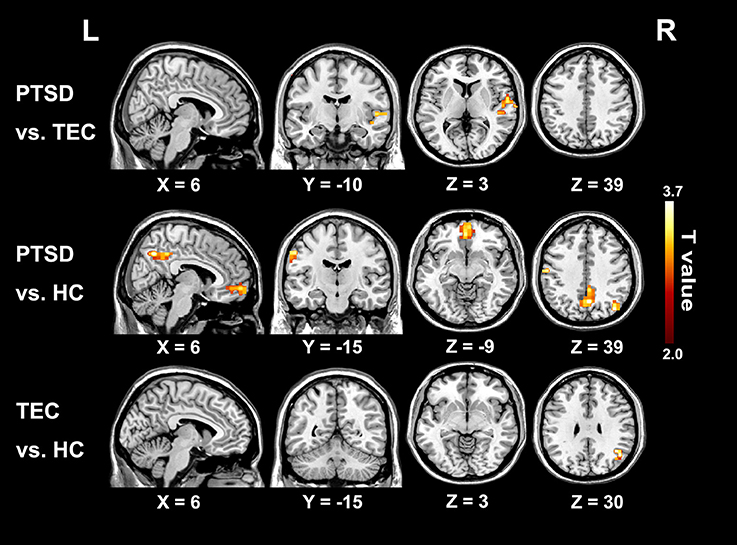
Figure 2. Significant differences in lag structure estimate between groups. Areas with significant group difference of RS-LA are in right superior temporal gyrus of PTSD group when compared to the TEC. When compared to the HC, the differences are in left pre- and post-central cortex, medial prefrontal cortex, posterior cingulate cortex/precuneus, and left angular. Lag structure difference in right angular can also be observed in the TEC group when compared with the HC group. There is no significant difference in brain regions with latency shifting toward earlier among the three groups.
Correlation Result
The time latency values with significant group differences were extracted and displayed in the form of bar chart at the group level (Figure 3A). The results of correlations between clinical measurements and RS-LA values of all significant clusters in both PTSD and TEC were reported in the Supplementary Table 1. In PTSD group, our further analysis found negative correlation between the time latency values of mPFC and the PCL_C scores (r = −0.578, P = 0.002 < 0.05, Figure 3B), which is absence in the TEC group (r = 0.030, P = 0.868).
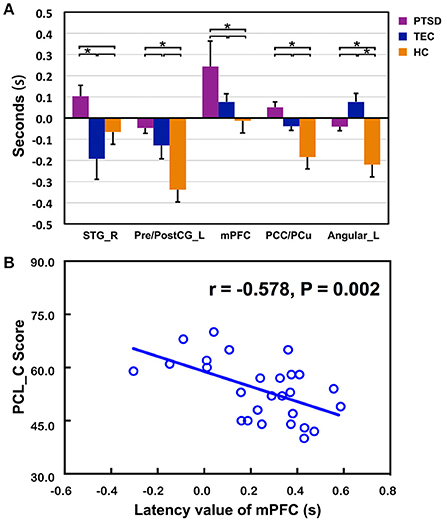
Figure 3. Comparisons of latency values in the region with group differences among the three groups and the significant correlation with clinical assessments. (A) Displays detailed latency values of each group in the form of a bar chart. R, Right; L, Left; STG, superior temporal gyrus; Pre/PostCG, pre- and post-central gyrus; mPFC, medial prefrontal cortex; PCC/PCu, Posterior cingulate cortex; PCu, Precuneus; *Significant different (P < 0.05); error bar standard error of mean (SEM); (B) shows the significant correlation of time latency value of mPFC and the PCL_C scores in the PTSD group.
Resting-State Function Connectivity Strength
Conventional resting-state functional connectivity strength (RS-FCS) differences of the three groups are shown in Figure 4. In the PTSD group, visual inspection reveals aberrant brain hyper-activity in bilateral parahippocampus/hippocampus, as well as the hypo-activity in right middle and inferior frontal gyrus, PCC/PCu, middle cingulate cortex, bilateral cuneus, and left Pre/PostCG. It should be noted that most of these alterations could also be observed in the TEC group. Additionally, the noticeable brain regions of RS-LA and FCS comparison between PTSD patients and all controls did not show the specialness (Supplementary Figure 2).
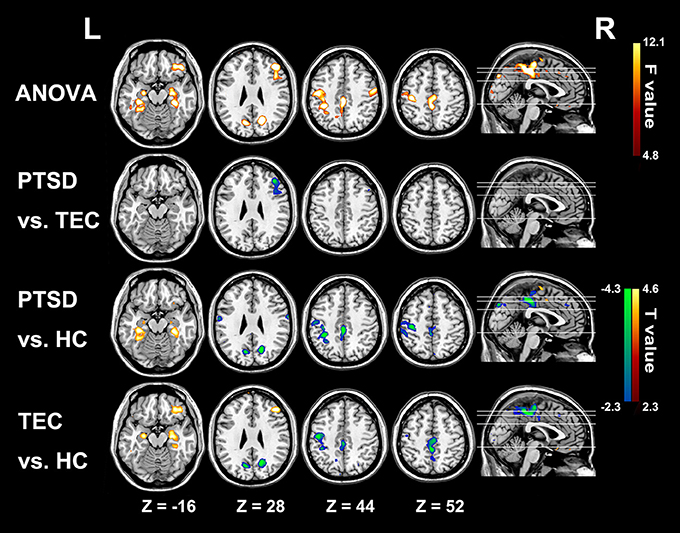
Figure 4. Significant group differences results of functional connectivity strength among the three groups. In the PTSD group, significant increased functional connectivity strength regions mainly distribute in bilateral parahippocampus/hippocampus; and the hypo-activity regions are in right middle and inferior frontal gyrus, PCC/PCu, middle cingulate cortex, bilateral cuneus, and left Pre/PostCG. Most of these alterations can also be observed in the TEC group. Colors in red and blue respectively indicate significant increase and decrease in the post-hoc statistical result.
Discussion
In the current study, by using RS-LA, we identified the lagging structures of intrinsic brain activities in PTSD patients. The disturbance of brain activities was not only involved in the inter-regional connectivity but the laggingly driven of the specific brain regions, mainly distributing in DMN and the primary sensorimotor areas. Time latency values of the mPFC negatively correlated with the severity of PTSD symptoms. Moreover, comparing with the conventional functional connectivity method, results of LA-RS appeared to be more complementary to describe the brain activity changes in PTSD patients. These observations are significant in shedding the light of potential relations between the structures with apparent time latency and the occurrence of PTSD.
The present study revealed predominant temporal postponement of mPFC, PCC/PCu and angular gyrus in PTSD group. These regions have been previously identified as major regions of DMN. The explanation for our results relies on the underlying neural physiological basis of lag structure. It has been speculated that the propagation of spontaneous low-frequency activity in lag structure might be concerned with the regional variation in time latency of either neurovascular coupling or transduction of neuronal activities into BOLD signals (19, 43). Numerous evidence has indicated that the DMN is a major locus of intrinsically propagated brain activity, which serves as the hub of neural information transmission and more susceptible under the neural pathological conditions (13, 44). The time latency values shifting toward later could be represented as the slower triggering and propagation of brain activity, as well as the disturbance of ordered brain activities. Accordingly, our observation of time latency differences in DMN is consistent with those pieces of literature that proposed DMN abnormalities in PTSD patients (6). DMN is a vital network responsible for the internal thought and autobiography memory (45, 46). The disorganization in DMN might give rise to severe consequences, such as dissociation symptoms, somatization, emotional disorders and self-perception dysfunction (47, 48). It was supported by our observation of the negative correlation between time latency values of mPFC and PTSD clinical measures.
Additionally, in PTSD group, the significant time latency of right STG was found compared with TEC group and that of the Pre/PostCG was also found relative to HC group. The structural abnormities in these regions have been widely reported, which mainly demonstrated increased gray matter density (49, 50). So far, many mechanisms have attached the importance to the role of brain structure in explaining how brain abnormalities propagation, which might be involved in vulnerability caused by particular co-expression of genes between certain regions, transneuronal spread of misfolded proteins along axonal pathways, and so on (51, 52). Accordingly, the correlation between anatomic changes and the lag structure alterations worth our future investigation. Recent evidence (53) has suggested that the disturbance of functional activities in STG and Pre/PostCG of PTSD patients correlated with the severity of subsequent symptoms at the early stage. The impairment in both two regions could be speculated to be responsible for the disturbance of trauma memory network in charge of its auditory memories combining with motor programs (53).
In RS-FCS result, we equally observed the abnormal activities in PCC/PCu and left Pre/PostCG gyrus in PTSD patients and TEC group. By contrast, our finding of time latency in these two regions was only observed in PTSD group, thus complementarily expressing that the lagged propagation of brain activities might be pertinent to the patients. Jin el al also found that PTSD patients with abnormal static connectivity would couple with altered temporal variability of connections (4). Especially, the aberrant static and dynamic brain activities in similar regions (i.e., Pre/PostCG) were found in the both researches. The similarities possibly help to explain why the temporal lag could only be observed in PTSD patients; nevertheless, more works are still needed to determine whether these intriguing correspondences are general in any way. Unexpectedly, the localization of PCC in FCS method was different from that in RS-LA, and the abnormalities of mPFC were confined to the RS-LA results. Concurrently, altered brain activities of bilateral hippocampus, the middle cingulate cortex, and the right middle and inferior frontal gyrus could be only found by FCS in both PTSD and TEC groups, but failed to be identified by RS-LA method. As for above-mentioned discrepancies, Mitra et al. has suggested that there is no simple relation between lag and static zero-lag temporal correlations (15, 18). Under the logical extreme circumstances, synchronous zero-lag functional connectivity contains no lags, while a system with a single set of lags is not synchronous (18, 54). Moreover, the two distinct time-scale methods can provide us information of functional neural segregation and integration: zero-lag functional connectivity can map separated functional area; and lag threads demonstrate how the distinct functional modules could be integrated over few seconds (55), although the exact physiology served by lag threads still remains unknown. In a word, these results remind us that diverse rather than single method should be taken into consideration when studying the exact neural pathology of PTSD.
Limitation
To our best knowledge, this is the first study employing RS-LA to investigate the dynamically intrinsic brain activity in PTSD patients. We included the traumatic controls experiencing the same trauma events to reduce the impact of interference factors. However, some limitations need to be acknowledged. Firstly, it should be regarded as a preliminary study because of the relatively small samples. Secondly, there are significant educational level differences among the three groups, and we regressed the educational effect as a covariate to minimize the influences. Thirdly, we only retrieved the clusters with significant group differences in lagged structures to focus on the latency patterns related to PTSD, while further discussion on static results is needed in our future works. Lastly, our exploration of the clinical correlates of altered lag structure is limited to the clinical assessments collected in the current study. More detailed and comprehensive clinical materials are required in the future.
Conclusion
In summary, we demonstrated that the time latency patterns related to the occurrence of PTSD. The altered propagation of BOLD signals markedly happened in DMN and primary sensorimotor regions. We also observed that the changes in some DMN regions might be associated with PTSD severity. Compared with conventional methods, these results detected by the novel technology provided evidence that aberrant propagation of brain activities would contribute to PTSD. Notably, further researches, especially with longitudinal designs, are still needed to confirm the potential value for clinical application.
Ethics Statement
This study was in accordance with the declaration of Helsinki, and was approved by the ethics committee of Jinling Hospital, People's Hospital of Hainan Province and the Second Xiangya Hospital of Central South University. All participants provided written informed consent after a detailed description of this study.
Author Contributions
YW was involved in the literature review, experimental design, data analysis and writing of the manuscript. RQ, FC, ZZ, and GL designed the study. JK, QX, and YZ analyzed the data. LC, JL, and LZ acquired the neuropsychological data, which all authors reviewed and approved for publication.
Conflict of Interest Statement
The authors declare that the research was conducted in the absence of any commercial or financial relationships that could be construed as a potential conflict of interest.
Acknowledgments
This work was supported by the grants from the National Nature Science Foundation of China [grant number 81671672, 81301209, 81301155, 81460261, 81201077, 81701669]; the Key science and technology project of Hainan Province [grant number ZDYF2016156]; the Chinese Key Grant [grant number BWS11J063, 10z026]; Jiangsu Provincial Medical Youth Talent [grant number QNRC2016888].
Supplementary Material
The Supplementary Material for this article can be found online at: https://www.frontiersin.org/articles/10.3389/fpsyt.2018.00218/full#supplementary-material
Supplementary Figure 1. We select a healthy sample, and then extracted the rs-fMRI signals of two major brain regions related to the results and calculated the cross-correlation coefficient to demonstrate how correlation changed with different time lags. (A) The sagittal plane shows the two major areas where we extract the rs-fMRI signals. (B) The lagged cross-correlation coefficient changes within a random repetition time. The extremum (yellow maker) shows the lag between corresponding time series and the coefficient. (C) Two hundred and forty seconds of sampled time series extracted from the brain regions.
Supplementary Figure 2. We perform the two-sample t-test analysis between the PTSD patients and all controls (TECs & HCs). For RS-LA result, the significant latency structure is found in mPFC. As for FCS, the significant increase is observed in bilateral parahippocampus; and the decrease is in right middle and inferior frontal gyrus, PCC/PCu, left cuneus and left Post CG. All the noticeable brain regions of RS-LA and FCS comparison between PTSD patients and all controls are included in the ANOVA results.
Supplementary Table 1. The results of lag values in all clusters with significant group differences correlate with clinical measurements.
References
1. Benjet C, Bromet E, Karam EG, Kessler RC, McLaughlin KA, Ruscio AM etal. The epidemiology of traumatic event exposure worldwide: results from the World Mental Health Survey Consortium. Psychol Med. (2016) 46:327–43. doi: 10.1017/S0033291715001981
2. Shalev A, Liberzon I, Marmar C. Post-traumatic stress disorder. N Engl J Med. (2017) 376:2459–69. doi: 10.1056/NEJMra1612499
3. Gilbert CD, Sigman M. Brain states: top-down influences in sensory processing. Neuron (2007) 54:677–96, doi: 10.1016/j.neuron.2007.05.019
4. Jin C, Jia H, Lanka P, Rangaprakash D, Li L, Liu T etal. Dynamic brain connectivity is a better predictor of PTSD than static connectivity. Human Brain Mapp. (2017) 38:4479–96. doi: 10.1002/hbm.23676
5. Disner SG, Marquardt CA, Mueller BA, Burton PC, Sponheim SR. Spontaneous neural activity differences in posttraumatic stress disorder: a quantitative resting-state meta-analysis and fMRI validation. Hum Brain Mapp. (2017) 32:837–50. doi: 10.1002/hbm.23886
6. Koch SB, van Zuiden M, Nawijn L, Frijling JL, Velman DJ, Olff M. Aberrant resting-state brain activity in posttraumatic stress disorder: a meta-analysis and systematic review. Depress Anxiety (2016) 33:592–605. doi: 10.1002/da.22478
7. Suo X, Lei D, Chen F, Wu M, Li L, Sun L etal. Anatomic insights into disrupted small-world networks in pediatric posttraumatic stress disorder. Radiology (2017) 282:826–34. doi: 10.1148/radiol.2016160907
8. Du MY, Liao W, Lui S, Huang XQ, Li F, Kuang WH etal. Altered functional connectivity in the brain default-mode network of earthquake survivors persists after 2 years despite recovery from anxiety symptoms. Soc Cogn Affect Neurosci. (2015) 10:1497–505. doi: 10.1093/scan/nsv040
9. Biswal BB, Mennes M, Zuo XN, Gohel S, Kelly C, Smith SM etal. Toward discovery science of human brain function. Proc Natl Acad Sci USA. (2010) 107:4734–39. doi: 10.1073/pnas.0911855107
10. Buckner RL, Krienen FM, Castellanos A, Diaz JC, Yeo BT. The organization of the human cerebellum estimated by intrinsic functional connectivity. J Neurophysiol. (2011) 106:2322–45. doi: 10.1152/jn.00339.2011
11. Sato TK, Nauhaus I, Carandini M. Traveling waves in visual cortex. Neuron (2012) 75:218–29. doi: 10.1016/j.neuron.2012.06.029
12. Majeed W, Magnuson M, Hasenkamp W, Schwarb H, Schumacher EH, Barsalou L etal. Spatiotemporal dynamics of low frequency BOLD fluctuations in rats and humans. Neuroimage (2011) 54:1140–50. doi: 10.1016/j.neuroimage.2010.08.030
13. Garg R, Cecchi GA, Rao AR. Full-brain auto-regressive modeling (FARM) using fMRI. Neuroimage (2011) 58:416–41. doi: 10.1016/j.neuroimage.2011.02.074
14. Smith SM, Miller KL, Moeller S, Xu J, Auerbach EJ, Woolrich MW etal. Temporally-independent functional modes of spontaneous brain activity. Proc Natl Acad Sci USA. (2012) 109:3131–6. doi: 10.1073/pnas.1121329109
15. Mitra A, Raichle ME. How networks communicate:propagation patterns in spontaneous brain activity. Philos Trans R Soc Lond B Biol Sci. (2016) 371:20150546. doi: 10.1098/rstb.2015.0546
16. Lv Y, Margulies DS, Cameron Craddock R, Long X, Winter B, Gierhake D etal. Identifying the perfusion deficit in acute stroke with resting-state functional magnetic resonance imaging. Ann Neurol. (2013) 73:136–140. doi: 10.1002/ana.23763
17. Xu Q, Zhang Z, Liao W, Xiang L, Yang F, Wang Z etal. Time-shift homotopic connectivity in mesial temporal lobe epilepsy. Am J Neuroadiol. (2014) 35:1746–52. doi: 10.3174/ajnr.A3934
18. Mitra A, Snyder AZ, Blazey T, Raichle ME. Lag threads organize the brain's intrinsic activity. Proc Natl Acad Sci USA. (2015) 112:E2235–44. doi: 10.1073/pnas.1503960112
19. Mitra A, Snyder AZ, Hacker CD, Raichle ME. Lag structure in resting-state fMRI. J Neurophysiol. (2014) 111:2374–91. doi: 10.1152/jn.00804.2013
20. Mitra A, Snyder AZ, Constantino JN, Raichle ME. The lag structure of intrinsic activity is focally altered in high functioning adults with autism. Cereb Cortex (2017) 27:1083–93. doi: 10.1093/cercor/bhv294
21. Shah MN, Mitra A, Goyal MS, Snyder AZ, Zhang J, Shimony JS etal. Resting state signal latency predicts laterality in pediatric medically refractory temporal lobe epilepsy. Childs Nerv Syst. (2018) 34:901–10. doi: 10.1007/s00381-018-3770-5
22. Mitra A, Snyder AZ, Tagliazucchi E, Laufs H, Elison J, Emerson RW. Resting-state fMRI in sleeping infants more closely resembles adult sleep than adult wakefulness. PLoS ONE (2017) 12:e0188122. doi: 10.1371/journal.pone.0188122
23. Mitra A, Snyder AZ, Tagliazucchi E, Laufs H, Raichle ME. Propagated infra-slow intrinsic brain activity reorganizes across wake and slow wave sleep. Elife (2015) 4:e10781. doi: 10.7554/eLife.10781
24. Li X, Zhu D, Jiang X, Jin C, Zhang X, Guo L etal. Dynamic functional connectomics signatures for characterization and differentiation of PTSD patients. Hum Brain Mapp. (2014) 35:1761–78. doi: 10.1002/hbm.22290
25. Weathers F, Litz B, Herman D, Huska J, Keane T. The PTSD Checklist-Civilian Version (PCL-C). Boston, MA: National Center for PTSD (1994).
26. Ruggiero KJ, Del Ben K, Scotti JR, Rabalais AE. Psychometric properties of the PTSD Checklist-Civilian Version. J Trauma Stress (2003) 16:495–502. doi: 10.1023/A:1025714729117
27. Weathers FW, Keane TM, Davidson JR. Clinician-administered PTSD scale: a review of the first ten years of research. Depress Anxiety (2001) 13:132–56. doi: 10.1002/da.1029
28. First M, Spitzer R, Gibbons M, Willianms J. Structured Clinical Interview for DSM-IV. New York, NY: Biometrics Research Department, New York State Psychiatric Institute (1995).
29. Zung WW. A rating instrument for anxiety disorders. Psychosomatics (1971) 12:371–79. doi: 10.1016/S0033-3182(71)71479-0
30. Zung WW. A self-rating depression scale. Arch Gen Psychiatry (1965) 12:63–70. doi: 10.1001/archpsyc.1965.01720310065008
31. Chao Gan Y, Yu Feng Z. DPARSF: A MATLAB toolbox for “Pipeline” data analysis of resting-state fMRI. Front Syst Neurosci. (2010) 4:13. doi: 10.3389/fnsys.2010.00013
32. Zuo XN, Di Martino A, Kelly C, Shehzad ZE, Gee DG, Klein DF etal. The oscillating brain: complex and reliable. Neuroimage (2010) 49:1432–45. doi: 10.1016/j.neuroimage.2009.09.037
33. Buzsaki G, Draguhn A. Neuronal oscillations in cortical networks. Science (2004) 304:1926–9. doi: 10.1126/science.1099745
34. Fox MD, Snyder AZ, Vincent JL, Corbetta M, Van Essen DC, Raichle ME. The human brain is intrinsically organized into dynamic, anticorrelated functional networks. Proc Natl Acad Sci USA. (2005) 102:9673–8. doi: 10.1073/pnas.0504136102
35. Smyser CD, Inder TE, Shimony JS, Hill JE, Degnan AJ, Snyder AZ etal. Longitudinal analysis of neural network development in preterm infants. Cereb Cortex (2010) 20:2852–62. doi: 10.1093/cercor/bhq035
36. Power JD, Barnes KA, Snyder AZ, Schlaggar BL, Petersen SE. Spurious but systematic correlations in functional connectivity MRI networks arise from subject motion. Neuroimage (2012) 59:2142–54. doi: 10.1016/j.neuroimage.2011.10.018
37. Bianciardi M, van Gelderen P, Duyn JH, Fukunaga M, de Zwart JA. Making the most of fMRI at 7 T by suppressing spontaneous signal fluctuations. Neuroimage (2009) 44:448–54. doi: 10.1016/j.neuroimage.2008.08.037
38. Giove F, Gili T, Iacovella V, Lacovella V, Macaluso E, Maraviglia B. Images-based suppression of unwanted global signals in resting-state functional connectivity studies. Magn Reson Imaging (2009) 27:1058–64. doi: 10.1016/j.mri.2009.06.004
39. Behzadi Y, Restom K, Liau J, Liu TT. A component based noise correction method (CompCor) for BOLD and perfusion based fMRI. Neuroimage (2007) 37:90–101. doi: 10.1016/j.neuroimage.2007.04.042
40. Chai XJ, Castanon AN, Ongur D, Whitfield-Gabrieli S. Anticorrelations in resting state networks without global signal regression. Neuroimage (2012) 59:1420–28. doi: 10.1016/j.neuroimage.2011.08.048
41. He BJ, Zempel JM, Snyder AZ, Raichle ME. The temporal structures and functional significance of scale-free brain activity. Neuron (2010) 66:353–69. doi: 10.1016/j.neuron.2010.04.020
42. Tomasi D, Shokri-Kojori E, Volkow ND. High-Resolution Functional Connectivity Density: Hub Locations, Sensitivity, Specificity, Reproducibility, and Reliability. Cereb Cortex (2016) 26:3249–59. doi: 10.1093/cercor/bhv171
43. Handwerker DA, Ollinger JM, D'Esposito M. Variation of BOLD hemodynamic responses across subjects and brain regions and their effects on statistical analyses. Neuroimage (2004) 21:1639–51. doi: 10.1016/j.neuroimage.2003.11.029
44. Deshpande G, Santhanam P, Hu X. Instantaneous and causal connectivity in resting state brain networks derived from functional MRI data. Neuroimage (2011) 54:1043–52. doi: 10.1016/j.neuroimage.2010.09.024
45. Mantini D, Perrucci MG, Del Gratta G, Romani GL, Corbetta M. Electrophysiological signatures of resting state networks in the human brain. Proc Natl Acad Sci USA. (2007) 104:13170–5. doi: 10.1073/pnas.0700668104
46. Raichle ME, MacLeod AM, Snyder AZ, Power WJ, Gusnard DA, Shulman GL. A default mode of brain function. Proc Natl Acad Sci USA. (2001) 98:676–82. doi: 10.1073/pnas.98.2.676
47. Greicius MD, Krasnow B, Reiss AL, Menon V. Functional connectivity in the resting brain: a network analysis of the default mode hypothesis. Proc Natl Acad Sci USA. (2003)100:253–8. doi: 10.1073/pnas.0135058100
48. Lanius RA, Brand B, Vermetten E, Frewen PA, Spiegel D. The dissociative subtype of posttraumatic stress disorder: rationale, clinical and neurobiological evidence, and implications. Depress Anxiety (2012) 29:701–8. doi: 10.1002/da.21889
49. Rinne-Albers MA, Pannekoek JN, van Hoof MJ, van Lang ND, Lamers-Winkelman F, Rombouts SA etal. Anterior cingulate cortex grey matter volume abnormalities in adolescents with PTSD after childhood sexual abuse. Eur Neuropsychopharmacol (2017) 27:1163–71. doi: 10.1016/j.euroneuro.2017.08.432
50. Sui SG, Wu MX, King ME, Zhang Y, Ling L, Xu JM etal. Abnormal grey matter in victims of rape with PTSD in Mainland China: a voxel-based morphometry study. Acta Neuropsychiatr (2010) 22:118–26. doi: 10.1111/j.1601-5215.2010.00459.x
51. Cauda F, Nani A, Costa T, Palermo S, Tatu K, Manuello J etal. The morphometric co-atrophy networking of schizophrenia, autistic and obsessive spectrum disorders. Human Brain Mapp. (2018) 39:1898–928. doi: 10.1002/hbm.23952
52. Fornito A, Zalesky A, Breakspear M. The connectomics of brain disorders. Neuroscience (2015) 16:159–72. doi: 10.1038/nrn3901
53. Cwik JC, Sartory G, Nuyken M, Schurholt B, Seitz RJ. Posterior and prefrontal contributions to the development posttraumatic stress disorder symptom severity: an fMRI study of symptom provocation in acute stress disorder. Eur Arch Psychiatry Clin Neurosci. (2016) 267:495–505. doi: 10.1007/s00406-016-0713-6
54. Tognoli E, Kelso JA. Enlarging the scope: grasping brain complexity. Front Syst Neurosci. (2014) 8:122. doi: 10.3389/fnsys.2014.00122
Keywords: posttraumatic stress disorder, resting-state fMRI, lag mapping, functional connectivity strength, dynamics
Citation: Weng Y, Qi R, Chen F, Ke J, Xu Q, Zhong Y, Chen L, Li J, Zhang Z, Zhang L and Lu G (2018) The Temporal Propagation of Intrinsic Brain Activity Associate With the Occurrence of PTSD. Front. Psychiatry 9:218. doi: 10.3389/fpsyt.2018.00218
Received: 08 January 2018; Accepted: 07 May 2018;
Published: 25 May 2018.
Edited by:
Fengyu Zhang, Global Clinical and Translational Research Institute, United StatesReviewed by:
Albert Yang, Harvard Medical School, United StatesMichael Czisch, Max-Planck-Institut für Psychiatrie, Germany
Copyright © 2018 Weng, Qi, Chen, Ke, Xu, Zhong, Chen, Li, Zhang, Zhang and Lu. This is an open-access article distributed under the terms of the Creative Commons Attribution License (CC BY). The use, distribution or reproduction in other forums is permitted, provided the original author(s) and the copyright owner are credited and that the original publication in this journal is cited, in accordance with accepted academic practice. No use, distribution or reproduction is permitted which does not comply with these terms.
*Correspondence: Zhiqiang Zhang, emhhbmd6cTIwMDFAMTI2LmNvbQ==
Li Zhang, emhhbmdsaS1tYWlsQDE2My5jb20=
Guangming Lu, Y2pyLmx1Z3VhbmdtaW5nQHZpcC4xNjMuY29t
†These authors have contributed equally to this work.